Grundlæggende statistik
| Institutionelle aktier (lange) | 98.785.105 - 98,21% (ex 13D/G) - change of -21,82MM shares -18,09% MRQ |
| Institutionel værdi (lang) | $ 13.169.269 USD ($1000) |
Institutionelt ejerskab og aktionærer
Neurocrine Biosciences, Inc. (US:NBIX) har 731 institutionelle ejere og aktionærer, der har indsendt 13D/G- eller 13F-formularer til Securities Exchange Commission (SEC). Disse institutioner har i alt 98,785,105 aktier. Største aktionærer omfatter BlackRock, Inc., Vanguard Group Inc, Dodge & Cox, Jpmorgan Chase & Co, State Street Corp, Aqr Capital Management Llc, Renaissance Technologies Llc, Geode Capital Management, Llc, Price T Rowe Associates Inc /md/, and Wellington Management Group Llp .
Neurocrine Biosciences, Inc. (NasdaqGS:NBIX) institutionel ejerskabsstruktur viser aktuelle positioner i virksomheden efter institutioner og fonde, samt seneste ændringer i positionsstørrelse. Større aktionærer kan omfatte individuelle investorer, investeringsforeninger, hedgefonde eller institutioner. Skema 13D angiver, at investoren besidder (eller besidder) mere end 5 % af virksomheden og har til hensigt (eller har til hensigt at) aktivt at forfølge en ændring i forretningsstrategi. Skema 13G indikerer en passiv investering på over 5%.
The share price as of April 24, 2026 is 127,68 / share. Previously, on April 28, 2025, the share price was 106,46 / share. This represents an increase of 19,93% over that period.

Fondens stemningsscore
Fund Sentiment Score (fka Ownership Accumulation Score) finder de aktier, der bliver mest købt af fonde. Det er resultatet af en sofistikeret, multi-faktor kvantitativ model, der identificerer virksomheder med de højeste niveauer af institutionel akkumulering. Scoringsmodellen bruger en kombination af den samlede stigning i oplyste ejere, ændringerne i porteføljeallokeringer i disse ejere og andre målinger. Tallet går fra 0 til 100, hvor højere tal indikerer et højere niveau af akkumulering for sine jævnaldrende, og 50 er gennemsnittet.
Opdateringsfrekvens: Dagligt
Se Ownership Explorer, som giver en liste over højest rangerende virksomheder.
AI+ Ask Fintel’s AI assistant about Neurocrine Biosciences, Inc..
Select a question to share a public post with an AI-crafted answer.
Thinking of good questions…
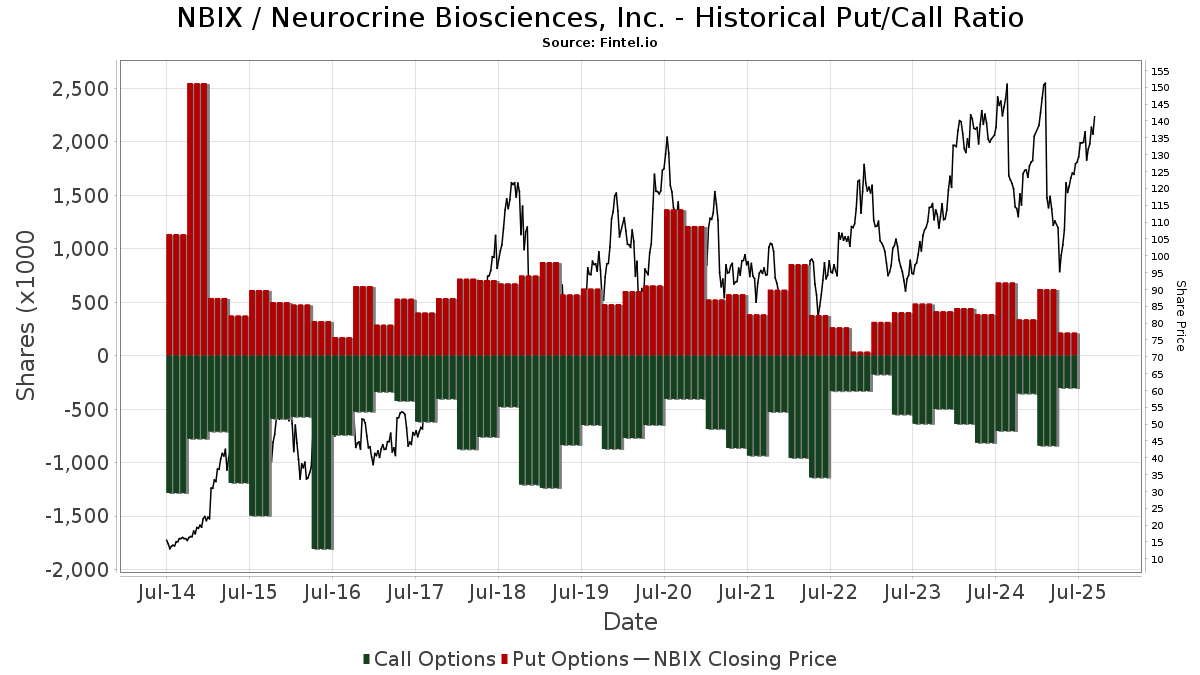
Institutionel Put/Call-forhold
Ud over at indberette standardaktie- og gældsudstedelser skal institutter med mere end 100 mill. aktiver under forvaltning også oplyse deres put- og call-optionsbeholdninger. Da salgsoptioner generelt indikerer negativ stemning, og købsoptioner indikerer positiv stemning, kan vi få en fornemmelse af den overordnede institutionelle stemning ved at plotte forholdet mellem put og kald. Diagrammet til højre viser det historiske put/call-forhold for dette instrument.
Brug af Put/Call Ratio som en indikator for investorernes stemning overvinder en af de vigtigste mangler ved at bruge totalt institutionelt ejerskab, som er, at en betydelig mængde af aktiver under forvaltning investeres passivt for at spore indekser. Passivt forvaltede fonde køber typisk ikke optioner, så indikatoren for put/call-forholdet følger mere nøje følelsen af aktivt forvaltede fonde.
13D/G-arkivering
Vi præsenterer 13D/G ansøgninger separat fra 13F ansøgninger på grund af den forskellige behandling af SEC. 13D/G-ansøgninger kan indgives af grupper af investorer (med én ledende), hvorimod 13F-ansøgninger ikke kan. Dette resulterer i situationer, hvor en investor kan indsende en 13D/G, der rapporterer én værdi for de samlede aktier (der repræsenterer alle de aktier, der ejes af investorgruppen), men derefter indsender en 13F, der rapporterer en anden værdi for de samlede aktier (der udelukkende repræsenterer deres egne) ejendomsret). Det betyder, at aktieejerskab af 13D/G-arkiver og 13F-arkiveringer ofte ikke er direkte sammenlignelige, så vi præsenterer dem separat.
Bemærk: Fra den 16. maj 2021 viser vi ikke længere ejere, der ikke har indsendt en 13D/G inden for det seneste år. Tidligere viste vi den fulde historie af 13D/G-arkiver. Generelt skal enheder, der er forpligtet til at indgive 13D/G-ansøgninger, indgive mindst årligt, før de indsender en afsluttende ansøgning. Dog forlader fonde nogle gange positioner uden at indsende en afsluttende ansøgning (dvs. de afvikler), så visning af den fulde historie resulterede nogle gange i forvirring om det nuværende ejerskab. For at undgå forvirring viser vi nu kun 'aktuelle' ejere - det vil sige - ejere, der har anmeldt inden for det seneste år.
Upgrade to unlock premium data.
| Fil dato | Form | Investor | Forrige Aktier |
Seneste Aktier |
Δ Aktier (Procent) |
Ejendomsret (Procent) |
Δ Ejerskab (Procent) |
|
|---|---|---|---|---|---|---|---|---|
| 2026-01-21 | JPMORGAN CHASE & CO | 5,198,084 | 5.20 | |||||
| 2025-05-14 | DODGE & COX | 5,534,624 | 5.60 | |||||
| 2025-04-28 | BlackRock, Inc. | 13,647,679 | 12,052,271 | -11.69 | 12.10 | -12.95 |
13F og NPORT arkivering
Detaljer om 13F-arkivering er gratis. Detaljer om NP-ansøgninger kræver et premium-medlemskab. Grønne rækker angiver nye positioner. Røde rækker angiver lukkede positioner. Klik på linket ikon for at se den fulde transaktionshistorik.
Opgrader
for at låse premium-data op og eksportere til Excel ![]() .
.
| Fil dato | Kilde | Investor | Type | Gennemsnitlig pris (Øst) |
Aktier | Δ Aktier (%) |
Rapporteret Værdi ($1000) |
Δ Værdi (%) |
Port Alloc (%) |
|
|---|---|---|---|---|---|---|---|---|---|---|
| 2026-02-10 | 13F | Triglav Skladi, D.o.o. | 10.000 | -9,09 | 1.418 | -8,16 | ||||
| 2026-02-06 | 13F | Fi3 FINANCIAL ADVISORS, LLC | 1.603 | 227 | ||||||
| 2026-02-13 | 13F | Aurora Investment Counsel | 10.815 | -0,21 | 1.534 | 0,79 | ||||
| 2026-02-10 | 13F | Eurizon Capital SGR S.p.A. | 9.282 | 1.315 | ||||||
| 2026-02-13 | 13F | Glen Eagle Advisors, LLC | 0 | -100,00 | 0 | |||||
| 2026-02-17 | 13F | Delaware Management Holdings, Inc. | 256.085 | 36.321 | ||||||
| 2026-02-03 | 13F | SBI Securities Co., Ltd. | 52 | -14,75 | 7 | -12,50 | ||||
| 2026-02-12 | 13F | Renaissance Technologies Llc | 2.238.797 | -7,42 | 317.529 | -6,47 | ||||
| 2026-02-12 | 13F | DJE Kapital AG | 200 | 28 | ||||||
| 2026-02-12 | 13F | M&G Plc | 91.599 | 9,46 | 13.007 | 11,02 | ||||
| 2026-02-13 | 13F | Ossiam | 1.338 | -39,21 | 190 | -38,64 | ||||
| 2026-02-17 | 13F | Wellington Management Group Llp | 1.744.560 | -3,71 | 247.431 | -2,71 | ||||
| 2026-02-13 | 13F | NLB Skladi, upravljanje premozenja, d.o.o. | 4.500 | 638 | ||||||
| 2026-04-16 | 13F | Capital Advisors, Ltd. LLC | 65 | 1.525,00 | 0 | |||||
| 2026-04-06 | 13F | Highline Wealth Partners Llc | 29 | 4 | ||||||
| 2026-02-06 | 13F | Global Retirement Partners, LLC | 2.407 | 1.267,61 | 341 | 1.320,83 | ||||
| 2026-02-11 | 13F | Havemeyer Place LP | 1.998 | 283 | ||||||
| 2026-02-13 | 13F | Caitong International Asset Management Co., Ltd | 278 | 39 | ||||||
| 2026-02-17 | 13F | Bank Of America Corp /de/ | Put | 0 | -100,00 | 0 | ||||
| 2026-01-27 | 13F | WealthCollab, LLC | 40 | 0,00 | 6 | 0,00 | ||||
| 2026-01-29 | 13F | Rakuten Securities, Inc. | 5 | -44,44 | 1 | -100,00 | ||||
| 2026-02-12 | 13F | EntryPoint Capital, LLC | 4.869 | 219,07 | 691 | 222,43 | ||||
| 2026-02-17 | 13F | Summit Global Investments | 24.804 | -31,40 | 4 | -40,00 | ||||
| 2026-02-13 | 13F | Prudential Financial Inc | 129.178 | 25,60 | 18.321 | 26,90 | ||||
| 2026-02-13 | 13F | Verition Fund Management LLC | 28.766 | -25,62 | 4.080 | -24,85 | ||||
| 2026-02-13 | 13F | Birchview Capital, LP | 27.190 | -5,23 | 3.856 | -4,25 | ||||
| 2025-11-14 | 13F | Atom Investors LP | 0 | -100,00 | 0 | -100,00 | ||||
| 2026-01-23 | 13F | Transcend Wealth Collective, Llc | 2.519 | 13,47 | 357 | 14,79 | ||||
| 2026-04-24 | 13F | Key FInancial Inc | 34 | 0,00 | 4 | 0,00 | ||||
| 2026-04-17 | 13F | Krilogy Financial LLC | 8.540 | -25,39 | 1.097 | -28,78 | ||||
| 2026-02-02 | 13F | Qrg Capital Management, Inc. | 16.214 | -16,56 | 2.300 | -15,69 | ||||
| 2026-01-23 | 13F | Optima Capital Llc | 8 | 1 | ||||||
| 2026-04-22 | 13F | Retirement Guys Formula Llc | 1.731 | 228 | ||||||
| 2026-04-24 | 13F | UMA Financial Services, Inc. | 487 | 0,00 | 64 | -7,25 | ||||
| 2026-02-02 | 13F | GenTrust, LLC | 1.760 | 250 | ||||||
| 2026-01-28 | 13F | WPG Advisers, LLC | 182 | -18,02 | 26 | -19,35 | ||||
| 2026-04-10 | 13F | Linden Thomas Advisory Services, LLC | 7.461 | 9,54 | 983 | 1,66 | ||||
| 2026-02-17 | 13F | Shelton Capital Management | 3.356 | -6,05 | 476 | -5,19 | ||||
| 2026-02-17 | 13F | Millennium Management Llc | 442.866 | -54,68 | 62.812 | -54,21 | ||||
| 2026-02-11 | 13F | Twin Tree Management, LP | Call | 100 | -98,73 | 14 | -98,74 | |||
| 2025-11-14 | 13F | Superstring Capital Management Lp | 0 | -100,00 | 0 | -100,00 | ||||
| 2026-02-11 | 13F | Twin Tree Management, LP | Put | 18.700 | 0,00 | 2.652 | 1,03 | |||
| 2026-01-22 | 13F | V-Square Quantitative Management LLC | 1.676 | 238 | ||||||
| 2026-02-11 | 13F | Twin Tree Management, LP | 6.341 | 31,83 | 899 | 33,19 | ||||
| 2026-01-27 | 13F | Zurcher Kantonalbank (Zurich Cantonalbank) | 97.450 | 44,65 | 13.821 | 46,15 | ||||
| 2026-02-12 | 13F | California Public Employees Retirement System | 196.821 | 1,37 | 27.915 | 2,42 | ||||
| 2026-04-15 | 13F | Exchange Traded Concepts, Llc | 3.882 | -12,47 | 511 | -18,76 | ||||
| 2026-02-04 | 13F | Oregon Public Employees Retirement Fund | 19.933 | 0,00 | 2.827 | 1,04 | ||||
| 2026-04-16 | 13F | BI Asset Management Fondsmaeglerselskab A/S | 4.497 | -42,37 | 1 | -100,00 | ||||
| 2026-02-13 | 13F | SYM FINANCIAL Corp | 2.039 | 15,98 | 289 | 17,48 | ||||
| 2026-02-13 | 13F | Victory Capital Management Inc | 124.560 | -0,23 | 17.666 | 0,80 | ||||
| 2025-11-14 | 13F | Logos Global Management LP | 0 | -100,00 | 0 | |||||
| 2026-02-12 | 13F | APG Asset Management US Inc. | 0 | -100,00 | 0 | |||||
| 2026-02-12 | 13F | ROSS\JOHNSON & Associates LLC | 4 | 1 | ||||||
| 2026-02-05 | 13F | Allworth Financial LP | 6.439 | 28,55 | 913 | 29,87 | ||||
| 2025-11-12 | 13F | Silverarc Capital Management, Llc | 0 | -100,00 | 0 | -100,00 | ||||
| 2026-02-09 | 13F | Sectoral Asset Management Inc | 2.675 | -9,63 | 379 | -8,67 | ||||
| 2026-02-12 | 13F | Graetz Wealth LLC | 1.637 | 232 | ||||||
| 2026-02-13 | 13F | De Burlo Group Inc | 4.667 | -2,10 | 662 | -1,20 | ||||
| 2026-02-17 | 13F | Tower Research Capital LLC (TRC) | 3.042 | -42,58 | 431 | -41,99 | ||||
| 2026-02-13 | 13F | Kestra Advisory Services, LLC | 373 | 53 | ||||||
| 2026-02-04 | 13F | Legacy Financial Advisors, Inc. | 1.603 | 227 | ||||||
| 2026-02-10 | 13F | Bank of New York Mellon Corp | 738.676 | -2,98 | 104.766 | -1,98 | ||||
| 2026-02-10 | 13F | Catalyst Capital Advisors LLC | 7.800 | 1.106 | ||||||
| 2026-02-17 | 13F | Caption Management, LLC | Put | 0 | -100,00 | 0 | ||||
| 2026-04-10 | 13F | Quaker Wealth Management, LLC | 4 | 0,00 | 1 | |||||
| 2026-04-14 | 13F | Wealthcare Advisory Partners LLC | 1.665 | 5,71 | 219 | -1,79 | ||||
| 2025-11-14 | 13F | Adage Capital Partners Gp, L.l.c. | 0 | -100,00 | 0 | -100,00 | ||||
| 2026-02-09 | 13F | Geode Capital Management, Llc | 2.059.282 | 1,70 | 291.342 | 2,77 | ||||
| 2026-02-13 | 13F | Brown Advisory Inc | 225.288 | -51,92 | 31.953 | -51,42 | ||||
| 2026-04-13 | 13F | IFP Advisors, Inc | 2.792 | -3,09 | 368 | -10,05 | ||||
| 2026-02-13 | 13F | Ieq Capital, Llc | 745.113 | 7,58 | 105.679 | 8,69 | ||||
| 2026-02-03 | 13F | We Are One Seven, LLC | 3.603 | 511 | ||||||
| 2026-04-13 | 13F | Robinhood Asset Management, LLC | 58.084 | 44,14 | 7.652 | 33,89 | ||||
| 2026-04-15 | 13F | Nations Financial Group Inc, /ia/ /adv | 2.508 | -0,79 | 330 | -7,82 | ||||
| 2026-02-13 | 13F | Golden State Wealth Management, LLC | 183 | 0,00 | 26 | 0,00 | ||||
| 2026-02-10 | 13F | Grandfield & Dodd, Llc | 16.629 | 0,02 | 2.358 | 1,07 | ||||
| 2026-02-09 | 13F | Keating Financial Advisory Services, Inc. | 73 | 10 | ||||||
| 2026-02-11 | 13F | Meeder Asset Management Inc | 233 | 651,61 | 33 | 725,00 | ||||
| 2026-02-02 | 13F | Advisors Preferred, LLC | 29.867 | 4.199 | ||||||
| 2025-11-14 | 13F | Cinctive Capital Management LP | 0 | -100,00 | 0 | -100,00 | ||||
| 2025-11-13 | 13F | UBS Group AG | Call | 0 | -100,00 | 0 | -100,00 | |||
| 2026-02-17 | 13F | Oxford Asset Management Llp | 2.101 | 298 | ||||||
| 2026-02-11 | 13F | Waddell & Associates, Llc | 3.245 | 46,11 | 460 | 47,91 | ||||
| 2026-02-24 | 13F | MidFirst Bank | 1.239 | 2 | ||||||
| 2026-01-21 | 13F | Greenleaf Trust | 1.475 | 209 | ||||||
| 2026-02-03 | 13F | International Assets Investment Management, Llc | 47 | -97,32 | 7 | -97,32 | ||||
| 2026-04-24 | 13F | Raiffeisen Bank International AG | 12.500 | -32,80 | 1.609 | -38,61 | ||||
| 2026-02-17 | 13F | ISAM Funds (UK) Ltd | 0 | -100,00 | 0 | |||||
| 2026-02-02 | 13F | Montag A & Associates Inc | 21 | 5,00 | 3 | 0,00 | ||||
| 2026-04-14 | 13F | Drive Wealth Management, Llc | 1.642 | 216 | ||||||
| 2026-04-22 | 13F | Gray Foundation | 37.800 | 0,00 | 4.980 | -7,13 | ||||
| 2026-02-11 | 13F | Clearbridge Investments, LLC | 310.077 | -7,97 | 43.978 | -7,02 | ||||
| 2026-02-12 | 13F | Brown Brothers Harriman & Co | 24 | 3 | ||||||
| 2026-02-13 | 13F | Resources Investment Advisors, LLC. | 3.881 | -8,38 | 550 | -7,41 | ||||
| 2026-02-18 | 13F | GWM Advisors LLC | 12.998 | 5,45 | 1.844 | 6,53 | ||||
| 2026-02-10 | 13F | Acadian Asset Management Llc | 249.154 | 531,25 | 35 | 600,00 | ||||
| 2026-02-19 | 13F | Atomi Financial Group, Inc. | 1.857 | 0,70 | 263 | 1,94 | ||||
| 2026-02-09 | 13F | Mediolanum International Funds Ltd | 51.406 | 1.423,59 | 7.246 | 1.431,71 | ||||
| 2026-01-30 | 13F | Turning Point Benefit Group, Inc. | 2 | 0,00 | 0 | |||||
| 2026-01-30 | 13F | American Capital Advisory, LLC | 1 | 0,00 | 0 | |||||
| 2026-04-16 | 13F | Beese Fulmer Investment Management, Inc. | 2.634 | 38,34 | 347 | 28,52 | ||||
| 2026-02-17 | 13F | Palo Alto Investors LP | 0 | -100,00 | 0 | |||||
| 2026-02-17 | 13F | RMB Capital Management, LLC | 4.234 | 601 | ||||||
| 2026-02-06 | 13F | HealthInvest Partners AB | 94.796 | -7,63 | 13.445 | 779,27 | ||||
| 2026-02-12 | 13F | New York State Common Retirement Fund | 174.774 | -0,46 | 24.788 | 0,57 | ||||
| 2026-04-21 | 13F | GHP Investment Advisors, Inc. | 21 | 5,00 | 3 | 0,00 | ||||
| 2026-02-12 | 13F | Federation des caisses Desjardins du Quebec | 104.107 | 0,61 | 14.765 | 1,65 | ||||
| 2026-02-10 | 13F | Sivia Capital Partners, LLC | 7.100 | 85,67 | 1.007 | 87,69 | ||||
| 2026-01-23 | 13F | Burney Co/ | 8.690 | -69,85 | 1.233 | -69,55 | ||||
| 2026-04-13 | 13F | Whalen Wealth Management Inc. | 6.462 | 26,09 | 851 | 17,22 | ||||
| 2026-02-17 | 13F | Holocene Advisors, LP | 0 | -100,00 | 0 | |||||
| 2026-04-21 | 13F | Pinnacle Associates Ltd | 0 | -100,00 | 0 | |||||
| 2026-02-17 | 13F | Integral Health Asset Management, LLC | 0 | -100,00 | 0 | -100,00 | ||||
| 2026-02-09 | 13F | Quest Partners LLC | 10.576 | -19,57 | 1.500 | -18,75 | ||||
| 2026-04-17 | 13F | CENTRAL TRUST Co | 38 | 0,00 | 5 | 0,00 | ||||
| 2026-02-13 | 13F | Korea Investment CORP | 88.589 | 23,57 | 12.565 | 24,85 | ||||
| 2026-04-21 | 13F | Nemes Rush Group LLC | 0 | -100,00 | 0 | |||||
| 2026-01-29 | 13F | Teachers Retirement System Of The State Of Kentucky | 28.840 | 0,00 | 4 | 0,00 | ||||
| 2026-02-17 | 13F | Parkman Healthcare Partners LLC | 114.712 | -19,12 | 16.270 | -18,28 | ||||
| 2026-02-17 | 13F | Jones Financial Companies Lllp | 820 | 16,48 | 116 | 17,17 | ||||
| 2026-02-11 | 13F | Picton Mahoney Asset Management | 9 | 0,00 | 1 | |||||
| 2026-02-17 | 13F | Magnetar Financial LLC | 29.192 | -14,32 | 4.140 | -13,43 | ||||
| 2026-02-04 | 13F | Virginia Retirement Systems Et Al | 147.623 | 49,99 | 20.937 | 51,54 | ||||
| 2026-02-11 | 13F | Fiera Capital Corp | 637.408 | 32,88 | 90.404 | 34,26 | ||||
| 2026-02-17 | 13F | Susquehanna Portfolio Strategies, LLC | 184.035 | 0,00 | 26.102 | 1,03 | ||||
| 2026-02-03 | 13F | Crossmark Global Holdings, Inc. | 8.367 | 6,48 | 1.187 | 7,52 | ||||
| 2026-02-09 | 13F | Coldstream Capital Management Inc | 4.232 | 3,47 | 600 | 4,53 | ||||
| 2026-04-15 | 13F | Gf Fund Management Co. Ltd. | 2.240 | 14,40 | 295 | 6,50 | ||||
| 2026-02-05 | 13F | Thrivent Financial For Lutherans | 90.318 | -84,20 | 13 | -85,00 | ||||
| 2026-02-17 | 13F | Woodline Partners LP | 72.298 | 10.254 | ||||||
| 2026-04-06 | 13F | GAMMA Investing LLC | 2.846 | -6,50 | 375 | -13,23 | ||||
| 2026-02-04 | 13F | C WorldWide Group Holding A/S | 125.000 | 0,00 | 18 | 0,00 | ||||
| 2026-02-17 | 13F | Signature Equity Partners, LLC | 10 | 1 | ||||||
| 2026-04-23 | 13F | waypoint wealth counsel | 2.869 | -13,06 | 378 | -19,44 | ||||
| 2026-01-29 | 13F | Vanguard Group Inc | 9.700.301 | -0,06 | 1.375.794 | 0,97 | ||||
| 2026-02-17 | 13F | Fred Alger Management, Llc | 1.985 | -6,46 | 282 | -5,39 | ||||
| 2026-02-10 | 13F | Fideuram Asset Management (Ireland) dac | 19 | 3 | ||||||
| 2026-02-17 | 13F | Brevan Howard Capital Management LP | 1.481 | -61,87 | 210 | -61,47 | ||||
| 2026-02-05 | 13F | Requisite Capital Management, LLC | 0 | -100,00 | 0 | |||||
| 2026-04-21 | 13F | Wesbanco Bank Inc | 17.000 | 0,00 | 2.240 | -7,13 | ||||
| 2026-02-17 | 13F | Rtw Investments, Lp | 1.062.072 | 0,00 | 150.634 | 1,03 | ||||
| 2026-02-06 | 13F | New Millennium Group LLC | 0 | -100,00 | 0 | |||||
| 2026-02-11 | 13F | Meeder Advisory Services, Inc. | 1.412 | 200 | ||||||
| 2026-04-17 | 13F | Paragon Capital Management Inc | 9.954 | 1.311 | ||||||
| 2026-02-10 | 13F/A | Suncoast Equity Management | 5.085 | 721 | ||||||
| 2026-02-17 | 13F | Citadel Advisors Llc | Call | 16.000 | -39,16 | 2.269 | -38,53 | |||
| 2025-11-14 | 13F | Axa S.a. | 0 | -100,00 | 0 | |||||
| 2026-02-17 | 13F | Citadel Advisors Llc | 79.711 | -89,95 | 11.305 | -89,85 | ||||
| 2026-02-17 | 13F | Citadel Advisors Llc | Put | 20.500 | 64,00 | 2.908 | 65,74 | |||
| 2026-04-23 | 13F | CWM Advisors, LLC | 2.555 | 9,19 | 337 | 1,51 | ||||
| 2026-02-17 | 13F | Peloton Wealth Strategists | 13.560 | -1,81 | 2 | 0,00 | ||||
| 2026-04-23 | 13F | Marquette Asset Management, LLC | 31 | 158,33 | 4 | 300,00 | ||||
| 2026-01-29 | 13F | Beirne Wealth Consulting Services, LLC | 0 | -100,00 | 0 | |||||
| 2026-02-12 | 13F | Rossby Financial, LCC | 27 | 58,82 | 4 | 50,00 | ||||
| 2026-02-11 | 13F | Cookson Peirce & Co Inc | 107.271 | 15.214 | ||||||
| 2026-02-10 | 13F | Principia Wealth Advisory, LLC | 1 | 0,00 | 0 | |||||
| 2026-02-13 | 13F | Greenline Wealth Management LLC | 89 | 13 | ||||||
| 2026-02-17 | 13F | Captrust Financial Advisors | 30.928 | 10,26 | 4.387 | 11,40 | ||||
| 2026-02-13 | 13F | Barclays Plc | 252.241 | -17,02 | 35.775 | -16,16 | ||||
| 2026-04-21 | 13F | Vise Technologies, Inc. | 1.412 | 0,00 | 200 | 0,00 | ||||
| 2026-02-17 | 13F | Toronto Dominion Bank | 15.883 | -1,34 | 2.253 | -0,31 | ||||
| 2026-02-12 | 13F | Federated Hermes, Inc. | 8.768 | -19,04 | 1.244 | -18,22 | ||||
| 2026-01-23 | 13F | Altfest L J & Co Inc | 2.835 | 8,00 | 402 | 9,24 | ||||
| 2026-02-11 | 13F | Franklin Resources Inc | 532.759 | -16,10 | 75.561 | -15,23 | ||||
| 2026-02-12 | 13F | Philadelphia Trust Co | 28.760 | -3,03 | 4 | 0,00 | ||||
| 2026-02-11 | 13F | Metis Global Partners, LLC | 2.241 | -4,43 | 318 | -3,65 | ||||
| 2026-04-14 | 13F | Banque Pictet & Cie Sa | 12.501 | 1.647 | ||||||
| 2026-02-03 | 13F | Sequoia Financial Advisors, LLC | 5.743 | 30,91 | 815 | 32,36 | ||||
| 2026-04-20 | 13F | Friedenthal Financial | 0 | -100,00 | 0 | |||||
| 2026-02-06 | 13F | Leonteq Securities AG | 406 | -15,42 | 58 | -14,93 | ||||
| 2025-11-14 | 13F | Quarry LP | 0 | -100,00 | 0 | |||||
| 2026-02-17 | 13F | Vinva Investment Management Ltd | 74.727 | 1.002,82 | 10.533 | 1.008,63 | ||||
| 2026-01-29 | 13F | Quent Capital, LLC | 245 | 6,06 | 35 | 6,25 | ||||
| 2026-02-04 | 13F | Swiss Life Asset Management Ltd | 18.749 | 5,53 | 2.659 | 6,62 | ||||
| 2026-02-04 | 13F | HighPoint Advisor Group LLC | 2.838 | 0,00 | 403 | 1,01 | ||||
| 2026-02-05 | 13F | Td Private Client Wealth Llc | 143 | 4,38 | 20 | 5,26 | ||||
| 2026-02-04 | 13F | Aubrey Capital Management Ltd | 5.313 | 42,86 | 749 | 43,76 | ||||
| 2026-02-10 | 13F | Peak Retirement Planning, Inc. | 19.617 | 33,35 | 2.782 | 34,72 | ||||
| 2026-02-10 | 13F | Westpac Banking Corp | 1.524 | -0,39 | 216 | 0,93 | ||||
| 2026-04-22 | 13F | Continuum Advisory, LLC | 44.068 | 3,57 | 5.806 | -3,81 | ||||
| 2026-02-13 | 13F | Dai-Ichi Life Insurance Company, Ltd | 12.978 | 0,00 | 1.841 | 1,04 | ||||
| 2026-04-10 | 13F | Perigon Wealth Management, LLC | 0 | -100,00 | 0 | |||||
| 2026-02-11 | 13F | Fjarde Ap-fonden /fourth Swedish National Pension Fund | 35.223 | 4.996 | ||||||
| 2026-02-17 | 13F | Gotham Asset Management, LLC | 168.572 | 23,63 | 23.909 | 24,90 | ||||
| 2026-02-11 | 13F | Empowered Funds, LLC | 4.366 | -76,81 | 619 | -76,57 | ||||
| 2026-01-29 | 13F | State Of Michigan Retirement System | 23.581 | 0,00 | 3.344 | 1,03 | ||||
| 2026-01-28 | 13F | Klp Kapitalforvaltning As | 37.100 | 1,09 | 5.262 | 2,14 | ||||
| 2026-02-06 | 13F | Envestnet Portfolio Solutions, Inc. | 3.692 | -0,24 | 524 | 0,77 | ||||
| 2026-04-24 | 13F | Root Financial Partners, LLC | 1.154 | 479,90 | 152 | 442,86 | ||||
| 2026-01-12 | 13F | Daymark Wealth Partners, Llc | 1.781 | -6,66 | 253 | -5,62 | ||||
| 2026-04-24 | 13F | Oakworth Capital, Inc. | 371 | -86,18 | 49 | -87,37 | ||||
| 2026-02-17 | 13F | Tcw Group Inc | 1.823 | 259 | ||||||
| 2026-01-30 | 13F | Shaker Investments Llc/oh | 0 | -100,00 | 0 | |||||
| 2026-02-13 | 13F | SRS Capital Advisors, Inc. | 381 | -99,06 | 54 | -99,05 | ||||
| 2026-04-13 | 13F | True Wealth Design, LLC | 1.235 | 27,98 | 163 | 19,12 | ||||
| 2025-10-30 | 13F | Traub Capital Management LLC | 0 | -100,00 | 0 | -100,00 | ||||
| 2026-04-24 | 13F | Strs Ohio | 12.316 | 430,86 | 1.623 | 393,01 | ||||
| 2026-02-11 | 13F | Jpmorgan Chase & Co | 5.200.356 | 9,94 | 737.567 | 11,08 | ||||
| 2026-02-11 | 13F | Jpmorgan Chase & Co | Call | 30.000 | 4.255 | |||||
| 2026-02-11 | 13F | Jpmorgan Chase & Co | Put | 30.000 | 4.255 | |||||
| 2026-02-17 | 13F | PFM Health Sciences, LP | 163.197 | 185,08 | 23.146 | 188,03 | ||||
| 2026-04-09 | 13F | Generali Investments, Management Co LLC | 8.882 | -0,28 | 1.170 | -7,36 | ||||
| 2026-02-09 | 13F | Fisher Asset Management, LLC | 112.242 | 18,40 | 15.919 | 19,63 | ||||
| 2026-02-09 | 13F | Thrive Capital Management, LLC | 23.880 | 46,35 | 3.387 | 47,86 | ||||
| 2026-02-12 | 13F | Advisors Asset Management, Inc. | 23.187 | -25,55 | 3.289 | -24,78 | ||||
| 2026-02-13 | 13F | Candriam Luxembourg S.C.A. | 293.096 | 1,90 | 41.572 | 2,95 | ||||
| 2026-02-17 | 13F | Warren Averett Asset Management, LLC | 4.473 | 27,04 | 634 | 28,34 | ||||
| 2026-02-17 | 13F | Voleon Capital Management Lp | 6.501 | -64,46 | 922 | -64,08 | ||||
| 2026-02-13 | 13F | AlTi Global, Inc. | 6.826 | -0,03 | 968 | 1,04 | ||||
| 2026-02-17 | 13F | NEOS Investment Management LLC | 3.548 | -3,01 | 503 | -1,95 | ||||
| 2026-02-12 | 13F | Skandinaviska Enskilda Banken AB (publ) | 58.503 | -4,28 | 8.298 | -3,25 | ||||
| 2026-02-12 | 13F | Loomis Sayles & Co L P | 169.220 | 5,23 | 24.000 | 6,31 | ||||
| 2026-02-17 | 13F | EFG International AG | 3.915 | 555 | ||||||
| 2026-02-11 | 13F | CLARET ASSET MANAGEMENT Corp | 1.931 | 5,63 | 0 | |||||
| 2025-11-14 | 13F | Binnacle Investments Inc | 56 | 0,00 | 8 | 0,00 | ||||
| 2026-01-27 | 13F | Regions Financial Corp | 2.827 | 9,19 | 401 | 10,19 | ||||
| 2026-02-03 | 13F | Bokf, Na | 2.166 | -16,69 | 307 | -15,66 | ||||
| 2026-02-11 | 13F | Prudential Plc | 4.134 | 2,43 | 586 | 3,53 | ||||
| 2026-02-17 | 13F | Wiley Bros.-aintree Capital, Llc | 1.812 | 7,41 | 257 | 8,90 | ||||
| 2026-02-06 | 13F | Profund Advisors Llc | 15.700 | 11,59 | 2.227 | 12,71 | ||||
| 2026-02-10 | 13F | Nomura Asset Management Co Ltd | 48.723 | 0,00 | 6.910 | 1,04 | ||||
| 2026-02-17 | 13F | Nomura Holdings Inc | 7.510 | -17,93 | 1.065 | -17,06 | ||||
| 2026-02-17 | 13F | Trexquant Investment LP | 137.186 | 332,15 | 19.457 | 336,65 | ||||
| 2026-04-24 | 13F | Yousif Capital Management, Llc | 30.697 | -4,21 | 4.044 | -6,19 | ||||
| 2026-04-10 | 13F | Pure Financial Advisors, Inc. | 2.535 | 334 | ||||||
| 2026-01-29 | 13F | Munich Reinsurance Co Stock Corp in Munich | 24.821 | 69,39 | 3.499 | 70,14 | ||||
| 2026-02-06 | 13F | Pnc Financial Services Group, Inc. | 5.016 | 5,20 | 711 | 6,28 | ||||
| 2026-02-13 | 13F | Ostrum Asset Management | 4.326 | -24,88 | 614 | -24,13 | ||||
| 2026-02-11 | 13F | Deutsche Bank Ag\ | 367.944 | -18,38 | 52.185 | -17,54 | ||||
| 2026-02-13 | 13F | Martingale Asset Management L P | 1.676 | 238 | ||||||
| 2026-02-02 | 13F | Hussman Strategic Advisors, Inc. | 21.000 | 0,00 | 2.978 | 1,05 | ||||
| 2026-02-13 | 13F | Parkside Financial Bank & Trust | 204 | 25,93 | 29 | 27,27 | ||||
| 2025-11-14 | 13F | Bayesian Capital Management, LP | 0 | -100,00 | 0 | -100,00 | ||||
| 2026-02-12 | 13F | UniSuper Management Pty Ltd | 1.700 | 0,00 | 241 | 1,26 | ||||
| 2026-01-15 | 13F | Nilsine Partners, LLC | 8.437 | 1.197 | ||||||
| 2026-02-11 | 13F | Inceptionr Llc | 5.724 | 812 | ||||||
| 2026-04-20 | 13F | State of Alaska, Department of Revenue | 9.980 | 0,15 | 1 | 0,00 | ||||
| 2026-02-12 | 13F | APG Asset Management N.V. | 59.288 | -2,82 | 7.160 | -1,77 | ||||
| 2026-02-13 | 13F | Cetera Trust Company, N.A | 2.430 | 0,00 | 345 | 0,88 | ||||
| 2026-04-14 | 13F | Prospera Financial Services Inc | 0 | -100,00 | 0 | |||||
| 2026-02-10 | 13F | Close Asset Management Ltd | 268 | 0,00 | 0 | |||||
| 2026-01-20 | 13F | Savvy Advisors, Inc. | 2.374 | 37,70 | 337 | 38,84 | ||||
| 2026-04-17 | 13F | PSP Research LLC | 3.848 | 3,05 | 507 | -4,35 | ||||
| 2026-01-29 | 13F | Comerica Bank | 27.450 | -7,24 | 3.893 | -6,28 | ||||
| 2026-02-10 | 13F | AdvisorShares Investments LLC | 5.901 | 18,68 | 837 | 19,94 | ||||
| 2026-02-12 | 13F | Marex Group plc | 4.152 | 113,69 | 589 | 116,18 | ||||
| 2026-02-13 | 13F | Smartleaf Asset Management LLC | 678 | 59,91 | 96 | 61,02 | ||||
| 2026-02-13 | 13F | Virtus ETF Advisers LLC | 2.584 | 0,00 | 366 | 1,10 | ||||
| 2026-02-17 | 13F | Nissay Asset Management Corp /japan/ /adv | 12.392 | 0,62 | 1.758 | 1,68 | ||||
| 2026-02-17 | 13F | Polymer Capital Management (US) LLC | 6.868 | 974 | ||||||
| 2026-04-15 | 13F | Activest Wealth Management | 183 | 6,40 | 24 | 0,00 | ||||
| 2026-02-06 | 13F | Resona Asset Management Co.,Ltd. | 48.406 | -1,85 | 6.874 | -0,71 | ||||
| 2026-02-17 | 13F | Snowden Capital Advisors LLC | 5.351 | -6,86 | 759 | -5,96 | ||||
| 2026-02-10 | 13F | Envestnet Asset Management Inc | 206.731 | 1,92 | 29.321 | 2,97 | ||||
| 2026-02-11 | 13F | Fox Run Management, L.l.c. | 11.320 | 14,49 | 1.606 | 15,72 | ||||
| 2026-02-11 | 13F | O'shaughnessy Asset Management, Llc | 5.141 | 11,88 | 729 | 13,02 | ||||
| 2026-02-13 | 13F | Public Employees Retirement Association Of Colorado | 9.976 | 0,00 | 1 | 0,00 | ||||
| 2026-02-17 | 13F | SIH Partners, LLLP | 3.083 | 0,00 | 437 | 1,16 | ||||
| 2025-11-14 | 13F | Point72 Hong Kong Ltd | 2.019 | 283 | ||||||
| 2026-02-17 | 13F | Zurich Insurance Group Ltd/FI | 459.437 | 65.162 | ||||||
| 2026-02-03 | 13F | Allegiance Financial Group Advisory Services LLC | 2.272 | 27,35 | 322 | 28,80 | ||||
| 2026-02-12 | 13F | Ensign Peak Advisors, Inc | 167.307 | -7,27 | 23.729 | -6,31 | ||||
| 2026-02-17 | 13F | Mercer Global Advisors Inc /adv | 40.957 | 29,60 | 5.809 | 30,93 | ||||
| 2026-01-28 | 13F | Universal- Beteiligungs- und Servicegesellschaft mbH | 65.027 | 12,42 | 9.218 | 13,51 | ||||
| 2026-02-17 | 13F | Russell Investments Group, Ltd. | 124.803 | 11,51 | 17.690 | 12,59 | ||||
| 2026-02-17 | 13F | Guggenheim Capital Llc | 24.043 | 7,87 | 3.410 | 9,02 | ||||
| 2026-02-18 | 13F | Mackenzie Financial Corp | 76.840 | -9,47 | 10.809 | -9,27 | ||||
| 2025-11-14 | 13F | Wolverine Trading, Llc | Call | 6.300 | -12,50 | 884 | -2,21 | |||
| 2026-04-22 | 13F | Bravera Wealth | 84 | 11 | ||||||
| 2026-01-27 | 13F | Belpointe Asset Management LLC | 9.485 | 1.345 | ||||||
| 2026-02-05 | 13F | PAX Financial Group, LLC | 3.335 | -25,52 | 473 | -24,68 | ||||
| 2026-02-17 | 13F | Millennium Management Llc | Put | 0 | -100,00 | 0 | ||||
| 2026-02-13 | 13F | JustInvest LLC | 11.238 | 1,13 | 1.594 | 2,18 | ||||
| 2026-02-17 | 13F | Glenmede Trust Co Na | 81.701 | -47,23 | 11.588 | -32,33 | ||||
| 2026-04-14 | 13F | Nbc Securities, Inc. | 23 | 0,00 | 3 | 0,00 | ||||
| 2026-02-17 | 13F | Price T Rowe Associates Inc /md/ | 1.872.240 | -34,69 | 266 | -34,08 | ||||
| 2026-04-20 | 13F | Assenagon Asset Management S.A. | 91.478 | 14,33 | 12.051 | 6,19 | ||||
| 2026-02-17 | 13F | Lazard Asset Management Llc | 64.925 | 58,83 | 9.208 | 60,47 | ||||
| 2026-02-17 | 13F | DAFNA Capital Management LLC | 70.615 | 0,00 | 10.015 | 1,04 | ||||
| 2026-02-10 | 13F | Goldman Sachs Group Inc | Put | 2.500 | 0,00 | 355 | 1,14 | |||
| 2026-02-18 | 13F | State of Tennessee, Treasury Department | 33.807 | -4,11 | 4.600 | -7,07 | ||||
| 2026-02-17 | 13F | Persistent Asset Partners Ltd | 0 | -100,00 | 0 | |||||
| 2026-02-10 | 13F | Goldman Sachs Group Inc | 364.532 | -40,20 | 51.702 | -39,59 | ||||
| 2026-02-10 | 13F | Norges Bank | 1.146.896 | 162.664 | ||||||
| 2026-01-21 | 13F | Azzad Asset Management Inc /adv | 9.011 | 0,73 | 1.278 | 1,83 | ||||
| 2026-02-05 | 13F | Roberts Glore & Co Inc /il/ | 1.492 | 0,00 | 212 | 0,96 | ||||
| 2026-02-06 | 13F | Handelsbanken Fonder AB | 200.867 | 83,50 | 28 | 86,67 | ||||
| 2026-02-10 | 13F | State of Wyoming | 2.797 | -6,36 | 397 | -5,49 | ||||
| 2026-01-14 | 13F | Eastern Bank | 0 | -100,00 | 0 | |||||
| 2026-02-06 | 13F | Bare Financial Services, Inc | 36 | 2,86 | 5 | 25,00 | ||||
| 2026-02-17 | 13F | Maryland State Retirement & Pension System | 4.661 | 0,00 | 661 | 1,07 | ||||
| 2026-02-10 | 13F | Globeflex Capital L P | 29.514 | 0,00 | 4.186 | 1,01 | ||||
| 2026-02-13 | 13F | Ubs Asset Management Americas Inc | 722.476 | -5,59 | 102.469 | -4,61 | ||||
| 2026-04-22 | 13F | Braun Stacey Associates Inc | 0 | -100,00 | 0 | |||||
| 2026-04-23 | 13F | Farmers & Merchants Investments Inc | 90 | 0,00 | 12 | -8,33 | ||||
| 2025-11-13 | 13F | Crewe Advisors LLC | 0 | -100,00 | 0 | |||||
| 2026-01-27 | 13F | First Horizon Corp | 111 | 35,37 | 16 | 36,36 | ||||
| 2026-02-17 | 13F | Dark Forest Capital Management Lp | 10.248 | 1.453 | ||||||
| 2026-02-17 | 13F | Hood River Capital Management LLC | 389.297 | -22,37 | 55.214 | -21,57 | ||||
| 2026-04-02 | 13F | Ares Financial Consulting, LLC | 24 | 0,00 | 3 | 0,00 | ||||
| 2026-02-13 | 13F | Morgan Stanley | 1.209.378 | -33,80 | 171.527 | -33,12 | ||||
| 2026-04-20 | 13F | Louisiana State Employees Retirement System | 29.100 | 5,43 | 3.834 | -2,07 | ||||
| 2026-02-17 | 13F | Canada Pension Plan Investment Board | 26.800 | 3.801 | ||||||
| 2026-01-23 | 13F | Sumitomo Mitsui Trust Holdings, Inc. | 202.666 | -8,42 | 28.744 | -7,47 | ||||
| 2026-04-24 | 13F | IFM Investors Pty Ltd | 21.155 | -0,76 | 2.787 | 92.766,67 | ||||
| 2026-04-23 | 13F | Private Wealth Management Group, LLC | 83 | 0,00 | 11 | -9,09 | ||||
| 2026-01-30 | 13F | Archer Investment Corp | 10 | 0,00 | 1 | 0,00 | ||||
| 2026-01-28 | 13F | Teacher Retirement System Of Texas | 16.070 | -37,11 | 2.279 | -36,47 | ||||
| 2026-02-11 | 13F | Vestcor Inc | 24.424 | 7,39 | 3 | 0,00 | ||||
| 2026-02-23 | 13F | Virtu Financial LLC | 15.389 | 775,87 | 2 | |||||
| 2026-02-13 | 13F | Great West Life Assurance Co /can/ | 72.023 | -1,32 | 10 | 0,00 | ||||
| 2026-02-13 | 13F | Panagora Asset Management Inc | 0 | -100,00 | 0 | |||||
| 2026-04-09 | 13F | Red Spruce Capital, LLC | 17.209 | 0,31 | 2.267 | -6,82 | ||||
| 2026-02-05 | 13F | Northwestern Mutual Investment Management Company, Llc | 22.308 | 0,91 | 3.164 | 1,93 | ||||
| 2026-02-17 | 13F | Freestone Grove Partners LP | 140.529 | 6,19 | 19.931 | 7,29 | ||||
| 2026-02-05 | 13F | Navalign, LLC | 3.609 | 0,00 | 512 | 0,99 | ||||
| 2026-02-09 | 13F | Frazier Financial Advisors, LLC | 70 | 0,00 | 10 | 0,00 | ||||
| 2026-04-20 | 13F | Jfs Wealth Advisors, Llc | 50 | 6,38 | 7 | 0,00 | ||||
| 2026-01-30 | 13F | AMG National Trust Bank | 12.326 | 1.748 | ||||||
| 2026-02-17 | 13F | Iron Triangle Partners LP | 0 | -100,00 | 0 | |||||
| 2026-02-13 | 13F/A | Ontario Teachers Pension Plan Board | 0 | -100,00 | 0 | -100,00 | ||||
| 2026-02-13 | 13F | BNP Paribas Asset Management Holding S.A. | 1.395.902 | 47,24 | 198 | 48,12 | ||||
| 2026-04-24 | 13F | Raiffeisen Bank International AG | Call | 400 | 0,00 | 53 | 10,64 | |||
| 2026-01-29 | 13F | IMC-Chicago, LLC | Put | 10.100 | 1.432 | |||||
| 2026-02-12 | 13F | State Board Of Administration Of Florida Retirement System | 86.891 | -5,98 | 12.324 | -5,01 | ||||
| 2026-02-12 | 13F | Xponance, Inc. | 25.010 | -5,22 | 3.547 | -4,24 | ||||
| 2026-02-13 | 13F | First Turn Management, LLC | 0 | -100,00 | 0 | |||||
| 2026-02-05 | 13F | Mission Wealth Management, Lp | 2.176 | 9,68 | 309 | 10,79 | ||||
| 2026-02-09 | 13F/A | Swedbank AB | 584.129 | 6,72 | 82.847 | 7,83 | ||||
| 2026-02-17 | 13F | Sarissa Capital Management LP | 303.151 | 0,00 | 42.996 | 1,03 | ||||
| 2026-04-15 | 13F | Avanza Fonder AB | 0 | -100,00 | 0 | |||||
| 2026-02-06 | 13F | ProShare Advisors LLC | 8.394 | 8,30 | 1.191 | 9,38 | ||||
| 2026-02-13 | 13F | Integrated Wealth Concepts LLC | 6.659 | -18,28 | 944 | -17,41 | ||||
| 2026-02-17 | 13F | Ikarian Capital, LLC | Call | 51.000 | 7.233 | |||||
| 2026-02-17 | 13F | Ikarian Capital, LLC | 54.062 | 7.668 | ||||||
| 2026-04-21 | 13F | Ground Swell Capital, LLC | 3.767 | 496 | ||||||
| 2026-02-05 | 13F | Amalgamated Bank | 46.774 | -2,37 | 7 | 0,00 | ||||
| 2026-02-13 | 13F | Y-Intercept (Hong Kong) Ltd | 44.837 | 300,94 | 6.359 | 305,29 | ||||
| 2026-04-15 | 13F | Financial Management Professionals, Inc. | 0 | -100,00 | 0 | |||||
| 2026-02-11 | 13F | Financiere des Professionnels - Fonds d,investissement inc. | 10.997 | 24,05 | 1.560 | 25,32 | ||||
| 2026-02-12 | 13F | Jane Street Group, Llc | Put | 150.000 | 148,76 | 21.274 | 151,35 | |||
| 2026-01-16 | 13F | Crowley Wealth Management, Inc. | 0 | -100,00 | 0 | |||||
| 2026-02-12 | 13F | Jane Street Group, Llc | Call | 83.100 | 520,15 | 11.786 | 526,58 | |||
| 2026-02-10 | 13F | Main Management ETF Advisors, LLC | 7.830 | 1,03 | 1 | 0,00 | ||||
| 2026-04-17 | 13F | BAM Wealth Management, LLC | 2.385 | 1,79 | 314 | -5,42 | ||||
| 2026-04-13 | 13F | Wolff Wiese Magana Llc | 831 | 0,00 | 109 | -6,84 | ||||
| 2026-04-07 | 13F | Central Pacific Bank - Trust Division | 1.675 | -2,90 | 221 | -9,84 | ||||
| 2026-01-08 | 13F | Sound View Wealth Advisors Group, LLC | 5.243 | 0,52 | 744 | 1,50 | ||||
| 2026-02-03 | 13F | Mitsubishi UFJ Kokusai Asset Management Co., Ltd. | 100.222 | 10,58 | 14.091 | 10,75 | ||||
| 2026-02-13 | 13F | Motiv8 Investments LLC | 39 | 0 | ||||||
| 2026-04-13 | 13F | Mather Group, Llc. | 158 | 21 | ||||||
| 2026-02-17 | 13F | Laird Norton Trust Company, Llc | 3.482 | 494 | ||||||
| 2026-03-04 | 13F | SHP Wealth Management | 3 | 0 | ||||||
| 2026-02-06 | 13F | Tortoise Investment Management, LLC | 0 | -100,00 | 0 | |||||
| 2025-11-21 | 13F/A | CIBC Bancorp USA Inc. | 3.548 | 498 | ||||||
| 2026-04-07 | 13F | Retirement Wealth Solutions LLC | 34 | 21,43 | 4 | 33,33 | ||||
| 2026-02-17 | 13F | Algert Global Llc | 19.960 | 742,19 | 3 | |||||
| 2026-02-11 | 13F | Allianz Asset Management GmbH | 16.086 | 7,47 | 2.281 | 8,57 | ||||
| 2026-02-13 | 13F | Marshall Wace, Llp | 0 | -100,00 | 0 | |||||
| 2026-02-09 | 13F | Genus Capital Management Inc. | 26.990 | 3.828 | ||||||
| 2026-02-09 | 13F | Huntington National Bank | 678 | 12,62 | 96 | 14,29 | ||||
| 2026-02-13 | 13F | Walleye Trading LLC | Put | 3.700 | 525 | |||||
| 2026-02-17 | 13F | Jump Financial, LLC | 6.824 | 276,39 | 968 | 280,71 | ||||
| 2026-02-13 | 13F | Walleye Trading LLC | Call | 100 | 14 | |||||
| 2026-01-29 | 13F | Impax Asset Management Group plc | 75.000 | 0,00 | 10.637 | 1,04 | ||||
| 2026-02-13 | 13F | Walleye Trading LLC | 500 | 71 | ||||||
| 2026-02-17 | 13F | Utah Retirement Systems | 15.981 | 0,00 | 2.267 | 1,03 | ||||
| 2026-04-15 | 13F | Journey Strategic Wealth Llc | 2.355 | 24,54 | 310 | 15,67 | ||||
| 2026-02-06 | 13F | EverSource Wealth Advisors, LLC | 4.355 | 18,18 | 618 | 19,34 | ||||
| 2026-01-12 | 13F | Rialto Wealth Management, LLC | 6 | 20,00 | 1 | |||||
| 2026-01-26 | 13F | Mirae Asset Global Investments Co., Ltd. | 16.716 | 13,55 | 2.371 | 14,71 | ||||
| 2025-11-14 | 13F | Point72 Europe (London) LLP | 51.280 | 7.199 | ||||||
| 2026-02-23 | 13F | Mv Capital Management, Inc. | 17 | 0,00 | 2 | 0,00 | ||||
| 2026-02-10 | 13F/A | Northwestern Mutual Wealth Management Co | 202 | -2,42 | 29 | -3,45 | ||||
| 2026-02-11 | 13F | Simplex Trading, Llc | Put | 12.600 | 103,23 | 1.787 | ||||
| 2026-02-11 | 13F | Simplex Trading, Llc | 5.837 | 101,41 | 828 | |||||
| 2026-02-12 | 13F | Cloud Capital Management, LLC | 0 | -100,00 | 0 | |||||
| 2026-02-17 | 13F | Driehaus Capital Management Llc | 145.561 | 38,68 | 20.645 | 40,11 | ||||
| 2026-02-11 | 13F | Simplex Trading, Llc | Call | 500 | -88,89 | 71 | ||||
| 2025-11-14 | 13F | Full Sail Capital, LLC | 2.572 | 361 | ||||||
| 2026-04-23 | 13F | Oppenheimer Asset Management Inc. | 14.313 | -0,69 | 1.886 | -7,78 | ||||
| 2026-02-04 | 13F | Pier 88 Investment Partners Llc | 7.560 | 15,42 | 1.072 | 16,65 | ||||
| 2026-02-13 | 13F | Colony Group, LLC | 69.934 | 6,25 | 9.919 | 7,36 | ||||
| 2026-04-06 | 13F | Versant Capital Management, Inc | 563 | 8,06 | 74 | 1,37 | ||||
| 2026-04-17 | 13F | Webster Bank, N. A. | 32 | 0,00 | 4 | 0,00 | ||||
| 2026-04-13 | 13F | Trust Co | 3 | 0,00 | 0 | |||||
| 2026-01-28 | 13F | Oversea-Chinese Banking CORP Ltd | 1.676 | 0,00 | 238 | 0,85 | ||||
| 2025-11-14 | 13F | AXA Investment Managers S.A. | 323.896 | 45.469 | ||||||
| 2026-02-12 | 13F | Cibc World Markets Corp | 3.441 | -16,48 | 488 | -5,61 | ||||
| 2026-04-22 | 13F | Spire Wealth Management | 39 | 0,00 | 5 | 0,00 | ||||
| 2026-02-11 | 13F | Cerity Partners LLC | 133.759 | 29,08 | 18.971 | 30,42 | ||||
| 2026-02-09 | 13F | Atlantic Trust, LLC | 23 | 3 | ||||||
| 2026-04-20 | 13F | Sowell Financial Services LLC | 5.182 | 6,71 | 683 | -0,87 | ||||
| 2026-02-10 | 13F | Savant Capital, LLC | 2.571 | 2,96 | 365 | 4,00 | ||||
| 2026-02-17 | 13F | Credit Agricole S A | 8.814 | 15,81 | 1.250 | 17,04 | ||||
| 2026-02-06 | 13F | Kingdom Financial Group LLC. | 971 | 138 | ||||||
| 2026-02-13 | 13F | 17 Capital Partners, Llc | 4.335 | 21,60 | 615 | 22,80 | ||||
| 2026-02-13 | 13F | Toroso Investments, LLC | 11.345 | 46,71 | 1.609 | 48,29 | ||||
| 2026-02-17 | 13F | Css Llc/il | 1.620 | 230 | ||||||
| 2026-02-13 | 13F | Seneschal Advisors, LLC | 2 | 0,00 | 0 | |||||
| 2026-02-17 | 13F | Susquehanna International Group, Llp | 97.713 | 1.995,95 | 13.859 | 2.018,96 | ||||
| 2026-02-17 | 13F | Susquehanna International Group, Llp | Put | 222.400 | 29,08 | 31.543 | 30,41 | |||
| 2026-02-17 | 13F | Man Group plc | 231.210 | 186,04 | 32.793 | 188,99 | ||||
| 2026-02-17 | 13F | Creative Planning | 53.266 | 64,07 | 7.555 | 65,77 | ||||
| 2026-02-12 | 13F | Quadrant Capital Group Llc | 8.278 | 0,24 | 1.174 | 1,29 | ||||
| 2026-02-06 | 13F | Vestmark Advisory Solutions, Inc. | 4.530 | 642 | ||||||
| 2026-02-13 | 13F | Rhumbline Advisers | 297.444 | -2,00 | 42.186 | -0,99 | ||||
| 2026-02-13 | 13F | Entropy Technologies, LP | 22.523 | 3.194 | ||||||
| 2026-01-30 | 13F | State of New Jersey Common Pension Fund D | 33.930 | -2,68 | 4.812 | -1,68 | ||||
| 2026-02-17 | 13F | Susquehanna International Group, Llp | Call | 26.900 | -81,46 | 3.815 | -81,27 | |||
| 2026-02-13 | 13F | Neuberger Berman Group LLC | 11.159 | 5,74 | 1.583 | 6,82 | ||||
| 2026-02-13 | 13F | Bridgewater Associates, LP | 149.990 | 551,05 | 21.273 | 557,79 | ||||
| 2025-11-14 | 13F | J. Goldman & Co LP | Put | 0 | -100,00 | 0 | -100,00 | |||
| 2025-11-03 | 13F | EFG Asset Management (North America) Corp. | 9.305 | -16,73 | 1.305 | -7,05 | ||||
| 2026-02-09 | 13F | Harbour Investments, Inc. | 80 | -28,57 | 11 | -26,67 | ||||
| 2026-02-11 | 13F | Rise Advisors, LLC | 0 | -100,00 | 0 | |||||
| 2026-02-18 | 13F | EP Wealth Advisors, Inc. | 2.949 | 418 | ||||||
| 2026-02-02 | 13F | Danske Bank A/s | 47.216 | 8,75 | 6.697 | 9,88 | ||||
| 2025-10-31 | 13F | Symphony Financial, Ltd. Co. | 0 | -100,00 | 0 | -100,00 | ||||
| 2026-02-11 | 13F | Buckingham Strategic Partners | 14.544 | 9,66 | 2.063 | 6,07 | ||||
| 2026-02-03 | 13F | Generali Asset Management SPA SGR | 22.703 | -13,87 | 3.220 | -13,00 | ||||
| 2026-04-17 | 13F | AdvisorNet Financial, Inc | 7 | -36,36 | 1 | -100,00 | ||||
| 2026-02-13 | 13F | Rafferty Asset Management, LLC | 39.055 | -33,47 | 5.539 | -32,78 | ||||
| 2026-01-26 | 13F | Cordatus Wealth Management LLC | 2.583 | 0,19 | 366 | 1,39 | ||||
| 2026-04-15 | 13F | Merit Financial Group, LLC | 21.392 | 22,02 | 2.818 | 13,35 | ||||
| 2026-02-11 | 13F | Zions Bancorporation, National Association /ut/ | 8 | 1 | ||||||
| 2026-04-21 | 13F | Pallas Capital Advisors LLC | 12.133 | -27,71 | 1.598 | -32,86 | ||||
| 2025-11-14 | 13F | Point72 (DIFC) Ltd | 895 | 126 | ||||||
| 2026-02-13 | 13F | Schroder Investment Management Group | 87.026 | 3.006,96 | 12.343 | 3.048,47 | ||||
| 2026-02-13 | 13F | Walleye Capital LLC | Put | 300 | 43 | |||||
| 2026-01-29 | 13F | China Universal Asset Management Co., Ltd. | 16.247 | -6,55 | 2.304 | -5,57 | ||||
| 2026-02-13 | 13F | Walleye Capital LLC | 90.325 | 299,56 | 12.811 | 303,72 | ||||
| 2026-02-17 | 13F | 2Xideas AG | 29.388 | -42,15 | 4.168 | -41,54 | ||||
| 2026-02-13 | 13F | Walleye Capital LLC | Call | 1.200 | 170 | |||||
| 2025-11-14 | 13F | Saturn V Capital Management LLC | 0 | -100,00 | 0 | |||||
| 2026-01-27 | 13F | Asset Management One Co., Ltd. | 44.208 | 8,16 | 6.349 | 10,65 | ||||
| 2026-02-10 | 13F | Daiwa Securities Group Inc. | 16.917 | 93,60 | 2 | 100,00 | ||||
| 2026-02-17 | 13F | Schonfeld Strategic Advisors LLC | 89.972 | 15,80 | 12.761 | 17,00 | ||||
| 2026-02-13 | 13F | Kennedy Capital Management, Inc. | 47.051 | -16,38 | 6.673 | -15,52 | ||||
| 2026-02-13 | 13F | Baird Financial Group, Inc. | 42.205 | -10,13 | 5.986 | -9,21 | ||||
| 2026-01-07 | 13F | Aventura Private Wealth, LLC | 39 | 0,00 | 6 | 0,00 | ||||
| 2026-02-12 | 13F | Swiss National Bank | 271.800 | -4,73 | 38.549 | -3,75 | ||||
| 2026-02-17 | 13F | Tudor Investment Corp Et Al | 19.524 | 2.769 | ||||||
| 2026-02-13 | 13F | Wells Fargo & Company/mn | 242.111 | -6,28 | 34.339 | -5,32 | ||||
| 2026-02-17 | 13F | Twinbeech Capital Lp | 3.110 | 441 | ||||||
| 2026-02-06 | 13F | Covestor Ltd | 728 | -19,38 | 0 | |||||
| 2026-02-24 | 13F/A | Pacer Advisors, Inc. | 29.621 | 121,65 | 4.201 | 123,93 | ||||
| 2026-04-08 | 13F | Canandaigua National Corp | 0 | -100,00 | 0 | |||||
| 2026-02-13 | 13F | Pinnacle Wealth Planning Services, Inc. | 48 | 7 | ||||||
| 2026-04-15 | 13F | Fortitude Family Office, LLC | 51 | 155,00 | 7 | 200,00 | ||||
| 2026-02-10 | 13F | Td Asset Management Inc | 71.073 | -31,41 | 10.080 | -30,70 | ||||
| 2026-04-13 | 13F | Massmutual Trust Co Fsb/adv | 388 | -23,32 | 51 | -28,17 | ||||
| 2026-04-15 | 13F | Valley National Advisers Inc | 0 | -100,00 | 0 | |||||
| 2026-02-09 | 13F | Illumine Investment Management, LLC | 9.656 | -0,82 | 1.370 | 0,22 | ||||
| 2026-04-13 | 13F | E Fund Management Co., Ltd. | 4.489 | -48,06 | 591 | -45,58 | ||||
| 2026-04-22 | 13F | Abundance Wealth Counselors | 1.928 | 254 | ||||||
| 2025-11-14 | 13F | Two Sigma Securities, Llc | 0 | -100,00 | 0 | |||||
| 2026-04-15 | 13F | Tema Etfs Llc | 0 | -100,00 | 0 | |||||
| 2026-02-05 | 13F | Atria Investments Llc | 10.496 | -3,26 | 1.489 | -2,30 | ||||
| 2026-02-09 | 13F | CBIZ Investment Advisory Services, LLC | 12 | 0,00 | 2 | 0,00 | ||||
| 2026-04-20 | 13F | Ronald Blue Trust, Inc. | 535 | 5.844,44 | 70 | 6.900,00 | ||||
| 2026-04-16 | 13F | E. Ohman J:or Asset Management AB | 3.512 | 0,00 | 463 | -7,23 | ||||
| 2026-01-28 | 13F | Chicago Partners Investment Group LLC | 5.359 | 50,28 | 730 | 38,86 | ||||
| 2026-02-02 | 13F | Sachetta, LLC | 54 | 0,00 | 8 | 0,00 | ||||
| 2026-02-13 | 13F | Manufacturers Life Insurance Company, The | 0 | -100,00 | 0 | |||||
| 2025-11-14 | 13F | Mount Yale Investment Advisors, LLC | 0 | -100,00 | 0 | -100,00 | ||||
| 2026-02-04 | 13F | Securian Asset Management, Inc | 7.202 | -3,04 | 1.021 | -2,02 | ||||
| 2026-02-23 | 13F | Kera Capital Partners, Inc. | 2.188 | 26,26 | 298 | 22,22 | ||||
| 2026-01-28 | 13F | DekaBank Deutsche Girozentrale | 115.973 | 0,00 | 18 | 6,25 | ||||
| 2026-02-05 | 13F | North Dakota State Investment Board | 3.409 | 483 | ||||||
| 2026-02-13 | 13F | University Of Texas/texas Am Investment Managment Co | 11.196 | -26,70 | 1.588 | -25,98 | ||||
| 2026-02-10 | 13F | Rothschild Investment Llc | 3.065 | 10,85 | 435 | 11,86 | ||||
| 2026-02-12 | 13F | Distillate Capital Partners LLC | 92.539 | -1,99 | 13.125 | -1,04 | ||||
| 2026-02-13 | 13F | Police & Firemen's Retirement System of New Jersey | 41.011 | -4,49 | 5.817 | -3,50 | ||||
| 2026-02-09 | 13F | Smithfield Trust Co | 71 | 0 | ||||||
| 2026-04-06 | 13F | CX Institutional | 126 | 0 | ||||||
| 2026-04-14 | 13F | USA Financial Portformulas Corp | 0 | -100,00 | 0 | |||||
| 2026-02-12 | 13F | Grey Fox Wealth Advisors, LLC | 0 | -100,00 | 0 | |||||
| 2026-02-10 | 13F | National Pension Service | 28.305 | 184,44 | 4.014 | 187,54 | ||||
| 2025-11-07 | 13F | Shell Asset Management Co | 1.136 | -79,79 | 0 | |||||
| 2026-02-02 | 13F | Fifth Third Bancorp | 864 | 1,89 | 123 | 2,52 | ||||
| 2026-02-06 | 13F | Condor Capital Management | 6.294 | -0,22 | 893 | 0,79 | ||||
| 2026-02-12 | 13F | Great Lakes Advisors, Llc | 3.752 | 4,08 | 532 | 5,14 | ||||
| 2026-04-16 | 13F | Stanley-Laman Group, Ltd. | 27.549 | -0,25 | 3.629 | -7,35 | ||||
| 2026-02-09 | 13F | New Age Alpha Advisors, LLC | 23.334 | 13,38 | 3.309 | 14,54 | ||||
| 2026-02-12 | 13F | BRYN MAWR TRUST Co | 0 | -100,00 | 0 | -100,00 | ||||
| 2026-02-13 | 13F | Silvant Capital Management LLC | 20.273 | 1,63 | 2.875 | 2,68 | ||||
| 2026-02-11 | 13F | SOUTH STATE Corp | 11 | 0,00 | 2 | 0,00 | ||||
| 2026-04-15 | 13F | QTR Family Wealth, LLC | 1.854 | -18,22 | 243 | -22,44 | ||||
| 2026-04-24 | 13F | Sumitomo Mitsui DS Asset Management Company, Ltd | 10.249 | 0,77 | 1.350 | -6,38 | ||||
| 2026-02-10 | 13F | Lido Advisors, LLC | 1.836 | 260 | ||||||
| 2026-02-17 | 13F | Orbimed Advisors Llc | 314.240 | -11,14 | 44.569 | -10,22 | ||||
| 2026-04-22 | 13F | Parcion Private Wealth LLC | 3.883 | 2,83 | 512 | -4,49 | ||||
| 2026-02-11 | 13F | 111 Capital | 0 | -100,00 | 0 | -100,00 | ||||
| 2026-02-17 | 13F | California State Teachers Retirement System | 134.172 | -2,03 | 19.030 | -1,02 | ||||
| 2026-04-15 | 13F | Bayforest Capital Ltd | 981 | -50,03 | 129 | -53,60 | ||||
| 2026-02-10 | 13F | Commonwealth Of Pennsylvania Public School Empls Retrmt Sys | 24.951 | -1,98 | 3.539 | -0,98 | ||||
| 2026-02-17 | 13F | Advisory Services Network, LLC | 0 | -100,00 | 0 | |||||
| 2026-02-13 | 13F | Dodge & Cox | 5.508.042 | -0,87 | 781.206 | 0,15 | ||||
| 2026-01-22 | 13F | Massachusetts Financial Services Co /ma/ | 126.341 | -7,62 | 17.919 | -6,66 | ||||
| 2025-11-12 | 13F | Nationale-Nederlanden Powszechne Towarzystwo Emerytalne S.A. | 0 | -100,00 | 0 | -100,00 | ||||
| 2026-02-06 | 13F | Tredje AP-fonden | 84.503 | 626,78 | 11.985 | 634,38 | ||||
| 2026-01-22 | 13F | Bfsg, Llc | 14 | 0,00 | 2 | 0,00 | ||||
| 2026-02-17 | 13F/A | Sentinus, LLC | 1.957 | 278 | ||||||
| 2026-01-15 | 13F | Allspring Global Investments Holdings, LLC | 339.432 | -11,25 | 47.724 | -8,91 | ||||
| 2026-02-09 | 13F | Allstate Corp | 7.154 | 112,41 | 1.015 | 114,83 | ||||
| 2026-02-11 | 13F | Prestige Wealth Management Group LLC | 4 | 0,00 | 1 | |||||
| 2026-04-23 | 13F | Oppenheimer & Co Inc | 42.079 | 3,67 | 5.543 | -3,72 | ||||
| 2026-02-17 | 13F | Bellevue Group AG | 1.703.304 | -3,39 | 241.580 | -2,39 | ||||
| 2026-02-17 | 13F | J. Goldman & Co LP | 53.303 | 13,58 | 7.560 | 14,76 | ||||
| 2026-02-05 | 13F | S&co Inc | 7.000 | 0,00 | 1 | |||||
| 2026-01-27 | 13F | Fortis Capital Advisors, LLC | 9.485 | 1.345 | ||||||
| 2026-02-12 | 13F | Hrt Financial Lp | 0 | -100,00 | 0 | |||||
| 2026-02-11 | 13F | GW&K Investment Management, LLC | 576.648 | 82 | ||||||
| 2025-11-12 | 13F | NewSquare Capital LLC | 0 | -100,00 | 0 | -100,00 | ||||
| 2025-11-14 | 13F | Vestal Point Capital, LP | 0 | -100,00 | 0 | |||||
| 2026-02-17 | 13F | Public Employees Retirement System Of Ohio | 31.877 | -3,27 | 4.521 | -2,27 | ||||
| 2026-01-16 | 13F | Standard Life Aberdeen plc | 40.016 | -55,56 | 5.675 | -55,10 | ||||
| 2026-02-10 | 13F | Smith Group Asset Management, LLC | 2.642 | 16,90 | 375 | 17,98 | ||||
| 2026-01-28 | 13F | Ruffer LLP | 17.453 | 2.479 | ||||||
| 2026-04-24 | 13F | Essex Financial Services, Inc. | 1.838 | 19,66 | 242 | 11,52 | ||||
| 2026-01-26 | 13F | MOKAN Wealth Management Inc. | 1.943 | 24,15 | 276 | 25,57 | ||||
| 2026-04-22 | 13F | Janney Montgomery Scott LLC | 10.764 | -2,46 | 1 | 0,00 | ||||
| 2026-02-13 | 13F | 1832 Asset Management L.P. | 9.492 | -12,01 | 1.346 | -11,10 | ||||
| 2026-02-12 | 13F | Jane Street Group, Llc | 5.197 | -97,39 | 737 | -97,36 | ||||
| 2026-02-12 | 13F | Alps Advisors Inc | 3.246 | 1,12 | 460 | 2,22 | ||||
| 2026-02-11 | 13F | Ameritas Investment Partners, Inc. | 18.273 | 2.592 | ||||||
| 2026-02-13 | 13F | MAI Capital Management | 428 | 237,01 | 61 | 252,94 | ||||
| 2026-02-05 | 13F | New York Life Investment Management Llc | 9.529 | -6,92 | 1.351 | -5,98 | ||||
| 2026-02-11 | 13F | Arrowpoint Investment Partners (Singapore) Pte. Ltd. | 3.517 | 499 | ||||||
| 2026-02-13 | 13F | Royal London Asset Management Ltd | 54.763 | 1,78 | 7.767 | 2,83 | ||||
| 2026-02-17 | 13F | Cape Investment Advisory, Inc. | 35 | 0,00 | 5 | 0,00 | ||||
| 2025-11-12 | 13F | Headlands Technologies LLC | 0 | -100,00 | 0 | -100,00 | ||||
| 2026-04-15 | 13F | Riversedge Advisors, Llc | 1.551 | 204 | ||||||
| 2026-02-17 | 13F | Rock Springs Capital Management LP | 125.500 | 39,83 | 17.800 | 41,27 | ||||
| 2026-02-17 | 13F | Boothbay Fund Management, Llc | Call | 13.700 | 1.943 | |||||
| 2026-02-17 | 13F | Boothbay Fund Management, Llc | 13.388 | 1.899 | ||||||
| 2026-02-13 | 13F | Transamerica Financial Advisors, Inc. | 82 | 12 | ||||||
| 2026-02-11 | 13F | Erste Asset Management GmbH | 19.700 | 2.830 | ||||||
| 2026-02-12 | 13F | Soleus Capital Management, L.P. | 175.982 | 27,52 | 24.960 | 28,84 | ||||
| 2026-02-19 | 13F | Invesco Ltd. | 343.421 | 6,12 | 48.707 | 7,22 | ||||
| 2026-03-02 | 13F | Tobam | 58 | -98,85 | 0 | |||||
| 2026-01-30 | 13F | Urban Wealth Management, LLC | 0 | -100,00 | 0 | |||||
| 2026-02-12 | 13F | Skopos Labs, Inc. | 4.572 | 124,89 | 657 | 158,27 | ||||
| 2026-01-26 | 13F | KBC Group NV | 32.401 | 122,44 | 5 | 100,00 | ||||
| 2026-04-20 | 13F | Banque Cantonale Vaudoise | 0 | -100,00 | 0 | |||||
| 2026-02-17 | 13F | Deerfield Management Company, L.p. (series C) | 1.184.345 | 0,00 | 167.976 | 1,03 | ||||
| 2026-02-02 | 13F | Truist Financial Corp | 10.991 | -68,89 | 1.559 | -68,58 | ||||
| 2026-01-28 | 13F | Arizona State Retirement System | 27.226 | -6,78 | 3.861 | -5,83 | ||||
| 2026-03-31 | 13F/A | Barclays Plc | Call | 0 | -100,00 | 0 | -100,00 | |||
| 2026-02-12 | 13F | First Financial Bankshares Inc | 37.853 | 33,16 | 5.369 | 34,54 | ||||
| 2026-02-17 | 13F | Bank Of America Corp /de/ | 528.104 | -25,01 | 74.901 | -24,24 | ||||
| 2026-02-13 | 13F | Atlas Capital Advisors Llc | 13 | 2 | ||||||
| 2026-01-27 | 13F | Evergreen Capital Management Llc | 2.364 | -7,91 | 335 | -6,94 | ||||
| 2026-02-17 | 13F | Caption Management, LLC | Call | 35.000 | 16,67 | 4.964 | 17,88 | |||
| 2026-04-17 | 13F | Fifth Third Wealth Advisors LLC | 3.563 | 13,72 | 469 | 5,63 | ||||
| 2026-02-12 | 13F | Johnson Financial Group, Inc. | 16 | -36,00 | 2 | -33,33 | ||||
| 2026-04-20 | 13F | Davis Investment Partners, LLC | 4.459 | 7,97 | 587 | 1,21 | ||||
| 2026-02-20 | 13F | Kovitz Investment Group Partners, LLC | 0 | -100,00 | 0 | |||||
| 2026-02-17 | 13F | Balyasny Asset Management Llc | 141.101 | -30,63 | 20.012 | -29,92 | ||||
| 2026-04-21 | 13F | Pinnacle Wealth Management Advisory Group, LLC | 0 | -100,00 | 0 | |||||
| 2026-02-17 | 13F | Blair William & Co/il | 4.500 | 0,87 | 638 | 1,92 | ||||
| 2026-02-17 | 13F | Capstone Investment Advisors, Llc | 0 | -100,00 | 0 | -100,00 | ||||
| 2026-02-17 | 13F | ExodusPoint Capital Management, LP | 0 | -100,00 | 0 | -100,00 | ||||
| 2026-02-17 | 13F | Two Sigma Advisers, Lp | 842.592 | 466,36 | 119.505 | 472,23 | ||||
| 2026-02-11 | 13F | Group One Trading, L.p. | Put | 4.000 | 3.900,00 | 567 | 3.950,00 | |||
| 2026-02-17 | 13F | Prelude Capital Management, Llc | 1.808 | 256 | ||||||
| 2026-02-13 | 13F | State Street Corp | 4.242.681 | -2,39 | 601.739 | -1,38 | ||||
| 2026-02-11 | 13F | Group One Trading, L.p. | Call | 3.000 | 76,47 | 425 | 78,57 | |||
| 2025-11-17 | 13F | Alyeska Investment Group, L.P. | 0 | -100,00 | 0 | -100,00 | ||||
| 2026-02-11 | 13F | Group One Trading, L.p. | 1.330 | 189 | ||||||
| 2026-02-10 | 13F | Intech Investment Management Llc | 40.478 | 16,80 | 5.741 | 18,01 | ||||
| 2026-04-16 | 13F | Brookstone Capital Management | 5.050 | 23,14 | 665 | 14,46 | ||||
| 2026-02-17 | 13F | NorthRock Partners, LLC | 0 | -100,00 | 0 | |||||
| 2026-02-10 | 13F | CIBC Asset Management Inc | 4.423 | 41,17 | 627 | 42,82 | ||||
| 2026-02-17 | 13F | Fmr Llc | 70.473 | -2,58 | 9.995 | -1,58 | ||||
| 2026-02-20 | 13F | Sunbelt Securities, Inc. | 266 | -17,65 | 38 | -17,78 | ||||
| 2026-02-09 | 13F | Employees Retirement System of Texas | 1.059 | 0,00 | 0 | |||||
| 2026-02-17 | 13F | Two Sigma Investments, Lp | 984.811 | 183,35 | 139.676 | 186,27 | ||||
| 2026-04-20 | 13F | Yorktown Management & Research Co Inc | 2.250 | 0,00 | 296 | -7,21 | ||||
| 2026-04-15 | 13F | City Holding Co | 100 | 0,00 | 13 | -7,14 | ||||
| 2026-02-17 | 13F | DZ BANK AG Deutsche Zentral Genossenschafts Bank, Frankfurt am Main | 668 | 95 | ||||||
| 2026-04-16 | 13F | Evolve Private Wealth, Llc | 6.223 | -18,97 | 820 | -24,79 | ||||
| 2026-02-17 | 13F | Northern Trust Corp | 1.221.184 | 31,92 | 173.201 | 33,28 | ||||
| 2026-02-13 | 13F | Pathstone Holdings, LLC | 11.927 | 5,90 | 1.692 | 6,96 | ||||
| 2026-02-20 | 13F | Wick Capital Partners, LLC | 8.054 | 224 | ||||||
| 2026-04-10 | 13F/A | OP Asset Management Ltd | 18.506 | 60,67 | 2.438 | 49,23 | ||||
| 2026-02-12 | 13F | Callan Family Office, LLC | 5.726 | 199,48 | 812 | 202,99 | ||||
| 2026-02-17 | 13F | Ameriflex Group, Inc. | 2 | -50,00 | 0 | |||||
| 2026-01-29 | 13F | Washington Capital Management Inc | 4.400 | -15,38 | 624 | -14,40 | ||||
| 2026-02-17 | 13F | Investment Management Corp of Ontario | 6.659 | 43,36 | 944 | 44,79 | ||||
| 2026-02-17 | 13F | Janus Henderson Group Plc | 459.176 | -22,85 | 65.127 | -22,04 | ||||
| 2026-02-03 | 13F | Manning & Napier Advisors Llc | 22 | 3 | ||||||
| 2026-02-13 | 13F | Squarepoint Ops LLC | 209.706 | 418,04 | 29.743 | 423,44 | ||||
| 2026-02-17 | 13F | Element Capital Management Llc | 7.017 | 995 | ||||||
| 2026-02-11 | 13F | Motley Fool Asset Management LLC | 1.693 | 4,83 | 240 | 6,19 | ||||
| 2026-04-16 | 13F | SG Americas Securities, LLC | 59.267 | -55,95 | 8 | -63,16 | ||||
| 2026-02-02 | 13F | Cornerstone Planning Group LLC | 7 | -12,50 | 1 | |||||
| 2026-02-05 | 13F | Qsemble Capital Management, LP | 4.412 | 626 | ||||||
| 2026-02-17 | 13F | State Of Wisconsin Investment Board | 94.527 | -4,32 | 13.407 | -3,33 | ||||
| 2026-04-24 | 13F | Keybank National Association/oh | 2.617 | -7,62 | 345 | -14,21 | ||||
| 2026-02-12 | 13F | Aviva Plc | 70.423 | 5,68 | 9.988 | 6,78 | ||||
| 2026-02-05 | 13F | Bessemer Group Inc | 2.898 | 0,94 | 0 | |||||
| 2026-02-17 | 13F | Perceptive Advisors Llc | 331.050 | -26,44 | 46.953 | -25,68 | ||||
| 2026-02-03 | 13F | Legacy Wealth Managment, LLC/ID | 14 | 0,00 | 2 | 0,00 | ||||
| 2026-01-29 | 13F | Dunhill Financial, LLC | 2 | 0 | ||||||
| 2026-01-09 | 13F | Congress Asset Management Co /ma | 0 | -100,00 | 0 | |||||
| 2026-02-04 | 13F | Plato Investment Management Ltd | 3.981 | 72,41 | 567 | 76,64 | ||||
| 2026-01-26 | 13F | Whittier Trust Co Of Nevada Inc | 33 | 0,00 | 5 | 0,00 | ||||
| 2026-04-23 | 13F | Peregrine Capital Management Llc | 0 | -100,00 | 0 | |||||
| 2026-02-13 | 13F | Carmignac Gestion | 63.600 | 9.020 | ||||||
| 2026-02-17 | 13F | FIL Ltd | 0 | -100,00 | 0 | |||||
| 2025-11-06 | 13F | Abich Financial Wealth Management LLC | 642 | 90 | ||||||
| 2026-02-13 | 13F | Bank Of Nova Scotia | 7.532 | 18,32 | 1.068 | 19,60 | ||||
| 2026-02-17 | 13F | Armistice Capital, Llc | 820.240 | 17,68 | 116.335 | 18,89 | ||||
| 2026-01-27 | 13F | Elevated Capital Advisors, LLC | 4 | 1 | ||||||
| 2026-02-17 | 13F | Tang Capital Management Llc | 0 | -100,00 | 0 | |||||
| 2026-02-17 | 13F | Banco Bilbao Vizcaya Argentaria, S.a. | 0 | -100,00 | 0 | |||||
| 2026-04-22 | 13F | Sterling Capital Management LLC | 1.061 | -25,28 | 140 | -30,85 | ||||
| 2026-01-23 | 13F | Assetmark, Inc | 19.321 | -4,52 | 2.740 | -3,52 | ||||
| 2026-02-09 | 13F | Optimize Financial Inc | 2.983 | 1,36 | 423 | 2,42 | ||||
| 2026-02-14 | 13F | Rockefeller Capital Management L.P. | 507.170 | 161,50 | 39.863 | 46,42 | ||||
| 2026-02-06 | 13F | Intrust Bank Na | 2.258 | -1,78 | 320 | -0,62 | ||||
| 2026-02-17 | 13F | Rakuten Investment Management, Inc. | 4.201 | -96,74 | 603 | -93,00 | ||||
| 2026-04-02 | 13F | MJT & Associates Financial Advisory Group, Inc. | 30 | 0,00 | 4 | -25,00 | ||||
| 2026-01-15 | 13F | Nisa Investment Advisors, Llc | 5.201 | -80,84 | 738 | -80,66 | ||||
| 2026-02-13 | 13F | Knollwood Investment Advisory, LLC | 0 | -100,00 | 0 | |||||
| 2026-02-10 | 13F | Natixis Advisors, L.p. | 41.256 | -3,58 | 6 | -16,67 | ||||
| 2026-02-12 | 13F | MetLife Investment Management, LLC | 52.666 | -4,00 | 7.470 | -3,01 | ||||
| 2026-04-23 | 13F | iA Global Asset Management Inc. | 0 | -100,00 | 0 | |||||
| 2026-02-12 | 13F | Azimuth Capital Investment Management LLC | 122.278 | 73,01 | 17.343 | 74,80 | ||||
| 2026-02-13 | 13F | Jacobs Levy Equity Management, Inc | 34.926 | -1,67 | 4.954 | -0,66 | ||||
| 2025-11-13 | 13F | Aware Super Pty Ltd as trustee of Aware Super | 108.364 | 186,72 | 15.212 | 220,25 | ||||
| 2026-04-14 | 13F | Juncture Wealth Strategies, Llc | 4.543 | -5,28 | 598 | -12,06 | ||||
| 2026-02-10 | 13F | Connor, Clark & Lunn Investment Management Ltd. | 246.289 | -12,39 | 34.931 | -11,48 | ||||
| 2025-11-06 | 13F | Applied Finance Capital Management, LLC | 0 | -100,00 | 0 | -100,00 | ||||
| 2026-01-14 | 13F | ORG Partners LLC | 191 | 20,13 | 27 | 22,73 | ||||
| 2026-02-11 | 13F | Meiji Yasuda Life Insurance Co | 5.528 | -1,39 | 784 | -0,25 | ||||
| 2026-02-13 | 13F | Rhenman & Partners Asset Management AB | 125.491 | 9,39 | 17.798 | 10,53 | ||||
| 2026-04-16 | 13F | Diversified Trust Co | 3.235 | 0,47 | 426 | -6,58 | ||||
| 2025-11-06 | 13F | Whipplewood Advisors, LLC | 0 | -100,00 | 0 | -100,00 | ||||
| 2026-04-09 | 13F | Park Place Capital Corp | 16 | 0,00 | 2 | 0,00 | ||||
| 2026-02-10 | 13F | Godfrey Financial Associates, Inc. | 1.225 | 174 | ||||||
| 2026-02-12 | 13F | Wealthspire Advisors, LLC | 0 | -100,00 | 0 | |||||
| 2026-02-11 | 13F | Winnow Wealth Llc | 6.262 | -8,05 | 889 | -7,40 | ||||
| 2026-02-06 | 13F | Larson Financial Group LLC | 1.005 | 32,76 | 143 | 33,96 | ||||
| 2026-02-12 | 13F | Commonwealth Equity Services, Llc | 14.501 | 1,24 | 2.057 | 102.700,00 | ||||
| 2026-01-23 | 13F | Rsm Us Wealth Management Llc | 3.670 | -8,16 | 517 | -7,68 | ||||
| 2026-02-10 | 13F | Meitav Dash Investments Ltd | 13.000 | 1.844 | ||||||
| 2026-04-14 | 13F | Perpetual Ltd | 3.359 | 22,64 | 443 | 13,92 | ||||
| 2026-01-21 | 13F | Signature Resources Capital Management, LLC | 3 | 0 | ||||||
| 2026-02-17 | 13F | Aqr Capital Management Llc | 3.271.706 | 17,96 | 462.652 | 19,11 | ||||
| 2026-04-17 | 13F | Kaufman Rossin Wealth, LLC | 0 | -100,00 | 0 | |||||
| 2026-02-17 | 13F | Advisor Group Holdings, Inc. | 3.177 | -27,50 | 451 | -26,71 | ||||
| 2026-04-24 | 13F | Heritage Investors Management Corp | 7.040 | 0,00 | 1 | |||||
| 2026-04-23 | 13F | MQS Management LLC | 2.471 | 21,01 | 326 | 12,46 | ||||
| 2026-02-03 | 13F | Everence Capital Management Inc | 2.800 | 0,00 | 0 | |||||
| 2026-02-10 | 13F | Measured Wealth Private Client Group, LLC | 140 | 0,00 | 20 | 0,00 | ||||
| 2026-01-23 | 13F | Avion Wealth | 8 | -33,33 | 0 | |||||
| 2026-02-12 | 13F | denkapparat Operations GmbH | 2.574 | 0,00 | 365 | 1,11 | ||||
| 2026-04-08 | 13F | DiNuzzo Private Wealth, Inc. | 12 | 0,00 | 2 | 0,00 | ||||
| 2026-02-17 | 13F | Royal Bank Of Canada | 311.012 | 27,11 | 44.110 | 28,42 | ||||
| 2026-04-24 | 13F | Retirement Systems of Alabama | 123.040 | 2,82 | 16.209 | -4,50 | ||||
| 2026-02-13 | 13F | American Century Companies Inc | 158.485 | 14,09 | 22.478 | 15,27 | ||||
| 2025-11-13 | 13F | Sio Capital Management, LLC | 0 | -100,00 | 0 | -100,00 | ||||
| 2026-02-13 | 13F | Fieldview Capital Management, LLC | 1.757 | 249 | ||||||
| 2026-02-13 | 13F | Edgestream Partners, L.P. | 21.608 | 445,79 | 3.065 | 452,07 | ||||
| 2026-04-07 | 13F | Signaturefd, Llc | 583 | -69,71 | 77 | -72,16 | ||||
| 2026-02-13 | 13F | Change Path, LLC | 9.627 | 23,19 | 1.365 | 24,43 | ||||
| 2025-11-14 | 13F | Ancora Advisors, LLC | 0 | -100,00 | 0 | -100,00 | ||||
| 2026-02-13 | 13F | Sei Investments Co | 179.397 | -40,24 | 25.444 | -39,62 | ||||
| 2026-02-12 | 13F | Steward Partners Investment Advisory, Llc | 42 | 133,33 | 6 | 150,00 | ||||
| 2026-04-20 | 13F | Ritholtz Wealth Management | 1.697 | 11,57 | 224 | 3,72 | ||||
| 2025-11-14 | 13F | Texas Permanent School Fund | 0 | -100,00 | 0 | |||||
| 2026-01-30 | 13F | Torren Management, LLC | 53 | 8 | ||||||
| 2026-02-06 | 13F | Abn Amro Investment Solutions | 2.706 | 384 | ||||||
| 2026-01-27 | 13F | Tokio Marine Asset Management Co Ltd | 4.968 | 3,56 | 705 | 4,61 | ||||
| 2026-02-19 | 13F | CI Private Wealth, LLC | 7.292 | 82,07 | 1.034 | 83,99 | ||||
| 2026-02-17 | 13F | Braidwell Lp | 751.534 | -14,63 | 106.590 | -13,74 | ||||
| 2026-04-23 | 13F | TFC Financial Management | 4 | 0,00 | 1 | |||||
| 2026-02-17 | 13F | Amundi | 166.350 | -27,76 | 23.593 | -26,51 | ||||
| 2026-02-13 | 13F | OMERS ADMINISTRATION Corp | 3.547 | 0,00 | 503 | 1,21 | ||||
| 2026-02-17 | 13F | Quadrature Capital Ltd | 0 | -100,00 | 0 | |||||
| 2026-02-13 | 13F | Segall Bryant & Hamill, Llc | 56.470 | 3,66 | 8.009 | 4,73 | ||||
| 2026-02-12 | 13F | Bank Of Montreal /can/ | 23.635 | -0,34 | 3.352 | 0,69 | ||||
| 2026-02-02 | 13F | Horizon Investments, LLC | 55.090 | 42,66 | 7.813 | 44,15 | ||||
| 2026-02-17 | 13F | Quantinno Capital Management LP | 26.991 | 66,56 | 3.828 | 68,34 | ||||
| 2026-02-09 | 13F | Simplify Asset Management Inc. | 3.404 | -90,71 | 483 | -90,62 | ||||
| 2025-11-07 | 13F | Sierra Ocean, Llc | 0 | -100,00 | 0 | |||||
| 2026-01-20 | 13F | GraniteShares Advisors LLC | 0 | -100,00 | 0 | |||||
| 2026-01-30 | 13F | Mitsubishi UFJ Trust & Banking Corp | 79.895 | 1,07 | 11.332 | 2,12 | ||||
| 2026-04-14 | 13F | Bay Harbor Wealth Management, LLC | 11 | 22,22 | 1 | 0,00 | ||||
| 2026-02-13 | 13F | Mariner, LLC | 96.013 | 75,23 | 13.608 | 76,93 | ||||
| 2026-01-27 | 13F | Seeds Investor Llc | 2.494 | 10,31 | 354 | 11,36 | ||||
| 2026-02-13 | 13F | Citigroup Inc | Call | 30.000 | 4.255 | |||||
| 2026-02-12 | 13F | BlackRock, Inc. | 12.830.597 | 0,98 | 1.819.764 | 2,02 | ||||
| 2026-02-13 | 13F | Citigroup Inc | Put | 30.000 | 4.255 | |||||
| 2026-01-30 | 13F | Bogart Wealth, LLC | 4 | -50,00 | 1 | -100,00 | ||||
| 2026-02-13 | 13F | First Trust Advisors Lp | 486.809 | 34,07 | 69.044 | 35,45 | ||||
| 2026-02-13 | 13F | Citigroup Inc | 103.273 | -56,44 | 14.647 | -55,99 | ||||
| 2026-02-17 | 13F | Capital Fund Management S.a. | 80.125 | -35,23 | 11.364 | -34,56 | ||||
| 2026-01-20 | 13F | Cromwell Holdings LLC | 17 | 0,00 | 2 | 0,00 | ||||
| 2026-01-21 | 13F | Leading Edge Financial Planning LLC | 1.617 | 0,12 | 229 | 1,33 | ||||
| 2026-02-12 | 13F | Dimensional Fund Advisors Lp | 716.475 | 0,89 | 101.612 | 1,93 | ||||
| 2026-04-23 | 13F | North Star Investment Management Corp. | 13 | 0,00 | 2 | 0,00 | ||||
| 2026-04-07 | 13F | Farther Finance Advisors, LLC | 2.947 | 7,01 | 391 | 0,00 | ||||
| 2026-01-26 | 13F | Cwm, Llc | 95.030 | 13,50 | 13 | 18,18 | ||||
| 2026-02-17 | 13F | Alliancebernstein L.p. | 555.494 | -10,13 | 78.786 | -9,20 | ||||
| 2026-02-17 | 13F | Graham Capital Management, L.P. | 1.829 | -34,04 | 259 | -33,42 | ||||
| 2026-04-08 | 13F | Woodstock Corp | 7.192 | 0,00 | 947 | -7,16 | ||||
| 2026-01-26 | 13F | La Banque Postale Asset Management SA | 1.580 | -31,81 | 224 | -31,08 | ||||
| 2026-02-10 | 13F | Quantbot Technologies LP | 2.219 | -42,53 | 315 | -42,07 | ||||
| 2026-02-12 | 13F | Principal Securities, Inc. | 1.528 | -12,03 | 217 | -11,11 | ||||
| 2026-02-13 | 13F | Fiduciary Trust Co | 2.005 | 0,00 | 284 | 1,07 | ||||
| 2026-02-03 | 13F | ASR Vermogensbeheer N.V. | 4.135 | -0,89 | 586 | 0,17 | ||||
| 2026-04-08 | 13F | Wealth Enhancement Advisory Services, Llc | 80.289 | 47,61 | 9.336 | 24,67 | ||||
| 2025-11-14 | 13F | Redwood Investment Management, Llc | 0 | -100,00 | 0 | -100,00 | ||||
| 2026-04-08 | 13F | E Fund Management (Hong Kong) Co., Ltd. | 112 | 15 | ||||||
| 2026-02-02 | 13F | Seizert Capital Partners, Llc | 70.670 | 0,91 | 10.023 | 1,95 | ||||
| 2026-04-17 | 13F | Vermillion Wealth Management, Inc. | 7 | 1 | ||||||
| 2026-02-10 | 13F | Gulf International Bank (UK) Ltd | 5.790 | 0,00 | 1 | |||||
| 2026-01-27 | 13F | Brighton Jones Llc | 0 | -100,00 | 0 | |||||
| 2026-01-29 | 13F | Sanctuary Advisors, LLC | 8.450 | 4,81 | 1.198 | 5,92 | ||||
| 2026-01-30 | 13F/A | M&t Bank Corp | 4.318 | 30,41 | 613 | 31,90 | ||||
| 2026-02-13 | 13F | Charles Schwab Investment Management Inc | 850.632 | 2,54 | 120.645 | 3,60 | ||||
| 2025-12-16 | 13F | Lindenwold Advisors | 2.241 | 1,13 | 315 | 12,95 | ||||
| 2026-02-12 | 13F | AlphaCentric Advisors LLC | 7.383 | 100,41 | 1.047 | 108,57 | ||||
| 2026-02-06 | 13F | Eagle Health Investments LP | 162.800 | 0,00 | 23.090 | 1,03 | ||||
| 2026-02-17 | 13F | Aster Capital Management (DIFC) Ltd | 614 | 74,43 | 87 | 77,55 | ||||
| 2026-01-30 | 13F | Jennison Associates Llc | 0 | -100,00 | 0 | |||||
| 2026-02-13 | 13F | Umb Bank N A/mo | 1.235 | 10,27 | 175 | 11,46 | ||||
| 2026-01-30 | 13F | New York State Teachers Retirement System | 95.631 | -3,09 | 14 | 0,00 | ||||
| 2026-04-23 | 13F | Lansforsakringar Fondforvaltning AB (publ) | 31.888 | 0,00 | 4.201 | -7,12 | ||||
| 2026-02-03 | 13F | S-Bank Fund Management Ltd | 918 | -3,67 | 130 | -2,26 | ||||
| 2025-11-14 | 13F | Cubist Systematic Strategies, LLC | 32.743 | 4.596 | ||||||
| 2026-02-10 | 13F | Bnp Paribas Arbitrage, Sa | 213.992 | 111,93 | 30.350 | 114,12 | ||||
| 2026-02-13 | 13F | Mml Investors Services, Llc | 11.730 | -9,90 | 1.664 | -8,98 | ||||
| 2026-02-12 | 13F | Nuveen, LLC | 286.785 | 17,07 | 40.675 | 18,28 | ||||
| 2026-02-11 | 13F | LPL Financial LLC | 40.323 | 17,94 | 5.719 | 19,17 | ||||
| 2026-01-29 | 13F | UBS Group AG | 983.528 | 169,78 | 139.494 | 172,56 | ||||
| 2026-02-17 | 13F | Engineers Gate Manager LP | 12.320 | 61,38 | 1.747 | 63,12 | ||||
| 2026-02-09 | 13F | Legal & General Group Plc | 330.606 | -17,38 | 46.890 | -16,53 | ||||
| 2026-02-17 | 13F | MIRAE ASSET GLOBAL ETFS HOLDINGS Ltd. | 14.534 | 14,19 | 1.943 | 8,79 | ||||
| 2026-04-23 | 13F | Forum Financial Management, LP | 0 | -100,00 | 0 | |||||
| 2026-01-28 | 13F | B. Metzler seel. Sohn & Co. AG | 4.737 | -11,61 | 672 | -10,77 | ||||
| 2026-02-09 | 13F | Annis Gardner Whiting Capital Advisors, LLC | 36 | 0,00 | 5 | 0,00 | ||||
| 2026-02-17 | 13F | Wealth Watch Advisors, INC | 1 | 0,00 | 0 | |||||
| 2026-01-15 | 13F | J. Safra Sarasin Holding AG | 3.966 | -36,66 | 562 | -35,99 | ||||
| 2026-02-17 | 13F | Raymond James Financial Inc | 631.422 | 11,37 | 89.221 | 12,11 | ||||
| 2026-02-11 | 13F | Los Angeles Capital Management Llc | 1.291.278 | 7,36 | 178.248 | 5,57 | ||||
| 2026-02-11 | 13F | Livforsakringsbolaget Skandia, Omsesidigt | 1.000 | 0,00 | 142 | 0,71 | ||||
| 2026-02-10 | 13F | SBI Okasan Asset Management Co.Ltd. | 494 | 71 | ||||||
| 2026-02-11 | 13F | IMA Wealth, Inc. | 1 | 0,00 | 0 | |||||
| 2026-01-30 | 13F | Us Bancorp \de\ | 3.432 | -2,31 | 487 | -1,42 | ||||
| 2026-02-09 | 13F/A | Fideuram - Intesa Sanpaolo Private Banking S.p.a. | 13.154 | 1.866 | ||||||
| 2026-02-02 | 13F | Principal Financial Group Inc | 226.377 | -2,32 | 32.107 | -1,31 | ||||
| 2026-02-11 | 13F | Primecap Management Co/ca/ | 507.740 | -0,88 | 72.013 | 0,14 | ||||
| 2026-04-10 | 13F | Connecticut Capital Management Group, LLC | 0 | -100,00 | 0 | |||||
| 2026-04-21 | 13F | Robeco Institutional Asset Management B.V. | 88.017 | -22,29 | 11.595 | -27,82 | ||||
| 2026-02-05 | 13F | DnB Asset Management AS | 139.457 | 12,37 | 19.779 | 13,53 | ||||
| 2026-02-10 | 13F | Forsta Ap-fonden | 19.800 | -1,49 | 2.808 | -0,46 | ||||
| 2026-02-17 | 13F | XTX Topco Ltd | 11.775 | 326,32 | 1.670 | 331,52 | ||||
| 2026-04-09 | 13F | Wedmont Private Capital | 1.641 | 1,11 | 218 | -4,39 | ||||
| 2026-04-22 | 13F | Smallwood Wealth Investment Management, LLC | 305 | 0,00 | 40 | -6,98 | ||||
| 2026-02-17 | 13F | Worldquant Millennium Advisors Llc | 88.246 | 42,29 | 12.516 | 43,75 | ||||
| 2026-02-17 | 13F | Scientech Research LLC | 3.848 | 546 | ||||||
| 2026-02-13 | 13F | Stifel Financial Corp | 11.405 | -18,52 | 1.618 | -17,67 | ||||
| 2026-01-29 | 13F | Ashton Thomas Private Wealth, LLC | 1.541 | 219 | ||||||
| 2026-04-22 | 13F | Pictet Asset Management Holding SA | 602.643 | -22,43 | 78.945 | -28,43 | ||||
| 2026-02-13 | 13F | Hudson Bay Capital Management LP | 305.000 | 652,90 | 43.258 | 660,78 | ||||
| 2026-02-05 | 13F | 1620 Investment Advisors, Inc. | 912 | 0,11 | 129 | 1,57 | ||||
| 2026-02-13 | 13F | Natixis | 3.904 | -27,34 | 554 | -26,66 | ||||
| 2026-04-13 | 13F | PKO BP BANKOWY Universal Pension Society JSC | 138.802 | 0,00 | 18.286 | -7,12 | ||||
| 2025-11-13 | 13F | Glenmede Investment Management, LP | 82.577 | -1,92 | 11.592 | 9,55 | ||||
| 2026-01-29 | 13F | Riggs Asset Managment Co. Inc. | 3.818 | 542 | ||||||
| 2026-02-13 | 13F | Aptus Capital Advisors, LLC | 1.667 | 236 | ||||||
| 2026-02-17 | 13F | Ameriprise Financial Inc | 585.677 | -4,70 | 83.067 | -3,72 | ||||
| 2026-01-13 | 13F | Dakota Wealth Management | 2.185 | 310 | ||||||
| 2026-04-24 | 13F | Fulton Bank, N.a. | 4.652 | 13,69 | 613 | 5,52 | ||||
| 2026-01-26 | 13F | Whittier Trust Co | 53 | 0,00 | 7 | 0,00 | ||||
| 2026-02-05 | 13F | Bank Julius Baer & Co. Ltd, Zurich | 11.913 | 1.680 | ||||||
| 2025-11-14 | 13F | WealthTrak Capital Management LLC | 0 | -100,00 | 0 | |||||
| 2025-11-06 | 13F | Ameritas Advisory Services, LLC | 0 | -100,00 | 0 | |||||
| 2026-04-23 | 13F | SJS Investment Consulting Inc. | 341 | 67,16 | 45 | 57,14 | ||||
| 2026-04-08 | 13F | Thompson Investment Management, Inc. | 9.755 | 0,00 | 1.285 | -7,09 | ||||
| 2026-02-12 | 13F | Campbell & CO Investment Adviser LLC | 6.338 | -61,52 | 899 | -61,16 | ||||
| 2026-04-08 | 13F | NorthCrest Asset Manangement, LLC | 9.348 | -28,06 | 1.230 | -30,39 | ||||
| 2026-02-13 | 13F | Treasurer of the State of North Carolina | 40.570 | -6,82 | 6 | -16,67 | ||||
| 2026-01-28 | 13F | HB Wealth Management, LLC | 4.819 | 34,99 | 683 | 36,33 | ||||
| 2026-02-17 | 13F | Diadema Partners Lp | 0 | -100,00 | 0 | |||||
| 2026-04-15 | 13F | Atwood & Palmer Inc | 5 | 0,00 | 1 | |||||
| 2026-02-05 | 13F | HFM Investment Advisors, LLC | 5 | 0,00 | 1 | |||||
| 2026-02-13 | 13F | Vontobel Holding Ltd. | 2.722 | -0,48 | 386 | 0,78 | ||||
| 2026-02-05 | 13F | HighMark Wealth Management LLC | 0 | -100,00 | 0 | |||||
| 2026-02-11 | 13F | Hughes Financial Services, LLC | 5 | 0,00 | 1 | |||||
| 2026-02-12 | 13F | Andra AP-fonden | 67.900 | 9.630 | ||||||
| 2026-04-14 | 13F | Northwest Wealth Management, Llc | 2.463 | 38,76 | 324 | 29,08 | ||||
| 2026-02-17 | 13F | Summit Trail Advisors, Llc | 2.919 | 6,26 | 414 | 7,53 | ||||
| 2025-11-14 | 13F | Goldman Sachs Group Inc | Call | 0 | -100,00 | 0 | -100,00 | |||
| 2026-02-13 | 13F | Van Eck Associates Corp | 85.128 | -10,48 | 12 | -7,69 | ||||
| 2026-04-17 | 13F | PKO Investment Management Joint-Stock Co | 1.400 | 7,69 | 184 | 0,00 | ||||
| 2026-02-13 | 13F | Rice Hall James & Associates, Llc | 98.020 | -1,45 | 13.902 | -0,43 | ||||
| 2026-04-17 | 13F | Bell Investment Advisors, Inc | 67 | 76,32 | 9 | 60,00 | ||||
| 2026-02-13 | 13F | Commerce Bank | 1.612 | 2,03 | 229 | 3,17 | ||||
| 2026-02-12 | 13F | Ci Investments Inc. | 2.735 | -2,18 | 388 | |||||
| 2025-11-06 | 13F | Bryce Point Capital, LLC | 4.254 | 597 | ||||||
| 2026-01-08 | 13F | Nordea Investment Management Ab | 27.202 | 81,26 | 3.834 | 84,95 | ||||
| 2026-02-17 | 13F | SummitTX Capital, L.P. | 0 | -100,00 | 0 | |||||
| 2026-04-06 | 13F | Private Client Services, Llc | 12.466 | 1.642 | ||||||
| 2026-02-17 | 13F | SageView Advisory Group, LLC | 579 | 82 | ||||||
| 2026-02-05 | 13F | Elyxium Wealth, LLC | 104 | 15 | ||||||
| 2026-02-13 | 13F | Boston Partners | 54.472 | 7.725 | ||||||
| 2026-02-06 | 13F | Gsa Capital Partners Llp | 3.774 | 58,11 | 1 | |||||
| 2026-02-17 | 13F | Siemens Fonds Invest GmbH | 1.392 | 0,00 | 196 | 0,51 | ||||
| 2026-02-12 | 13F | Voya Investment Management Llc | 90.640 | -0,70 | 12.855 | 0,33 | ||||
| 2026-02-09 | 13F | AIA Group Ltd | 1.439 | -6,98 | 204 | -5,99 | ||||
| 2026-02-17 | 13F | Caisse De Depot Et Placement Du Quebec | 62.913 | 8.923 | ||||||
| 2026-02-17 | 13F | Virtus Investment Advisers, Inc. | 4.472 | 25,79 | 634 | 27,05 | ||||
| 2026-02-17 | 13F | Oddo Bhf Asset Management Sas | 7.620 | 35,59 | 1.081 | 37,06 | ||||
| 2026-01-27 | 13F/A | Capital Performance Advisors Llp | 2.636 | 6,94 | 374 | 7,80 | ||||
| 2026-02-10 | 13F | New Mexico Educational Retirement Board | 19.700 | 0,00 | 3 | 0,00 | ||||
| 2026-02-12 | 13F | DRW Securities, LLC | 2.811 | 399 | ||||||
| 2026-02-06 | 13F | HighTower Advisors, LLC | 12.271 | 29,87 | 1.740 | 31,22 | ||||
| 2026-02-17 | 13F | Grantham, Mayo, Van Otterloo & Co. LLC | 7.133 | 1.012 | ||||||
| 2026-02-06 | 13F | Meiji Yasuda Asset Management Co Ltd. | 5.285 | -1,75 | 750 | -0,79 | ||||
| 2026-02-17 | 13F | Qube Research & Technologies Ltd | 91.514 | 12.979 | ||||||
| 2026-02-18 | 13F | Vident Advisory, LLC | 1.631 | -11,93 | 231 | -10,81 | ||||
| 2026-02-13 | 13F | Arrowstreet Capital, Limited Partnership | 360.711 | -12,38 | 51.160 | -11,47 | ||||
| 2026-02-10 | 13F | Mutual Of America Capital Management Llc | 41.495 | -9,41 | 5.885 | -8,48 | ||||
| 2026-02-17 | 13F | Cetera Investment Advisers | 13.489 | 2,80 | 1.913 | 3,91 | ||||
| 2026-02-04 | 13F | Summit Wealth Group Llc / Co | 0 | -100,00 | 0 | -100,00 | ||||
| 2026-04-09 | 13F | Tealwood Asset Management Inc | 11.023 | -0,58 | 1 | 0,00 | ||||
| 2026-02-11 | 13F | Parallel Advisors, LLC | 1.581 | -3,12 | 224 | -2,18 | ||||
| 2026-02-13 | 13F | Truvestments Capital Llc | 52 | -29,73 | 7 | -30,00 | ||||
| 2025-11-13 | 13F | Diametric Capital, LP | 0 | -100,00 | 0 | |||||
| 2025-11-14 | 13F | Teza Capital Management LLC | 0 | -100,00 | 0 | -100,00 | ||||
| 2026-02-13 | 13F | Macquarie Group Ltd | 11.020 | -96,51 | 1.563 | -96,47 | ||||
| 2026-02-11 | 13F | Renaissance Group Llc | 252.293 | 0,26 | 35.783 | 1,30 | ||||
| 2026-02-06 | 13F | Evoke Wealth, Llc | 2.200 | 2,52 | 312 | 3,65 | ||||
| 2026-02-09 | 13F | Hantz Financial Services, Inc. | 3.354 | 67,28 | 0 | |||||
| 2026-02-17 | 13F | PDT Partners, LLC | 28.781 | -30,82 | 4.082 | -30,10 | ||||
| 2026-03-06 | 13F | Hsbc Holdings Plc | 68.292 | -62,82 | 9.685 | -62,43 | ||||
| 2026-02-11 | 13F | Manchester Capital Management LLC | 11 | 2 | ||||||
| 2026-02-13 | 13F | BRITISH COLUMBIA INVESTMENT MANAGEMENT Corp | 17.534 | 23,27 | 2.487 | 24,55 | ||||
| 2026-02-11 | 13F | Winton Capital Group Ltd | 0 | -100,00 | 0 | |||||
| 2026-02-09 | 13F | Jefferies Financial Group Inc. | 45.976 | 6.521 | ||||||
| 2026-02-12 | 13F | Caerus Investment Advisors, LLC | 5.252 | 10,97 | 745 | 12,05 | ||||
| 2026-02-12 | 13F | CIBC Private Wealth Group, LLC | 7.726 | -3,20 | 1.096 | -2,23 | ||||
| 2026-02-05 | 13F | Vienna Powszechne Towarzystwo Emerytalne S.A. Vienna Insurance Group | 30.400 | 0,00 | 4.312 | 1,03 | ||||
| 2026-02-17 | 13F | Boone Capital Management Llc | 151.815 | -8,77 | 21.532 | -7,83 | ||||
| 2026-04-07 | 13F | CoreCap Advisors, LLC | 16 | 0,00 | 2 | 0,00 | ||||
| 2026-02-12 | 13F | Brinker Capital Investments, LLC | 29.669 | -3,29 | 4.208 | -2,30 | ||||
| 2026-04-07 | 13F | Park Avenue Securities Llc | 7.747 | -6,55 | 1 | 0,00 | ||||
| 2026-01-13 | 13F | Trust Point Inc. | 0 | -100,00 | 0 | |||||
| 2026-01-14 | 13F | Hennion & Walsh Asset Management, Inc. | 5.990 | -2,33 | 850 | -1,28 | ||||
| 2026-01-22 | 13F | Jackson Thornton Asset Management, Llc | 3.508 | 4,06 | 482 | 2,78 | ||||
| 2026-02-13 | 13F | Towarzystwo Funduszy Inwestycyjnych Pzu Sa | 0 | -100,00 | 0 | |||||
| 2025-10-30 | 13F | Twin Peaks Wealth Advisors, LLC | 0 | -100,00 | 0 | -100,00 | ||||
| 2026-02-09 | 13F | Hartland & Co., LLC | 3.085 | 134,78 | 438 | 137,50 | ||||
| 2025-11-06 | 13F | CAPROCK Group, Inc. | 0 | -100,00 | 0 | |||||
| 2026-02-10 | 13F | Machina Capital S.a.s. | 3.168 | 449 |