Grundlæggende statistik
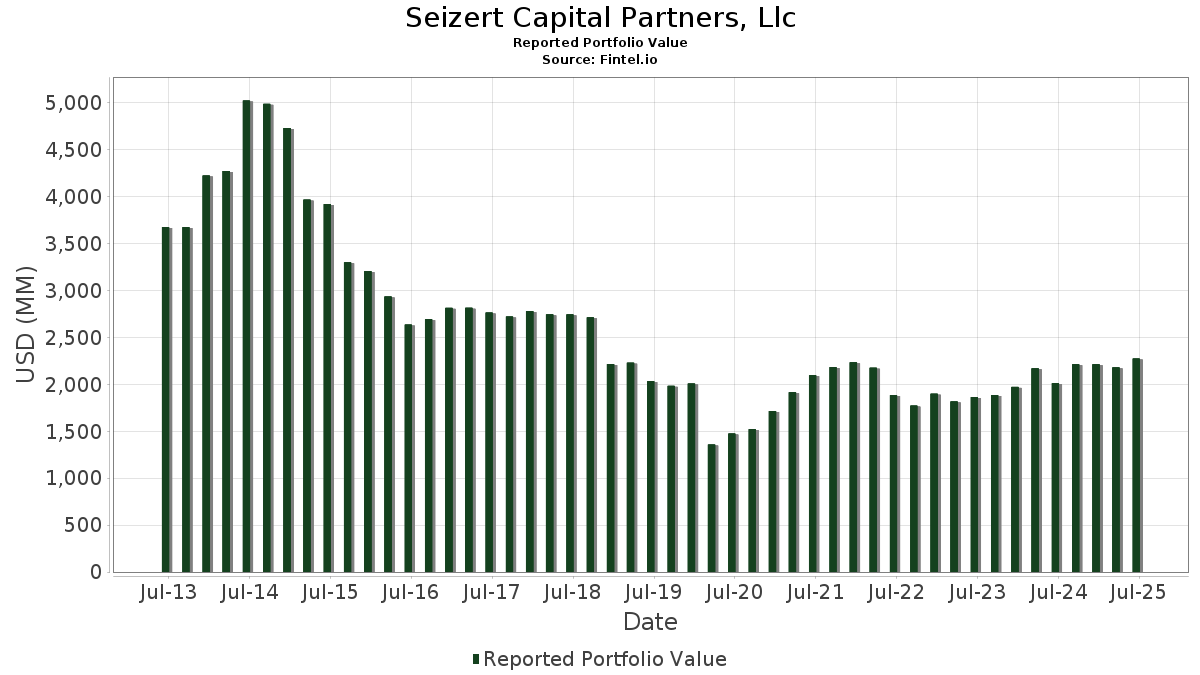
| Porteføljeværdi | $ 2.275.066.029 |
| Nuværende stillinger | 172 |
Seneste beholdninger, ydeevne, AUM (fra 13F, 13D)
Seizert Capital Partners, Llc har afsløret 172 samlede besiddelser i deres seneste SEC-arkivering. Den seneste porteføljeværdi er beregnet til at være $ 2.275.066.029 USD. Faktiske aktiver under forvaltning (AUM) er denne værdi plus kontanter (som ikke er oplyst). Seizert Capital Partners, Llcs største beholdninger er JPMorgan Chase & Co. (US:JPM) , The Goldman Sachs Group, Inc. (US:GS) , Wells Fargo & Company (US:WFC) , PayPal Holdings, Inc. (US:PYPL) , and QUALCOMM Incorporated (US:QCOM) . Seizert Capital Partners, Llcs nye stillinger omfatter Crown Holdings, Inc. (US:CCK) , SS&C Technologies Holdings, Inc. (US:SSNC) , Maplebear Inc. (US:CART) , Adobe Inc. (US:ADBE) , and Synchrony Financial (US:SYF) .
Top øger dette kvartal
Vi bruger ændringen i porteføljeallokeringen, fordi dette er den mest meningsfulde metrik. Ændringer kan skyldes handler eller ændringer i aktiekurser.
| Sikkerhed | Aktier (MM) |
Værdi (MM$) |
Portefølje % | ΔPortefølje % |
|---|---|---|---|---|
| 0,13 | 42,09 | 1,8498 | 1,8498 | |
| 0,30 | 52,07 | 2,2888 | 1,5886 | |
| 0,31 | 31,51 | 1,3852 | 1,3852 | |
| 0,38 | 31,50 | 1,3846 | 1,3846 | |
| 0,83 | 61,97 | 2,7237 | 0,6865 | |
| 0,52 | 55,56 | 2,4423 | 0,6445 | |
| 0,10 | 72,01 | 3,1650 | 0,6196 | |
| 0,28 | 80,91 | 3,5564 | 0,4282 | |
| 0,21 | 14,17 | 0,6228 | 0,3937 | |
| 0,37 | 58,31 | 2,5630 | 0,2899 |
Top falder i dette kvartal
Vi bruger ændringen i porteføljeallokeringen, fordi dette er den mest meningsfulde metrik. Ændringer kan skyldes handler eller ændringer i aktiekurser.
| Sikkerhed | Aktier (MM) |
Værdi (MM$) |
Portefølje % | ΔPortefølje % |
|---|---|---|---|---|
| 0,15 | 10,63 | 0,4674 | -1,3474 | |
| 0,68 | 47,32 | 2,0797 | -1,1750 | |
| 0,11 | 54,54 | 2,3972 | -1,1317 | |
| 0,19 | 58,14 | 2,5556 | -0,8263 | |
| 0,53 | 21,64 | 0,9513 | -0,5629 | |
| 0,71 | 32,99 | 1,4503 | -0,5176 | |
| 0,16 | 45,49 | 1,9997 | -0,4988 | |
| 1,52 | 56,10 | 2,4660 | -0,4690 | |
| 1,82 | 39,23 | 1,7242 | -0,4599 | |
| 0,09 | 45,14 | 1,9841 | -0,4203 |
13F og Fondsarkivering
Denne formular blev indsendt den 2025-08-11 for rapporteringsperioden 2025-06-30. Klik på linkikonet for at se den fulde transaktionshistorik.
Opgrader for at låse op for premium-data og eksportere til Excel ![]() .
.
| Sikkerhed | Type | Gennemsnitlig aktiekurs | Aktier (MM) |
Δ Aktier (%) |
Δ Aktier (%) |
Værdi ($MM) |
Portefølje (%) |
ΔPortefølje (%) |
|
|---|---|---|---|---|---|---|---|---|---|
| JPM / JPMorgan Chase & Co. | 0,28 | 0,35 | 80,91 | 18,61 | 3,5564 | 0,4282 | |||
| GS / The Goldman Sachs Group, Inc. | 0,10 | 0,13 | 72,01 | 29,72 | 3,1650 | 0,6196 | |||
| WFC / Wells Fargo & Company | 0,85 | 0,73 | 67,73 | 12,41 | 2,9771 | 0,2142 | |||
| PYPL / PayPal Holdings, Inc. | 0,83 | 22,46 | 61,97 | 39,48 | 2,7237 | 0,6865 | |||
| QCOM / QUALCOMM Incorporated | 0,37 | 13,46 | 58,31 | 17,63 | 2,5630 | 0,2899 | |||
| AYI / Acuity Inc. | 0,19 | -30,41 | 58,14 | -21,16 | 2,5556 | -0,8263 | |||
| ALSN / Allison Transmission Holdings, Inc. | 0,61 | 0,72 | 57,99 | 0,00 | 2,5490 | -0,1102 | |||
| LKQ / LKQ Corporation | 1,52 | 0,75 | 56,10 | -12,34 | 2,4660 | -0,4690 | |||
| NTAP / NetApp, Inc. | 0,52 | 16,84 | 55,56 | 41,72 | 2,4423 | 0,6445 | |||
| BRK.B / Berkshire Hathaway Inc. | 0,11 | -22,30 | 54,54 | -29,13 | 2,3972 | -1,1317 | |||
| MTCH / Match Group, Inc. | 1,77 | 15,54 | 54,53 | 14,39 | 2,3969 | 0,2109 | |||
| DBX / Dropbox, Inc. | 1,91 | 1,37 | 54,48 | 8,54 | 2,3949 | 0,0930 | |||
| GOOGL / Alphabet Inc. | 0,30 | 199,21 | 52,07 | 240,99 | 2,2888 | 1,5886 | |||
| ELV / Elevance Health, Inc. | 0,13 | 0,06 | 52,06 | -10,52 | 2,2884 | -0,3798 | |||
| CI / The Cigna Group | 0,15 | -0,32 | 49,75 | 0,16 | 2,1867 | -0,0909 | |||
| SYY / Sysco Corporation | 0,63 | 16,04 | 48,07 | 17,12 | 2,1130 | 0,2308 | |||
| CSCO / Cisco Systems, Inc. | 0,68 | -40,71 | 47,32 | -33,34 | 2,0797 | -1,1750 | |||
| SIRI / Sirius XM Holdings Inc. | 2,04 | -10,49 | 46,90 | -8,80 | 2,0615 | -0,2968 | |||
| DOX / Amdocs Limited | 0,51 | -5,53 | 46,37 | -5,80 | 2,0381 | -0,2190 | |||
| BAC / Bank of America Corporation | 0,96 | 0,87 | 45,64 | 14,39 | 2,0062 | 0,1765 | |||
| AMGN / Amgen Inc. | 0,16 | -6,83 | 45,49 | -16,50 | 1,9997 | -0,4988 | |||
| REGN / Regeneron Pharmaceuticals, Inc. | 0,09 | 4,00 | 45,14 | -13,91 | 1,9841 | -0,4203 | |||
| WMT / Walmart Inc. | 0,46 | -0,08 | 44,85 | 11,29 | 1,9712 | 0,1233 | |||
| WCC / WESCO International, Inc. | 0,24 | -17,88 | 44,78 | -2,07 | 1,9681 | -0,1285 | |||
| EXPE / Expedia Group, Inc. | 0,25 | 10,38 | 42,26 | 10,76 | 1,8574 | 0,1079 | |||
| UNH / UnitedHealth Group Incorporated | 0,13 | 42,09 | 1,8498 | 1,8498 | |||||
| COF / Capital One Financial Corporation | 0,19 | 0,88 | 40,34 | 19,71 | 1,7731 | 0,2279 | |||
| PRGS / Progress Software Corporation | 0,62 | 0,29 | 39,54 | 24,30 | 1,7379 | 0,2793 | |||
| ACI / Albertsons Companies, Inc. | 1,82 | -15,80 | 39,23 | -17,64 | 1,7242 | -0,4599 | |||
| MAS / Masco Corporation | 0,60 | 0,87 | 38,55 | -6,64 | 1,6945 | -0,1990 | |||
| JNJ / Johnson & Johnson | 0,24 | -0,59 | 37,23 | -8,43 | 1,6363 | -0,2280 | |||
| UTHR / United Therapeutics Corporation | 0,13 | 2,93 | 36,07 | -4,06 | 1,5856 | -0,1385 | |||
| BLDR / Builders FirstSource, Inc. | 0,30 | 0,94 | 35,12 | -5,73 | 1,5438 | -0,1646 | |||
| BMY / Bristol-Myers Squibb Company | 0,71 | 1,30 | 32,99 | -23,11 | 1,4503 | -0,5176 | |||
| CCK / Crown Holdings, Inc. | 0,31 | 31,51 | 1,3852 | 1,3852 | |||||
| SSNC / SS&C Technologies Holdings, Inc. | 0,38 | 31,50 | 1,3846 | 1,3846 | |||||
| RHI / Robert Half Inc. | 0,53 | -12,90 | 21,64 | -34,46 | 0,9513 | -0,5629 | |||
| LDOS / Leidos Holdings, Inc. | 0,12 | -0,91 | 19,19 | 15,85 | 0,8433 | 0,0839 | |||
| CHKP / Check Point Software Technologies Ltd. | 0,08 | -18,80 | 18,21 | -21,18 | 0,8005 | -0,2590 | |||
| META / Meta Platforms, Inc. | 0,02 | 1,39 | 17,29 | 29,85 | 0,7599 | 0,1494 | |||
| EXEL / Exelixis, Inc. | 0,35 | -8,06 | 15,30 | 9,75 | 0,6724 | 0,0333 | |||
| MSFT / Microsoft Corporation | 0,03 | -2,97 | 14,42 | 28,57 | 0,6340 | 0,1196 | |||
| BRC / Brady Corporation | 0,21 | 194,80 | 14,17 | 183,66 | 0,6228 | 0,3937 | |||
| FFIV / F5, Inc. | 0,05 | -2,54 | 13,60 | 7,72 | 0,5977 | 0,0189 | |||
| TROW / T. Rowe Price Group, Inc. | 0,13 | -7,55 | 12,11 | -2,89 | 0,5321 | -0,0395 | |||
| GHC / Graham Holdings Company | 0,01 | -0,11 | 11,62 | -1,63 | 0,5107 | -0,0310 | |||
| LRCX / Lam Research Corporation | 0,12 | 23,26 | 11,50 | 65,05 | 0,5057 | 0,1860 | |||
| EME / EMCOR Group, Inc. | 0,02 | 1,57 | 11,33 | 47,00 | 0,4981 | 0,1446 | |||
| CVS / CVS Health Corporation | 0,15 | -73,61 | 10,63 | -73,13 | 0,4674 | -1,3474 | |||
| MKL / Markel Group Inc. | 0,01 | -8,83 | 10,46 | -2,60 | 0,4597 | -0,0327 | |||
| ADSK / Autodesk, Inc. | 0,03 | -4,10 | 9,67 | 13,40 | 0,4252 | 0,0340 | |||
| DCI / Donaldson Company, Inc. | 0,14 | 133,11 | 9,43 | 141,13 | 0,4146 | 0,2352 | |||
| FOXA / Fox Corporation | 0,16 | 1,87 | 9,16 | 0,87 | 0,4025 | -0,0138 | |||
| BIIB / Biogen Inc. | 0,07 | 31,29 | 8,32 | 20,50 | 0,3657 | 0,0491 | |||
| AAPL / Apple Inc. | 0,04 | -3,94 | 7,61 | -11,27 | 0,3344 | -0,0588 | |||
| BKNG / Booking Holdings Inc. | 0,00 | -35,64 | 7,42 | -19,13 | 0,3262 | -0,0946 | |||
| AXP / American Express Company | 0,02 | -3,85 | 7,42 | 13,99 | 0,3260 | 0,0276 | |||
| AIT / Applied Industrial Technologies, Inc. | 0,03 | -41,37 | 7,32 | -39,52 | 0,3217 | -0,2332 | |||
| AOS / A. O. Smith Corporation | 0,11 | -4,09 | 7,27 | -3,78 | 0,3196 | -0,0269 | |||
| ZBRA / Zebra Technologies Corporation | 0,02 | -3,92 | 6,38 | 4,85 | 0,2803 | 0,0014 | |||
| CART / Maplebear Inc. | 0,14 | 6,33 | 0,2781 | 0,2781 | |||||
| ITRN / Ituran Location and Control Ltd. | 0,16 | 2,28 | 6,24 | 9,55 | 0,2743 | 0,0131 | |||
| STRL / Sterling Infrastructure, Inc. | 0,03 | -35,01 | 5,91 | 32,46 | 0,2599 | 0,0552 | |||
| ADBE / Adobe Inc. | 0,01 | 5,80 | 0,2549 | 0,2549 | |||||
| LENB / Lennar Corp. - Class B | 0,05 | -6,13 | 5,72 | -9,43 | 0,2513 | -0,0381 | |||
| GIL / Gildan Activewear Inc. | 0,11 | 2,28 | 5,64 | 13,89 | 0,2479 | 0,0208 | |||
| SPNS / Sapiens International Corporation N.V. | 0,19 | 2,27 | 5,64 | 10,42 | 0,2479 | 0,0137 | |||
| ALNT / Allient Inc. | 0,15 | 2,27 | 5,60 | 68,93 | 0,2460 | 0,0941 | |||
| SAIC / Science Applications International Corporation | 0,05 | 2,31 | 5,57 | 2,64 | 0,2448 | -0,0041 | |||
| GTX / Garrett Motion Inc. | 0,52 | -19,63 | 5,43 | 0,93 | 0,2385 | -0,0080 | |||
| GILD / Gilead Sciences, Inc. | 0,05 | 0,00 | 5,24 | -1,06 | 0,2303 | -0,0125 | |||
| ACIW / ACI Worldwide, Inc. | 0,11 | 2,30 | 5,22 | -14,16 | 0,2295 | -0,0494 | |||
| NOMD / Nomad Foods Limited | 0,31 | 2,28 | 5,22 | -11,57 | 0,2294 | -0,0412 | |||
| CWCO / Consolidated Water Co. Ltd. | 0,15 | 2,27 | 4,62 | 25,36 | 0,2032 | 0,0341 | |||
| ALRM / Alarm.com Holdings, Inc. | 0,08 | 2,27 | 4,61 | 3,97 | 0,2025 | -0,0007 | |||
| PBH / Prestige Consumer Healthcare Inc. | 0,06 | 2,29 | 4,58 | -5,00 | 0,2014 | -0,0198 | |||
| MLI / Mueller Industries, Inc. | 0,06 | 0,12 | 4,54 | 4,49 | 0,1994 | 0,0003 | |||
| CAT / Caterpillar Inc. | 0,01 | 2,43 | 4,53 | 20,56 | 0,1993 | 0,0268 | |||
| VNT / Vontier Corporation | 0,12 | 2,30 | 4,53 | 14,93 | 0,1989 | 0,0183 | |||
| ESNT / Essent Group Ltd. | 0,07 | 2,27 | 4,49 | 7,60 | 0,1972 | 0,0060 | |||
| SNA / Snap-on Incorporated | 0,01 | 0,13 | 4,48 | -7,54 | 0,1967 | -0,0253 | |||
| SOLV / Solventum Corporation | 0,06 | 0,12 | 4,45 | -0,16 | 0,1954 | -0,0087 | |||
| INCY / Incyte Corporation | 0,06 | 27,87 | 4,40 | 43,83 | 0,1936 | 0,0532 | |||
| CTSH / Cognizant Technology Solutions Corporation | 0,06 | 0,12 | 4,37 | 2,13 | 0,1919 | -0,0041 | |||
| CRDA / Crawford & Co. - Class A | 0,41 | -21,92 | 4,34 | -27,67 | 0,1908 | -0,0844 | |||
| CNC / Centene Corporation | 0,08 | 0,12 | 4,14 | -10,48 | 0,1820 | -0,0301 | |||
| ZION / Zions Bancorporation, National Association | 0,08 | -1,21 | 4,10 | 2,94 | 0,1804 | -0,0025 | |||
| UFPI / UFP Industries, Inc. | 0,04 | 2,28 | 4,00 | -5,06 | 0,1757 | -0,0174 | |||
| SYF / Synchrony Financial | 0,06 | 3,88 | 0,1706 | 0,1706 | |||||
| GTES / Gates Industrial Corporation plc | 0,17 | 2,27 | 3,88 | 27,94 | 0,1705 | 0,0315 | |||
| VCTR / Victory Capital Holdings, Inc. | 0,06 | 2,27 | 3,87 | 12,51 | 0,1700 | 0,0124 | |||
| ENR / Energizer Holdings, Inc. | 0,18 | 2,28 | 3,65 | -31,09 | 0,1606 | -0,0825 | |||
| AMAL / Amalgamated Financial Corp. | 0,11 | 2,27 | 3,58 | 11,00 | 0,1575 | 0,0095 | |||
| NATL / NCR Atleos Corporation | 0,12 | 62,96 | 3,53 | 76,31 | 0,1551 | 0,0633 | |||
| VIRT / Virtu Financial, Inc. | 0,08 | -29,15 | 3,45 | -16,74 | 0,1515 | -0,0383 | |||
| ICFI / ICF International, Inc. | 0,04 | 2,27 | 3,43 | 1,96 | 0,1509 | -0,0035 | |||
| PLUS / ePlus inc. | 0,05 | 2,29 | 3,38 | 20,82 | 0,1485 | 0,0203 | |||
| CSGS / CSG Systems International, Inc. | 0,05 | 51,14 | 3,27 | 63,24 | 0,1439 | 0,0519 | |||
| VMI / Valmont Industries, Inc. | 0,01 | 62,45 | 3,22 | 85,97 | 0,1416 | 0,0621 | |||
| PFE / Pfizer Inc. | 0,12 | 0,00 | 2,96 | -4,36 | 0,1302 | -0,0118 | |||
| CRTO / Criteo S.A. - Depositary Receipt (Common Stock) | 0,12 | 2,27 | 2,96 | -30,81 | 0,1302 | -0,0661 | |||
| WLY / John Wiley & Sons, Inc. | 0,06 | 2,28 | 2,88 | 2,45 | 0,1268 | -0,0023 | |||
| IMXI / International Money Express, Inc. | 0,28 | 1,83 | 2,80 | -18,58 | 0,1229 | -0,0346 | |||
| EOG / EOG Resources, Inc. | 0,02 | 0,00 | 2,71 | -6,74 | 0,1192 | -0,0141 | |||
| EA / Electronic Arts Inc. | 0,02 | -41,99 | 2,62 | -35,90 | 0,1150 | -0,0722 | |||
| FHI / Federated Hermes, Inc. | 0,06 | 2,48 | 0,1092 | 0,1092 | |||||
| CSV / Carriage Services, Inc. | 0,05 | 2,45 | 0,1076 | 0,1076 | |||||
| ZD / Ziff Davis, Inc. | 0,08 | 2,27 | 2,41 | -17,61 | 0,1059 | -0,0282 | |||
| MAT / Mattel, Inc. | 0,12 | 2,41 | 0,1058 | 0,1058 | |||||
| ROCK / Gibraltar Industries, Inc. | 0,04 | 2,29 | 2,33 | 2,92 | 0,1022 | -0,0014 | |||
| EEFT / Euronet Worldwide, Inc. | 0,02 | 2,21 | 0,0971 | 0,0971 | |||||
| ESAB / ESAB Corporation | 0,02 | 2,28 | 2,05 | 5,82 | 0,0903 | 0,0013 | |||
| OPCH / Option Care Health, Inc. | 0,06 | 1,90 | 0,0835 | 0,0835 | |||||
| ICSH / iShares U.S. ETF Trust - iShares Ultra Short Duration Bond Active ETF | 0,04 | 0,00 | 1,84 | 0,00 | 0,0810 | -0,0035 | |||
| AXS / AXIS Capital Holdings Limited | 0,02 | 1,78 | 0,0783 | 0,0783 | |||||
| AVT / Avnet, Inc. | 0,03 | 1,73 | 0,0760 | 0,0760 | |||||
| QLYS / Qualys, Inc. | 0,01 | 1,70 | 0,0749 | 0,0749 | |||||
| PRDO / Perdoceo Education Corporation | 0,05 | -70,70 | 1,55 | -61,96 | 0,0682 | -0,1189 | |||
| BCO / The Brink's Company | 0,02 | 2,28 | 1,50 | 6,03 | 0,0657 | 0,0010 | |||
| KOP / Koppers Holdings Inc. | 0,04 | 1,19 | 0,0523 | 0,0523 | |||||
| FWONK / Formula One Group | 0,01 | -9,71 | 1,04 | 4,84 | 0,0457 | 0,0002 | |||
| OSPN / OneSpan Inc. | 0,06 | 1,02 | 0,0448 | 0,0448 | |||||
| MTG / MGIC Investment Corporation | 0,03 | 0,97 | 0,0425 | 0,0425 | |||||
| HTB / HomeTrust Bancshares, Inc. | 0,03 | 0,97 | 0,0425 | 0,0425 | |||||
| SMPL / The Simply Good Foods Company | 0,03 | 0,91 | 0,0398 | 0,0398 | |||||
| CMI / Cummins Inc. | 0,00 | -89,11 | 0,84 | -88,63 | 0,0371 | -0,3032 | |||
| COST / Costco Wholesale Corporation | 0,00 | 0,00 | 0,76 | 4,72 | 0,0332 | 0,0001 | |||
| AZO / AutoZone, Inc. | 0,00 | -91,61 | 0,70 | -91,84 | 0,0307 | -0,3610 | |||
| EPC / Edgewell Personal Care Company | 0,03 | 0,69 | 0,0304 | 0,0304 | |||||
| III / Information Services Group, Inc. | 0,10 | -2,39 | 0,48 | 19,95 | 0,0209 | 0,0027 | |||
| BSV / Vanguard Bond Index Funds - Vanguard Short-Term Bond ETF | 0,01 | 0,92 | 0,46 | 1,33 | 0,0202 | -0,0006 | |||
| VGSH / Vanguard Scottsdale Funds - Vanguard Short-Term Treasury ETF | 0,01 | 0,00 | 0,46 | 0,00 | 0,0202 | -0,0008 | |||
| VCSH / Vanguard Scottsdale Funds - Vanguard Short-Term Corporate Bond ETF | 0,01 | 1,11 | 0,45 | 1,81 | 0,0198 | -0,0005 | |||
| DGII / Digi International Inc. | 0,01 | -2,40 | 0,44 | 22,16 | 0,0194 | 0,0028 | |||
| TCBX / Third Coast Bancshares, Inc. | 0,01 | -2,39 | 0,44 | -4,60 | 0,0192 | -0,0018 | |||
| NATH / Nathan's Famous, Inc. | 0,00 | -13,10 | 0,43 | -0,23 | 0,0190 | -0,0009 | |||
| LBRDK / Liberty Broadband Corporation | 0,00 | -19,09 | 0,41 | -6,41 | 0,0180 | -0,0021 | |||
| EBF / Ennis, Inc. | 0,02 | -1,93 | 0,41 | -11,47 | 0,0180 | -0,0032 | |||
| ACEL / Accel Entertainment, Inc. | 0,03 | -2,39 | 0,39 | 15,82 | 0,0171 | 0,0017 | |||
| OVLY / Oak Valley Bancorp | 0,01 | -2,39 | 0,39 | 6,63 | 0,0170 | 0,0004 | |||
| EGAN / eGain Corporation | 0,06 | -2,39 | 0,36 | 25,78 | 0,0159 | 0,0027 | |||
| CRAI / CRA International, Inc. | 0,00 | -2,42 | 0,34 | 5,59 | 0,0150 | 0,0002 | |||
| RLGT / Radiant Logistics, Inc. | 0,06 | -2,39 | 0,34 | -3,45 | 0,0148 | -0,0012 | |||
| KRT / Karat Packaging Inc. | 0,01 | 16,58 | 0,33 | 23,51 | 0,0145 | 0,0023 | |||
| NRC / National Research Corporation | 0,02 | -2,39 | 0,33 | 28,35 | 0,0143 | 0,0027 | |||
| ATEN / A10 Networks, Inc. | 0,02 | -2,40 | 0,32 | 15,71 | 0,0143 | 0,0014 | |||
| UTMD / Utah Medical Products, Inc. | 0,01 | -2,39 | 0,31 | -0,96 | 0,0136 | -0,0007 | |||
| HDSN / Hudson Technologies, Inc. | 0,04 | -2,39 | 0,31 | 28,33 | 0,0136 | 0,0025 | |||
| WINA / Winmark Corporation | 0,00 | -2,40 | 0,31 | 15,91 | 0,0135 | 0,0014 | |||
| HSTM / HealthStream, Inc. | 0,01 | -2,38 | 0,30 | -16,16 | 0,0132 | -0,0032 | |||
| TGT / Target Corporation | 0,00 | -93,64 | 0,30 | -94,00 | 0,0131 | -0,2146 | |||
| HCKT / The Hackett Group, Inc. | 0,01 | -2,40 | 0,30 | -15,10 | 0,0131 | -0,0030 | |||
| MRK / Merck & Co., Inc. | 0,00 | 0,00 | 0,29 | -11,71 | 0,0129 | -0,0024 | |||
| ADP / Automatic Data Processing, Inc. | 0,00 | 0,00 | 0,29 | 1,05 | 0,0128 | -0,0004 | |||
| AHCO / AdaptHealth Corp. | 0,03 | -2,39 | 0,28 | -15,27 | 0,0125 | -0,0029 | |||
| WNEB / Western New England Bancorp, Inc. | 0,03 | -25,20 | 0,27 | -25,82 | 0,0120 | -0,0049 | |||
| PKBK / Parke Bancorp, Inc. | 0,01 | -2,39 | 0,27 | 5,84 | 0,0120 | 0,0001 | |||
| SCSC / ScanSource, Inc. | 0,01 | -2,39 | 0,27 | 20,09 | 0,0118 | 0,0015 | |||
| AVAH / Aveanna Healthcare Holdings Inc. | 0,05 | 39,09 | 0,26 | 34,01 | 0,0116 | 0,0026 | |||
| VRTS / Virtus Investment Partners, Inc. | 0,00 | -2,39 | 0,26 | 2,78 | 0,0114 | -0,0002 | |||
| TPB / Turning Point Brands, Inc. | 0,00 | -57,74 | 0,25 | -46,22 | 0,0110 | -0,0103 | |||
| MCK / McKesson Corporation | 0,00 | 0,00 | 0,24 | 9,01 | 0,0107 | 0,0004 | |||
| PG / The Procter & Gamble Company | 0,00 | 0,00 | 0,24 | -6,67 | 0,0105 | -0,0012 | |||
| TSBK / Timberland Bancorp, Inc. | 0,01 | 0,23 | 0,0102 | 0,0102 | |||||
| DOLE / Dole plc | 0,02 | -23,24 | 0,23 | -25,82 | 0,0100 | -0,0040 | |||
| ADEA / Adeia Inc. | 0,02 | -2,39 | 0,22 | 4,25 | 0,0097 | 0,0000 | |||
| ORCL / Oracle Corporation | 0,00 | 0,22 | 0,0096 | 0,0096 | |||||
| GTY / Getty Realty Corp. | 0,01 | -27,28 | 0,22 | -35,42 | 0,0095 | -0,0059 | |||
| BVS / Bioventus Inc. | 0,02 | 66,35 | 0,16 | 19,85 | 0,0072 | 0,0010 | |||
| TCMD / Tactile Systems Technology, Inc. | 0,02 | -2,39 | 0,16 | -25,00 | 0,0071 | -0,0028 | |||
| HLIT / Harmonic Inc. | 0,01 | 0,14 | 0,0061 | 0,0061 | |||||
| JBI / Janus International Group, Inc. | 0,02 | 0,13 | 0,0055 | 0,0055 | |||||
| CBNK / Capital Bancorp, Inc. | 0,00 | -100,00 | 0,00 | 0,0000 | |||||
| GDDY / GoDaddy Inc. | 0,00 | -100,00 | 0,00 | 0,0000 | |||||
| PCB / PCB Bancorp | 0,00 | -100,00 | 0,00 | 0,0000 | |||||
| LBRDA / Liberty Broadband Corporation | 0,00 | -100,00 | 0,00 | 0,0000 | |||||
| NMIH / NMI Holdings, Inc. | 0,00 | -100,00 | 0,00 | 0,0000 | |||||
| REVG / REV Group, Inc. | 0,00 | -100,00 | 0,00 | 0,0000 | |||||
| ACCO / ACCO Brands Corporation | 0,00 | -100,00 | 0,00 | 0,0000 | |||||
| LIVN / LivaNova PLC | 0,00 | -100,00 | 0,00 | 0,0000 |