Grundlæggende statistik
| Porteføljeværdi | $ 759.083.048 |
| Nuværende stillinger | 80 |
Seneste beholdninger, ydeevne, AUM (fra 13F, 13D)
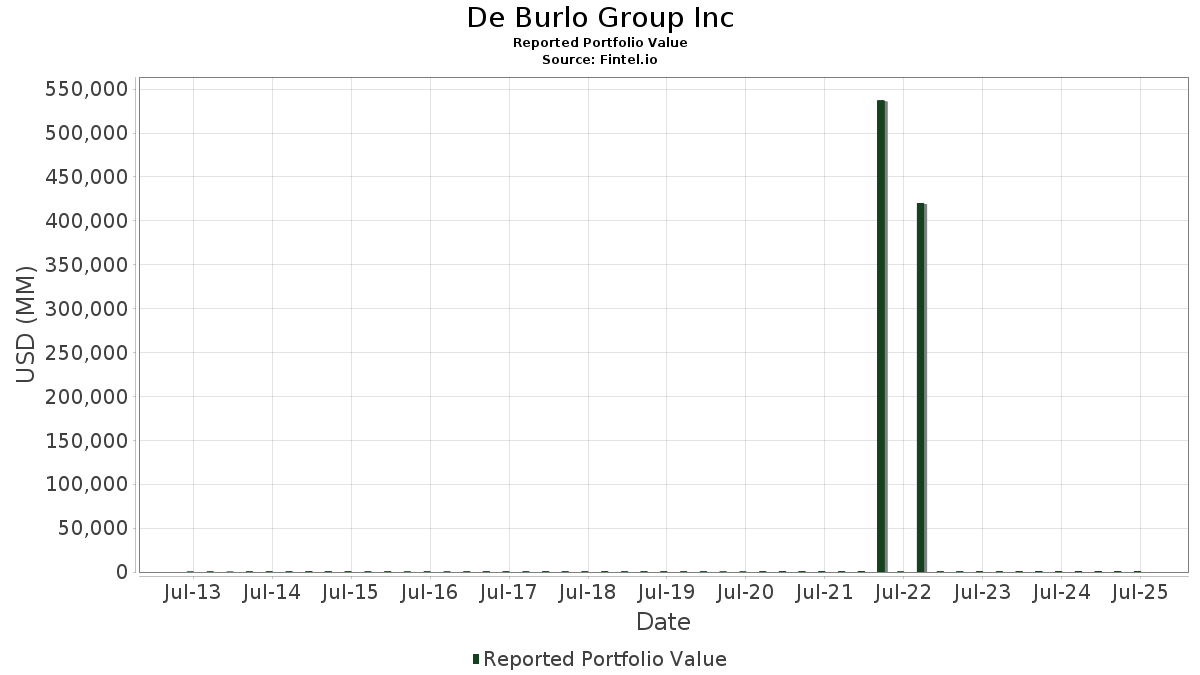
De Burlo Group Inc har afsløret 80 samlede besiddelser i deres seneste SEC-arkivering. Den seneste porteføljeværdi er beregnet til at være $ 759.083.048 USD. Faktiske aktiver under forvaltning (AUM) er denne værdi plus kontanter (som ikke er oplyst). De Burlo Group Incs største beholdninger er Microsoft Corporation (US:MSFT) , Meta Platforms, Inc. (US:META) , Netflix, Inc. (US:NFLX) , Amazon.com, Inc. (US:AMZN) , and Broadcom Inc. (US:AVGO) . De Burlo Group Incs nye stillinger omfatter MercadoLibre, Inc. (US:MELI) , iShares Trust - iShares MSCI India ETF (US:INDA) , .
Top øger dette kvartal
Vi bruger ændringen i porteføljeallokeringen, fordi dette er den mest meningsfulde metrik. Ændringer kan skyldes handler eller ændringer i aktiekurser.
| Sikkerhed | Aktier (MM) |
Værdi (MM$) |
Portefølje % | ΔPortefølje % |
|---|---|---|---|---|
| 0,21 | 32,61 | 4,2964 | 4,2964 | |
| 0,09 | 42,68 | 5,6222 | 2,3058 | |
| 0,03 | 37,99 | 5,0042 | 1,7204 | |
| 0,08 | 24,15 | 3,1811 | 1,6932 | |
| 0,00 | 12,81 | 1,6871 | 1,6871 | |
| 0,35 | 20,96 | 2,7616 | 1,5106 | |
| 0,01 | 10,83 | 1,4263 | 1,4263 | |
| 0,04 | 10,82 | 1,4249 | 1,4249 | |
| 0,12 | 32,78 | 4,3179 | 1,1945 | |
| 0,07 | 12,16 | 1,6022 | 0,8395 |
Top falder i dette kvartal
Vi bruger ændringen i porteføljeallokeringen, fordi dette er den mest meningsfulde metrik. Ændringer kan skyldes handler eller ændringer i aktiekurser.
| Sikkerhed | Aktier (MM) |
Værdi (MM$) |
Portefølje % | ΔPortefølje % |
|---|---|---|---|---|
| 0,15 | 18,16 | 2,3923 | -1,7931 | |
| 0,33 | 29,61 | 3,9005 | -1,7848 | |
| 0,03 | 4,91 | 0,6470 | -1,4271 | |
| 0,10 | 6,92 | 0,9122 | -1,3759 | |
| 0,06 | 27,49 | 3,6218 | -1,3633 | |
| 0,03 | 22,24 | 2,9296 | -0,9953 | |
| 0,14 | 28,42 | 3,7433 | -0,9221 | |
| 0,15 | 17,35 | 2,2859 | -0,9158 | |
| 0,17 | 36,56 | 4,8158 | -0,8231 | |
| 0,06 | 9,72 | 1,2799 | -0,7539 |
13F og Fondsarkivering
Denne formular blev indsendt den 2025-08-13 for rapporteringsperioden 2025-06-30. Klik på linkikonet for at se den fulde transaktionshistorik.
Opgrader for at låse op for premium-data og eksportere til Excel ![]() .
.
| Sikkerhed | Type | Gennemsnitlig aktiekurs | Aktier (MM) |
Δ Aktier (%) |
Δ Aktier (%) |
Værdi ($MM) |
Portefølje (%) |
ΔPortefølje (%) |
|
|---|---|---|---|---|---|---|---|---|---|
| MSFT / Microsoft Corporation | 0,09 | 43,38 | 42,68 | 90,00 | 5,6222 | 2,3058 | |||
| META / Meta Platforms, Inc. | 0,05 | 0,08 | 38,56 | 28,16 | 5,0795 | 0,6377 | |||
| NFLX / Netflix, Inc. | 0,03 | 18,93 | 37,99 | 70,79 | 5,0042 | 1,7204 | |||
| AMZN / Amazon.com, Inc. | 0,17 | -17,00 | 36,56 | -4,29 | 4,8158 | -0,8231 | |||
| AVGO / Broadcom Inc. | 0,12 | -5,90 | 32,78 | 54,93 | 4,3179 | 1,1945 | |||
| NVDA / NVIDIA Corporation | 0,21 | 32,61 | 4,2964 | 4,2964 | |||||
| ASML / ASML Holding N.V. - Depositary Receipt (Common Stock) | 0,04 | 13,65 | 31,75 | 37,46 | 4,1828 | 0,7725 | |||
| ORLY / O'Reilly Automotive, Inc. | 0,33 | 1.122,10 | 29,61 | -23,11 | 3,9005 | -1,7848 | |||
| AAPL / Apple Inc. | 0,14 | -2,65 | 28,42 | -10,08 | 3,7433 | -0,9221 | |||
| BRK.A / Berkshire Hathaway Inc. | 0,06 | -10,73 | 27,49 | -18,58 | 3,6218 | -1,3633 | |||
| ADSK / Autodesk, Inc. | 0,08 | 102,63 | 24,15 | 139,62 | 3,1811 | 1,6932 | |||
| LLY / Eli Lilly and Company | 0,03 | -11,37 | 22,24 | -16,35 | 2,9296 | -0,9953 | |||
| VRTX / Vertex Pharmaceuticals Incorporated | 0,05 | 0,06 | 21,71 | -8,11 | 2,8601 | -0,6283 | |||
| IEMG / iShares, Inc. - iShares Core MSCI Emerging Markets ETF | 0,35 | 122,42 | 20,96 | 147,40 | 2,7616 | 1,5106 | |||
| GSCE / GS Connect S&P GSCI Enhanced Commodity Total Return ETN | 0,03 | -31,62 | 19,75 | -11,41 | 2,6013 | -0,6894 | |||
| COST / Costco Wholesale Corporation | 0,02 | 0,37 | 19,55 | 5,06 | 2,5754 | -0,1719 | |||
| BKNG / Booking Holdings Inc. | 0,00 | 9,77 | 19,51 | 37,94 | 2,5702 | 0,4821 | |||
| ISRG / Intuitive Surgical, Inc. | 0,04 | 0,00 | 19,51 | 9,72 | 2,5700 | -0,0551 | |||
| KKR / KKR & Co. Inc. | 0,14 | -19,06 | 18,98 | -6,86 | 2,5008 | -0,5084 | |||
| MU / Micron Technology, Inc. | 0,15 | -54,84 | 18,16 | -35,94 | 2,3923 | -1,7931 | |||
| TT / Trane Technologies plc | 0,04 | 0,00 | 17,91 | 29,83 | 2,3597 | 0,3227 | |||
| BABA / Alibaba Group Holding Limited - Depositary Receipt (Common Stock) | 0,15 | -6,71 | 17,35 | -19,99 | 2,2859 | -0,9158 | |||
| MELI / MercadoLibre, Inc. | 0,00 | 12,81 | 1,6871 | 1,6871 | |||||
| GOOGL / Alphabet Inc. | 0,07 | 106,57 | 12,16 | 135,42 | 1,6022 | 0,8395 | |||
| MCK / McKesson Corporation | 0,01 | 10,83 | 1,4263 | 1,4263 | |||||
| RSG / Republic Services, Inc. | 0,04 | 10,82 | 1,4249 | 1,4249 | |||||
| GWW / W.W. Grainger, Inc. | 0,01 | 76,58 | 9,88 | 85,96 | 1,3019 | 0,5172 | |||
| BX / Blackstone Inc. | 0,06 | -34,09 | 9,72 | -29,47 | 1,2799 | -0,7539 | |||
| V / Visa Inc. | 0,02 | -2,08 | 8,28 | -0,79 | 1,0911 | -0,1415 | |||
| MA / Mastercard Incorporated | 0,01 | -2,55 | 7,73 | -0,10 | 1,0180 | -0,1240 | |||
| SWK / Stanley Black & Decker, Inc. | 0,10 | -49,30 | 6,92 | -55,32 | 0,9122 | -1,3759 | |||
| IR / Ingersoll Rand Inc. | 0,08 | -23,32 | 6,75 | -20,31 | 0,8898 | -0,3615 | |||
| ONON / On Holding AG | 0,13 | -36,06 | 6,64 | -24,22 | 0,8743 | -0,4187 | |||
| ABBV / AbbVie Inc. | 0,03 | -2,69 | 4,99 | -13,81 | 0,6572 | -0,1972 | |||
| AMD / Advanced Micro Devices, Inc. | 0,03 | -74,69 | 4,91 | -65,04 | 0,6470 | -1,4271 | |||
| ETN / Eaton Corporation plc | 0,01 | -32,94 | 4,87 | -11,94 | 0,6415 | -0,1748 | |||
| AMP / Ameriprise Financial, Inc. | 0,01 | 0,00 | 4,58 | 10,25 | 0,6040 | -0,0100 | |||
| NOW / ServiceNow, Inc. | 0,00 | -26,27 | 4,47 | -4,79 | 0,5892 | -0,1043 | |||
| DHR / Danaher Corporation | 0,02 | -1,80 | 4,37 | -5,35 | 0,5754 | -0,1061 | |||
| TMO / Thermo Fisher Scientific Inc. | 0,01 | -1,97 | 4,33 | -20,12 | 0,5707 | -0,2300 | |||
| CRM / Salesforce, Inc. | 0,01 | -9,55 | 3,60 | -8,08 | 0,4749 | -0,1041 | |||
| ADBE / Adobe Inc. | 0,01 | -3,94 | 3,49 | -3,11 | 0,4597 | -0,0720 | |||
| INDA / iShares Trust - iShares MSCI India ETF | 0,05 | 3,01 | 0,3961 | 0,3961 | |||||
| JPM / JPMorgan Chase & Co. | 0,01 | -1,35 | 2,76 | 16,58 | 0,3631 | 0,0141 | |||
| CHD / Church & Dwight Co., Inc. | 0,03 | -2,22 | 2,76 | -14,62 | 0,3631 | -0,1136 | |||
| AMT / American Tower Corporation | 0,01 | -3,48 | 2,45 | -1,96 | 0,3232 | -0,0463 | |||
| INTU / Intuit Inc. | 0,00 | -1,94 | 2,39 | 25,80 | 0,3154 | 0,0344 | |||
| GJR / Strats Trust For Procter & Gambel Security - Preferred Security | 0,01 | -2,80 | 2,36 | -9,14 | 0,3103 | -0,0724 | |||
| PANW / Palo Alto Networks, Inc. | 0,01 | -2,85 | 2,19 | 16,46 | 0,2890 | 0,0110 | |||
| EW / Edwards Lifesciences Corporation | 0,02 | 0,62 | 1,48 | 8,59 | 0,1949 | -0,0063 | |||
| ANET / Arista Networks Inc | 0,01 | -0,72 | 1,41 | 31,05 | 0,1864 | 0,0271 | |||
| MASI / Masimo Corporation | 0,01 | -3,57 | 1,36 | -2,64 | 0,1795 | -0,0271 | |||
| SYK / Stryker Corporation | 0,00 | -6,22 | 1,19 | -0,25 | 0,1573 | -0,0196 | |||
| ABT / Abbott Laboratories | 0,01 | -1,74 | 1,15 | 0,70 | 0,1520 | -0,0171 | |||
| MAS / Masco Corporation | 0,02 | -7,77 | 1,15 | -14,68 | 0,1509 | -0,0472 | |||
| AWK / American Water Works Company, Inc. | 0,01 | 0,00 | 0,99 | -5,73 | 0,1303 | -0,0245 | |||
| ADP / Automatic Data Processing, Inc. | 0,00 | 0,00 | 0,89 | 0,91 | 0,1173 | -0,0129 | |||
| ATO / Atmos Energy Corporation | 0,01 | -18,60 | 0,83 | -18,78 | 0,1088 | -0,0415 | |||
| AZN / AstraZeneca PLC - Depositary Receipt (Common Stock) | 0,01 | -8,04 | 0,81 | -12,59 | 0,1070 | -0,0302 | |||
| STE / STERIS plc | 0,00 | -0,90 | 0,80 | 5,01 | 0,1051 | -0,0070 | |||
| SHW / The Sherwin-Williams Company | 0,00 | 0,00 | 0,75 | -1,71 | 0,0984 | -0,0137 | |||
| RGA / Reinsurance Group of America, Incorporated | 0,00 | 0,00 | 0,68 | 0,74 | 0,0893 | -0,0100 | |||
| GILD / Gilead Sciences, Inc. | 0,01 | -14,10 | 0,67 | -15,04 | 0,0886 | -0,0282 | |||
| GIS / General Mills, Inc. | 0,01 | 0,00 | 0,61 | -13,33 | 0,0805 | -0,0236 | |||
| NBIX / Neurocrine Biosciences, Inc. | 0,00 | -1,06 | 0,59 | 12,48 | 0,0773 | 0,0003 | |||
| CI / The Cigna Group | 0,00 | -8,76 | 0,58 | -8,36 | 0,0766 | -0,0171 | |||
| HD / The Home Depot, Inc. | 0,00 | -16,31 | 0,56 | -16,20 | 0,0743 | -0,0252 | |||
| BLD / TopBuild Corp. | 0,00 | -6,42 | 0,56 | -0,71 | 0,0740 | -0,0095 | |||
| ECL / Ecolab Inc. | 0,00 | -2,50 | 0,53 | 3,55 | 0,0692 | -0,0056 | |||
| VLTO / Veralto Corporation | 0,00 | -3,12 | 0,44 | 0,23 | 0,0582 | -0,0068 | |||
| LIN / Linde plc | 0,00 | 0,00 | 0,38 | 0,79 | 0,0507 | -0,0057 | |||
| LPLA / LPL Financial Holdings Inc. | 0,00 | 0,00 | 0,37 | 14,37 | 0,0494 | 0,0011 | |||
| FSLR / First Solar, Inc. | 0,00 | 0,00 | 0,33 | 31,35 | 0,0436 | 0,0063 | |||
| NEE / NextEra Energy, Inc. | 0,00 | 0,00 | 0,31 | -2,19 | 0,0412 | -0,0059 | |||
| ITW / Illinois Tool Works Inc. | 0,00 | 0,09 | 0,29 | -0,35 | 0,0379 | -0,0047 | |||
| FI / Fiserv, Inc. | 0,00 | 0,00 | 0,27 | -22,03 | 0,0355 | -0,0155 | |||
| UNP / Union Pacific Corporation | 0,00 | 0,00 | 0,22 | -2,64 | 0,0292 | -0,0044 | |||
| JNJ / Johnson & Johnson | 0,00 | 0,00 | 0,20 | -8,14 | 0,0268 | -0,0058 | |||
| BAC / Bank of America Corporation | 0,00 | 0,20 | 0,0265 | 0,0265 | |||||
| IART / Integra LifeSciences Holdings Corporation | 0,01 | 0,00 | 0,18 | -44,34 | 0,0234 | -0,0236 | |||
| IWM / iShares Trust - iShares Russell 2000 ETF | 0,00 | -100,00 | 0,00 | 0,0000 | |||||
| KRE / SPDR Series Trust - SPDR S&P Regional Banking ETF | 0,00 | -100,00 | 0,00 | 0,0000 | |||||
| UNH / UnitedHealth Group Incorporated | 0,00 | -100,00 | 0,00 | -100,00 | -0,5490 |