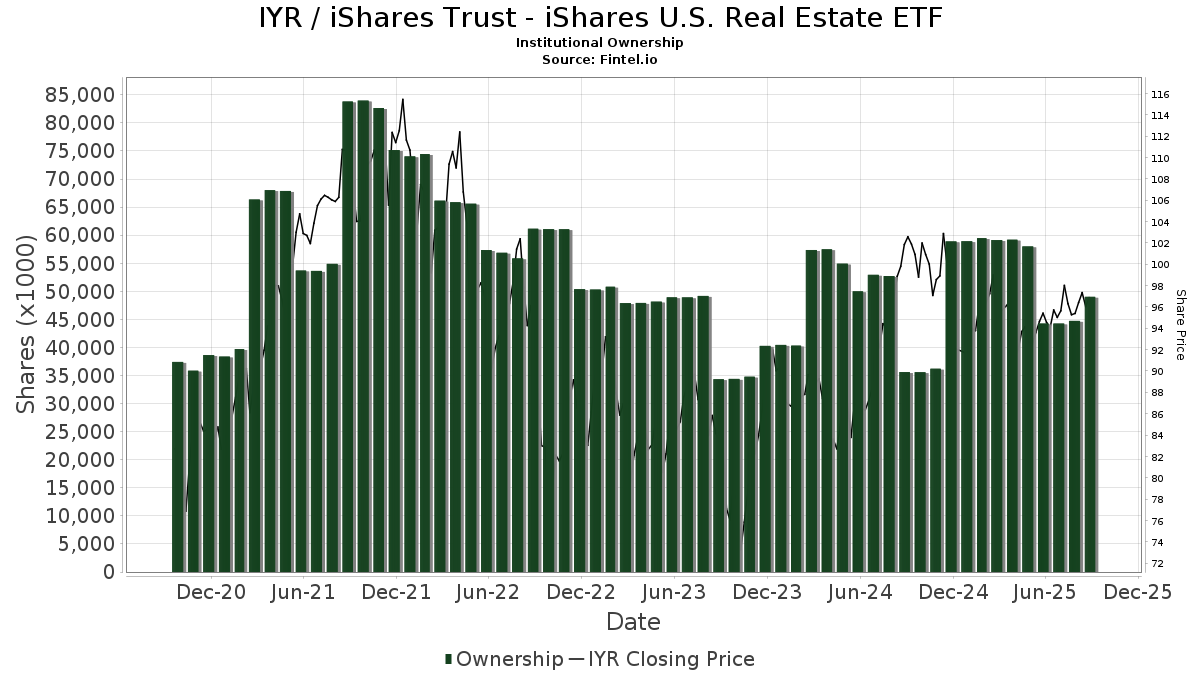
Grundlæggende statistik
| Institutionelle ejere | 487 total, 471 long only, 0 short only, 16 long/short - change of -1,21% MRQ |
| Gennemsnitlig porteføljeallokering | 0.1810 % - change of -3,37% MRQ |
| Institutionelle aktier (lange) | 55.420.018 (ex 13D/G) - change of 4,89MM shares 9,67% MRQ |
| Institutionel værdi (lang) | $ 4.256.145 USD ($1000) |
Institutionelt ejerskab og aktionærer
iShares Trust - iShares U.S. Real Estate ETF (US:IYR) har 487 institutionelle ejere og aktionærer, der har indsendt 13D/G- eller 13F-formularer til Securities Exchange Commission (SEC). Disse institutioner har i alt 55,420,018 aktier. Største aktionærer omfatter Barclays Plc, WealthNavi Inc., Jane Street Group, Llc, Hsbc Holdings Plc, CIBC Bancorp USA Inc., Cibc World Markets Corp, Price T Rowe Associates Inc /md/, Morgan Stanley, Bnp Paribas Arbitrage, Sa, and Citigroup Inc .
iShares Trust - iShares U.S. Real Estate ETF (ARCA:IYR) institutionel ejerskabsstruktur viser aktuelle positioner i virksomheden efter institutioner og fonde, samt seneste ændringer i positionsstørrelse. Større aktionærer kan omfatte individuelle investorer, investeringsforeninger, hedgefonde eller institutioner. Skema 13D angiver, at investoren besidder (eller besidder) mere end 5 % af virksomheden og har til hensigt (eller har til hensigt at) aktivt at forfølge en ændring i forretningsstrategi. Skema 13G indikerer en passiv investering på over 5%.
The share price as of March 20, 2026 is 93,45 / share. Previously, on March 20, 2025, the share price was 95,32 / share. This represents a decline of 1,96% over that period.
Fondens stemningsscore
Fund Sentiment Score (fka Ownership Accumulation Score) finder de aktier, der bliver mest købt af fonde. Det er resultatet af en sofistikeret, multi-faktor kvantitativ model, der identificerer virksomheder med de højeste niveauer af institutionel akkumulering. Scoringsmodellen bruger en kombination af den samlede stigning i oplyste ejere, ændringerne i porteføljeallokeringer i disse ejere og andre målinger. Tallet går fra 0 til 100, hvor højere tal indikerer et højere niveau af akkumulering for sine jævnaldrende, og 50 er gennemsnittet.
Opdateringsfrekvens: Dagligt
Se Ownership Explorer, som giver en liste over højest rangerende virksomheder.
AI+ Ask Fintel’s AI assistant about iShares Trust - iShares U.S. Real Estate ETF.
Select a question to share a public post with an AI-crafted answer.
Thinking of good questions…
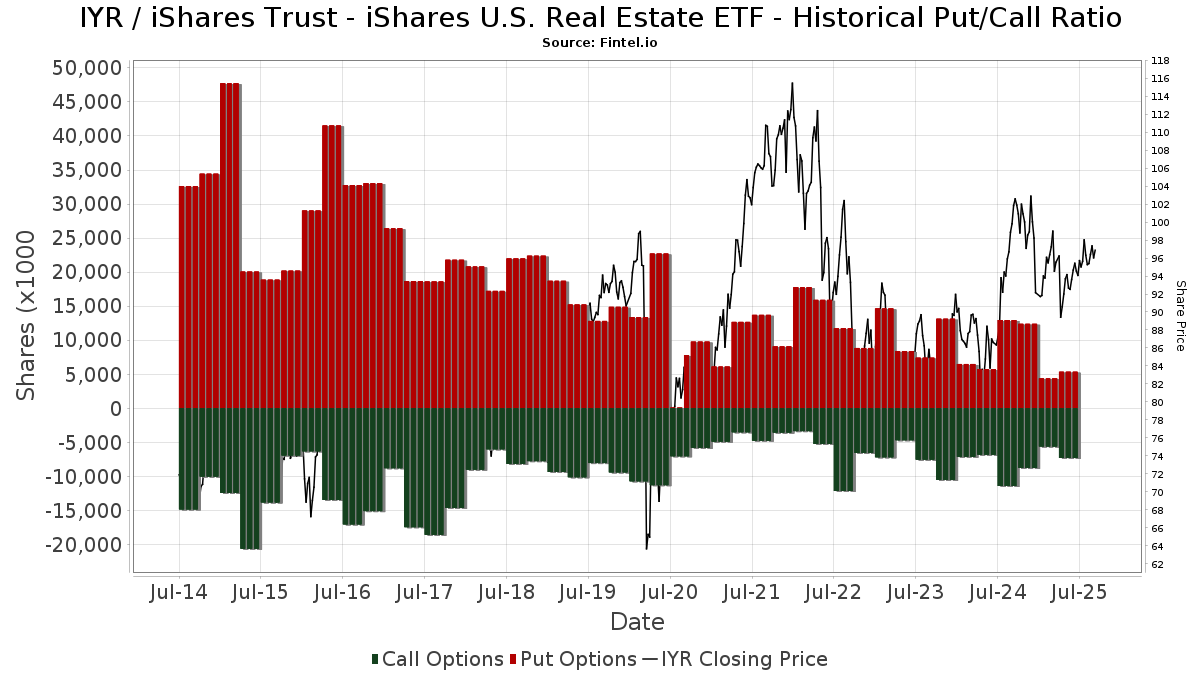
Institutionel Put/Call-forhold
Ud over at indberette standardaktie- og gældsudstedelser skal institutter med mere end 100 mill. aktiver under forvaltning også oplyse deres put- og call-optionsbeholdninger. Da salgsoptioner generelt indikerer negativ stemning, og købsoptioner indikerer positiv stemning, kan vi få en fornemmelse af den overordnede institutionelle stemning ved at plotte forholdet mellem put og kald. Diagrammet til højre viser det historiske put/call-forhold for dette instrument.
Brug af Put/Call Ratio som en indikator for investorernes stemning overvinder en af de vigtigste mangler ved at bruge totalt institutionelt ejerskab, som er, at en betydelig mængde af aktiver under forvaltning investeres passivt for at spore indekser. Passivt forvaltede fonde køber typisk ikke optioner, så indikatoren for put/call-forholdet følger mere nøje følelsen af aktivt forvaltede fonde.
13F og NPORT arkivering
Detaljer om 13F-arkivering er gratis. Detaljer om NP-ansøgninger kræver et premium-medlemskab. Grønne rækker angiver nye positioner. Røde rækker angiver lukkede positioner. Klik på linket ikon for at se den fulde transaktionshistorik.
Opgrader
for at låse premium-data op og eksportere til Excel ![]() .
.
| Fil dato | Kilde | Investor | Type | Gennemsnitlig pris (Øst) |
Aktier | Δ Aktier (%) |
Rapporteret Værdi ($1000) |
Δ Værdi (%) |
Port Alloc (%) |
|
|---|---|---|---|---|---|---|---|---|---|---|
| 2026-02-03 | 13F | Sequoia Financial Advisors, LLC | 12.735 | -3,05 | 1.196 | -6,27 | ||||
| 2026-01-29 | 13F | Sanctuary Advisors, LLC | 2.424 | -1,22 | 228 | -4,62 | ||||
| 2025-11-12 | 13F | Aster Capital Management (DIFC) Ltd | 0 | -100,00 | 0 | -100,00 | ||||
| 2026-02-13 | 13F | Smartleaf Asset Management LLC | 77 | 0,00 | 7 | 0,00 | ||||
| 2026-02-04 | 13F | Bensler, LLC | 0 | -100,00 | 0 | |||||
| 2026-02-11 | 13F | Fox Run Management, L.l.c. | 0 | -100,00 | 0 | |||||
| 2026-02-13 | 13F | Walleye Capital LLC | 10.444 | 981 | ||||||
| 2026-02-10 | 13F | Goldman Sachs Group Inc | Put | 0 | -100,00 | 0 | ||||
| 2026-01-28 | 13F | Salomon & Ludwin, LLC | 24 | 0,00 | 2 | 0,00 | ||||
| 2026-02-17 | 13F | Royal Bank Of Canada | Call | 27.000 | -52,71 | 2.535 | -54,27 | |||
| 2026-02-13 | 13F | Citigroup Inc | Put | 0 | -100,00 | 0 | -100,00 | |||
| 2026-02-17 | 13F | Royal Bank Of Canada | 617.927 | 9,09 | 58.017 | 5,51 | ||||
| 2025-11-07 | 13F | Wealthcare Advisory Partners LLC | 0 | -100,00 | 0 | |||||
| 2026-01-21 | 13F | Flagship Harbor Advisors, Llc | 25 | 2 | ||||||
| 2026-02-10 | 13F | Argent Trust Co | 0 | -100,00 | 0 | |||||
| 2026-02-10 | 13F | Envestnet Asset Management Inc | 123.209 | -5,37 | 11.568 | -8,48 | ||||
| 2026-02-12 | 13F | Planning Project LLC | 29 | 3 | ||||||
| 2026-01-14 | 13F | Waldron Private Wealth LLC | 6.246 | 0,00 | 586 | -3,30 | ||||
| 2026-01-27 | 13F | TD Waterhouse Canada Inc. | 1.581 | 5,40 | 148 | 2,07 | ||||
| 2026-01-30 | 13F | United Community Bank | 84 | 8 | ||||||
| 2025-11-14 | 13F | Strategic Wealth Partners, Ltd. | 104 | 0,00 | 10 | 11,11 | ||||
| 2026-02-12 | 13F | Hamilton Point Investment Advisors, LLC | 1 | 0,00 | 0 | |||||
| 2026-02-17 | 13F | DV Trading LLC | 4.740 | 449 | ||||||
| 2026-02-02 | 13F | Allegheny Financial Group LTD | 34.713 | -1,24 | 3.259 | -4,48 | ||||
| 2025-11-07 | 13F | Beacon Capital Management, LLC | 0 | -100,00 | 0 | |||||
| 2025-11-13 | 13F | Marshall Wace, Llp | Put | 0 | -100,00 | 0 | -100,00 | |||
| 2026-01-05 | 13F | Horizons Wealth Management | 129 | 0,00 | 12 | 0,00 | ||||
| 2026-02-02 | 13F | Ellis Investment Partners, LLC | 4.661 | -3,36 | 438 | -6,62 | ||||
| 2026-01-13 | 13F | CoreCap Advisors, LLC | 449 | -7,99 | 42 | -10,64 | ||||
| 2026-02-05 | 13F | Tucker Asset Management Llc | 394 | -74,30 | 37 | -75,68 | ||||
| 2026-02-06 | 13F | GLOBALT Investments LLC / GA | 8.362 | -2,04 | 785 | -5,19 | ||||
| 2025-11-07 | 13F | Synovus Financial Corp | 11.378 | 43,19 | 1.105 | 46,61 | ||||
| 2026-01-12 | 13F | Heartwood Wealth Advisors LLC | 0 | -100,00 | 0 | -100,00 | ||||
| 2026-01-16 | 13F | Pictet North America Advisors SA | 37.434 | 0,00 | 3.515 | -3,30 | ||||
| 2026-02-11 | 13F | O'shaughnessy Asset Management, Llc | 295 | 37,85 | 28 | 35,00 | ||||
| 2026-02-11 | 13F | Jpmorgan Chase & Co | 143.909 | 0,74 | 13.512 | -2,57 | ||||
| 2026-02-02 | 13F | Mutual Advisors, LLC | 11.694 | 0,55 | 1.098 | -3,69 | ||||
| 2026-01-26 | 13F | Sonata Capital Group Inc | 2.972 | 0,00 | 279 | |||||
| 2026-01-28 | 13F | Cranbrook Wealth Management, LLC | 149 | 0,00 | 14 | -7,14 | ||||
| 2026-01-27 | 13F | First Horizon Corp | 41 | -55,91 | 4 | -66,67 | ||||
| 2026-02-04 | 13F | Rock Point Advisors, LLC | 3.440 | -11,68 | 323 | -14,81 | ||||
| 2026-02-11 | 13F | Hughes Financial Services, LLC | 1.386 | 0,00 | 130 | -1,52 | ||||
| 2026-01-27 | 13F | Financial Advisory Corp | 147.355 | 3,36 | 13.835 | -0,04 | ||||
| 2026-02-17 | 13F | Alliancebernstein L.p. | 5.997 | 33,18 | 563 | 28,83 | ||||
| 2026-01-30 | 13F | North Star Investment Management Corp. | 0 | -100,00 | 0 | |||||
| 2026-01-16 | 13F | Ronald Blue Trust, Inc. | 1.053 | -16,16 | 99 | -19,01 | ||||
| 2026-02-17 | 13F | National Asset Management, Inc. | 10.161 | 3,89 | 954 | 0,53 | ||||
| 2026-02-11 | 13F | Parallel Advisors, LLC | 3.130 | -4,78 | 294 | -8,15 | ||||
| 2026-02-13 | 13F | Mml Investors Services, Llc | 122.614 | 7,58 | 11.512 | 4,05 | ||||
| 2026-02-17 | 13F | Sig Brokerage, Lp | Call | 25.000 | 2.347 | |||||
| 2026-01-15 | 13F | Delta Capital Management Llc | 3.380 | 0,00 | 0 | |||||
| 2026-01-22 | 13F | City Holding Co | 3.786 | 0,00 | 355 | -3,27 | ||||
| 2026-02-05 | 13F | Thrivent Financial For Lutherans | 7.936 | 3,40 | 1 | |||||
| 2026-02-12 | 13F | Graetz Wealth LLC | 2.246 | 211 | ||||||
| 2026-02-17 | 13F | Blair William & Co/il | 20.439 | 0,76 | 1.919 | -2,54 | ||||
| 2026-02-12 | 13F | Nuveen, LLC | 5.000 | 469 | ||||||
| 2026-01-20 | 13F | Partners Wealth Management, Llc | 4.710 | 0,00 | 442 | -3,28 | ||||
| 2026-02-06 | 13F | BOK Financial Private Wealth, Inc. | 99 | -92,25 | 9 | -92,68 | ||||
| 2026-02-17 | 13F | Parallax Volatility Advisers, L.P. | 1 | 0,00 | 0 | |||||
| 2026-02-13 | 13F | Cape Cod Five Cents Savings Bank | 2.112 | 0,00 | 215 | 0,00 | ||||
| 2026-02-17 | 13F | Parallax Volatility Advisers, L.P. | Call | 108.700 | 3.782,14 | 10.206 | 3.665,68 | |||
| 2025-10-01 | 13F | Caldwell Trust Co | 0 | 0 | ||||||
| 2026-02-11 | 13F | SlateStone Wealth, LLC | 2.240 | 0 | ||||||
| 2026-01-14 | 13F | Eastern Bank | 132 | 0,00 | 12 | 0,00 | ||||
| 2026-02-02 | 13F | Cornerstone Planning Group LLC | 0 | -100,00 | 0 | |||||
| 2026-02-12 | 13F | Granite Investment Partners, LLC | 10 | 1 | ||||||
| 2026-01-30 | 13F | Sage Rhino Capital Llc | 25.535 | 2,70 | 2.397 | -0,66 | ||||
| 2026-01-26 | 13F | Whittier Trust Co Of Nevada Inc | 500 | 0,00 | 47 | -2,08 | ||||
| 2026-02-12 | 13F | Gould Capital, LLC | 0 | -100,00 | 0 | |||||
| 2026-02-11 | 13F | Modus Advisors, LLC | 300 | 28 | ||||||
| 2026-02-17 | 13F | Holocene Advisors, LP | 0 | -100,00 | 0 | |||||
| 2026-02-20 | 13F | Kovitz Investment Group Partners, LLC | 0 | -100,00 | 0 | |||||
| 2026-02-13 | 13F | SRS Capital Advisors, Inc. | 14 | 1 | ||||||
| 2026-02-17 | 13F | Bank Of America Corp /de/ | Put | 0 | -100,00 | 0 | ||||
| 2026-02-17 | 13F | Captrust Financial Advisors | 10.107 | 5,55 | 949 | 2,05 | ||||
| 2026-02-11 | 13F | Deutsche Bank Ag\ | 6.985 | 0,00 | 656 | -3,39 | ||||
| 2026-02-13 | 13F | Itau Unibanco Holding S.A. | 8.765 | -9,31 | 823 | -12,37 | ||||
| 2026-01-05 | 13F | Park Avenue Securities Llc | 13.013 | -19,31 | 1 | 0,00 | ||||
| 2026-02-13 | 13F | Gould Asset Management Llc /ca/ | 6.805 | 19,07 | 639 | 15,16 | ||||
| 2026-02-14 | 13F | Rockefeller Capital Management L.P. | 90.076 | -12,39 | 8.457 | -15,27 | ||||
| 2026-02-17 | 13F | Parallax Volatility Advisers, L.P. | Put | 51.000 | 10.100,00 | 4.788 | 9.875,00 | |||
| 2025-11-03 | 13F | Hallmark Capital Management Inc | 0 | -100,00 | 0 | |||||
| 2026-02-12 | 13F | Steward Partners Investment Advisory, Llc | 6.580 | 24,98 | 618 | 20,74 | ||||
| 2026-02-13 | 13F | National Bank Of Canada /fi/ | 483 | 19,26 | 45 | 15,38 | ||||
| 2026-02-17 | 13F | Woodline Partners LP | 0 | -100,00 | 0 | |||||
| 2026-02-12 | 13F | Federation des caisses Desjardins du Quebec | 830 | 0,00 | 78 | -3,75 | ||||
| 2026-01-27 | 13F | HCR Wealth Advisors | 5.265 | 0,00 | 494 | -2,76 | ||||
| 2026-02-13 | 13F | Ubs Asset Management Americas Inc | 45 | 4 | ||||||
| 2026-02-13 | 13F | Marshall Wace, Llp | 0 | -100,00 | 0 | |||||
| 2026-02-06 | 13F | Adell Harriman & Carpenter Inc | 7.615 | -11,73 | 715 | -14,58 | ||||
| 2026-01-22 | 13F | Glass Jacobson Investment Advisors llc | 74 | 0,00 | 7 | -14,29 | ||||
| 2026-02-09 | 13F | Cary Street Partners Financial Llc | 2.316 | -17,76 | 217 | -20,51 | ||||
| 2026-01-26 | 13F | BlueSky Wealth Advisors, LLC | 9.869 | -6,98 | 927 | -10,01 | ||||
| 2026-02-18 | 13F | EP Wealth Advisors, Inc. | 2.522 | 47,66 | 237 | 46,58 | ||||
| 2026-02-10 | 13F | Nomura Asset Management Co Ltd | 2.400 | 0,00 | 225 | -3,02 | ||||
| 2025-10-16 | 13F | Lowe Wealth Advisors, LLC | 158 | 0,00 | 15 | 7,14 | ||||
| 2026-02-13 | 13F | Pathstone Holdings, LLC | 236.720 | -1,00 | 22.226 | -4,25 | ||||
| 2026-02-13 | 13F | Creekside Partners | 8.168 | 0,05 | 767 | -3,28 | ||||
| 2026-01-08 | 13F | Sentinel Wealth Management, Inc. | 3.660 | 0,00 | 344 | -3,38 | ||||
| 2026-02-11 | 13F | Eldridge Investment Advisors, Inc. | 2.354 | 0,04 | 221 | -3,07 | ||||
| 2026-02-13 | 13F | Baird Financial Group, Inc. | 21.958 | -3,53 | 2.062 | -6,70 | ||||
| 2026-02-12 | 13F | Bank Of Montreal /can/ | 112.063 | 10,92 | 10.522 | 7,27 | ||||
| 2026-01-27 | 13F | WealthCollab, LLC | 1.108 | 0,00 | 104 | -2,80 | ||||
| 2026-01-29 | 13F | Advantage Trust Co | 0 | -100,00 | 0 | |||||
| 2026-02-11 | 13F | MCF Advisors LLC | 390 | 0,00 | 37 | -2,70 | ||||
| 2026-02-17 | 13F | Warren Averett Asset Management, LLC | 28.960 | -17,05 | 2.719 | -19,77 | ||||
| 2026-01-28 | 13F | Field & Main Bank | 75 | 0,00 | 7 | 0,00 | ||||
| 2026-02-04 | 13F | Liberty Wealth Management Llc | 4.386 | 11,97 | 412 | 8,16 | ||||
| 2026-02-13 | 13F | Journey Strategic Wealth Llc | 2.392 | 0,00 | 225 | -3,45 | ||||
| 2026-02-10 | 13F | Garde Capital, Inc. | 17.186 | 0,46 | 1.614 | -2,83 | ||||
| 2026-02-13 | 13F | Kayne Anderson Rudnick Investment Management Llc | 975 | 0,00 | 92 | -3,19 | ||||
| 2026-03-04 | 13F | Rehmann Capital Advisory Group | 11.954 | 17,80 | 1.122 | 13,91 | ||||
| 2026-01-15 | 13F | Rebalance, Llc | 45.438 | -3,84 | 4.266 | -7,00 | ||||
| 2026-01-08 | 13F | Legacy Private Trust Co. | 19.390 | 3,62 | 1.821 | 0,22 | ||||
| 2026-01-20 | 13F | Sheets Smith Wealth Management | 36.000 | 0,00 | 3.380 | -3,26 | ||||
| 2026-02-12 | 13F | Front Row Advisors LLC | 120 | 0,00 | 11 | 0,00 | ||||
| 2026-01-28 | 13F | Arkansas Financial Group, Inc. | 53.531 | -0,06 | 5.026 | -3,35 | ||||
| 2026-02-17 | 13F | Sender Co & Partners, Inc. | Put | 0 | -100,00 | 0 | ||||
| 2026-02-06 | 13F | Pnc Financial Services Group, Inc. | 376.359 | -4,24 | 35.336 | -7,39 | ||||
| 2026-02-10 | 13F | FUKOKU MUTUAL LIFE INSURANCE Co | 243.000 | 0,00 | 22.815 | -3,29 | ||||
| 2026-02-17 | 13F | Balyasny Asset Management Llc | Put | 94.500 | 8.873 | |||||
| 2026-02-17 | 13F | XTX Topco Ltd | 0 | -100,00 | 0 | |||||
| 2026-01-23 | 13F | Kagan Cocozza Asset Management | 9.055 | -0,75 | 850 | -3,95 | ||||
| 2026-02-03 | 13F | Patten & Patten Inc/tn | 4.247 | -0,59 | 399 | -3,86 | ||||
| 2026-01-20 | 13F | SOA Wealth Advisors, LLC. | 20.769 | -2,95 | 1.950 | -6,11 | ||||
| 2026-01-21 | 13F | First United Bank Trust/ | 774 | -8,62 | 73 | -12,20 | ||||
| 2026-01-28 | 13F | Fairway Wealth LLC | 34.516 | 0,10 | 3.241 | -3,20 | ||||
| 2026-02-05 | 13F | Bessemer Group Inc | 4.993 | 0,00 | 0 | |||||
| 2026-01-14 | 13F | Cypress Financial Planning Llc | 3.497 | -42,44 | 331 | -43,80 | ||||
| 2026-01-22 | 13F | Encompass Wealth Advisors, Llc | 6.980 | 11,57 | 655 | 7,91 | ||||
| 2026-02-12 | 13F | StoneX Group Inc. | 24.430 | 144,72 | 2.294 | 136,74 | ||||
| 2026-01-22 | 13F | Rodgers & Associates, LTD | 39.995 | 0,92 | 3.755 | -2,39 | ||||
| 2026-02-11 | 13F | LPL Financial LLC | 340.889 | -1,74 | 32.006 | -4,97 | ||||
| 2026-02-17 | 13F | Balyasny Asset Management Llc | 59.816 | 5.616 | ||||||
| 2026-01-12 | 13F | Evanson Asset Management, LLC | 18.419 | 0,00 | 1.729 | -3,30 | ||||
| 2026-01-22 | 13F | Bartlett & Co. Wealth Management Llc | 200 | 0,00 | 19 | -5,26 | ||||
| 2026-02-03 | 13F | Retirement Planning Group | 2.828 | 2,02 | 266 | -1,49 | ||||
| 2026-02-17 | 13F | Russell Investments Group, Ltd. | 824 | -5,29 | 77 | -8,33 | ||||
| 2026-02-13 | 13F | Stifel Financial Corp | 734.378 | 24,47 | 68.950 | 20,38 | ||||
| 2025-11-04 | 13F | IMC-Chicago, LLC | 0 | -100,00 | 0 | |||||
| 2026-01-14 | 13F | Moisand Fitzgerald Tamayo, LLC | 85 | 0,00 | 8 | -12,50 | ||||
| 2026-02-13 | 13F | Wealth Alliance | 4.202 | 395 | ||||||
| 2026-01-13 | 13F | Mather Group, Llc. | 0 | -100,00 | 0 | |||||
| 2026-02-17 | 13F | Modern Wealth Management, LLC | 41.321 | 2,90 | 3.880 | -0,49 | ||||
| 2025-11-12 | 13F | Buckingham Strategic Partners | 0 | -100,00 | 0 | |||||
| 2026-01-28 | 13F | Geneos Wealth Management Inc. | 5.275 | 0,00 | 495 | -3,32 | ||||
| 2026-02-03 | 13F | Farmers & Merchants Investments Inc | 170 | 0,00 | 16 | -6,25 | ||||
| 2026-02-13 | 13F | Clal Insurance Enterprises Holdings Ltd | 5.000 | 0 | ||||||
| 2026-01-15 | 13F | Infinity Wealth Counsel, LLC | 5.285 | 8,19 | 496 | 4,64 | ||||
| 2026-02-04 | 13F | Ameritas Advisory Services, LLC | 4.678 | -5,00 | 439 | -8,16 | ||||
| 2026-02-10 | 13F | Godfrey Financial Associates, Inc. | 503 | 47 | ||||||
| 2025-11-21 | 13F | Watts Gwilliam & Co., LLC | 3.855 | 0,00 | 374 | 0,54 | ||||
| 2026-01-29 | 13F | Atlas Legacy Advisors, LLC | 8.924 | 17,08 | 838 | 13,26 | ||||
| 2026-02-03 | 13F | Koshinski Asset Management, Inc. | 13.645 | 0,00 | 1.281 | -3,25 | ||||
| 2026-02-03 | 13F | SBI Securities Co., Ltd. | 28.040 | -0,66 | 2.633 | -3,94 | ||||
| 2026-01-21 | 13F | Modera Wealth Management, LLC | 6.849 | -0,57 | 643 | -3,74 | ||||
| 2026-02-17 | 13F | Price T Rowe Associates Inc /md/ | 2.942.928 | 276 | ||||||
| 2026-02-17 | 13F | Raymond James Financial Inc | 204.103 | 1,03 | 19.163 | -2,29 | ||||
| 2026-02-17 | 13F | Gallagher Fiduciary Advisors, LLC | 18.302 | 1.718 | ||||||
| 2026-02-13 | 13F | Platform Technology Partners | 2.530 | 0,00 | 238 | -3,27 | ||||
| 2026-02-06 | 13F | Sierra Ocean, Llc | 2.438 | 229 | ||||||
| 2026-01-13 | 13F | IFG Advisors, LLC | 3.641 | -6,16 | 342 | -9,31 | ||||
| 2026-02-06 | 13F | Principle Wealth Partners Llc | 5.100 | 0,00 | 479 | -3,43 | ||||
| 2026-02-02 | 13F | Truist Financial Corp | 49.208 | -0,46 | 4.620 | -3,73 | ||||
| 2026-01-23 | 13F | Rsm Us Wealth Management Llc | 2.753 | -15,76 | 261 | -17,98 | ||||
| 2025-10-24 | 13F | World Equity Group, Inc. | 0 | -100,00 | 0 | |||||
| 2026-01-29 | 13F | Vanguard Group Inc | 5.079 | 0,00 | 477 | -3,45 | ||||
| 2026-02-06 | 13F | HighTower Advisors, LLC | 39.805 | -12,90 | 3.737 | -15,76 | ||||
| 2026-01-14 | 13F | Ballew Advisors, Inc | 15.337 | 2,02 | 1.464 | 2,24 | ||||
| 2026-01-09 | 13F | SG Americas Securities, LLC | 180.632 | 55,96 | 17 | 45,45 | ||||
| 2026-02-02 | 13F | Horizon Investments, LLC | 4 | -69,23 | 0 | -100,00 | ||||
| 2025-11-10 | 13F | First Heartland Consultants, Inc. | 0 | -100,00 | 0 | |||||
| 2026-02-11 | 13F | Passaic Partners LLC | 0 | -100,00 | 0 | |||||
| 2026-01-29 | 13F | Courier Capital Llc | 57.696 | 2,91 | 5.417 | -0,46 | ||||
| 2026-02-10 | 13F/A | Northwestern Mutual Wealth Management Co | 325.997 | 0,28 | 30.608 | -3,01 | ||||
| 2026-01-26 | 13F | Asset Dedication, LLC | 289 | 0,00 | 27 | -3,57 | ||||
| 2026-02-04 | 13F | Bailard, Inc. | 7.718 | -88,89 | 725 | -89,27 | ||||
| 2026-02-13 | 13F | Alerus Financial Na | 57 | 0,00 | 5 | 0,00 | ||||
| 2026-02-04 | 13F | TradeLink Capital LLC | 9.200 | 1 | ||||||
| 2026-02-09 | 13F | Leavell Investment Management, Inc. | 4.845 | 0,00 | 455 | -3,40 | ||||
| 2026-02-03 | 13F | Emerald Investment Partners, Llc | 1.170 | 44,44 | 110 | 39,74 | ||||
| 2026-01-29 | 13F | UBS Group AG | Put | 457.200 | 119,70 | 42.927 | 112,48 | |||
| 2026-02-17 | 13F | Bank Of America Corp /de/ | 1.146.651 | -19,57 | 107.659 | -22,21 | ||||
| 2025-10-17 | 13F | Hm Payson & Co | 0 | -100,00 | 0 | -100,00 | ||||
| 2025-11-12 | 13F | Park Square Financial Group, LLC | 0 | -100,00 | 0 | -100,00 | ||||
| 2026-01-29 | 13F | UBS Group AG | Call | 528.500 | 28,43 | 49.621 | 24,21 | |||
| 2026-01-29 | 13F | UBS Group AG | 1.695.093 | -35,53 | 159.152 | -37,65 | ||||
| 2026-02-11 | 13F | Cerity Partners LLC | 49.325 | -0,07 | 4.631 | -3,34 | ||||
| 2026-02-17 | 13F | Millennium Management Llc | Put | 192.200 | 18.046 | |||||
| 2026-02-17 | 13F | BLKBRD Asset Management, LP | 0 | -100,00 | 0 | |||||
| 2026-02-17 | 13F | Integrated Advisors Network LLC | 13.272 | -9,76 | 1.246 | -12,68 | ||||
| 2026-02-17 | 13F | Millennium Management Llc | Call | 117.200 | 11.004 | |||||
| 2026-02-05 | 13F | IMG Wealth Management, Inc. | 44 | 2,33 | 4 | 0,00 | ||||
| 2026-02-12 | 13F | Keel Point, LLC | 7.539 | -0,45 | 708 | -3,81 | ||||
| 2026-02-13 | 13F | Arkadios Wealth Advisors | 0 | -100,00 | 0 | |||||
| 2026-02-19 | 13F | Mcguire Capital Advisors Inc | 15 | 1 | ||||||
| 2026-01-20 | 13F | Ntv Asset Management Llc | 9.350 | -2,35 | 878 | -5,60 | ||||
| 2026-01-20 | 13F | Maryland Capital Advisors Inc. | 580 | 0,00 | 54 | -3,57 | ||||
| 2026-02-12 | 13F | Burke & Herbert Bank & Trust Co | 2.605 | -55,58 | 245 | -57,12 | ||||
| 2026-01-29 | 13F | ProVise Management Group, LLC | 3.095 | 0,00 | 291 | -3,33 | ||||
| 2026-02-13 | 13F | Peak6 Llc | Call | 9.100 | -76,24 | 854 | -77,03 | |||
| 2026-01-22 | 13F | Castle Wealth Management Llc | 3.618 | 0,03 | 340 | -3,42 | ||||
| 2026-02-13 | 13F | Peak6 Llc | Put | 17.700 | 0,00 | 1.662 | -3,32 | |||
| 2026-01-09 | 13F | Pacifica Partners Inc. | 1.570 | 0,00 | 148 | -3,29 | ||||
| 2026-02-09 | 13F | Hartland & Co., LLC | 2.272 | -3,48 | 213 | -6,58 | ||||
| 2025-11-12 | 13F | Bellwether Advisors, LLC | 0 | -100,00 | 0 | |||||
| 2026-01-14 | 13F | Embree Financial Group | 16.517 | -10,38 | 1.551 | -13,36 | ||||
| 2025-10-15 | 13F | Norden Group Llc | 0 | -100,00 | 0 | |||||
| 2026-02-12 | 13F | Schoolcraft Capital LLC | 4.595 | -1,44 | 431 | -4,65 | ||||
| 2026-01-13 | 13F | First Financial Corp /in/ | 19.349 | 10,67 | 1.817 | 7,01 | ||||
| 2026-01-26 | 13F | Phillips Financial Management, Llc | 20 | 0,00 | 2 | 0,00 | ||||
| 2026-02-10 | 13F | Beto Financial Group, Llc | 26.690 | 2.542 | ||||||
| 2025-10-27 | 13F | Smith Shellnut Wilson Llc /adv | 2.810 | -5,16 | 273 | -2,86 | ||||
| 2026-02-20 | 13F | Sunbelt Securities, Inc. | 10 | 0,00 | 1 | |||||
| 2026-02-06 | 13F | Motco | 142 | 0,00 | 13 | 0,00 | ||||
| 2026-02-11 | 13F | Greykasell Wealth Strategies, Inc. | 286 | 17,70 | 27 | 13,04 | ||||
| 2025-11-14 | 13F | Natixis | 0 | -100,00 | 0 | |||||
| 2026-02-10 | 13F | Glassy Mountain Advisors, Inc. | 275 | 0,00 | 26 | -3,85 | ||||
| 2026-02-17 | 13F | Nepc Llc | 21.747 | 0,90 | 2.042 | -2,44 | ||||
| 2026-01-13 | 13F | Balanced Wealth Group Llc | 7.175 | 0,63 | 697 | 2,35 | ||||
| 2026-02-12 | 13F | M&G Plc | 0 | -100,00 | 0 | |||||
| 2026-02-18 | 13F | CTC Alternative Strategies, Ltd. | 14.600 | 1.371 | ||||||
| 2026-02-17 | 13F | Cetera Investment Advisers | 57.564 | 2,01 | 5.405 | -1,35 | ||||
| 2025-11-04 | 13F | Pineridge Advisors LLC | 0 | -100,00 | 0 | |||||
| 2026-01-26 | 13F | AE Wealth Management LLC | 5.076 | 90,61 | 477 | 84,50 | ||||
| 2026-01-30 | 13F | Caldwell Securities, Inc | 196 | 0,00 | 18 | -5,26 | ||||
| 2026-02-17 | 13F | Glenmede Trust Co Na | 1.489 | -50,18 | 140 | -51,40 | ||||
| 2025-10-16 | 13F | Yeomans Consulting Group, Inc. | 0 | -100,00 | 0 | |||||
| 2026-02-06 | 13F | Creative Financial Designs Inc /adv | 123 | 0,00 | 12 | 0,00 | ||||
| 2026-02-10 | 13F | Bnp Paribas Arbitrage, Sa | Put | 0 | -100,00 | 0 | -100,00 | |||
| 2026-01-26 | 13F | Private Trust Co Na | 425 | 0,00 | 40 | -4,88 | ||||
| 2026-02-13 | 13F | Parkside Financial Bank & Trust | 172 | 0,00 | 16 | 0,00 | ||||
| 2026-02-13 | 13F | Walleye Trading LLC | Call | 23.000 | 56,46 | 2.159 | 51,30 | |||
| 2026-01-29 | 13F | Sava Infond d.o.o. | 5.100 | 59,38 | 479 | 54,19 | ||||
| 2026-01-14 | 13F | Spire Wealth Management | 1.574 | 0,77 | 148 | -2,65 | ||||
| 2026-02-13 | 13F | Walleye Trading LLC | Put | 14.200 | -24,06 | 1.333 | -26,56 | |||
| 2026-02-11 | 13F | Viewpoint Capital Management LLC | 2.583 | -14,78 | 243 | -17,69 | ||||
| 2026-02-17 | 13F | Millennium Management Llc | 54.639 | -6,04 | 5.130 | -9,12 | ||||
| 2026-02-04 | 13F | Pure Financial Advisors, Inc. | 6.212 | -5,41 | 583 | -8,48 | ||||
| 2026-03-10 | 13F | Audent Global Asset Management, LLC | 4.327 | -1,70 | 406 | -4,92 | ||||
| 2026-02-10 | 13F | Ssi Investment Management Llc | 7.047 | 0,00 | 662 | -3,36 | ||||
| 2026-02-19 | 13F | CI Private Wealth, LLC | 38.089 | 21,00 | 3.545 | 16,04 | ||||
| 2026-01-26 | 13F | American Wealth Advisors, LLC | 6.905 | 0,77 | 648 | -2,56 | ||||
| 2026-02-10 | 13F | Yukon Wealth Management, Inc. | 2.744 | -14,38 | 264 | -15,11 | ||||
| 2025-10-30 | 13F | Flagship Wealth Advisors, Llc | 0 | -100,00 | 0 | |||||
| 2026-01-21 | 13F | Integris Wealth Management, LLC | 2.534 | 0,00 | 238 | -3,66 | ||||
| 2026-02-13 | 13F | Barclays Plc | Put | 0 | -100,00 | 0 | -100,00 | |||
| 2025-11-14 | 13F | Quantessence Capital LLC | 0 | -100,00 | 0 | |||||
| 2026-01-26 | 13F | Clean Yield Group | 175 | 0,00 | 16 | 0,00 | ||||
| 2026-01-07 | 13F | Harbor Investment Advisory, Llc | 4.216 | 396 | ||||||
| 2026-02-02 | 13F | Miracle Mile Advisors, LLC | 6.613 | -56,59 | 621 | -58,05 | ||||
| 2026-03-16 | 13F | Bank of New Hampshire | 10 | 0,00 | 1 | |||||
| 2026-01-15 | 13F | WealthNavi Inc. | 5.838.937 | 10,20 | 548 | 6,61 | ||||
| 2026-01-30 | 13F/A | M&t Bank Corp | 7.614 | -1,12 | 715 | -4,42 | ||||
| 2025-11-10 | 13F | Greenland Capital Management LP | Put | 0 | -100,00 | 0 | -100,00 | |||
| 2026-01-23 | 13F | Axos Invest Inc. | 2.693 | -29,91 | 253 | -32,44 | ||||
| 2025-11-14 | 13F | Squarepoint Ops LLC | 0 | -100,00 | 0 | -100,00 | ||||
| 2026-02-10 | 13F | Ilmarinen Mutual Pension Insurance Co | 1.196.577 | -8,17 | 112 | -11,11 | ||||
| 2026-02-13 | 13F | Global Endowment Management, LP | 158.940 | 16,80 | 14.923 | 12,97 | ||||
| 2026-02-18 | 13F | Sierra Capital LLC | 2.830 | 0,00 | 0 | |||||
| 2026-02-11 | 13F | Rise Advisors, LLC | 0 | -100,00 | 0 | |||||
| 2026-02-13 | 13F | Gts Securities Llc | 21.764 | -17,49 | 2.043 | -20,20 | ||||
| 2026-02-10 | 13F | CIBC World Markets Inc. | 246.434 | -22,74 | 23.138 | -25,28 | ||||
| 2026-02-17 | 13F | Ameriprise Financial Inc | 201.187 | 5,04 | 18.889 | 1,56 | ||||
| 2025-11-10 | 13F | One River Asset Management, LLC | 0 | -100,00 | 0 | |||||
| 2026-02-13 | 13F | Resources Investment Advisors, LLC. | 3.007 | 0,77 | 282 | -2,42 | ||||
| 2026-02-06 | 13F | Axxcess Wealth Management, Llc | 61.018 | 163,09 | 5.729 | 154,46 | ||||
| 2025-10-15 | 13F | Summit Financial Consulting LLC | 0 | -100,00 | 0 | -100,00 | ||||
| 2026-02-09 | 13F | Harbour Investments, Inc. | 700 | 0,00 | 66 | -2,99 | ||||
| 2026-02-12 | 13F | CIBC Private Wealth Group, LLC | 83 | 0,00 | 8 | -12,50 | ||||
| 2026-02-13 | 13F | Morgan Stanley | 2.687.434 | -15,20 | 252.323 | -17,99 | ||||
| 2026-02-17 | 13F | Mercer Global Advisors Inc /adv | 373.524 | 1,51 | 35.070 | -1,83 | ||||
| 2026-02-11 | 13F | Lowe Brockenbrough & Co Inc | 508 | 0,00 | 48 | -4,08 | ||||
| 2026-01-15 | 13F | Alhambra Investment Partners LLC | 3.608 | -12,66 | 339 | -15,71 | ||||
| 2026-02-09 | 13F | Huntington National Bank | 991 | -3,22 | ||||||
| 2026-02-02 | 13F | Principal Financial Group Inc | 94.456 | 1.610,85 | 8.868 | 1.557,57 | ||||
| 2026-02-17 | 13F | Ancora Advisors, LLC | 107 | 0,94 | 10 | 0,00 | ||||
| 2026-02-17 | 13F | Second Line Capital, LLC | 3.279 | 44,26 | 308 | 39,55 | ||||
| 2026-01-27 | 13F | Krilogy Financial LLC | 6.496 | 0,17 | 623 | 1,47 | ||||
| 2026-02-12 | 13F | Marex Group plc | 16.610 | 1.560 | ||||||
| 2026-02-17 | 13F | Pinnacle Financial Partners, Inc. | 9.793 | 920 | ||||||
| 2026-01-06 | 13F | Unique Wealth, Llc | 86.140 | 9,81 | 8.088 | 6,20 | ||||
| 2026-02-11 | 13F | Monetary Management Group Inc | 750 | -40,00 | 70 | -42,15 | ||||
| 2026-01-28 | 13F | United Asset Strategies, Inc. | 2.247 | -51,07 | 211 | -52,81 | ||||
| 2026-02-17 | 13F | Redwood Park Advisors LLC | 394 | 0,77 | 37 | 0,00 | ||||
| 2026-02-02 | 13F | Manhattan West Asset Management, LLC | 2.592 | 0,00 | 243 | -3,19 | ||||
| 2026-02-17 | 13F | Greenland Capital Management LP | Call | 40.000 | -55,56 | 3.756 | -57,02 | |||
| 2025-11-04 | 13F | Guerra Advisors Inc | 2 | 0 | ||||||
| 2026-02-17 | 13F | Private Advisor Group, LLC | 14.882 | -1,94 | 1.397 | -5,16 | ||||
| 2026-02-17 | 13F | Regal Investment Advisors LLC | 5.566 | -1,29 | 523 | -4,57 | ||||
| 2026-01-06 | 13F | First Citizens Financial Corp | 18.708 | -7,43 | 1.756 | -10,45 | ||||
| 2026-01-29 | 13F | Comerica Bank | 25.519 | 31,54 | 2.396 | 27,19 | ||||
| 2026-02-06 | 13F | Intrust Bank Na | 3.657 | 0,00 | 343 | -3,38 | ||||
| 2026-01-08 | 13F | Armstrong Advisory Group, Inc | 100 | 100,00 | 9 | 125,00 | ||||
| 2026-02-13 | 13F | Cozad Asset Management Inc | 2.725 | 0,00 | 256 | -3,41 | ||||
| 2025-11-13 | 13F | Bayview Asset Management, Llc | Put | 0 | -100,00 | 0 | ||||
| 2026-02-17 | 13F | Susquehanna International Group, Llp | Call | 1.594.900 | -5,53 | 149.745 | -8,63 | |||
| 2026-02-03 | 13F | Cheviot Value Management, LLC | 1.080 | 0,09 | 103 | -1,92 | ||||
| 2026-02-17 | 13F | Susquehanna International Group, Llp | 170.072 | 13,82 | 15.968 | 10,08 | ||||
| 2026-02-17 | 13F | Susquehanna International Group, Llp | Put | 857.500 | -8,98 | 80.511 | -11,97 | |||
| 2026-01-15 | 13F | SILVER OAK SECURITIES, Inc | 26.899 | -4,42 | 2.548 | -6,77 | ||||
| 2026-02-13 | 13F | SJA Financial Advisory, LLC | 20.680 | 10,07 | 1.942 | 6,47 | ||||
| 2026-02-12 | 13F | Principal Securities, Inc. | 0 | -100,00 | 0 | |||||
| 2026-02-13 | 13F | Headlands Technologies LLC | 7.430 | 58,86 | 698 | 53,52 | ||||
| 2026-02-17 | 13F | Toronto Dominion Bank | 9.900 | 141,46 | 930 | 134,01 | ||||
| 2026-03-02 | 13F | Reflection Asset Management | 7 | 1 | ||||||
| 2026-01-21 | 13F | Lakeshore Capital Group, Inc. | 3.430 | -0,23 | 322 | -3,60 | ||||
| 2026-02-12 | 13F | BRYN MAWR TRUST Co | 20.417 | 0,00 | 1.917 | -3,33 | ||||
| 2026-02-12 | 13F | Sumitomo Mitsui Financial Group, Inc. | 0 | -100,00 | 0 | |||||
| 2026-02-12 | 13F | Moneta Group Investment Advisors Llc | 8.561 | 5,16 | 804 | 1,65 | ||||
| 2026-02-13 | 13F | Wells Fargo & Company/mn | 624.548 | 21,71 | 58.639 | 17,71 | ||||
| 2026-02-02 | 13F | CX Institutional | 945 | 2.150,00 | 0 | |||||
| 2026-02-06 | 13F | Entrust Financial Llc | 225 | 21 | ||||||
| 2026-02-10 | 13F | Goldman Sachs Group Inc | 1.200.822 | -55,06 | 112.745 | -56,53 | ||||
| 2026-02-17 | 13F | Gladstone Institutional Advisory LLC | 12.421 | 5,16 | 1.166 | 1,75 | ||||
| 2026-01-20 | 13F | Stratos Wealth Partners, LTD. | 3.479 | 18,90 | 327 | 14,79 | ||||
| 2026-01-21 | 13F | Naviter Wealth, LLC | 26.164 | -29,36 | 2.457 | -31,68 | ||||
| 2026-02-12 | 13F | Jane Street Group, Llc | Put | 1.210.200 | 19,22 | 113.626 | 15,30 | |||
| 2026-02-13 | 13F | Aptus Capital Advisors, LLC | 5.058 | 35,49 | 475 | 30,94 | ||||
| 2026-02-12 | 13F | Jane Street Group, Llc | Call | 5.197.800 | 10,80 | 488.021 | 7,16 | |||
| 2026-02-17 | 13F | KM Capital Management Ltd. | 24.974 | -0,09 | 2.345 | -3,38 | ||||
| 2026-02-10 | 13F | Mycio Wealth Partners, Llc | 258 | 0,00 | 24 | -4,00 | ||||
| 2025-10-15 | 13F | Brookstone Capital Management | 0 | -100,00 | 0 | |||||
| 2026-02-13 | 13F | Volterra Technologies LP | Put | 12.500 | -77,68 | 1.174 | -78,42 | |||
| 2026-01-21 | 13F | Sowell Financial Services LLC | 18.703 | 1,42 | 1.756 | -1,96 | ||||
| 2026-01-27 | 13F | Elevated Capital Advisors, LLC | 138 | 13 | ||||||
| 2026-02-17 | 13F | Two Sigma Investments, Lp | 1.713.403 | 160.871 | ||||||
| 2026-01-16 | 13F | Abacus Planning Group, Inc. | 3.259 | 0,00 | 306 | -3,48 | ||||
| 2026-02-13 | 13F | Volterra Technologies LP | Call | 17.700 | -49,57 | 1.662 | -51,25 | |||
| 2026-02-13 | 13F | Barclays Plc | 6.260.125 | 1,60 | 587.763 | -1,73 | ||||
| 2026-02-10 | 13F | Quantbot Technologies LP | 1.631 | 197,63 | 153 | 188,68 | ||||
| 2026-02-10 | 13F | Moors & Cabot, Inc. | 8.634 | 2,81 | 811 | -0,61 | ||||
| 2025-11-13 | 13F | Glenmede Investment Management, LP | 2.489 | -16,73 | 242 | -14,84 | ||||
| 2026-01-21 | 13F | Canton Hathaway, LLC | 20.422 | 5,55 | 1.917 | 2,08 | ||||
| 2026-01-26 | 13F | Mirae Asset Global Investments Co., Ltd. | 5.571 | 0,00 | 523 | -3,15 | ||||
| 2026-02-04 | 13F | Atlantic Union Bankshares Corp | 1.611 | 0,00 | 151 | -3,21 | ||||
| 2026-02-13 | 13F | Verition Fund Management LLC | 17.133 | 274,16 | 1.609 | 262,16 | ||||
| 2026-02-17 | 13F | Citadel Advisors Llc | 491.507 | 3.170,39 | 46.148 | 3.062,92 | ||||
| 2026-02-06 | 13F | Granite FO LLC | 300 | 0,00 | 28 | -3,45 | ||||
| 2026-02-10 | 13F | Belvedere Trading LLC | 5.499 | 516 | ||||||
| 2026-02-12 | 13F | Wealthspire Advisors, LLC | 4.429 | -50,00 | 416 | -51,69 | ||||
| 2026-02-17 | 13F | Citadel Advisors Llc | Call | 343.500 | -29,96 | 32.251 | -32,26 | |||
| 2026-02-06 | 13F | Cullen/frost Bankers, Inc. | 8.558 | 1,86 | 804 | -1,47 | ||||
| 2025-10-14 | 13F | Brighton Jones Llc | 0 | -100,00 | 0 | |||||
| 2026-02-17 | 13F | Creative Planning | 12.768 | -8,60 | 1.199 | -11,65 | ||||
| 2026-01-28 | 13F | HB Wealth Management, LLC | 11.605 | -0,71 | 1.090 | -3,97 | ||||
| 2026-02-11 | 13F | J.w. Cole Advisors, Inc. | 6.250 | -9,76 | 568 | -15,62 | ||||
| 2026-02-06 | 13F | Vestmark Advisory Solutions, Inc. | 4.463 | 0,07 | 419 | -3,23 | ||||
| 2026-02-13 | 13F | Commerce Bank | 12.693 | -3,58 | 1.192 | -6,73 | ||||
| 2026-01-13 | 13F | Signature Securities Group Corporation | 6.501 | 9,78 | 610 | 6,27 | ||||
| 2026-02-09 | 13F | Clear Investment Research, Llc | 0 | -100,00 | 0 | |||||
| 2026-01-16 | 13F | Crewe Advisors LLC | 150 | 0,00 | 14 | 0,00 | ||||
| 2026-01-29 | 13F | Tanglewood Wealth Management, Inc. | 0 | -100,00 | 0 | |||||
| 2026-02-13 | 13F | Missouri Trust & Investment Co | 90 | 0,00 | 8 | 0,00 | ||||
| 2026-02-04 | 13F | Washington Trust Bank | 54.714 | 231,24 | 5.137 | 220,46 | ||||
| 2026-02-12 | 13F | DRW Securities, LLC | 8.923 | 23,19 | 838 | 21,83 | ||||
| 2026-02-13 | 13F | Transamerica Financial Advisors, Inc. | 0 | 0 | ||||||
| 2026-01-28 | 13F | Omega Financial Group, LLC | 66.072 | 1.154,93 | 6.204 | 1.113,89 | ||||
| 2026-02-17 | 13F | Jain Global LLC | 0 | -100,00 | 0 | |||||
| 2025-10-23 | 13F | Waycross Investment Management Co | 0 | -100,00 | 0 | |||||
| 2026-01-12 | 13F | Rialto Wealth Management, LLC | 673 | 12,17 | 63 | 8,62 | ||||
| 2026-01-23 | 13F | Aspect Partners, LLC | 1.912 | -30,87 | 180 | -33,21 | ||||
| 2026-01-06 | 13F | RDA Financial Network | 2.139 | 3,23 | 201 | -0,50 | ||||
| 2026-01-22 | 13F | Bear Mountain Capital, Inc. | 2.751 | 55,60 | 267 | 54,65 | ||||
| 2026-01-26 | 13F | Courage Miller Partners, LLC | 7.512 | 4,78 | 705 | 1,44 | ||||
| 2026-01-12 | 13F | Cordant, Inc. | 19.334 | -3,22 | 1.815 | -6,40 | ||||
| 2026-01-29 | 13F | Dunhill Financial, LLC | 2.978 | 8,02 | 280 | 4,49 | ||||
| 2026-01-08 | 13F | Wealth Enhancement Advisory Services, Llc | 26.214 | -3,83 | 2.485 | -4,79 | ||||
| 2026-01-27 | 13F | Cfm Wealth Partners Llc | 5.185 | 0,29 | 487 | -2,99 | ||||
| 2026-01-26 | 13F | Cwm, Llc | 1.566 | -12,61 | 0 | |||||
| 2026-02-12 | 13F | Bradley Foster & Sargent Inc/ct | 4.009 | 0,00 | 376 | -3,34 | ||||
| 2026-02-04 | 13F | Tsfg, Llc | 168 | 0,00 | 0 | |||||
| 2026-02-17 | 13F | Jump Financial, LLC | 41.005 | -11,57 | 3.850 | -14,49 | ||||
| 2026-02-13 | 13F | Heritage Wealth Advisors | 700 | 0,00 | 66 | -2,99 | ||||
| 2026-02-12 | 13F | Stamos Capital Partners, L.p. | 32.811 | 74,25 | 3.081 | 68,49 | ||||
| 2026-02-17 | 13F | Citadel Advisors Llc | Put | 1.087.100 | 12,44 | 102.068 | 8,75 | |||
| 2025-11-21 | 13F/A | CIBC Bancorp USA Inc. | 3.661.463 | 355.455 | ||||||
| 2026-01-14 | 13F | Matthew Goff Investment Advisor, LLC | 68.864 | -0,54 | 6.466 | -3,81 | ||||
| 2026-02-13 | 13F | Wealth Dimensions Group, Ltd. | 2.870 | -2,08 | 269 | -5,28 | ||||
| 2026-01-29 | 13F | UMA Financial Services, Inc. | 1.243 | -7,99 | 117 | -11,45 | ||||
| 2026-02-09 | 13F | Key FInancial Inc | 32 | 0,00 | 3 | 0,00 | ||||
| 2026-02-17 | 13F | D. E. Shaw & Co., Inc. | 180.647 | 62,66 | 16.961 | 57,31 | ||||
| 2026-02-06 | 13F | GPS Wealth Strategies Group, LLC | 0 | -100,00 | 0 | |||||
| 2026-02-13 | 13F | Oxford Financial Group Ltd | 79 | 0,00 | 7 | 0,00 | ||||
| 2026-02-13 | 13F | Centaurus Financial, Inc. | 11.028 | -0,31 | 1 | 0,00 | ||||
| 2025-10-17 | 13F | Optivise Advisory Services LLC | 0 | -100,00 | 0 | |||||
| 2026-02-13 | 13F | Cetera Trust Company, N.A | 300 | 0,00 | 28 | -3,45 | ||||
| 2026-02-17 | 13F | Cardiff Park Advisors, Llc | 0 | -100,00 | 0 | |||||
| 2026-01-21 | 13F | Jmac Enterprises Llc | 28.362 | 4,27 | 2.663 | 0,83 | ||||
| 2026-01-27 | 13F | Sage Financial Group Inc | 4.809 | 49,30 | 452 | 44,55 | ||||
| 2026-02-09 | 13F | Smithfield Trust Co | 188 | 0,00 | 0 | |||||
| 2025-11-14 | 13F | Centiva Capital, LP | 0 | -100,00 | 0 | -100,00 | ||||
| 2026-02-13 | 13F | Lifeworks Advisors, LLC | 11.431 | -33,76 | 1.073 | -35,94 | ||||
| 2026-02-17 | 13F | Fmr Llc | 21.562 | -3,12 | 2.024 | -6,30 | ||||
| 2025-10-10 | 13F | USA Financial Portformulas Corp | 0 | -100,00 | 0 | |||||
| 2026-02-17 | 13F | Green Harvest Asset Management LLC | 71.184 | -83,67 | 6.684 | -84,21 | ||||
| 2026-02-09 | 13F | Prospera Financial Services Inc | 6.208 | -5,09 | 583 | -8,35 | ||||
| 2026-02-13 | 13F | Colony Group, LLC | 122.380 | 94,20 | 11.490 | 87,84 | ||||
| 2026-01-16 | 13F | Taylor & Morgan Wealth Management, LLC | 2.575 | 0,90 | 242 | -2,43 | ||||
| 2026-02-10 | 13F | Bank of New York Mellon Corp | 8.566 | 0,01 | 804 | -3,25 | ||||
| 2026-02-06 | 13F | Larson Financial Group LLC | 325 | -42,07 | 31 | -44,44 | ||||
| 2026-02-02 | 13F | Oppenheimer Asset Management Inc. | 30.696 | 2.882 | ||||||
| 2026-01-29 | 13F | D.a. Davidson & Co. | 4.013 | 4,92 | 377 | 1,35 | ||||
| 2026-02-10 | 13F | New Republic Capital, LLC | 70 | -99,86 | 7 | -99,88 | ||||
| 2026-02-13 | 13F | Edgestream Partners, L.P. | 5.858 | 75,18 | 550 | 69,75 | ||||
| 2026-02-05 | 13F | AlphaCore Capital LLC | 500 | 47 | ||||||
| 2026-02-02 | 13F | Sachetta, LLC | 0 | -100,00 | 0 | |||||
| 2026-02-13 | 13F | Ambassador Advisors, LLC | 9.465 | 7,12 | 889 | 3,62 | ||||
| 2026-02-02 | 13F | Woodard & Co Asset Management Group Inc /adv | 14 | 0,00 | 1 | 0,00 | ||||
| 2026-02-10 | 13F | Guidance Point Advisors, LLC | 10.118 | -2,77 | 951 | -5,94 | ||||
| 2026-02-12 | 13F | Brinker Capital Investments, LLC | 5.879 | -10,61 | 552 | -13,48 | ||||
| 2026-02-17 | 13F | Rakuten Investment Management, Inc. | 27.536 | 0,00 | 2.661 | 0,00 | ||||
| 2026-01-15 | 13F | Westmount Partners, LLC | 5.038 | -35,48 | 473 | -37,73 | ||||
| 2025-10-22 | 13F | Massmutual Trust Co Fsb/adv | 0 | -100,00 | 0 | |||||
| 2025-11-12 | 13F | Creekmur Asset Management LLC | 2 | 0,00 | 0 | |||||
| 2026-01-29 | 13F | Kestra Private Wealth Services, Llc | 2.629 | 3,34 | 247 | 0,00 | ||||
| 2026-02-13 | 13F | Glen Eagle Advisors, LLC | 40 | 0,00 | 4 | 0,00 | ||||
| 2026-02-12 | 13F | Mount Yale Investment Advisors, LLC | 4.463 | 0,07 | 419 | -3,23 | ||||
| 2026-01-15 | 13F | Lodestone Wealth Management LLC | 1.014 | 95 | ||||||
| 2026-02-05 | 13F | Allworth Financial LP | 11.020 | 17,06 | 1.035 | 13,25 | ||||
| 2026-02-03 | 13F | Connable Office Inc | 299.557 | 1,74 | 28.125 | -1,61 | ||||
| 2026-02-17 | 13F | Bank Of America Corp /de/ | Call | 0 | -100,00 | 0 | ||||
| 2026-02-11 | 13F | Manchester Capital Management LLC | 4.286 | 402 | ||||||
| 2026-02-10 | 13F | TAGStone Capital, Inc. | 11.440 | -5,93 | 1.074 | -8,98 | ||||
| 2026-01-21 | 13F | Apella Capital, LLC | 11.671 | 287,35 | 1.096 | 277,59 | ||||
| 2026-01-23 | 13F | Avion Wealth | 77 | -46,53 | 0 | |||||
| 2026-01-20 | 13F | Stratos Wealth Advisors, LLC | 10.483 | 4,39 | 984 | 1,03 | ||||
| 2026-02-12 | 13F | AlphaCentric Advisors LLC | 10.000 | 939 | ||||||
| 2026-01-16 | 13F | Perigon Wealth Management, LLC | 5.656 | 37,31 | 531 | 33,08 | ||||
| 2026-02-12 | 13F | Tillman Hartley LLC | 3.175 | -75,51 | 298 | -76,31 | ||||
| 2026-02-17 | 13F | Tower Research Capital LLC (TRC) | 31.384 | 166,64 | 2.947 | 157,97 | ||||
| 2026-01-29 | 13F | Nbc Securities, Inc. | 4.746 | -1,51 | 446 | -4,71 | ||||
| 2026-02-13 | 13F | Neuberger Berman Group LLC | 2.251 | 0,04 | 211 | -3,21 | ||||
| 2026-01-23 | 13F | ABLE Financial Group, LLC | 0 | -100,00 | 0 | |||||
| 2026-01-23 | 13F | Valley National Advisers Inc | 107 | 0 | ||||||
| 2025-11-13 | 13F | Pinkerton Retirement Specialists, LLC | 0 | -100,00 | 0 | |||||
| 2026-01-28 | 13F | Rather & Kittrell, Inc. | 15.237 | 0,10 | 1.431 | -3,18 | ||||
| 2026-01-30 | 13F | Bogart Wealth, LLC | 5 | -93,75 | 0 | -100,00 | ||||
| 2026-02-13 | 13F | Toroso Investments, LLC | 7.900 | 132,35 | 742 | 124,55 | ||||
| 2026-01-28 | 13F | EPG Wealth Management LLC | 111 | 0,00 | 10 | 0,00 | ||||
| 2026-01-14 | 13F | Sterling Investment Advisors Llc /adv | 10.634 | 14,44 | 998 | 10,64 | ||||
| 2026-02-11 | 13F | Janney Montgomery Scott LLC | 7.961 | -0,85 | 1 | |||||
| 2026-01-20 | 13F | Independence Bank of Kentucky | 90 | 0,00 | 8 | 0,00 | ||||
| 2026-02-10 | 13F | SCS Capital Management LLC | 63.244 | -0,11 | 5.938 | -3,40 | ||||
| 2026-01-23 | 13F | Steigerwald, Gordon & Koch Inc. | 1.010 | 0,00 | 95 | -4,08 | ||||
| 2026-01-20 | 13F | Pflug Koory, LLC | 17 | 0,00 | 2 | 0,00 | ||||
| 2026-02-06 | 13F | Americana Partners, LLC | 20.644 | 104,09 | 1.938 | 97,55 | ||||
| 2026-01-12 | 13F | DAVENPORT & Co LLC | 5.005 | 15,32 | 470 | 11,40 | ||||
| 2026-01-28 | 13F | City State Bank | 60 | 0,00 | 6 | 0,00 | ||||
| 2026-02-17 | 13F | Wealth Architects, LLC | 3.275 | 0,00 | 307 | -3,15 | ||||
| 2025-11-14 | 13F | Imprint Wealth LLC | 0 | -100,00 | 0 | |||||
| 2026-02-12 | 13F | Tripletail Wealth Management, LLC | 0 | -100,00 | 0 | |||||
| 2026-02-12 | 13F | Jane Street Group, Llc | 434.344 | 296,82 | 40.781 | 283,78 | ||||
| 2026-01-27 | 13F | Checchi Capital Advisers, LLC | 36.932 | 31,78 | 3.468 | 27,46 | ||||
| 2026-02-13 | 13F | Aft, Forsyth & Sober, LLC | 2.450 | 0,00 | 230 | -2,95 | ||||
| 2026-02-13 | 13F | MAI Capital Management | 12.656 | 1,52 | 1.188 | -1,82 | ||||
| 2026-02-13 | 13F | Garrison Point Advisors, Llc | 2.821 | -14,95 | 265 | -18,01 | ||||
| 2026-03-05 | 13F | Gunpowder Capital Management, LLC dba Oliver Wealth Management | 60 | 6 | ||||||
| 2026-03-06 | 13F | Hsbc Holdings Plc | 4.245.726 | 399.722 | ||||||
| 2026-02-12 | 13F | Foster Dykema Cabot & Partners, Llc | 0 | -100,00 | 0 | |||||
| 2026-02-13 | 13F | Luminist Capital LLC | 183 | -37,33 | 17 | -39,29 | ||||
| 2026-01-15 | 13F | Rockland Trust Co | 3.461 | 16,61 | 325 | 12,50 | ||||
| 2026-02-13 | 13F | 1832 Asset Management L.P. | 3.053 | -5,66 | 287 | -8,92 | ||||
| 2026-02-17 | 13F | Anson Funds Management LP | Put | 0 | -100,00 | 0 | ||||
| 2026-02-05 | 13F | Atria Investments Llc | 12.111 | 1.137 | ||||||
| 2026-01-23 | 13F | Smallwood Wealth Investment Management, LLC | 4 | 100,00 | 0 | |||||
| 2026-01-26 | 13F/A | Phocas Financial Corp. | 2.350 | 0,00 | 221 | -3,51 | ||||
| 2026-01-30 | 13F | Kohmann Bosshard Financial Services, LLC | 1.952 | 183 | ||||||
| 2026-01-21 | 13F | Capital Investment Advisory Services, LLC | 5 | -76,19 | 0 | -100,00 | ||||
| 2026-02-10 | 13F | Consolidated Capital Management, Llc | 51.797 | 4.863 | ||||||
| 2026-02-17 | 13F | Wiley Bros.-aintree Capital, Llc | 4.554 | -11,85 | 428 | -14,77 | ||||
| 2026-02-05 | 13F | Gamco Investors, Inc. Et Al | 2.257 | -0,04 | 212 | -3,65 | ||||
| 2026-02-17 | 13F | J. Goldman & Co LP | 46.342 | -79,66 | 4.351 | -80,32 | ||||
| 2026-02-18 | 13F | GWM Advisors LLC | 0 | -100,00 | 0 | |||||
| 2026-01-12 | 13F | Abound Wealth Management | 34 | -60,92 | 3 | -62,50 | ||||
| 2026-01-07 | 13F | KFA Private Wealth Group, LLC | 2.557 | 0,08 | 240 | -3,23 | ||||
| 2026-02-05 | 13F | L & S Advisors Inc | 3.370 | 316 | ||||||
| 2026-02-17 | 13F | Advisory Services Network, LLC | 4.777 | -14,92 | 449 | -17,80 | ||||
| 2026-02-05 | 13F | Tfo-tdc, Llc | 5.913 | 0,02 | 555 | -3,14 | ||||
| 2026-02-17 | 13F | Cresset Asset Management, LLC | 4.354 | 0,00 | 409 | -3,32 | ||||
| 2026-02-05 | 13F | Armor Investment Advisors, LLC | 593 | 0,00 | 56 | -3,51 | ||||
| 2025-10-07 | 13F | EWG Elevate Inc. | 4.902 | -84,45 | 476 | -84,10 | ||||
| 2026-02-06 | 13F/A | Rathbone Brothers plc | 3.431 | -12,87 | 322 | -15,71 | ||||
| 2026-01-21 | 13F | Country Trust Bank | 7 | 0,00 | 1 | |||||
| 2026-02-17 | 13F | Advisor Group Holdings, Inc. | 40.357 | -26,66 | 3.791 | -29,17 | ||||
| 2026-02-19 | 13F | Atomi Financial Group, Inc. | 2.785 | -29,62 | 261 | -32,03 | ||||
| 2026-02-17 | 13F | Dimension Capital Management Llc | 6.329 | -4,09 | 594 | -7,19 | ||||
| 2026-02-13 | 13F | Gen-Wealth Partners Inc | 7.314 | 12,35 | 687 | 8,54 | ||||
| 2025-11-13 | 13F | Jefferies Financial Group Inc. | 0 | -100,00 | 0 | -100,00 | ||||
| 2025-11-14 | 13F | J. Goldman & Co LP | Put | 0 | -100,00 | 0 | -100,00 | |||
| 2026-01-07 | 13F | Magnus Financial Group LLC | 165.951 | 5,51 | 15.581 | 2,05 | ||||
| 2026-01-23 | 13F | Clear Creek Financial Management, LLC | 5.542 | -7,48 | 520 | -10,50 | ||||
| 2025-11-04 | 13F | Flaharty Asset Management, LLC | 0 | -100,00 | 0 | |||||
| 2026-01-23 | 13F | Assetmark, Inc | 268 | 145,87 | 25 | 150,00 | ||||
| 2026-01-09 | 13F | Independence Wealth Advisors, LLC | 5.407 | 508 | ||||||
| 2026-02-10 | 13F | Root Financial Partners, LLC | 25 | 2 | ||||||
| 2026-01-28 | 13F | Chicago Partners Investment Group LLC | 2.141 | 0,14 | 206 | -0,49 | ||||
| 2026-01-28 | 13F | Milestone Asset Management, Llc | 0 | -100,00 | 0 | |||||
| 2026-02-11 | 13F | Franklin Resources Inc | 3.962 | 41,40 | 372 | 36,40 | ||||
| 2026-01-23 | 13F | Investment Advisory Group, LLC | 4.110 | 0,00 | 386 | -3,27 | ||||
| 2026-02-17 | 13F | Anson Funds Management LP | Call | 0 | -100,00 | 0 | ||||
| 2026-01-09 | 13F | Zrc Wealth Management, Llc | 6.790 | -0,44 | 637 | -3,78 | ||||
| 2026-02-13 | 13F | OpenArc Corporate Advisory, LLC | 3.609 | 339 | ||||||
| 2026-02-05 | 13F | Mission Wealth Management, Lp | 54.622 | -9,63 | 5.129 | -12,60 | ||||
| 2026-02-13 | 13F | Volterra Technologies LP | 0 | -100,00 | 0 | -100,00 | ||||
| 2026-02-11 | 13F | Capital Analysts, Inc. | 0 | -100,00 | 0 | |||||
| 2026-02-05 | 13F | Millennium Capital Advisors, LLC | 0 | -100,00 | 0 | |||||
| 2026-02-05 | 13F | Cambridge Investment Research Advisors, Inc. | 53.303 | -13,57 | 5 | 0,00 | ||||
| 2026-02-04 | 13F | Dogwood Wealth Management LLC | 21.882 | 7,23 | 2.054 | 3,74 | ||||
| 2026-01-30 | 13F | Us Bancorp \de\ | 379.559 | -4,01 | 35.637 | -7,16 | ||||
| 2025-11-14 | 13F | Hbk Investments L P | Put | 0 | -100,00 | 0 | -100,00 | |||
| 2025-10-17 | 13F | Indiana Trust & Investment Management CO | 0 | -100,00 | 0 | |||||
| 2026-02-10 | 13F | Measured Wealth Private Client Group, LLC | 27.901 | -46,61 | 2.620 | -48,37 | ||||
| 2025-11-13 | 13F | Twin Tree Management, LP | Call | 0 | -100,00 | 0 | -100,00 | |||
| 2026-01-21 | 13F | Leo Wealth, LLC | 4.548 | 427 | ||||||
| 2026-02-05 | 13F | HighMark Wealth Management LLC | 375 | 0,00 | 35 | -2,78 | ||||
| 2026-02-11 | 13F | Arrowpoint Investment Partners (Singapore) Pte. Ltd. | 0 | -100,00 | 0 | |||||
| 2026-02-17 | 13F | Consultiva Wealth Management, Corp. | 101 | 0,00 | 9 | 0,00 | ||||
| 2026-02-13 | 13F | Centiva Capital, LP | Call | 32.000 | -48,47 | 3.004 | -50,17 | |||
| 2026-02-04 | 13F | Nwam Llc | 6.908 | -0,12 | 650 | -3,27 | ||||
| 2026-02-17 | 13F | Equitable Holdings, Inc. | 3.316 | -8,62 | 311 | -11,65 | ||||
| 2026-02-13 | 13F | Squarepoint Ops LLC | Call | 31.900 | -24,23 | 2.995 | -26,72 | |||
| 2026-02-13 | 13F | Walleye Trading LLC | 0 | -100,00 | 0 | -100,00 | ||||
| 2026-02-13 | 13F | Squarepoint Ops LLC | Put | 54.200 | -5,41 | 5.089 | -8,52 | |||
| 2026-02-13 | 13F | Crossingbridge Advisors, LLC | 10.000 | 300,00 | 943 | 289,67 | ||||
| 2025-11-10 | 13F | Sigma Planning Corp | 0 | -100,00 | 0 | |||||
| 2025-11-12 | 13F | RiverGlades Family Offices LLC | 26.138 | 0,75 | 2.537 | 3,21 | ||||
| 2026-02-12 | 13F | Sand Hill Global Advisors, LLC | 183.801 | 16,59 | 17.257 | 12,76 | ||||
| 2026-02-10 | 13F | Taylor, Cottrill, Erickson & Associates, Inc. | 35.036 | -0,53 | 3.290 | -3,80 | ||||
| 2026-02-12 | 13F | Commonwealth Equity Services, Llc | 50.014 | -10,20 | 4.696 | 93.800,00 | ||||
| 2026-01-23 | 13F | Farther Finance Advisors, LLC | 5.210 | -60,50 | 489 | -61,80 | ||||
| 2026-02-12 | 13F | Colonial Trust Advisors | 1.083 | 102 | ||||||
| 2026-01-08 | 13F | DDFG, Inc | 92.521 | 2,30 | 8.687 | -1,07 | ||||
| 2026-01-27 | 13F | Davies Financial Advisors, Inc. | 0 | -100,00 | 0 | |||||
| 2026-02-02 | 13F | Oppenheimer & Co Inc | 3.362 | -2,78 | 316 | -5,97 | ||||
| 2026-02-06 | 13F | IFP Advisors, Inc | 1.532 | -2,98 | 144 | -6,54 | ||||
| 2025-11-17 | 13F | LGT Financial Advisors LLC | 0 | -100,00 | 0 | |||||
| 2025-10-31 | 13F | BCJ Capital Management, LLC | 0 | -100,00 | 0 | |||||
| 2026-02-04 | 13F | Gray Private Wealth, LLC | 18.728 | 7,74 | 1.758 | 4,21 | ||||
| 2026-02-12 | 13F | Chilton Capital Management Llc | 75 | -93,42 | 7 | -93,64 | ||||
| 2025-11-14 | 13F | Wolverine Trading, Llc | 1.665.815 | 25,46 | 161.001 | 28,82 | ||||
| 2025-11-14 | 13F | Wolverine Trading, Llc | Call | 54.700 | 14,92 | 5.287 | 17,99 | |||
| 2025-11-14 | 13F | Wolverine Trading, Llc | Put | 81.800 | 3,68 | 7.906 | 6,45 | |||
| 2026-02-10 | 13F | Bnp Paribas Arbitrage, Sa | 2.126.334 | -13,43 | 199.641 | -16,28 | ||||
| 2025-11-21 | 13F/A | Royal Bank Of Canada | Put | 0 | -100,00 | 0 | -100,00 | |||
| 2026-02-09 | 13F | Glenview Trust Co | 26.443 | -1,11 | 2.483 | -4,35 | ||||
| 2026-01-21 | 13F | Paladin Advisory Group, LLC | 3.694 | 0,00 | 347 | -3,35 | ||||
| 2026-02-04 | 13F | Valeo Financial Advisors, LLC | 5.286 | -0,51 | 496 | -3,69 | ||||
| 2025-11-12 | 13F | HAP Trading, LLC | Call | 12.300 | 30 | |||||
| 2026-02-03 | 13F | Orion Capital Management LLC | 52 | 1,96 | 5 | 0,00 | ||||
| 2026-02-13 | 13F | Mariner, LLC | 112.443 | -40,42 | 10.557 | -42,37 | ||||
| 2026-01-22 | 13F | CarsonAllaria Wealth Management, Ltd. | 53.065 | 6,90 | 4.982 | 3,40 | ||||
| 2026-01-28 | 13F | Barrett & Company, Inc. | 924 | 0,00 | 87 | -3,37 | ||||
| 2025-11-12 | 13F | Banco Santander, S.A. | 0 | -100,00 | 0 | |||||
| 2025-10-21 | 13F | Optimum Investment Advisors | 1.312 | -22,09 | 127 | -20,13 | ||||
| 2026-02-13 | 13F | Motiv8 Investments LLC | 5 | 0 | ||||||
| 2026-02-05 | 13F | Stephens Inc /ar/ | 34.942 | 0,01 | 3.281 | -3,30 | ||||
| 2026-02-17 | 13F | Discovery Capital Management, Llc / Ct | 10.055 | 944 | ||||||
| 2026-02-06 | 13F | Ferguson Johnson Wealth Management Inc | 3.501 | 0 | ||||||
| 2026-02-13 | 13F | Bank Of Nova Scotia | 0 | -100,00 | 0 | |||||
| 2026-02-17 | 13F | Jones Financial Companies Lllp | 8.164 | 7,00 | 767 | 4,08 | ||||
| 2026-02-13 | 13F | Citigroup Inc | 1.958.154 | 43,86 | 183.851 | 39,14 | ||||
| 2026-02-09 | 13F | Keating Financial Advisory Services, Inc. | 1.846 | 173 | ||||||
| 2026-02-13 | 13F | Y-Intercept (Hong Kong) Ltd | 4.549 | -4,01 | 427 | -7,17 | ||||
| 2026-02-13 | 13F | Kestra Advisory Services, LLC | 0 | -100,00 | 0 | |||||
| 2026-02-17 | 13F | Cape Investment Advisory, Inc. | 234 | -19,86 | 22 | -25,00 | ||||
| 2026-02-12 | 13F | Renaissance Technologies Llc | 63.800 | -9,12 | 5.990 | -12,11 | ||||
| 2026-02-13 | 13F | Maven Securities LTD | 79.871 | -19,83 | 7.503 | -22,37 | ||||
| 2025-11-14 | 13F | Qube Research & Technologies Ltd | 0 | -100,00 | 0 | |||||
| 2026-01-14 | 13F | Jfs Wealth Advisors, Llc | 29.229 | -0,62 | 2.744 | -3,89 | ||||
| 2026-02-06 | 13F | Global Retirement Partners, LLC | 17.588 | -12,33 | 1.651 | -15,20 | ||||
| 2026-01-30 | 13F | Covenant Asset Management, LLC | 6.557 | -1,43 | 616 | -4,65 | ||||
| 2026-02-10 | 13F | Goldman Sachs Group Inc | Call | 100.000 | 9.389 | |||||
| 2026-02-12 | 13F | Grey Fox Wealth Advisors, LLC | 14.027 | 34,46 | 1.317 | 30,04 | ||||
| 2026-02-03 | 13F | International Assets Investment Management, Llc | 150 | 14 | ||||||
| 2026-02-10 | 13F | Exit Wealth Advisors, LLC. | 7.270 | 90,16 | 683 | 83,83 | ||||
| 2026-02-02 | 13F | One Wealth Advisors, LLC | 0 | -100,00 | 0 | |||||
| 2026-02-13 | 13F | Healthcare Of Ontario Pension Plan Trust Fund | 300.000 | 0,00 | 28.167 | -3,29 | ||||
| 2026-01-16 | 13F | Tower Wealth Partners, Inc. | 4.923 | 14,81 | 462 | 11,06 | ||||
| 2026-02-17 | 13F | Sherman Porfolios, Llc | 0 | -100,00 | 0 | |||||
| 2026-01-22 | 13F | Upper Left Wealth Management, LLC | 14.254 | -0,28 | 1.338 | -3,53 | ||||
| 2026-01-21 | 13F | Finley Financial, LLC | 10.585 | -2,58 | 994 | -5,79 | ||||
| 2026-02-17 | 13F | Running Point Capital Advisors, LLC | 39.223 | -23,53 | 3.683 | -26,05 | ||||
| 2025-10-24 | 13F | Bristlecone Advisors, LLC | 5.134 | -10,98 | 498 | -8,79 | ||||
| 2026-01-06 | 13F | Investors Research Corp | 48 | 0,00 | 5 | 0,00 | ||||
| 2026-02-10 | 13F | Lido Advisors, LLC | 15.449 | 3,47 | 1.498 | 3,31 | ||||
| 2026-02-17 | 13F | Aqr Capital Management Llc | 3.116 | 293 | ||||||
| 2026-01-21 | 13F | Financial & Tax Architects, LLC | 11.307 | -2,93 | 1.062 | -6,11 | ||||
| 2026-02-13 | 13F | Graybill Bartz & Assoc Ltd | 0 | -100,00 | 0 | |||||
| 2026-02-17 | 13F | Tudor Investment Corp Et Al | Call | 52.000 | 4,00 | 4.882 | 0,58 | |||
| 2026-02-17 | 13F | Tudor Investment Corp Et Al | 4.150 | -94,07 | 390 | -94,27 | ||||
| 2026-02-13 | 13F | TCM Advisors, LLC | 2.872 | -4,01 | ||||||
| 2026-02-17 | 13F | Tudor Investment Corp Et Al | Put | 129.400 | -50,12 | 12.149 | -51,76 | |||
| 2026-01-27 | 13F | Foundation Wealth Management, LLC | 15.940 | -1,84 | 1.499 | -4,95 | ||||
| 2026-02-12 | 13F | Scotia Capital Inc. | 10.644 | 1,61 | 999 | -1,67 | ||||
| 2026-02-04 | 13F | Clark Wealth Partners | 0 | -100,00 | 0 | |||||
| 2026-02-17 | 13F | Capital Fund Management S.a. | Call | 61.500 | -45,96 | 5.774 | -47,73 | |||
| 2026-02-13 | 13F | Integrated Wealth Concepts LLC | 4.771 | -22,04 | 448 | -24,75 | ||||
| 2026-02-17 | 13F | Capital Fund Management S.a. | Put | 47.700 | -31,95 | 4.479 | -34,20 | |||
| 2026-02-12 | 13F | BlackRock, Inc. | 638.455 | 2,66 | 59.945 | -0,71 | ||||
| 2025-11-14 | 13F | Point72 Europe (London) LLP | 0 | -100,00 | 0 | |||||
| 2026-01-16 | 13F | Forte Asset Management Llc | 34.141 | 7,06 | 3.206 | 3,55 | ||||
| 2026-02-13 | 13F | Allie Family Office LLC | 50.499 | 0,26 | 4.738 | -3,01 | ||||
| 2025-10-28 | 13F | Pinnacle Financial Partners Inc | 0 | -100,00 | 0 | -100,00 | ||||
| 2026-01-29 | 13F | Concord Wealth Partners | 177 | -49,43 | 17 | -52,94 | ||||
| 2026-02-05 | 13F | Center for Financial Planning, Inc. | 2.286 | 0,00 | 215 | -3,17 | ||||
| 2026-02-12 | 13F | Cibc World Markets Corp | 3.437.596 | -6,08 | 322.756 | -6,95 | ||||
| 2026-01-20 | 13F | Ethos Financial Group, LLC | 9.176 | 0,00 | 862 | -3,26 | ||||
| 2026-02-13 | 13F | Verition Fund Management LLC | Put | 35.300 | 3.314 | |||||
| 2026-02-04 | 13F | Mascoma Wealth Management LLC | 35 | 0,00 | 3 | 0,00 | ||||
| 2026-02-17 | 13F | Banco Bilbao Vizcaya Argentaria, S.a. | 0 | -100,00 | 0 | |||||
| 2025-11-14 | 13F | Wood Tarver Financial Group, LLC | 0 | -100,00 | 0 | |||||
| 2026-02-13 | 13F | Brown Advisory Inc | 12.220 | -0,33 | 1.147 | -3,61 | ||||
| 2026-02-17 | 13F | Jain Global LLC | Put | 250.000 | 23.472 | |||||
| 2026-02-17 | 13F | Northern Trust Corp | 18.791 | -0,86 | 1.764 | -4,13 | ||||
| 2026-02-17 | 13F | NorthRock Partners, LLC | 16.206 | 1.522 | ||||||
| 2026-02-17 | 13F | Jain Global LLC | Call | 50.000 | 4.694 | |||||
| 2026-02-02 | 13F | Fifth Third Bancorp | 402 | 38 |