Grundlæggende statistik
| Institutionelle aktier (lange) | 195.151.529 - 100,02% (ex 13D/G) - change of -45,19MM shares -18,80% MRQ |
| Institutionel værdi (lang) | $ 14.648.093 USD ($1000) |
Institutionelt ejerskab og aktionærer
The Cooper Companies, Inc. (US:COO) har 671 institutionelle ejere og aktionærer, der har indsendt 13D/G- eller 13F-formularer til Securities Exchange Commission (SEC). Disse institutioner har i alt 195,151,529 aktier. Største aktionærer omfatter Vanguard Group Inc, BlackRock, Inc., Capital World Investors, State Street Corp, Kayne Anderson Rudnick Investment Management Llc, Price T Rowe Associates Inc /md/, T. Rowe Price Investment Management, Inc., Geode Capital Management, Llc, Wellington Management Group Llp, and Franklin Resources Inc .
The Cooper Companies, Inc. (NasdaqGS:COO) institutionel ejerskabsstruktur viser aktuelle positioner i virksomheden efter institutioner og fonde, samt seneste ændringer i positionsstørrelse. Større aktionærer kan omfatte individuelle investorer, investeringsforeninger, hedgefonde eller institutioner. Skema 13D angiver, at investoren besidder (eller besidder) mere end 5 % af virksomheden og har til hensigt (eller har til hensigt at) aktivt at forfølge en ændring i forretningsstrategi. Skema 13G indikerer en passiv investering på over 5%.
The share price as of May 1, 2026 is 62,36 / share. Previously, on May 5, 2025, the share price was 81,57 / share. This represents a decline of 23,55% over that period.

Fondens stemningsscore
Fund Sentiment Score (fka Ownership Accumulation Score) finder de aktier, der bliver mest købt af fonde. Det er resultatet af en sofistikeret, multi-faktor kvantitativ model, der identificerer virksomheder med de højeste niveauer af institutionel akkumulering. Scoringsmodellen bruger en kombination af den samlede stigning i oplyste ejere, ændringerne i porteføljeallokeringer i disse ejere og andre målinger. Tallet går fra 0 til 100, hvor højere tal indikerer et højere niveau af akkumulering for sine jævnaldrende, og 50 er gennemsnittet.
Opdateringsfrekvens: Dagligt
Se Ownership Explorer, som giver en liste over højest rangerende virksomheder.
AI+ Ask Fintel’s AI assistant about The Cooper Companies, Inc..
Select a question to share a public post with an AI-crafted answer.
Thinking of good questions…
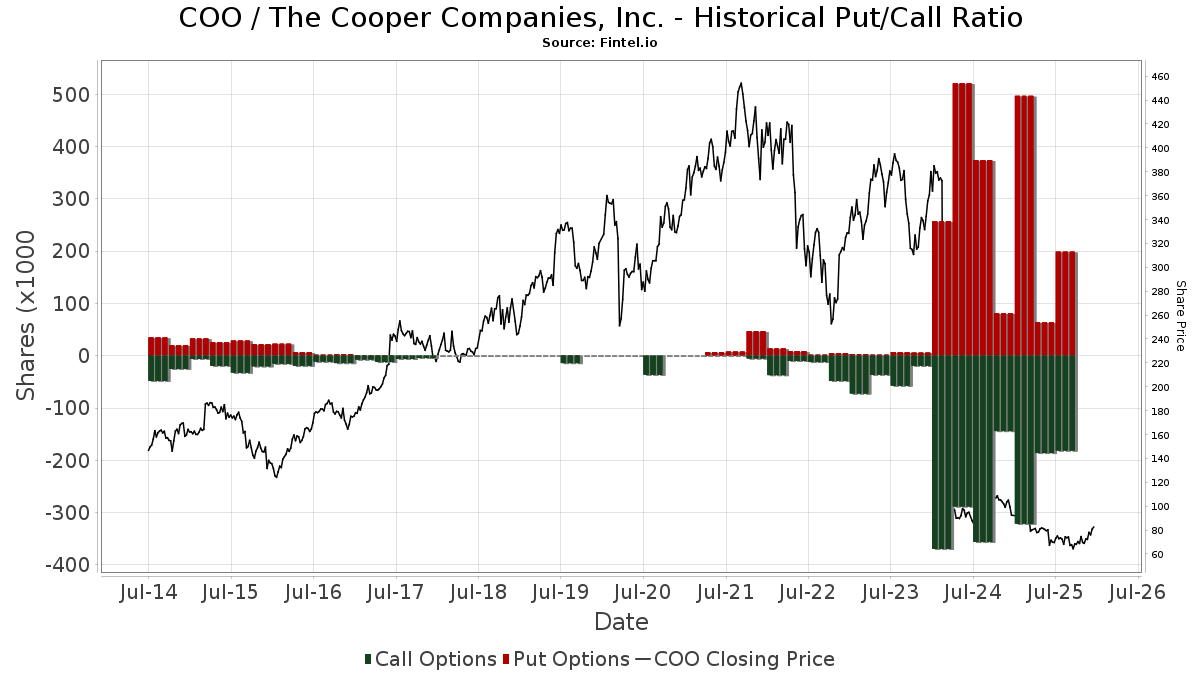
Institutionel Put/Call-forhold
Ud over at indberette standardaktie- og gældsudstedelser skal institutter med mere end 100 mill. aktiver under forvaltning også oplyse deres put- og call-optionsbeholdninger. Da salgsoptioner generelt indikerer negativ stemning, og købsoptioner indikerer positiv stemning, kan vi få en fornemmelse af den overordnede institutionelle stemning ved at plotte forholdet mellem put og kald. Diagrammet til højre viser det historiske put/call-forhold for dette instrument.
Brug af Put/Call Ratio som en indikator for investorernes stemning overvinder en af de vigtigste mangler ved at bruge totalt institutionelt ejerskab, som er, at en betydelig mængde af aktiver under forvaltning investeres passivt for at spore indekser. Passivt forvaltede fonde køber typisk ikke optioner, så indikatoren for put/call-forholdet følger mere nøje følelsen af aktivt forvaltede fonde.
13D/G-arkivering
Vi præsenterer 13D/G ansøgninger separat fra 13F ansøgninger på grund af den forskellige behandling af SEC. 13D/G-ansøgninger kan indgives af grupper af investorer (med én ledende), hvorimod 13F-ansøgninger ikke kan. Dette resulterer i situationer, hvor en investor kan indsende en 13D/G, der rapporterer én værdi for de samlede aktier (der repræsenterer alle de aktier, der ejes af investorgruppen), men derefter indsender en 13F, der rapporterer en anden værdi for de samlede aktier (der udelukkende repræsenterer deres egne) ejendomsret). Det betyder, at aktieejerskab af 13D/G-arkiver og 13F-arkiveringer ofte ikke er direkte sammenlignelige, så vi præsenterer dem separat.
Bemærk: Fra den 16. maj 2021 viser vi ikke længere ejere, der ikke har indsendt en 13D/G inden for det seneste år. Tidligere viste vi den fulde historie af 13D/G-arkiver. Generelt skal enheder, der er forpligtet til at indgive 13D/G-ansøgninger, indgive mindst årligt, før de indsender en afsluttende ansøgning. Dog forlader fonde nogle gange positioner uden at indsende en afsluttende ansøgning (dvs. de afvikler), så visning af den fulde historie resulterede nogle gange i forvirring om det nuværende ejerskab. For at undgå forvirring viser vi nu kun 'aktuelle' ejere - det vil sige - ejere, der har anmeldt inden for det seneste år.
Upgrade to unlock premium data.
| Fil dato | Form | Investor | Forrige Aktier |
Seneste Aktier |
Δ Aktier (Procent) |
Ejendomsret (Procent) |
Δ Ejerskab (Procent) |
|
|---|---|---|---|---|---|---|---|---|
| 2025-11-13 | Capital World Investors | 10,973,924 | 5.50 | |||||
| 2025-04-17 | BlackRock, Inc. | 16,667,737 | 14,137,034 | -15.18 | 7.10 | -15.48 |
13F og NPORT arkivering
Detaljer om 13F-arkivering er gratis. Detaljer om NP-ansøgninger kræver et premium-medlemskab. Grønne rækker angiver nye positioner. Røde rækker angiver lukkede positioner. Klik på linket ikon for at se den fulde transaktionshistorik.
Opgrader
for at låse premium-data op og eksportere til Excel ![]() .
.
| Fil dato | Kilde | Investor | Type | Gennemsnitlig pris (Øst) |
Aktier | Δ Aktier (%) |
Rapporteret Værdi ($1000) |
Δ Værdi (%) |
Port Alloc (%) |
|
|---|---|---|---|---|---|---|---|---|---|---|
| 2025-11-14 | 13F | Mbb Public Markets I Llc | 0 | -100,00 | 0 | |||||
| 2026-04-20 | 13F | Assenagon Asset Management S.A. | 67.934 | -74,96 | 4.857 | -78,16 | ||||
| 2026-02-02 | 13F | Danske Bank A/s | 98.119 | 5,25 | 8.042 | 25,82 | ||||
| 2026-01-12 | 13F | Rialto Wealth Management, LLC | 832 | -49,21 | 68 | -39,29 | ||||
| 2026-02-10 | 13F | Mutual Of America Capital Management Llc | 31.874 | 1,88 | 2.612 | 21,83 | ||||
| 2026-01-15 | 13F | Burns Matteson Capital Management, LLC | 5.554 | -5,35 | 455 | 13,18 | ||||
| 2026-02-13 | 13F | Nfj Investment Group, Llc | 85.579 | -12,04 | 7.014 | 5,16 | ||||
| 2026-02-13 | 13F | Sumitomo Life Insurance Co | 3.908 | 1,11 | 320 | 21,21 | ||||
| 2026-04-29 | 13F | Skopos Labs, Inc. | 7.180 | 52,67 | 513 | 32,90 | ||||
| 2026-01-15 | 13F | Allspring Global Investments Holdings, LLC | 8.445 | -0,60 | 685 | 18,34 | ||||
| 2025-11-14 | 13F | Texas Permanent School Fund | 0 | -100,00 | 0 | |||||
| 2026-01-07 | 13F | Aventura Private Wealth, LLC | 5 | 0 | ||||||
| 2026-04-29 | 13F | Hughes Financial Services, LLC | 11 | 0,00 | 1 | |||||
| 2026-01-26 | 13F | Mirae Asset Global Investments Co., Ltd. | 37.436 | 18,26 | 3.068 | 41,38 | ||||
| 2026-02-13 | 13F | Transamerica Financial Advisors, Inc. | 148 | 12 | ||||||
| 2026-01-21 | 13F | Westfuller Advisors, LLC | 0 | -100,00 | 0 | |||||
| 2026-02-10 | 13F | Argent Trust Co | 5.496 | 450 | ||||||
| 2026-02-13 | 13F | Wells Fargo & Company/mn | 1.352.790 | 12,43 | 110.875 | 34,40 | ||||
| 2026-02-09 | 13F | Legal & General Group Plc | 937.729 | -26,60 | 76.856 | -12,25 | ||||
| 2025-11-14 | 13F | Strategic Wealth Partners, Ltd. | 608 | 0,00 | 42 | -4,65 | ||||
| 2026-02-12 | 13F | MetLife Investment Management, LLC | 47.662 | -3,71 | 3.906 | 15,12 | ||||
| 2026-04-23 | 13F | Jones Kertz & Associates, Inc. | 33.481 | -1,03 | 2.394 | -13,67 | ||||
| 2026-04-29 | 13F | Envestnet Portfolio Solutions, Inc. | 7.418 | -19,87 | 530 | -30,08 | ||||
| 2026-04-13 | 13F | Clayton Financial Group LLC | 13 | 0,00 | 1 | -100,00 | ||||
| 2026-04-30 | 13F | LRI Investments, LLC | 86 | -93,13 | 6 | -94,12 | ||||
| 2026-04-24 | 13F | Boston Trust Walden Corp | 1.159.562 | -6,30 | 82.909 | -18,26 | ||||
| 2026-02-13 | 13F | Dai-Ichi Life Insurance Company, Ltd | 8.372 | 0,00 | 686 | 19,72 | ||||
| 2026-04-21 | 13F | Wedbush Securities Inc | 0 | -100,00 | 0 | |||||
| 2026-04-30 | 13F | Personal Cfo Solutions, Llc | 0 | -100,00 | 0 | |||||
| 2026-04-24 | 13F | Yousif Capital Management, Llc | 18.404 | -2,53 | 1.316 | -13,54 | ||||
| 2026-04-13 | 13F | Mather Group, Llc. | 1.489 | 106 | ||||||
| 2026-04-28 | 13F | Bogart Wealth, LLC | 7 | -22,22 | 1 | |||||
| 2026-02-13 | 13F | Aurora Investment Counsel | 22.381 | 8,13 | 1.834 | 29,25 | ||||
| 2026-02-06 | 13F | HighTower Advisors, LLC | 12.055 | -15,99 | 988 | 0,51 | ||||
| 2026-02-13 | 13F | Taproot Management LP | 113.846 | 9.331 | ||||||
| 2025-11-12 | 13F | Andra AP-fonden | 0 | -100,00 | 0 | |||||
| 2026-02-13 | 13F | Pinnacle Wealth Planning Services, Inc. | 89 | 7 | ||||||
| 2026-02-13 | 13F | Mml Investors Services, Llc | 40.114 | -9,05 | 3.288 | 8,73 | ||||
| 2025-11-14 | 13F | Evelyn Partners Investment Management LLP | 0 | -100,00 | 0 | |||||
| 2025-11-05 | 13F | Soundwatch Capital LLC | 0 | -100,00 | 0 | |||||
| 2026-02-17 | 13F | Sapience Investments, LLC | 5.979 | -0,17 | 490 | 19,51 | ||||
| 2026-04-30 | 13F | Manning & Napier Advisors Llc | 1.443.901 | -7,68 | 103.239 | -19,96 | ||||
| 2026-04-16 | 13F | Beese Fulmer Investment Management, Inc. | 3.415 | 244 | ||||||
| 2026-02-13 | 13F | Edgestream Partners, L.P. | 0 | -100,00 | 0 | |||||
| 2026-05-01 | 13F | Torray Llc | 25.435 | 2,47 | 1.819 | -10,62 | ||||
| 2026-02-05 | 13F | Northwestern Mutual Investment Management Company, Llc | 6.352 | -0,13 | 521 | 19,27 | ||||
| 2026-04-23 | 13F | Marquette Asset Management, LLC | 29 | 107,14 | 2 | 100,00 | ||||
| 2026-04-15 | 13F | Activest Wealth Management | 307 | 96,79 | 22 | 75,00 | ||||
| 2026-02-04 | 13F | HighPoint Advisor Group LLC | 3.484 | 2,05 | 286 | 21,79 | ||||
| 2026-02-06 | 13F | Covestor Ltd | 141 | 0,00 | 0 | |||||
| 2026-04-27 | 13F | HB Wealth Management, LLC | 7.120 | 72,19 | 509 | 50,59 | ||||
| 2026-04-22 | 13F | Sterling Capital Management LLC | 6.592 | -44,18 | 471 | -51,29 | ||||
| 2026-02-17 | 13F | Woodline Partners LP | 293.961 | 1,40 | 24.093 | 21,22 | ||||
| 2026-02-10 | 13F | Sustainable Growth Advisers, LP | 3.368.567 | -18,49 | 276.088 | -2,56 | ||||
| 2026-01-29 | 13F | Vanguard Group Inc | 23.548.923 | -1,78 | 1.930.070 | 17,42 | ||||
| 2026-04-22 | 13F | Patriot Financial Group Insurance Agency, LLC | 17.548 | 118,10 | 1.255 | 90,29 | ||||
| 2026-02-17 | 13F | Susquehanna Portfolio Strategies, LLC | 263.274 | -21,99 | 21.578 | -6,74 | ||||
| 2026-02-11 | 13F | Metis Global Partners, LLC | 20.715 | 93,62 | 1.698 | 131,51 | ||||
| 2026-02-12 | 13F | Bank Of Montreal /can/ | 173.321 | -15,24 | 14.205 | 1,33 | ||||
| 2025-11-07 | 13F | Sierra Ocean, Llc | 0 | -100,00 | 0 | |||||
| 2026-02-13 | 13F | Mariner, LLC | 223.360 | 23,66 | 18.309 | 47,86 | ||||
| 2026-04-21 | 13F | Red Tortoise LLC | 28 | -3,45 | 2 | 0,00 | ||||
| 2026-02-13 | 13F | Williams Jones Wealth Management, LLC. | 19.364 | 61,37 | 1.587 | 93,07 | ||||
| 2026-02-17 | 13F | Tcw Group Inc | 3.114 | 255 | ||||||
| 2026-02-18 | 13F | Mackenzie Financial Corp | 527.678 | 2,75 | 43.432 | 23,35 | ||||
| 2026-02-17 | 13F | Clearline Capital LP | 40.636 | -89,31 | 3.331 | -87,22 | ||||
| 2026-02-04 | 13F | Plato Investment Management Ltd | 0 | -100,00 | 0 | |||||
| 2026-02-13 | 13F | Neuberger Berman Group LLC | 3.637.899 | -6,21 | 297.317 | 11,80 | ||||
| 2026-01-29 | 13F | Dunhill Financial, LLC | 49 | 13,95 | 4 | 100,00 | ||||
| 2026-02-17 | 13F | Snowden Capital Advisors LLC | 7.577 | 62,11 | 621 | 94,06 | ||||
| 2026-01-26 | 13F | Ckw Financial Group | 93 | 0,00 | 0 | |||||
| 2026-04-30 | 13F | Nisa Investment Advisors, Llc | 106.284 | -2,21 | 7.599 | -14,69 | ||||
| 2026-01-29 | 13F | State Of Michigan Retirement System | 52.044 | -3,52 | 4.266 | 15,33 | ||||
| 2026-01-23 | 13F | LOM Asset Management Ltd | 200 | -54,55 | 16 | -46,67 | ||||
| 2026-04-15 | 13F | Financial Management Professionals, Inc. | 76 | 0,00 | 5 | -16,67 | ||||
| 2026-02-11 | 13F | Group One Trading, L.p. | 911 | 75 | ||||||
| 2026-04-24 | 13F | Mitchell & Pahl Private Wealth, Llc | 10.974 | 4,87 | 785 | -8,52 | ||||
| 2026-02-17 | 13F | Ameriprise Financial Inc | 402.405 | -83,86 | 32.981 | -80,71 | ||||
| 2026-02-17 | 13F | Maryland State Retirement & Pension System | 9.704 | 0,00 | 795 | 19,55 | ||||
| 2026-02-12 | 13F | JPL Wealth Management, LLC | 0 | -100,00 | 0 | |||||
| 2026-02-13 | 13F | Rafferty Asset Management, LLC | 21.404 | -3,36 | 1.754 | 15,55 | ||||
| 2026-02-12 | 13F | Skandinaviska Enskilda Banken AB (publ) | 275.837 | -0,19 | 22.608 | 19,31 | ||||
| 2026-04-24 | 13F | Eagle Bay Advisors LLC | 2.886 | 206 | ||||||
| 2026-04-20 | 13F | Louisiana State Employees Retirement System | 10.000 | -1,96 | 715 | -14,37 | ||||
| 2026-02-17 | 13F | Glenmede Trust Co Na | 2.798 | -34,44 | 229 | -36,39 | ||||
| 2026-02-11 | 13F | CLARET ASSET MANAGEMENT Corp | 3.217 | -0,53 | 0 | |||||
| 2026-02-17 | 13F | NEOS Investment Management LLC | 17.126 | 16,97 | 1.404 | 39,88 | ||||
| 2026-04-13 | 13F | Hm Payson & Co | 949 | 0,00 | 68 | -12,99 | ||||
| 2026-02-11 | 13F | Rise Advisors, LLC | 0 | -100,00 | 0 | |||||
| 2026-02-11 | 13F | Ing Groep Nv | 2.723 | -89,44 | 223 | -87,39 | ||||
| 2026-01-14 | 13F | ORG Partners LLC | 42 | -25,00 | 3 | 0,00 | ||||
| 2026-02-13 | 13F | Toroso Investments, LLC | 17.298 | 13,65 | 1.418 | 35,86 | ||||
| 2026-02-17 | 13F | Guggenheim Capital Llc | 5.884 | -15,40 | 482 | 1,26 | ||||
| 2026-04-08 | 13F | Wealth Enhancement Advisory Services, Llc | 53.881 | 71,30 | 3.341 | 25,94 | ||||
| 2026-02-09 | 13F | Atlantic Trust, LLC | 1.240 | 7.650,00 | 102 | 10.000,00 | ||||
| 2026-02-17 | 13F | Janus Henderson Group Plc | 3.106.405 | -9,25 | 254.601 | 8,48 | ||||
| 2026-02-17 | 13F | Ilex Capital Partners (UK) LLP | 0 | -100,00 | 0 | |||||
| 2026-01-29 | 13F | Sanctuary Advisors, LLC | 34.322 | -6,00 | 2.813 | 12,39 | ||||
| 2026-01-16 | 13F | Crewe Advisors LLC | 15 | 1 | ||||||
| 2026-04-20 | 13F | MBM Wealth Consultants, LLC | 22.529 | 6,64 | 1.611 | -6,99 | ||||
| 2026-02-17 | 13F | State Of Wisconsin Investment Board | 129.466 | -0,86 | 10.611 | 18,52 | ||||
| 2026-02-17 | 13F | Tower Research Capital LLC (TRC) | 3.401 | -31,20 | 279 | -17,75 | ||||
| 2026-05-01 | 13F | International Assets Investment Management, Llc | 4.145 | -2,84 | 296 | -15,19 | ||||
| 2026-02-13 | 13F | Pathstone Holdings, LLC | 17.115 | 5,88 | 1.403 | 26,53 | ||||
| 2026-02-17 | 13F | Mirabella Financial Services Llp | 4.254 | 349 | ||||||
| 2026-02-17 | 13F | Alliancebernstein L.p. | 2.243.381 | -29,69 | 183.868 | -15,94 | ||||
| 2026-02-11 | 13F | Havemeyer Place LP | 29.634 | 2.429 | ||||||
| 2026-02-17 | 13F | Schonfeld Strategic Advisors LLC | 75.443 | 292,22 | 6.183 | 369,12 | ||||
| 2026-04-22 | 13F | WestEnd Advisors, LLC | 6 | 0,00 | 0 | |||||
| 2026-02-13 | 13F | Healthcare Of Ontario Pension Plan Trust Fund | 7.859 | -0,49 | 644 | 19,04 | ||||
| 2026-04-27 | 13F | Proathlete Wealth Management Llc | 19 | 0,00 | 1 | 0,00 | ||||
| 2026-02-11 | 13F | First Command Advisory Services, Inc. | 16 | 1 | ||||||
| 2026-04-07 | 13F | CoreCap Advisors, LLC | 226 | 85,25 | 16 | 77,78 | ||||
| 2026-02-17 | 13F | Parkman Healthcare Partners LLC | 125.335 | -29,00 | 10.272 | -15,12 | ||||
| 2026-02-13 | 13F | Baird Financial Group, Inc. | 9.509 | 4,08 | 779 | 24,44 | ||||
| 2026-04-30 | 13F | Private Trust Co Na | 637 | -48,67 | 46 | -55,45 | ||||
| 2026-01-21 | 13F | Portside Wealth Group, LLC | 6.344 | -6,31 | 520 | 11,85 | ||||
| 2026-04-15 | 13F | Hutchens & Kramer Investment Management Group, LLC | 0 | -100,00 | 0 | |||||
| 2026-01-27 | 13F | Proffitt & Goodson Inc | 0 | -100,00 | 0 | |||||
| 2026-02-12 | 13F | Cibc World Markets Corp | 177.655 | 14.561 | ||||||
| 2026-02-12 | 13F | BRYN MAWR TRUST Co | 0 | -100,00 | 0 | -100,00 | ||||
| 2025-11-14 | 13F | AXA Investment Managers S.A. | 2.902 | 199 | ||||||
| 2026-02-11 | 13F | Parallel Advisors, LLC | 1.583 | 72,82 | 130 | 108,06 | ||||
| 2026-04-14 | 13F | Beacon Investment Advisory Services, Inc. | 9.793 | 700 | ||||||
| 2025-11-10 | 13F | Channing Capital Management, LLC | 0 | -100,00 | 0 | |||||
| 2025-11-14 | 13F | XTX Topco Ltd | 0 | -100,00 | 0 | |||||
| 2026-04-08 | 13F | Sapient Capital Llc | 3.600 | 63,12 | 257 | -69,22 | ||||
| 2026-02-12 | 13F | Xponance, Inc. | 33.185 | 4,98 | 2.720 | 25,47 | ||||
| 2026-04-23 | 13F | Oppenheimer Asset Management Inc. | 7.709 | -14,02 | 551 | -24,93 | ||||
| 2026-02-12 | 13F | Principal Securities, Inc. | 23.767 | 40,66 | 1.948 | 68,13 | ||||
| 2026-04-21 | 13F | Pallas Capital Advisors LLC | 3.513 | 33,98 | 251 | 17,29 | ||||
| 2026-04-28 | 13F | Quent Capital, LLC | 736 | 2,36 | 53 | -10,34 | ||||
| 2026-02-12 | 13F | Dimensional Fund Advisors Lp | 1.959.733 | 11,29 | 160.627 | 33,07 | ||||
| 2026-05-01 | 13F | Arizona State Retirement System | 53.252 | -2,36 | 3.808 | -14,83 | ||||
| 2026-02-17 | 13F | Cape Investment Advisory, Inc. | 943 | -1,36 | 77 | 18,46 | ||||
| 2026-02-10 | 13F | Bank of New York Mellon Corp | 1.127.859 | -1,91 | 92.439 | 17,27 | ||||
| 2025-11-14 | 13F | Walleye Trading LLC | 0 | -100,00 | 0 | -100,00 | ||||
| 2026-04-28 | 13F | Alberta Investment Management Corp | 0 | -100,00 | 0 | |||||
| 2026-04-08 | 13F | Heritage Family Offices, LLP | 2.867 | -53,23 | 205 | -59,36 | ||||
| 2026-02-17 | 13F | Point72 Asset Management, L.P. | 0 | -100,00 | 0 | |||||
| 2026-02-11 | 13F | Heartland Advisors Inc | 187.263 | 15.348 | ||||||
| 2026-02-13 | 13F | Barclays Plc | 339.054 | -28,08 | 27.789 | -14,02 | ||||
| 2026-02-17 | 13F | Nissay Asset Management Corp /japan/ /adv | 25.626 | 1,14 | 2.100 | 20,90 | ||||
| 2026-04-21 | 13F | Founders Capital Management | 100 | 0,00 | 7 | -12,50 | ||||
| 2026-02-17 | 13F | Credit Agricole S A | 82.032 | 300,61 | 6.723 | 379,19 | ||||
| 2026-04-30 | 13F | Sumitomo Mitsui Trust Holdings, Inc. | 439.109 | 1,35 | 31.396 | -11,58 | ||||
| 2026-04-14 | 13F | Congress Asset Management Co /ma | 242.095 | 3,95 | 17.310 | -9,32 | ||||
| 2026-02-09 | 13F | Geode Capital Management, Llc | 5.274.687 | -0,53 | 430.659 | 18,93 | ||||
| 2026-05-01 | 13F | Anchor Investment Management, LLC | 76 | -92,86 | 5 | -94,25 | ||||
| 2026-02-13 | 13F | Stifel Financial Corp | 248.605 | 8,64 | 20.376 | 29,88 | ||||
| 2026-04-27 | 13F | Exencial Wealth Advisors, Llc | 87.985 | -4,66 | 6.291 | -16,83 | ||||
| 2026-02-11 | 13F | Capital International Ltd /ca/ | 103.691 | -9,14 | 8.499 | 8,61 | ||||
| 2026-02-12 | 13F | UniSuper Management Pty Ltd | 28.129 | -24,02 | 2.305 | -9,18 | ||||
| 2026-04-29 | 13F | Klp Kapitalforvaltning As | 69.500 | 0,00 | 4.969 | -12,76 | ||||
| 2026-02-17 | 13F | Balyasny Asset Management Llc | 495.895 | 348,33 | 40.644 | 435,98 | ||||
| 2026-02-17 | 13F | Advisor Group Holdings, Inc. | 63.507 | -5,49 | 5.205 | 13,13 | ||||
| 2026-02-17 | 13F | MIRAE ASSET GLOBAL ETFS HOLDINGS Ltd. | 13.274 | -0,77 | 1.088 | 18,54 | ||||
| 2026-02-12 | 13F | Swiss National Bank | 543.700 | -5,46 | 44.562 | 13,02 | ||||
| 2026-02-17 | 13F | Quantinno Capital Management LP | 97.777 | 23,71 | 8.014 | 47,90 | ||||
| 2026-02-12 | 13F | CIBC Private Wealth Group, LLC | 24.957 | -0,00 | 2.045 | 19,52 | ||||
| 2026-02-17 | 13F | California State Teachers Retirement System | 321.424 | -3,37 | 26.344 | 15,51 | ||||
| 2026-02-17 | 13F | Integral Health Asset Management, LLC | 0 | -100,00 | 0 | -100,00 | ||||
| 2026-02-13 | 13F | Morgan Stanley | 2.007.690 | -4,91 | 164.550 | 13,68 | ||||
| 2026-02-17 | 13F | JANA Partners Management, LP | 3.519.620 | 44,57 | 288.468 | 72,82 | ||||
| 2026-05-01 | 13F | Thrivent Financial For Lutherans | 50.243 | -0,24 | 4 | -25,00 | ||||
| 2026-02-17 | 13F | PenderFund Capital Management Ltd. | 300 | 0,00 | 25 | 20,00 | ||||
| 2026-02-10 | 13F | Westpac Banking Corp | 2.290 | -55,66 | 188 | -47,18 | ||||
| 2026-04-15 | 13F | Avanza Fonder AB | 21.286 | 0,00 | 1.522 | -12,79 | ||||
| 2026-02-17 | 13F | Delta Global Management LP | 0 | -100,00 | 0 | |||||
| 2026-04-06 | 13F | GAMMA Investing LLC | 4.091 | 57,23 | 293 | 37,09 | ||||
| 2026-04-29 | 13F | Police & Firemen's Retirement System of New Jersey | 30.094 | 0,00 | 2.152 | -12,77 | ||||
| 2026-02-06 | 13F | Vestmark Advisory Solutions, Inc. | 59.529 | -12,84 | 4.879 | 4,19 | ||||
| 2026-02-11 | 13F | Zions Bancorporation, National Association /ut/ | 2.352 | 0,60 | 193 | 20,00 | ||||
| 2026-02-12 | 13F | Voya Investment Management Llc | 120.209 | -7,65 | 9.852 | 10,40 | ||||
| 2026-02-17 | 13F | Aster Capital Management (DIFC) Ltd | 0 | -100,00 | 0 | |||||
| 2026-04-24 | 13F | Raiffeisen Bank International AG | 209 | 0,00 | 14 | -17,65 | ||||
| 2026-01-27 | 13F | Portfolio Strategies, Inc. | 2.992 | 0,00 | 245 | 19,51 | ||||
| 2026-02-04 | 13F | Clark Wealth Partners | 10 | 0,00 | 1 | |||||
| 2026-02-05 | 13F | Atria Investments Llc | 36.707 | 3,50 | 3.009 | 23,74 | ||||
| 2026-02-10 | 13F | Triodos Investment Management BV | 248.250 | -0,60 | 20.473 | 19,62 | ||||
| 2026-02-17 | 13F | Boothbay Fund Management, Llc | 3.113 | -11,08 | 255 | 6,25 | ||||
| 2026-04-15 | 13F | Fortitude Family Office, LLC | 94 | 248,15 | 7 | 200,00 | ||||
| 2026-02-11 | 13F | Allianz Asset Management GmbH | 151.231 | 3,51 | 12.395 | 23,74 | ||||
| 2026-02-17 | 13F | Bank Of America Corp /de/ | 1.460.544 | -24,77 | 119.706 | -10,07 | ||||
| 2026-02-17 | 13F | Creative Planning | 35.821 | 142,00 | 2.936 | 189,45 | ||||
| 2026-02-13 | 13F | Bridgewater Associates, LP | 6.256 | -8,79 | 513 | 8,94 | ||||
| 2026-02-11 | 13F | SOUTH STATE Corp | 5 | -70,59 | 0 | -100,00 | ||||
| 2026-02-10 | 13F | Kentucky Retirement Systems | 12.506 | 0,00 | 1.025 | 19,49 | ||||
| 2026-04-30 | 13F | Financial Freedom, LLC | 202 | 14 | ||||||
| 2026-04-07 | 13F | Signaturefd, Llc | 4.705 | 3,34 | 336 | -9,92 | ||||
| 2025-11-14 | 13F | Point72 (DIFC) Ltd | 205.545 | 28,55 | 14.092 | 23,85 | ||||
| 2026-04-24 | 13F | IFM Investors Pty Ltd | 39.826 | -4,54 | 2.848 | 94.800,00 | ||||
| 2026-04-27 | 13F | Sound Income Strategies, LLC | 732 | 52 | ||||||
| 2026-02-13 | 13F | Schroder Investment Management Group | 9.839 | -98,41 | 811 | -98,07 | ||||
| 2026-02-17 | 13F | PFM Health Sciences, LP | 100.802 | 35,55 | 8.262 | 62,04 | ||||
| 2026-01-28 | 13F | Bedel Financial Consulting, Inc. | 0 | -100,00 | 0 | |||||
| 2026-02-05 | 13F | Bessemer Group Inc | 908.434 | -32,29 | 74 | -18,68 | ||||
| 2026-02-18 | 13F | GWM Advisors LLC | 621 | 0,00 | 51 | 19,05 | ||||
| 2026-02-06 | 13F | Diamond Hill Capital Management Inc | 3.287.837 | 479,62 | 269.471 | 592,91 | ||||
| 2026-02-13 | 13F | FORA Capital, LLC | 0 | -100,00 | 0 | |||||
| 2025-11-03 | 13F | Townsquare Capital Llc | 0 | -100,00 | 0 | |||||
| 2026-02-13 | 13F | Ostrum Asset Management | 943 | -24,92 | 77 | -10,47 | ||||
| 2026-04-13 | 13F | Massmutual Trust Co Fsb/adv | 1.043 | 2,05 | 75 | -10,84 | ||||
| 2026-02-13 | 13F | Neo Ivy Capital Management | 43.056 | 3.529 | ||||||
| 2026-01-30 | 13F | State of New Jersey Common Pension Fund D | 66.381 | -2,86 | 5.441 | 16,12 | ||||
| 2025-11-14 | 13F | Aigen Investment Management, Lp | 0 | -100,00 | 0 | |||||
| 2026-04-15 | 13F | Gf Fund Management Co. Ltd. | 5.451 | 0,00 | 390 | -12,78 | ||||
| 2026-04-28 | 13F | Raleigh Capital Management Inc. | 30 | 2 | ||||||
| 2026-04-10 | 13F | Impact Capital Partners LLC | 6.895 | -12,10 | 493 | -23,36 | ||||
| 2026-01-29 | 13F | Prentiss Smith & Co Inc | 48.760 | -0,55 | 3.996 | 18,89 | ||||
| 2026-02-06 | 13F | EverSource Wealth Advisors, LLC | 4.696 | 1,43 | 385 | 21,14 | ||||
| 2026-02-12 | 13F | Davis R M Inc | 0 | -100,00 | 0 | -100,00 | ||||
| 2026-02-11 | 13F | Erste Asset Management GmbH | 0 | 0 | ||||||
| 2026-02-02 | 13F | Principal Financial Group Inc | 219.377 | 2,14 | 17.980 | 22,11 | ||||
| 2026-04-15 | 13F | Tema Etfs Llc | 2.983 | 0,47 | 213 | -12,35 | ||||
| 2026-01-26 | 13F | Cwm, Llc | 18.266 | 270,88 | 1 | |||||
| 2026-02-13 | 13F | Peak6 Llc | Call | 6.800 | 557 | |||||
| 2026-02-17 | 13F | Irenic Capital Management LP | 15.000 | 1.229 | ||||||
| 2025-11-14 | 13F | Point72 Europe (London) LLP | 17 | 1 | ||||||
| 2026-04-13 | 13F | Loring Wolcott & Coolidge Fiduciary Advisors Llp/ma | 297 | 21 | ||||||
| 2026-02-12 | 13F | Rbo & Co Llc | 185.041 | -10,49 | 15.166 | 7,00 | ||||
| 2026-02-10 | 13F | Td Asset Management Inc | 700.036 | -7,73 | 57.375 | 10,30 | ||||
| 2026-02-13 | 13F | National Bank Of Canada /fi/ | 1.129.332 | 1.141,54 | 92.560 | 1.384,27 | ||||
| 2026-04-28 | 13F | Golden State Equity Partners | 56 | 4 | ||||||
| 2026-04-06 | 13F | CX Institutional | 2.759 | -13,94 | 0 | |||||
| 2026-02-17 | 13F | Mangrove Partners | 0 | -100,00 | 0 | -100,00 | ||||
| 2026-04-27 | 13F | Ethic Inc. | 10.031 | 18,10 | 717 | 3,02 | ||||
| 2026-02-09 | 13F | Fidelis Capital Partners, LLC | 2.460 | 202 | ||||||
| 2026-02-11 | 13F | GW&K Investment Management, LLC | 74 | 0 | ||||||
| 2026-01-23 | 13F | Wallace Advisory Group, LLC | 0 | -100,00 | 0 | |||||
| 2026-02-17 | 13F | Jones Financial Companies Lllp | 1.147 | 21,76 | 94 | 49,21 | ||||
| 2026-02-10 | 13F | Natixis Advisors, L.p. | 303.456 | 820,12 | 25 | 1.100,00 | ||||
| 2026-01-14 | 13F | Eastern Bank | 0 | -100,00 | 0 | |||||
| 2025-11-14 | 13F | DG Capital Management, LLC | Call | 0 | -100,00 | 0 | -100,00 | |||
| 2025-11-14 | 13F | DG Capital Management, LLC | 0 | -100,00 | 0 | -100,00 | ||||
| 2026-02-17 | 13F | Price T Rowe Associates Inc /md/ | 6.028.821 | 58,77 | 494 | 90,00 | ||||
| 2026-04-24 | 13F | ProShare Advisors LLC | 30.414 | -21,03 | 2.175 | -31,12 | ||||
| 2026-04-27 | 13F | Board of the Pension Protection Fund | 0 | -100,00 | 0 | |||||
| 2026-02-13 | 13F | Centiva Capital, LP | 15.055 | 1.234 | ||||||
| 2026-02-13 | 13F | Centiva Capital, LP | Put | 50.000 | 100,00 | 4.098 | 139,09 | |||
| 2026-04-08 | 13F | Wealth Enhancement Trust Services, Inc. | 475 | 0,00 | 34 | -13,16 | ||||
| 2026-02-04 | 13F | Sentry Investment Management Llc | 547 | 0,00 | 0 | |||||
| 2026-02-04 | 13F | Advisor OS, LLC | 3.304 | -2,39 | 271 | 16,38 | ||||
| 2026-02-09 | 13F | Hartland & Co., LLC | 246 | 21,18 | 20 | 53,85 | ||||
| 2026-02-20 | 13F | Kovitz Investment Group Partners, LLC | 0 | -100,00 | 0 | |||||
| 2026-04-28 | 13F | Whittier Trust Co | 6.144 | 0,00 | 432 | -16,80 | ||||
| 2026-02-13 | 13F | First Trust Advisors Lp | 152.890 | -13,78 | 12.531 | 3,07 | ||||
| 2026-02-05 | 13F | New York Life Investment Management Llc | 27.344 | 0,58 | 2.241 | 20,29 | ||||
| 2026-02-04 | 13F | Nicholas Company, Inc. | 157.815 | -7,71 | 12.935 | 10,33 | ||||
| 2026-02-17 | 13F | Voloridge Investment Management, Llc | 0 | -100,00 | 0 | |||||
| 2026-02-17 | 13F | Browning West Lp | 3.691.083 | 302.521 | ||||||
| 2025-11-13 | 13F | Texas Capital Bancshares Inc/tx | 8 | 1 | ||||||
| 2026-02-04 | 13F | Pacer Advisors, Inc. | 0 | -100,00 | 0 | |||||
| 2026-02-13 | 13F | Victory Capital Management Inc | 86.688 | -0,12 | 7.105 | 19,39 | ||||
| 2026-04-17 | 13F | Krilogy Financial LLC | 0 | -100,00 | 0 | |||||
| 2026-02-10 | 13F | Rothschild Investment Llc | 278 | 387,72 | 23 | 633,33 | ||||
| 2026-04-30 | 13F | Teacher Retirement System Of Texas | 2.949 | -55,33 | 211 | -61,18 | ||||
| 2026-02-10 | 13F | Close Asset Management Ltd | 2.434 | -26,66 | 0 | |||||
| 2026-02-10 | 13F | Daiwa Securities Group Inc. | 38.134 | 2,98 | 3 | 50,00 | ||||
| 2026-02-10 | 13F | Envestnet Asset Management Inc | 699.390 | 7,96 | 57.322 | 29,07 | ||||
| 2026-02-12 | 13F | Jane Street Group, Llc | Call | 18.900 | 65,79 | 1.549 | 98,34 | |||
| 2026-02-12 | 13F | Jane Street Group, Llc | 62.218 | 747,54 | 5.099 | 913,72 | ||||
| 2026-02-12 | 13F | Jane Street Group, Llc | Put | 35.200 | 27,54 | 2.885 | 52,43 | |||
| 2026-04-27 | 13F | Td Private Client Wealth Llc | 17.276 | 3,07 | 1.235 | -10,05 | ||||
| 2026-02-13 | 13F | American Century Companies Inc | 47.761 | 4,06 | 3.914 | 24,41 | ||||
| 2026-02-03 | 13F | Luken Investment Analytics, LLC | 5 | 0 | ||||||
| 2026-02-10 | 13F | DT Investment Partners, LLC | 540 | 0,00 | 44 | 18,92 | ||||
| 2026-02-17 | 13F | Altshuler Shaham Ltd | 0 | -100,00 | 0 | |||||
| 2026-05-01 | 13F | Royal London Asset Management Ltd | 84.236 | 0,00 | 6.023 | -12,76 | ||||
| 2026-02-13 | 13F | Umb Bank N A/mo | 75 | -52,53 | 6 | -40,00 | ||||
| 2026-02-17 | 13F | Ancora Advisors, LLC | 193 | 915,79 | 16 | 1.400,00 | ||||
| 2026-01-28 | 13F | Salomon & Ludwin, LLC | 107 | 0,00 | 9 | 14,29 | ||||
| 2026-04-24 | 13F | Root Financial Partners, LLC | 1.774 | 459,62 | 127 | 404,00 | ||||
| 2026-01-28 | 13F | DekaBank Deutsche Girozentrale | 37.488 | 0,00 | 4 | 50,00 | ||||
| 2026-01-23 | 13F | TFC Financial Management | 0 | -100,00 | 0 | |||||
| 2026-02-02 | 13F | Cornerstone Planning Group LLC | 109 | 5,83 | 9 | 14,29 | ||||
| 2026-02-12 | 13F | EntryPoint Capital, LLC | 0 | -100,00 | 0 | |||||
| 2026-04-24 | 13F | Capital Asset Advisory Services LLC | 0 | -100,00 | 0 | |||||
| 2026-02-18 | 13F | EP Wealth Advisors, Inc. | 8.228 | -9,21 | 674 | 4,66 | ||||
| 2026-02-17 | 13F | Blair William & Co/il | 19.590 | 53,59 | 1.606 | 83,64 | ||||
| 2026-02-12 | 13F | Marex Group plc | 5.003 | -37,46 | 410 | -25,18 | ||||
| 2026-01-23 | 13F | Gibbs Wealth Management | 8.894 | -9,09 | 742 | 10,75 | ||||
| 2025-11-17 | 13F | LGT Financial Advisors LLC | 0 | -100,00 | 0 | |||||
| 2026-02-17 | 13F | Laird Norton Trust Company, Llc | 3.281 | 269 | ||||||
| 2026-02-11 | 13F | Capital International Inc /ca/ | 118.210 | 22,94 | 9.688 | 46,97 | ||||
| 2026-02-13 | 13F | Seneschal Advisors, LLC | 2 | 0,00 | 0 | |||||
| 2026-02-03 | 13F | Generali Asset Management SPA SGR | 15.645 | 5,09 | 1.282 | 25,69 | ||||
| 2026-02-17 | 13F | Westwood Holdings Group Inc | 187.085 | -41,66 | 15.333 | -30,26 | ||||
| 2026-04-22 | 13F | Patton Fund Management, Inc. | 3.233 | 9,97 | 231 | -3,75 | ||||
| 2025-11-14 | 13F | Cubist Systematic Strategies, LLC | 0 | -100,00 | 0 | -100,00 | ||||
| 2025-11-14 | 13F | Integrated Wealth Concepts LLC | 0 | -100,00 | 0 | |||||
| 2026-02-06 | 13F | New Millennium Group LLC | 0 | -100,00 | 0 | |||||
| 2026-02-19 | 13F | CI Private Wealth, LLC | 25.699 | 17,02 | 1.630 | 8,24 | ||||
| 2026-02-09 | 13F | Avalon Trust Co | 3.110 | -37,30 | 255 | -25,29 | ||||
| 2026-04-13 | 13F | Wolff Wiese Magana Llc | 60 | 0,00 | 4 | 0,00 | ||||
| 2026-02-17 | 13F | Utah Retirement Systems | 32.916 | 0,00 | 2.698 | 19,55 | ||||
| 2026-04-23 | 13F | J.w. Cole Advisors, Inc. | 0 | -100,00 | 0 | |||||
| 2026-05-01 | 13F | Sachetta, LLC | 62 | 100,00 | 4 | 100,00 | ||||
| 2026-02-13 | 13F | Chevy Chase Trust Holdings, Inc. | 100.891 | -1,01 | 8.269 | 18,35 | ||||
| 2026-02-17 | 13F | Lighthouse Investment Partners, LLC | 0 | -100,00 | 0 | |||||
| 2026-01-28 | 13F | Chicago Partners Investment Group LLC | 2.578 | 210 | ||||||
| 2026-04-22 | 13F | Border to Coast Pensions Partnership Ltd | 379.076 | 27 | ||||||
| 2026-04-10 | 13F | Piscataqua Savings Bank | 120 | 0,00 | 9 | -11,11 | ||||
| 2026-04-30 | 13F | Whipplewood Advisors, LLC | 72 | 5 | ||||||
| 2025-12-01 | 13F | Groupama Asset Managment | 0 | -100,00 | 0 | |||||
| 2026-04-30 | 13F | Clear Street Markets Llc | 32 | -89,15 | 2 | -91,67 | ||||
| 2026-01-23 | 13F | Optima Capital Llc | 1 | 0 | ||||||
| 2026-02-17 | 13F | FIL Ltd | 170.171 | 6,22 | 13.947 | 26,99 | ||||
| 2026-02-17 | 13F | Massar Capital Management, LP | 18.832 | 1.543 | ||||||
| 2026-01-28 | 13F | Ruffer LLP | 312.164 | -76,84 | 25.625 | -72,27 | ||||
| 2026-02-11 | 13F | Twin Tree Management, LP | Put | 0 | -100,00 | 0 | -100,00 | |||
| 2026-04-16 | 13F | E. Ohman J:or Asset Management AB | 7.100 | 0,00 | 508 | -12,74 | ||||
| 2026-02-13 | 13F | Cramer Rosenthal Mcglynn Llc | 317.160 | 190,11 | 25.994 | 246,82 | ||||
| 2026-04-23 | 13F | SJS Investment Consulting Inc. | 361 | 107,47 | 26 | 78,57 | ||||
| 2026-02-17 | 13F | Optiver Holding B.V. | 0 | -100,00 | 0 | |||||
| 2026-01-20 | 13F | Savvy Advisors, Inc. | 2.501 | 205 | ||||||
| 2026-02-06 | 13F | GPS Wealth Strategies Group, LLC | 0 | -100,00 | 0 | |||||
| 2026-02-12 | 13F | Aviva Plc | 169.585 | 7,02 | 13.899 | 27,94 | ||||
| 2026-02-06 | 13F | Bastion Asset Management Inc. | 0 | -100,00 | 0 | -100,00 | ||||
| 2025-11-14 | 13F | Point72 Asia (Singapore) Pte. Ltd. | 1.082 | 74 | ||||||
| 2026-04-30 | 13F | Hsbc Holdings Plc | 403.103 | 12,19 | 28.755 | -2,39 | ||||
| 2026-04-24 | 13F | Strs Ohio | 4.669 | -2,14 | 334 | -14,83 | ||||
| 2026-02-05 | 13F | Amalgamated Bank | 37.171 | -1,73 | 3 | 50,00 | ||||
| 2026-02-17 | 13F | Amundi | 827.111 | 5,62 | 67.790 | 23,48 | ||||
| 2026-02-06 | 13F | Pnc Financial Services Group, Inc. | 64.380 | -0,55 | 5.277 | 18,88 | ||||
| 2026-04-23 | 13F | North Star Investment Management Corp. | 9 | 1 | ||||||
| 2026-02-17 | 13F | Bayesian Capital Management, LP | 9.000 | 738 | ||||||
| 2026-02-17 | 13F | Dark Forest Capital Management Lp | 58.681 | 169,48 | 4.809 | 222,32 | ||||
| 2026-02-11 | 13F | LPL Financial LLC | 123.417 | -8,61 | 10.115 | 9,26 | ||||
| 2026-02-12 | 13F | Callan Family Office, LLC | 5.502 | 12,68 | 451 | 34,73 | ||||
| 2026-02-17 | 13F | Russell Investments Group, Ltd. | 136.281 | -83,42 | 11.192 | -80,13 | ||||
| 2026-02-23 | 13F | Kera Capital Partners, Inc. | 2.658 | 216 | ||||||
| 2026-02-06 | 13F | Tredje AP-fonden | 33.183 | 0,00 | 2.720 | 19,52 | ||||
| 2026-02-11 | 13F | Arrowpoint Investment Partners (Singapore) Pte. Ltd. | 10.434 | 855 | ||||||
| 2026-04-27 | 13F | Fjarde Ap-fonden /fourth Swedish National Pension Fund | 49.720 | 71,33 | 3.555 | 49,45 | ||||
| 2026-04-28 | 13F | Core Wealth Advisors, Llc | 0 | -100,00 | 0 | |||||
| 2026-04-28 | 13F | Whittier Trust Co Of Nevada Inc | 1.099 | -8,11 | 77 | -23,00 | ||||
| 2026-04-16 | 13F | Diversified Trust Co | 17.569 | 5,81 | 1.256 | -7,65 | ||||
| 2026-02-10 | 13F | Private Wealth Asset Management, LLC | 3 | 0,00 | 0 | |||||
| 2026-02-13 | 13F | Headlands Technologies LLC | 0 | -100,00 | 0 | |||||
| 2026-02-03 | 13F | Ballentine Partners, LLC | 3.446 | -0,12 | 282 | 19,49 | ||||
| 2026-02-09 | 13F | New Age Alpha Advisors, LLC | 9.681 | -13,76 | 793 | 3,12 | ||||
| 2026-02-10 | 13F | CIBC Asset Management Inc | 46.763 | 69,38 | 3.833 | 102,54 | ||||
| 2026-04-09 | 13F | Park Place Capital Corp | 180 | 0,00 | 13 | -14,29 | ||||
| 2026-02-06 | 13F | Twin Capital Management Inc | 0 | -100,00 | 0 | -100,00 | ||||
| 2026-04-15 | 13F | Hartford Investment Management Co | 11.122 | -3,13 | 795 | -15,43 | ||||
| 2026-02-12 | 13F | Penserra Capital Management LLC | 12 | 0,00 | 0 | |||||
| 2026-01-23 | 13F | Cambiar Investors Llc | 55.577 | 4.555 | ||||||
| 2026-02-13 | 13F | Brown Advisory Inc | 101.108 | 8.287 | ||||||
| 2026-02-13 | 13F | Verition Fund Management LLC | 108.005 | -7,90 | 8.852 | 10,11 | ||||
| 2026-02-09 | 13F | Allstate Corp | 13.383 | 74,53 | 1.097 | 108,76 | ||||
| 2025-11-13 | 13F | Qsemble Capital Management, LP | 0 | -100,00 | 0 | |||||
| 2026-02-11 | 13F | Capital Group Investment Management Pte. Ltd. | 22.080 | -8,74 | 1.810 | 9,11 | ||||
| 2026-01-26 | 13F | KBC Group NV | 335.016 | -1,50 | 27 | 17,39 | ||||
| 2026-01-30 | 13F/A | M&t Bank Corp | 26.774 | -23,93 | 2.195 | -9,04 | ||||
| 2026-02-13 | 13F | Bank Of Nova Scotia | 231.107 | 841,10 | 18.942 | 1.025,43 | ||||
| 2026-02-13 | 13F | Wealth Alliance | 4.429 | 16,28 | 363 | 39,08 | ||||
| 2025-11-07 | 13F | Shell Asset Management Co | 2.550 | 21,89 | 0 | |||||
| 2026-04-10 | 13F | Oak Thistle LLC | 0 | -100,00 | 0 | |||||
| 2026-02-12 | 13F | Kinneret Advisory, LLC | 11.388 | -2,67 | 933 | 16,33 | ||||
| 2026-02-05 | 13F | North Dakota State Investment Board | 6.855 | 562 | ||||||
| 2026-02-12 | 13F | Brinker Capital Investments, LLC | 69.996 | -26,55 | 5.737 | -12,20 | ||||
| 2026-02-13 | 13F | Quarry LP | 858 | 70 | ||||||
| 2026-04-22 | 13F | Portus Wealth Advisors, LLC | 5 | 0 | ||||||
| 2026-05-01 | 13F | Securian Asset Management, Inc | 5.254 | -1,87 | 376 | -14,38 | ||||
| 2026-04-27 | 13F | Truist Financial Corp | 58.142 | -8,31 | 4.157 | -20,01 | ||||
| 2026-02-17 | 13F | Quantitative Investment Management, LLC | 0 | -100,00 | 0 | |||||
| 2026-04-24 | 13F | Keybank National Association/oh | 7.116 | 1,48 | 509 | -11,50 | ||||
| 2026-02-14 | 13F | Rockefeller Capital Management L.P. | 18.855 | 156,46 | 1.545 | 206,55 | ||||
| 2026-01-27 | 13F | Asset Management One Co., Ltd. | 109.034 | 34,22 | 8.962 | 60,93 | ||||
| 2026-02-17 | 13F | Engineers Gate Manager LP | 70.590 | 425,97 | 5.786 | 528,80 | ||||
| 2026-02-10 | 13F | Kentucky Retirement Systems Insurance Trust Fund | 5.242 | 0,00 | 430 | 19,50 | ||||
| 2026-04-24 | 13F | Sumitomo Mitsui DS Asset Management Company, Ltd | 27.294 | 0,62 | 1.952 | -12,24 | ||||
| 2026-02-12 | 13F | New York State Common Retirement Fund | 104.450 | 1,56 | 8.561 | 21,40 | ||||
| 2026-01-16 | 13F | Trust Co Of Vermont | 340 | 0,00 | 28 | 17,39 | ||||
| 2026-02-17 | 13F | Bamco Inc /ny/ | 664.491 | 0,11 | 54.462 | 19,68 | ||||
| 2026-02-20 | 13F | Sunbelt Securities, Inc. | 35 | 59,09 | 3 | 100,00 | ||||
| 2026-02-17 | 13F | 2Xideas AG | 0 | -100,00 | 0 | |||||
| 2026-01-30 | 13F | Trifecta Capital Advisors, LLC | 0 | -100,00 | 0 | |||||
| 2026-02-12 | 13F | Venator Management LLC | 0 | -100,00 | 0 | |||||
| 2026-05-01 | 13F | Fifth Third Bancorp | 79.770 | 1.244,06 | 5.704 | 1.073,46 | ||||
| 2026-01-27 | 13F | Tranquilli Financial Advisor LLC | 3.828 | 0,66 | 314 | 20,38 | ||||
| 2026-04-20 | 13F | LVW Advisors, LLC | 6.058 | -15,97 | 433 | -26,61 | ||||
| 2026-02-17 | 13F | Weiss Asset Management LP | 294.582 | 88,76 | 24.123 | 125,41 | ||||
| 2026-02-06 | 13F | Cullen/frost Bankers, Inc. | 0 | -100,00 | 0 | |||||
| 2025-11-14 | 13F | Qube Research & Technologies Ltd | 0 | -100,00 | 0 | |||||
| 2026-02-13 | 13F | Kayne Anderson Rudnick Investment Management Llc | 7.198.895 | -4,65 | 590.021 | 13,98 | ||||
| 2026-04-28 | 13F | Alecta Pensionsforsakring, Omsesidigt | 1.563.000 | 0,00 | 111.708 | -12,78 | ||||
| 2026-01-23 | 13F | Bridgewater Advisors Inc. | 6.609 | 3,85 | 537 | 24,31 | ||||
| 2026-01-29 | 13F | Nbc Securities, Inc. | 0 | -100,00 | 0 | -100,00 | ||||
| 2026-02-04 | 13F | Ameritas Advisory Services, LLC | 0 | -100,00 | 0 | |||||
| 2026-04-22 | 13F | Caldwell Trust Co | 3.850 | 0,00 | 275 | -12,70 | ||||
| 2026-02-06 | 13F/A | Rathbone Brothers plc | 598.999 | -2,07 | 49.094 | 17,07 | ||||
| 2026-02-17 | 13F | SageView Advisory Group, LLC | 380 | 31 | ||||||
| 2026-02-13 | 13F | Resources Investment Advisors, LLC. | 7.459 | -47,03 | 611 | -36,68 | ||||
| 2026-01-23 | 13F | Westside Investment Management, Inc. | 8 | 1 | ||||||
| 2025-11-14 | 13F | Evelyn Partners Investment Management Services Ltd | 0 | -100,00 | 0 | |||||
| 2026-02-13 | 13F | Golden State Wealth Management, LLC | 0 | -100,00 | 0 | |||||
| 2026-01-22 | 13F | Massachusetts Financial Services Co /ma/ | 2.815.806 | -9,16 | 230.783 | 8,59 | ||||
| 2026-02-12 | 13F | Beck Mack & Oliver Llc | 41.000 | 3.360 | ||||||
| 2026-02-10 | 13F | Bnp Paribas | 741 | 61 | ||||||
| 2026-01-27 | 13F | Zurcher Kantonalbank (Zurich Cantonalbank) | 46.325 | 0,00 | 3.797 | 19,52 | ||||
| 2026-01-28 | 13F | Geneos Wealth Management Inc. | 3.308 | 4.989,23 | 271 | 6.675,00 | ||||
| 2026-02-17 | 13F | Adage Capital Partners Gp, L.l.c. | 179.460 | -60,96 | 14.709 | -53,33 | ||||
| 2025-11-21 | 13F/A | CIBC Bancorp USA Inc. | 27.526 | 1.887 | ||||||
| 2026-04-22 | 13F | Apollon Wealth Management, LLC | 5.169 | 370 | ||||||
| 2026-04-10 | 13F | Abound Wealth Management | 41 | 0,00 | 3 | -33,33 | ||||
| 2026-02-17 | 13F | Graham Capital Management, L.P. | 11.817 | 969 | ||||||
| 2026-04-13 | 13F | Highland Capital Management, Llc | 40.160 | -1,21 | 2.871 | -13,81 | ||||
| 2025-11-14 | 13F | Nekton Capital Ltd. | 25.000 | 1.714 | ||||||
| 2026-02-06 | 13F | Intrust Bank Na | 5.117 | -17,13 | 419 | -0,95 | ||||
| 2026-04-14 | 13F | Nbc Securities, Inc. | Put | 0 | -100,00 | 0 | ||||
| 2025-11-12 | 13F | Bellwether Advisors, LLC | 0 | -100,00 | 0 | |||||
| 2026-02-09 | 13F | Huntington National Bank | 16.853 | -0,43 | 1.381 | 19,05 | ||||
| 2026-02-05 | 13F | Canada Post Corp Registered Pension Plan | 4.644 | 29,58 | 383 | 56,97 | ||||
| 2026-04-30 | 13F | River Road Asset Management, LLC | 1.974.606 | 24,75 | 141.184 | 8,83 | ||||
| 2025-11-14 | 13F | Glenview Capital Management, Llc | 0 | -100,00 | 0 | |||||
| 2026-02-09 | 13F | Quest Partners LLC | 2.266 | 251,86 | 186 | 320,45 | ||||
| 2026-02-17 | 13F | Frontier Capital Management Co Llc | 361.296 | 13,38 | 29.612 | 35,54 | ||||
| 2026-02-11 | 13F | Deutsche Bank Ag\ | 676.478 | -7,53 | 55.444 | 10,54 | ||||
| 2026-02-17 | 13F | Raymond James Financial Inc | 778.464 | -3,62 | 63.803 | 15,21 | ||||
| 2026-02-10 | 13F | Amica Mutual Insurance Co | 15.576 | 4,59 | 1 | 0,00 | ||||
| 2026-04-21 | 13F | Robeco Institutional Asset Management B.V. | 12.834 | -4,74 | 918 | -16,94 | ||||
| 2026-01-28 | 13F | B. Metzler seel. Sohn & Co. AG | 12.564 | 11,93 | 1.030 | 33,81 | ||||
| 2026-02-11 | 13F | Manchester Capital Management LLC | 1.666 | 137 | ||||||
| 2026-02-17 | 13F | Howard Hughes Medical Institute | 43 | 0,00 | 4 | 50,00 | ||||
| 2026-04-22 | 13F | Pictet Asset Management Holding SA | 130.773 | 0,14 | 9.341 | -12,74 | ||||
| 2026-04-08 | 13F | DiNuzzo Private Wealth, Inc. | 24 | 33,33 | 2 | 0,00 | ||||
| 2026-02-12 | 13F | Brown Brothers Harriman & Co | 1.984 | 88,41 | 163 | 125,00 | ||||
| 2026-02-17 | 13F | Redwood Park Advisors LLC | 12 | 0,00 | 1 | |||||
| 2026-02-09 | 13F | Employees Retirement System of Texas | 11.700 | 1 | ||||||
| 2026-04-28 | 13F | Everence Capital Management Inc | 6.454 | 0,00 | 0 | |||||
| 2026-02-17 | 13F | Captrust Financial Advisors | 8.860 | 23,52 | 726 | 47,86 | ||||
| 2026-02-11 | 13F | CNB Bank | 800 | 0,00 | 66 | 20,37 | ||||
| 2026-02-17 | 13F | Armistice Capital, Llc | 17.888 | 212,67 | 1.466 | 273,98 | ||||
| 2026-04-28 | 13F | LGT Group Foundation | 14.010 | -2,94 | 1.002 | -15,88 | ||||
| 2026-02-13 | 13F | Walleye Capital LLC | Call | 600 | 200,00 | 49 | 276,92 | |||
| 2026-02-13 | 13F | Walleye Capital LLC | Put | 3.300 | -15,38 | 270 | 1,12 | |||
| 2026-02-13 | 13F | Walleye Capital LLC | 305 | -99,83 | 25 | -99,81 | ||||
| 2026-04-17 | 13F | Bell Investment Advisors, Inc | 780 | -1,64 | 56 | -14,06 | ||||
| 2026-02-11 | 13F | Capital International Sarl | 183.595 | -2,27 | 15.047 | 16,83 | ||||
| 2026-02-13 | 13F | Rhumbline Advisers | 380.021 | -3,91 | 31.146 | 14,87 | ||||
| 2026-02-09 | 13F | Keating Financial Advisory Services, Inc. | 88 | 7 | ||||||
| 2026-02-02 | 13F | Horizon Investments, LLC | 3.180 | 3,25 | 261 | 23,22 | ||||
| 2026-02-18 | 13F | Vident Advisory, LLC | 52.152 | 476,65 | 4.274 | 589,35 | ||||
| 2026-02-02 | 13F | Alliance Wealth Advisors, LLC /UT | 6.382 | -30,26 | 523 | -16,59 | ||||
| 2025-11-13 | 13F | Dynamic Technology Lab Private Ltd | 0 | -100,00 | 0 | |||||
| 2026-02-11 | 13F | Jpmorgan Chase & Co | 711.691 | -48,30 | 58.330 | -38,19 | ||||
| 2026-05-01 | 13F | Wealthspire Advisors, LLC | 4.107 | 294 | ||||||
| 2026-04-14 | 13F | Bay Harbor Wealth Management, LLC | 25 | 25,00 | 2 | 0,00 | ||||
| 2026-04-22 | 13F | Spire Wealth Management | 17 | -5,56 | 1 | 0,00 | ||||
| 2026-02-12 | 13F | Mark Sheptoff Financial Planning, Llc | 6.385 | -5,90 | 523 | 12,47 | ||||
| 2026-04-30 | 13F | Cambridge Investment Research Advisors, Inc. | 5.423 | 1,33 | 0 | |||||
| 2026-02-13 | 13F | Ossiam | 0 | -100,00 | 0 | |||||
| 2026-03-04 | 13F/A | Savant Capital, LLC | 0 | -100,00 | 0 | |||||
| 2026-04-30 | 13F | Mv Capital Management, Inc. | 56 | 0,00 | 4 | 0,00 | ||||
| 2026-02-12 | 13F | Quadrant Capital Group Llc | 7.750 | 127,27 | 635 | 172,53 | ||||
| 2026-02-11 | 13F | Franklin Resources Inc | 4.022.033 | 108,15 | 329.646 | 148,83 | ||||
| 2026-02-13 | 13F | Palisade Asset Management, LLC | 0 | -100,00 | 0 | |||||
| 2026-02-13 | 13F | MAI Capital Management | 2.380 | 4,62 | 195 | 25,81 | ||||
| 2026-02-17 | 13F | Investment Management Corp of Ontario | 13.487 | 44,15 | 1.105 | 72,39 | ||||
| 2026-02-17 | 13F | Polymer Capital Management (US) LLC | 0 | -100,00 | 0 | |||||
| 2026-02-04 | 13F | Atlantic Union Bankshares Corp | 2.200 | 0,00 | 180 | 20,00 | ||||
| 2026-01-30 | 13F | Wealthfront Advisers Llc | 11.318 | 11,85 | 928 | 33,77 | ||||
| 2026-02-06 | 13F | Trajan Wealth LLC | 207.545 | 15,77 | 17.010 | 38,41 | ||||
| 2026-02-17 | 13F | Banco Bilbao Vizcaya Argentaria, S.a. | 0 | -100,00 | 0 | |||||
| 2026-02-17 | 13F | Fmr Llc | 395.590 | 90,80 | 32.423 | 128,10 | ||||
| 2026-04-29 | 13F | Oregon Public Employees Retirement Fund | 22.435 | -1,32 | 1.604 | -13,90 | ||||
| 2026-04-30 | 13F | Cedar Mountain Advisors, LLC | 40 | 3 | ||||||
| 2026-04-09 | 13F | Thrive Wealth Management, LLC | 0 | -100,00 | 0 | |||||
| 2025-11-14 | 13F | J. Goldman & Co LP | 0 | -100,00 | 0 | |||||
| 2026-02-17 | 13F | Rakuten Investment Management, Inc. | 26.153 | -84,19 | 2.150 | -86,13 | ||||
| 2026-04-30 | 13F | Cromwell Holdings LLC | 467 | -3,71 | 33 | -15,38 | ||||
| 2026-04-10 | 13F/A | OP Asset Management Ltd | 20.372 | -9,58 | 1.457 | -21,13 | ||||
| 2026-02-12 | 13F | Johnson Financial Group, Inc. | 265 | -69,08 | 22 | -63,79 | ||||
| 2026-02-17 | 13F | Brevan Howard Capital Management LP | 0 | -100,00 | 0 | |||||
| 2026-02-11 | 13F | Winton Capital Group Ltd | 48.454 | -41,82 | 3.971 | -30,44 | ||||
| 2026-04-30 | 13F | First Horizon Corp | 1.329 | -2,06 | 95 | -14,41 | ||||
| 2026-02-17 | 13F | First Manhattan Co | 0 | -100,00 | 0 | |||||
| 2026-02-13 | 13F | Arrowstreet Capital, Limited Partnership | 2.108.698 | 214,73 | 172.829 | 276,25 | ||||
| 2026-02-11 | 13F | J.Safra Asset Management Corp | 1.031 | 82,16 | 85 | 121,05 | ||||
| 2026-02-06 | 13F | Tortoise Investment Management, LLC | 0 | -100,00 | 0 | |||||
| 2025-11-13 | 13F | Blueshift Asset Management, LLC | 0 | -100,00 | 0 | |||||
| 2026-04-07 | 13F | Farther Finance Advisors, LLC | 2.539 | 26,32 | 181 | 10,37 | ||||
| 2026-02-05 | 13F | Gabelli Funds Llc | 111.400 | -1,42 | 9.130 | 17,85 | ||||
| 2026-02-06 | 13F | Global Retirement Partners, LLC | 879 | 53,67 | 72 | 84,62 | ||||
| 2026-04-13 | 13F | Gradient Investments LLC | 40.931 | 2.927 | ||||||
| 2026-02-17 | 13F | Royal Bank Of Canada | 415.619 | -47,35 | 34.063 | -37,06 | ||||
| 2025-11-14 | 13F | Vestal Point Capital, LP | 0 | -100,00 | 0 | |||||
| 2026-04-08 | 13F | Mirador Capital Partners LP | 14.379 | 7,25 | 1.028 | -6,38 | ||||
| 2026-02-10 | 13F/A | Northwestern Mutual Wealth Management Co | 1.098 | -6,79 | 90 | 11,25 | ||||
| 2026-02-09 | 13F | Harbour Investments, Inc. | 223 | 248,44 | 18 | 350,00 | ||||
| 2026-02-09 | 13F | Smithfield Trust Co | 92 | 0,00 | 0 | |||||
| 2026-02-17 | 13F | Canada Pension Plan Investment Board | 1.010 | -87,42 | 83 | -85,09 | ||||
| 2026-04-28 | 13F | Stratos Wealth Partners, LTD. | 3.236 | -80,31 | 231 | -82,85 | ||||
| 2026-02-13 | 13F | Financial Network Wealth Advisors LLC | 112 | 2,75 | 9 | 28,57 | ||||
| 2026-02-17 | 13F | Pinnacle Financial Partners, Inc. | 48.967 | 4.013 | ||||||
| 2026-02-09 | 13F | Annis Gardner Whiting Capital Advisors, LLC | 149 | 3,47 | 12 | 33,33 | ||||
| 2026-02-11 | 13F | Ameritas Investment Partners, Inc. | 1.779 | 146 | ||||||
| 2026-01-05 | 13F | Chesapeake Asset Management Llc | 5 | 0 | ||||||
| 2026-02-11 | 13F | Empowered Funds, LLC | 4.790 | -0,87 | 393 | 18,43 | ||||
| 2026-01-29 | 13F | Comerica Bank | 70.860 | 16,32 | 5.808 | 39,06 | ||||
| 2026-02-12 | 13F | Moneta Group Investment Advisors Llc | 6.347 | 1,26 | 520 | 21,21 | ||||
| 2026-04-13 | 13F | E Fund Management Co., Ltd. | 4.911 | 17,32 | 351 | 18,18 | ||||
| 2026-01-29 | 13F | Teachers Retirement System Of The State Of Kentucky | 15.630 | 0,00 | 1 | 0,00 | ||||
| 2026-02-17 | 13F | Bellevue Group AG | 291.959 | -0,10 | 23.929 | 19,42 | ||||
| 2026-04-15 | 13F | Fluent Financial, LLC | 45.507 | 6,03 | 3.263 | -7,25 | ||||
| 2026-02-09 | 13F | Jefferies Financial Group Inc. | 59.877 | 177,21 | 4.908 | 231,55 | ||||
| 2026-05-01 | 13F | Avion Wealth | 21 | -38,24 | 0 | |||||
| 2026-04-17 | 13F | Vermillion Wealth Management, Inc. | 10 | 1 | ||||||
| 2026-04-06 | 13F | Versant Capital Management, Inc | 811 | 519,08 | 58 | 470,00 | ||||
| 2026-02-17 | 13F | Siemens Fonds Invest GmbH | 2.782 | 0,00 | 229 | 20,53 | ||||
| 2026-02-11 | 13F | Motley Fool Asset Management LLC | 32.929 | -11,99 | 2.699 | 5,19 | ||||
| 2026-04-27 | 13F | New York State Teachers Retirement System | 164.824 | 0,00 | 12 | -15,38 | ||||
| 2026-05-01 | 13F | Citizens Financial Group Inc/ri | 10.740 | 37,27 | 768 | 19,66 | ||||
| 2026-02-17 | 13F | Trexquant Investment LP | 0 | -100,00 | 0 | |||||
| 2026-04-07 | 13F | Park Avenue Securities Llc | 15.435 | 113,34 | 1 | |||||
| 2025-11-12 | 13F | Solstein Capital, LLC | 0 | -100,00 | 0 | |||||
| 2025-11-14 | 13F | Resources Management Corp /ct/ /adv | 0 | -100,00 | 0 | |||||
| 2026-02-17 | 13F | ISAM Funds (UK) Ltd | 2.818 | 231 | ||||||
| 2026-04-29 | 13F | Standard Life Aberdeen plc | 163.153 | -0,54 | 11.665 | -13,23 | ||||
| 2026-02-13 | 13F | Macquarie Group Ltd | 513.396 | -64,52 | 42.078 | -57,58 | ||||
| 2026-02-13 | 13F | Landscape Capital Management, L.l.c. | 38.160 | -33,25 | 3.128 | -20,21 | ||||
| 2026-02-13 | 13F/A | Abound Financial, Llc | 132 | 11 | ||||||
| 2026-02-12 | 13F | Generation Investment Management Llp | 2.849.428 | 233.539 | ||||||
| 2026-04-23 | 13F | Harbor Investment Advisory, Llc | 0 | -100,00 | 0 | |||||
| 2026-02-05 | 13F | Plante Moran Financial Advisors, LLC | 0 | -100,00 | 0 | |||||
| 2026-02-17 | 13F | Concentric Capital Strategies, LP | 135.663 | 11.119 | ||||||
| 2026-02-10 | 13F | New Mexico Educational Retirement Board | 9.300 | 3,33 | 1 | |||||
| 2026-02-04 | 13F | Dynamic Wealth Strategies, LLC | 1.486 | 0,47 | 122 | 19,80 | ||||
| 2026-02-11 | 13F | O'shaughnessy Asset Management, Llc | 4.676 | 1,08 | 383 | 20,82 | ||||
| 2026-01-23 | 13F | Diversify Advisory Services, LLC | 12.898 | 88,43 | 1.062 | 122,64 | ||||
| 2026-05-01 | 13F | American Trust | 0 | -100,00 | 0 | |||||
| 2026-04-06 | 13F | Washington Trust Advisors, Inc. | 18 | 1 | ||||||
| 2026-02-10 | 13F | Transatlantique Private Wealth Llc | 3.722 | -38,70 | 305 | -26,68 | ||||
| 2026-01-07 | 13F | Everpar Advisors Llc | 0 | -100,00 | 0 | |||||
| 2026-02-17 | 13F | Deerfield Management Company, L.p. (series C) | 7.786 | -81,94 | 638 | -78,41 | ||||
| 2026-04-21 | 13F | Tritonpoint Wealth, Llc | 0 | -100,00 | 0 | |||||
| 2026-02-13 | 13F | South Plains Financial, Inc. | 36 | 0,00 | 3 | 0,00 | ||||
| 2026-02-17 | 13F | Summit Trail Advisors, Llc | 5.270 | -63,91 | 432 | -56,94 | ||||
| 2026-02-13 | 13F | Prudential Financial Inc | 98.858 | -12,04 | 8.102 | 5,15 | ||||
| 2026-04-20 | 13F | Tranquility Partners, LLC | 0 | -100,00 | 0 | |||||
| 2026-04-30 | 13F | Nuveen, LLC | 746.352 | -0,98 | 53.364 | -13,62 | ||||
| 2026-02-13 | 13F | Kettle Hill Capital Management, Llc | 0 | -100,00 | 0 | |||||
| 2026-02-10 | 13F | MUFG Securities EMEA plc | 8.188 | 114,40 | 671 | 157,09 | ||||
| 2026-02-17 | 13F | ExodusPoint Capital Management, LP | 0 | -100,00 | 0 | -100,00 | ||||
| 2026-01-28 | 13F | Trail Ridge Investment Advisors, LLC | 10.500 | 0,00 | 861 | 19,61 | ||||
| 2026-02-06 | 13F | Gsa Capital Partners Llp | 5.109 | 0 | ||||||
| 2026-01-16 | 13F | Crowley Wealth Management, Inc. | 0 | -100,00 | 0 | |||||
| 2026-02-17 | 13F | Kensington Investment Counsel, LLC | 10.939 | 21,60 | 897 | 45,45 | ||||
| 2026-02-13 | 13F | Commerce Bank | 110.794 | -2,59 | 9.081 | 16,44 | ||||
| 2026-02-12 | 13F | BlackRock, Inc. | 16.487.063 | 7,59 | 1.351.280 | 28,62 | ||||
| 2026-04-14 | 13F | Cohen Capital Management, Inc. | 3.200 | 0,00 | 229 | -12,98 | ||||
| 2026-02-13 | 13F | BRITISH COLUMBIA INVESTMENT MANAGEMENT Corp | 35.226 | 22,81 | 2.885 | 46,62 | ||||
| 2026-02-11 | 13F | BLI - Banque de Luxembourg Investments | 114.200 | -4,19 | 9.420 | 16,73 | ||||
| 2026-02-12 | 13F | Advisors Asset Management, Inc. | 17.588 | -38,23 | 1.442 | -26,18 | ||||
| 2026-02-13 | 13F | Ieq Capital, Llc | 23.151 | 168,57 | 1.897 | 221,53 | ||||
| 2026-02-13 | 13F | Citigroup Inc | 251.105 | -24,80 | 20.581 | -10,10 | ||||
| 2026-02-12 | 13F | DRW Securities, LLC | 2.732 | 224 | ||||||
| 2026-02-09 | 13F | Mizuho Securities Usa Llc | 14.476 | -0,38 | 1.128 | 15,22 | ||||
| 2026-04-27 | 13F | V-Square Quantitative Management LLC | 6.253 | 1,07 | 447 | -11,83 | ||||
| 2026-02-17 | 13F | Cresset Asset Management, LLC | 0 | -100,00 | 0 | -100,00 | ||||
| 2026-02-17 | 13F | Cinctive Capital Management LP | 33.350 | 2.733 | ||||||
| 2026-04-24 | 13F | Retirement Systems of Alabama | 41.618 | -1,60 | 2.976 | -14,17 | ||||
| 2026-02-13 | 13F | Walleye Trading LLC | Put | 5.400 | 443 | |||||
| 2026-02-17 | 13F | Soapstone Management L.p. | 0 | -100,00 | 0 | |||||
| 2025-11-12 | 13F | Fox Run Management, L.l.c. | 0 | -100,00 | 0 | |||||
| 2026-02-13 | 13F | Walleye Trading LLC | Call | 200 | 16 | |||||
| 2026-02-10 | 13F | Forsta Ap-fonden | 42.000 | 5,53 | 3.442 | 26,17 | ||||
| 2026-04-22 | 13F | Stone House Investment Management, LLC | 4 | 0,00 | 0 | |||||
| 2026-02-17 | 13F | Imprint Wealth LLC | 34 | -80,23 | 3 | -81,82 | ||||
| 2026-02-11 | 13F | Livforsakringsbolaget Skandia, Omsesidigt | 2.192 | 0,00 | 180 | 19,33 | ||||
| 2026-02-13 | 13F | USS Investment Management Ltd | 0 | -100,00 | 0 | |||||
| 2026-04-17 | 13F | CENTRAL TRUST Co | 360 | 0,00 | 26 | -13,79 | ||||
| 2026-01-27 | 13F | Tokio Marine Asset Management Co Ltd | 8.020 | 0,00 | 657 | 19,67 | ||||
| 2026-04-21 | 13F | Mesirow Financial Investment Management, Inc. | 10.802 | -1,10 | 772 | -13,74 | ||||
| 2026-02-17 | 13F | Aquatic Capital Management LLC | 48.066 | 3.939 | ||||||
| 2026-04-20 | 13F | Ronald Blue Trust, Inc. | 1.332 | -12,08 | 95 | -23,39 | ||||
| 2026-02-11 | 13F | Prestige Wealth Management Group LLC | 55 | 96,43 | 5 | 300,00 | ||||
| 2026-04-20 | 13F | Contravisory Investment Management, Inc. | 1.048 | 75 | ||||||
| 2026-02-13 | 13F | Smartleaf Asset Management LLC | 1.237 | 10,64 | 102 | 36,00 | ||||
| 2026-04-24 | 13F | Profund Advisors Llc | 0 | -100,00 | 0 | |||||
| 2026-01-30 | 13F | Mitsubishi UFJ Trust & Banking Corp | 79.481 | -5,75 | 6.514 | 12,68 | ||||
| 2026-04-20 | 13F | First American Bank | 25.201 | 2,93 | 1.802 | -10,22 | ||||
| 2026-04-30 | 13F | Mn Services Vermogensbeheer B.V. | 75.711 | 0,00 | 5 | -16,67 | ||||
| 2025-11-04 | 13F | Guerra Advisors Inc | 10 | 1 | ||||||
| 2026-02-13 | 13F | Findlay Park Partners LLP | 1.482.300 | -16,88 | 121.489 | -0,64 | ||||
| 2026-02-12 | 13F | Tocqueville Asset Management L.p. | 128.455 | -15,74 | 10.528 | 0,74 | ||||
| 2025-11-12 | 13F | Segall Bryant & Hamill, Llc | 0 | -100,00 | 0 | |||||
| 2026-04-30 | 13F | Munich Reinsurance Co Stock Corp in Munich | 51.250 | 3.666 | ||||||
| 2026-02-10 | 13F | Bruce G. Allen Investments, LLC | 13 | -35,00 | 1 | 0,00 | ||||
| 2026-02-12 | 13F | First Financial Bankshares Inc | 3.344 | -2,22 | 274 | 17,09 | ||||
| 2026-02-13 | 13F | Vontobel Holding Ltd. | 2.807 | -12,74 | 230 | 4,55 | ||||
| 2026-02-10 | 13F | Gulf International Bank (UK) Ltd | 10.062 | 0,00 | 1 | |||||
| 2026-02-13 | 13F | Parkside Financial Bank & Trust | 956 | 2,14 | 78 | 21,88 | ||||
| 2026-02-17 | 13F | Citadel Advisors Llc | Put | 37.900 | -20,88 | 3.106 | -5,42 | |||
| 2026-02-12 | 13F | Commonwealth Equity Services, Llc | 16.415 | -1,46 | 1.345 | 134.400,00 | ||||
| 2026-02-17 | 13F | Citadel Advisors Llc | Call | 25.800 | -57,70 | 2.115 | -49,45 | |||
| 2026-04-13 | 13F | True Wealth Design, LLC | 916 | 98,27 | 65 | 75,68 | ||||
| 2026-01-22 | 13F | Ofi Invest Asset Management | 6.149 | 504 | ||||||
| 2026-02-13 | 13F | Champlain Investment Partners, LLC | 0 | -100,00 | 0 | |||||
| 2026-02-17 | 13F | Citadel Advisors Llc | 55.951 | -60,74 | 4.586 | -53,07 | ||||
| 2026-02-13 | 13F | Boyar Asset Management Inc. | 8.057 | 660 | ||||||
| 2026-02-17 | 13F | Advisory Services Network, LLC | 0 | -100,00 | 0 | |||||
| 2026-02-17 | 13F | Wiley Bros.-aintree Capital, Llc | 30.312 | 1,79 | 2.484 | 21,88 | ||||
| 2025-11-14 | 13F | Freestone Grove Partners LP | 0 | -100,00 | 0 | -100,00 | ||||
| 2026-04-24 | 13F | UMA Financial Services, Inc. | 584 | 2,64 | 42 | -10,87 | ||||
| 2026-02-17 | 13F | Worldquant Millennium Advisors Llc | 25.846 | -41,58 | 2.118 | -30,15 | ||||
| 2025-11-14 | 13F | Lombard Odier Asset Management (USA) Corp | 0 | -100,00 | 0 | -100,00 | ||||
| 2026-02-17 | 13F | United Capital Financial Advisers, Llc | 10.768 | 38,58 | 883 | 65,79 | ||||
| 2026-01-29 | 13F | UBS Group AG | 1.760.530 | -33,82 | 144.293 | -20,88 | ||||
| 2026-04-15 | 13F | DAVENPORT & Co LLC | 649.497 | 14,51 | 46.439 | -0,44 | ||||
| 2026-02-05 | 13F | Elyxium Wealth, LLC | 212 | 17 | ||||||
| 2026-02-13 | 13F | OMERS ADMINISTRATION Corp | 7.154 | 0,00 | 586 | 19,59 | ||||
| 2026-02-17 | 13F | D. E. Shaw & Co., Inc. | 172.270 | -81,34 | 14.119 | -77,70 | ||||
| 2026-02-13 | 13F | Ubs Asset Management Americas Inc | 2.563.067 | -3,73 | 210.069 | 15,09 | ||||
| 2026-02-17 | 13F | Edmond De Rothschild Holding S.a. | 83.400 | 0,00 | 6.835 | 19,56 | ||||
| 2026-02-12 | 13F | Hollencrest Capital Management | 100 | 0,00 | 8 | 33,33 | ||||
| 2026-02-12 | 13F | Federated Hermes, Inc. | 0 | -100,00 | 0 | |||||
| 2026-02-05 | 13F | DnB Asset Management AS | 39.311 | 0,00 | 3.222 | 19,52 | ||||
| 2026-01-29 | 13F | Rakuten Securities, Inc. | 0 | -100,00 | 0 | |||||
| 2026-02-13 | 13F | Rhenman & Partners Asset Management AB | 327.500 | 38,19 | 26.842 | 65,20 | ||||
| 2025-11-06 | 13F | Versor Investments LP | 0 | -100,00 | 0 | |||||
| 2026-02-10 | 13F | Acadian Asset Management Llc | 2.096 | 191,11 | 0 | |||||
| 2026-02-13 | 13F | Nicolet Advisory Services, Llc | 3.291 | 7,94 | 274 | 30,00 | ||||
| 2025-11-13 | 13F | BancorpSouth Bank | 0 | -100,00 | 0 | |||||
| 2026-04-10 | 13F | Quaker Wealth Management, LLC | 14 | 180,00 | 1 | |||||
| 2025-11-14 | 13F | Ubs Oconnor Llc | Put | 0 | -100,00 | 0 | -100,00 | |||
| 2026-02-09 | 13F | AIA Group Ltd | 24.226 | 1.986 | ||||||
| 2025-11-14 | 13F | Ubs Oconnor Llc | 0 | -100,00 | 0 | -100,00 | ||||
| 2026-04-07 | 13F | Abacus Planning Group, Inc. | 5.141 | 0,00 | 368 | -12,83 | ||||
| 2026-02-09 | 13F | Onefund, Llc | 564 | 9,51 | 46 | 31,43 | ||||
| 2026-02-17 | 13F | Twinbeech Capital Lp | 0 | -100,00 | 0 | |||||
| 2025-11-14 | 13F | Wolverine Trading, Llc | 20.538 | 1.390 | ||||||
| 2026-02-13 | 13F | Aviso Financial Inc. | 12.734 | 1.044 | ||||||
| 2026-02-17 | 13F | Northern Trust Corp | 1.834.764 | 2,48 | 150.377 | 22,51 | ||||
| 2025-11-14 | 13F | Wolverine Trading, Llc | Call | 16.700 | 9,15 | 1.130 | 3,86 | |||
| 2025-11-14 | 13F | Wolverine Trading, Llc | Put | 33.600 | 572,00 | 2.274 | 540,28 | |||
| 2026-02-17 | 13F | Mercer Global Advisors Inc /adv | 17.893 | 94,79 | 1.466 | 133,07 | ||||
| 2026-04-28 | 13F | Handelsbanken Fonder AB | 74.002 | 5,80 | 5 | 0,00 | ||||
| 2026-02-11 | 13F | Prudential Plc | 94.630 | -7,65 | 7.756 | 10,39 | ||||
| 2026-04-15 | 13F | Bayforest Capital Ltd | 0 | -100,00 | 0 | |||||
| 2026-04-15 | 13F | Merit Financial Group, LLC | 11.230 | 174,64 | 803 | 139,40 | ||||
| 2026-02-17 | 13F | RMB Capital Management, LLC | 152.744 | -24,39 | 12.519 | -9,62 | ||||
| 2026-02-17 | 13F | Gotham Asset Management, LLC | 243.614 | 110,34 | 19.967 | 151,46 | ||||
| 2026-02-18 | 13F | Wahed Invest LLC | 5.245 | -1,56 | 430 | 17,53 | ||||
| 2026-04-20 | 13F | Concurrent Investment Advisors, LLC | 0 | -100,00 | 0 | -100,00 | ||||
| 2026-02-09 | 13F | Coldstream Capital Management Inc | 7.385 | 53,37 | 605 | 83,33 | ||||
| 2026-05-01 | 13F | Commonwealth Of Pennsylvania Public School Empls Retrmt Sys | 45.652 | -1,28 | 3.264 | -13,88 | ||||
| 2026-04-29 | 13F | Sunrise Financial Services, LLC | 3 | 0 | ||||||
| 2026-04-17 | 13F | AdvisorNet Financial, Inc | 112 | 27,27 | 8 | 14,29 | ||||
| 2026-02-03 | 13F | NewEdge Wealth, LLC | 50.912 | -9,86 | 4.173 | 7,25 | ||||
| 2026-02-13 | 13F | Colony Group, LLC | 1.294.080 | 39.754,64 | 106.063 | 48.552,29 | ||||
| 2026-02-13 | 13F | Public Sector Pension Investment Board | 0 | -100,00 | 0 | |||||
| 2026-05-01 | 13F | Hantz Financial Services, Inc. | 5.536 | 23,88 | 0 | |||||
| 2026-02-19 | 13F | Invesco Ltd. | 3.164.934 | -28,38 | 259.398 | -14,38 | ||||
| 2026-04-27 | 13F | Mount Yale Investment Advisors, LLC | 10.550 | 51,19 | 754 | 32,05 | ||||
| 2026-02-13 | 13F | Rivulet Capital, Llc | 0 | -100,00 | 0 | |||||
| 2026-04-28 | 13F | SBI Securities Co., Ltd. | 3 | 0,00 | 0 | |||||
| 2026-02-17 | 13F | ArrowMark Colorado Holdings LLC | 764.711 | -33,59 | 62.676 | -20,61 | ||||
| 2026-02-11 | 13F | Twin Tree Management, LP | Call | 26.200 | -51,84 | 2.147 | -42,42 | |||
| 2026-02-13 | 13F | SRS Capital Advisors, Inc. | 3.196 | -72,25 | 262 | -66,92 | ||||
| 2026-01-30 | 13F | Skylands Capital, LLC | 0 | -100,00 | 0 | |||||
| 2026-04-24 | 13F | Wd Rutherford Llc | 0 | -100,00 | 0 | |||||
| 2025-11-07 | 13F | Amica Retiree Medical Trust | 1.454 | 0,00 | 0 | |||||
| 2026-02-17 | 13F | Public Employees Retirement System Of Ohio | 59.955 | -3,65 | 4.914 | 15,17 | ||||
| 2026-02-13 | 13F | Panagora Asset Management Inc | 21.141 | -3,12 | 1.733 | 15,78 | ||||
| 2026-02-13 | 13F | Caitong International Asset Management Co., Ltd | 0 | -100,00 | 0 | |||||
| 2026-02-05 | 13F | Gamco Investors, Inc. Et Al | 44.000 | 0,00 | 3.606 | 19,56 | ||||
| 2026-02-13 | 13F | Charles Schwab Investment Management Inc | 1.772.291 | 1,55 | 145.257 | 21,39 | ||||
| 2026-02-17 | 13F | Cetera Investment Advisers | 48.529 | 48,95 | 3.977 | 78,10 | ||||
| 2026-04-22 | 13F | Larry Mathis Financial Planning, LLC | 5.757 | -3,58 | 412 | -15,95 | ||||
| 2026-02-17 | 13F | Aureus Asset Management, LLC | 2.892 | 237 | ||||||
| 2026-02-17 | 13F | Dv Equities, Llc | 278 | 23 | ||||||
| 2026-02-10 | 13F | Fideuram Asset Management (Ireland) dac | 170 | 15 | ||||||
| 2026-02-13 | 13F | BNP Paribas Asset Management Holding S.A. | 168.650 | -45,57 | 14 | -38,10 | ||||
| 2026-04-13 | 13F | Czech National Bank | 53.374 | 1,81 | 3.816 | -11,17 | ||||
| 2026-04-08 | 13F | NorthCrest Asset Manangement, LLC | 6.275 | 440 | ||||||
| 2026-01-14 | 13F | Net Worth Advisory Group | 6.890 | 8,06 | 565 | 29,06 | ||||
| 2026-02-09 | 13F | Buckhead Capital Management Llc | 58.105 | -1,40 | 4.762 | 17,87 | ||||
| 2026-02-12 | 13F | Geneva Capital Management Llc | 0 | -100,00 | 0 | |||||
| 2026-04-27 | 13F | Simplify Asset Management Inc. | 9.942 | -27,12 | 711 | -36,49 | ||||
| 2026-02-17 | 13F | Grantham, Mayo, Van Otterloo & Co. LLC | 17.500 | 1.434 | ||||||
| 2026-04-15 | 13F | Norden Group Llc | 6.130 | -7,60 | 438 | -19,34 | ||||
| 2026-02-12 | 13F | Federation des caisses Desjardins du Quebec | 11.075 | -14,43 | 908 | 2,25 | ||||
| 2026-04-15 | 13F | Exchange Traded Concepts, Llc | 1.724 | 8,63 | 123 | -5,38 | ||||
| 2026-02-12 | 13F | Colonial Trust Co / SC | 62 | 0,00 | 5 | 25,00 | ||||
| 2026-02-17 | 13F | Capstone Investment Advisors, Llc | 4.756 | 390 | ||||||
| 2026-01-08 | 13F | Nordea Investment Management Ab | 18.572 | 0,09 | 1.526 | 21,03 | ||||
| 2026-01-26 | 13F | Cm Wealth Advisors Llc | 3.179 | 261 | ||||||
| 2026-02-11 | 13F | Winnow Wealth Llc | 1 | 0,00 | 0 | |||||
| 2026-05-01 | 13F | HFM Investment Advisors, LLC | 8 | -20,00 | 1 | |||||
| 2026-04-22 | 13F | Arcadia Investment Management Corp/mi | 140 | 0,00 | 10 | -9,09 | ||||
| 2026-02-10 | 13F | Bnp Paribas Arbitrage, Sa | 262.305 | 2,51 | 21.499 | 22,55 | ||||
| 2026-02-12 | 13F | Ci Investments Inc. | 54.549 | -38,33 | 4.471 | 74.400,00 | ||||
| 2026-04-29 | 13F | WPG Advisers, LLC | 96 | 9,09 | 7 | -14,29 | ||||
| 2026-04-29 | 13F | American Capital Advisory, LLC | 2 | 0,00 | 0 | |||||
| 2026-02-11 | 13F | Cerity Partners LLC | 64.379 | 208,58 | 5.277 | 268,95 | ||||
| 2026-02-13 | 13F | Treasurer of the State of North Carolina | 83.459 | -6,81 | 7 | 0,00 | ||||
| 2026-02-17 | 13F | Nomura Holdings Inc | 2.441 | -99,78 | 200 | -99,74 | ||||
| 2026-02-12 | 13F | Rossby Financial, LCC | 19 | 2 | ||||||
| 2026-02-10 | 13F | Nomura Asset Management Co Ltd | 65.818 | 1,61 | 5.394 | 21,46 | ||||
| 2026-04-16 | 13F | Capital Advisors, Ltd. LLC | 52 | 0,00 | 0 | |||||
| 2026-02-06 | 13F | Entrust Financial Llc | 232 | 19 | ||||||
| 2026-04-27 | 13F | 4wealth Advisors, Inc. | 4.714 | 6,20 | 327 | -10,19 | ||||
| 2025-11-14 | 13F | Lido Advisors, LLC | 0 | -100,00 | 0 | |||||
| 2025-11-12 | 13F | Bare Financial Services, Inc | 0 | -100,00 | 0 | |||||
| 2026-04-30 | 13F | Resona Asset Management Co.,Ltd. | 61.237 | -0,80 | 4.352 | -14,05 | ||||
| 2026-02-17 | 13F | Wellington Management Group Llp | 4.179.671 | -32,42 | 342.566 | -19,21 | ||||
| 2025-11-14 | 13F | Hrt Financial Lp | 0 | -100,00 | 0 | |||||
| 2026-02-13 | 13F | Natixis | 59.394 | 46,26 | 4.868 | 74,82 | ||||
| 2026-04-28 | 13F | Steigerwald, Gordon & Koch Inc. | 55 | 0,00 | 4 | -25,00 | ||||
| 2026-05-01 | 13F | Diversify Wealth Management, Llc | 37.303 | 65,35 | 2.288 | 24,15 | ||||
| 2026-02-06 | 13F | Abn Amro Investment Solutions | 5.814 | 477 | ||||||
| 2026-04-28 | 13F | DGS Capital Management, LLC | 3.199 | 229 | ||||||
| 2025-11-07 | 13F | Hardy Reed LLC | 0 | -100,00 | 0 | |||||
| 2026-02-17 | 13F | Aristotle Atlantic Partners, Llc | 64.000 | 0,00 | 5.245 | 19,56 | ||||
| 2026-02-13 | 13F | Heritage Wealth Advisors | 25.348 | 2.078 | ||||||
| 2026-04-22 | 13F | TruNorth Capital Management, LLC | 0 | -100,00 | 0 | |||||
| 2026-04-30 | 13F | Sequoia Financial Advisors, LLC | 8.782 | -9,26 | 628 | -20,93 | ||||
| 2026-02-17 | 13F | Sone Capital Management, LLC | 76.649 | -58,26 | 6.282 | -50,10 | ||||
| 2026-04-15 | 13F | Trust Co Of Toledo Na /oh/ | 5 | 0 | ||||||
| 2026-02-13 | 13F | C M Bidwell & Associates Ltd | 1.407 | 115 | ||||||
| 2026-04-30 | 13F | ASR Vermogensbeheer N.V. | 3.581 | 2,40 | 256 | -10,49 | ||||
| 2026-02-17 | 13F | Millennium Management Llc | 507.998 | -76,68 | 41.636 | -72,12 | ||||
| 2026-02-13 | 13F | Public Employees Retirement Association Of Colorado | 15.698 | 0,00 | 1 | 0,00 | ||||
| 2026-02-12 | 13F | Ensign Peak Advisors, Inc | 22.571 | -49,78 | 1.850 | -39,99 | ||||
| 2026-02-17 | 13F | Man Group plc | 164.049 | -40,62 | 13.445 | -29,02 | ||||
| 2026-02-17 | 13F | Unisphere Establishment | 0 | -100,00 | 0 | |||||
| 2026-02-03 | 13F | Crossmark Global Holdings, Inc. | 9.089 | -0,20 | 745 | 19,23 | ||||
| 2026-02-17 | 13F | Holocene Advisors, LP | 0 | -100,00 | 0 | |||||
| 2026-04-30 | 13F | Kestra Advisory Services, LLC | 0 | -100,00 | 0 | |||||
| 2026-04-20 | 13F | Banque Cantonale Vaudoise | 434 | -96,12 | 31 | -96,62 | ||||
| 2026-04-29 | 13F | Swedbank AB | 819.229 | -23,72 | 58.575 | -33,46 | ||||
| 2026-02-17 | 13F | Select Equity Group, L.P. | 0 | -100,00 | 0 | |||||
| 2026-02-13 | 13F | Arkadios Wealth Advisors | 3.552 | 14,29 | 291 | 36,62 | ||||
| 2026-04-23 | 13F | Private Wealth Management Group, LLC | 17 | 0,00 | 1 | 0,00 | ||||
| 2026-02-13 | 13F | Pacific Center for Financial Services | 68 | 0,00 | 5 | 0,00 | ||||
| 2026-04-22 | 13F | Figure 8 Investment Strategies Llc | 9.862 | -4,06 | 705 | -16,27 | ||||
| 2026-02-12 | 13F | Empirical Finance, LLC | 6.795 | -4,13 | 557 | 14,64 | ||||
| 2026-02-17 | 13F | London Co Of Virginia | 2.074.379 | 170.016 | ||||||
| 2026-01-28 | 13F | N.E.W. Advisory Services LLC | 8 | 0,00 | 1 | |||||
| 2026-02-10 | 13F | Norges Bank | 405.246 | 33.214 | ||||||
| 2026-02-05 | 13F | Allworth Financial LP | 1.355 | 14,06 | 111 | 37,04 | ||||
| 2025-11-06 | 13F | Bryce Point Capital, LLC | 8.515 | 584 | ||||||
| 2026-02-10 | 13F | Goldman Sachs Group Inc | 794.963 | 56,30 | 65.155 | 86,86 | ||||
| 2026-02-10 | 13F | MKP Capital Management, L.L.C. | 200.000 | 16.392 | ||||||
| 2026-02-10 | 13F | Principia Wealth Advisory, LLC | 16 | 0,00 | 1 | 0,00 | ||||
| 2026-02-12 | 13F | South Dakota Investment Council | 1.000 | -9,09 | 0 | |||||
| 2026-04-13 | 13F | IFP Advisors, Inc | 1.751 | -81,46 | 125 | -83,83 | ||||
| 2026-01-29 | 13F | Quest 10 Wealth Builders, Inc. | 3 | 0,00 | 0 | |||||
| 2026-01-22 | 13F | Evermay Wealth Management Llc | 1.216 | 0,00 | 100 | 19,28 | ||||
| 2026-02-17 | 13F | Norinchukin Bank, The | 12.003 | 6,38 | 984 | 27,17 | ||||
| 2026-01-23 | 13F | Assetmark, Inc | 184.410 | 20,98 | 15.114 | 44,63 | ||||
| 2026-02-17 | 13F | Toronto Dominion Bank | 71.976 | -8,81 | 5.899 | 9,12 | ||||
| 2026-04-17 | 13F | Brown, Lisle/cummings, Inc. | 8 | 0,00 | 1 | |||||
| 2025-11-13 | 13F | Capital Fund Management S.a. | 0 | -100,00 | 0 | |||||
| 2026-02-12 | 13F | Steward Partners Investment Advisory, Llc | 1.562 | -19,23 | 128 | -3,03 | ||||
| 2026-02-13 | 13F | Vega Investment Solutions | 10.335 | 42,06 | 847 | 63,83 | ||||
| 2026-02-12 | 13F | Cloud Capital Management, LLC | 0 | -100,00 | 0 | |||||
| 2026-02-13 | 13F | Manufacturers Life Insurance Company, The | 0 | -100,00 | 0 | |||||
| 2026-02-18 | 13F | State of Tennessee, Treasury Department | 122.814 | -8,81 | 9.995 | 8,24 | ||||
| 2026-02-17 | 13F | Estuary Capital Management LP | 70.397 | -88,69 | 5.770 | -86,48 | ||||
| 2026-01-23 | 13F | Transcend Wealth Collective, Llc | 2.553 | 209 | ||||||
| 2026-04-01 | 13F | Laurus Investment Counsel Inc. | 0 | -100,00 | 0 | |||||
| 2026-02-10 | 13F | Intech Investment Management Llc | 7.298 | -9,76 | 598 | 7,94 | ||||
| 2026-02-10 | 13F | State of Wyoming | 0 | -100,00 | 0 | |||||
| 2025-11-14 | 13F | Binnacle Investments Inc | 12 | 1 | ||||||
| 2026-02-13 | 13F | Charter Oak Advisors LP | 76.738 | 6.289 | ||||||
| 2026-04-30 | 13F | Candriam Luxembourg S.C.A. | 8.878 | 11,79 | 635 | -2,46 | ||||
| 2026-02-17 | 13F | T. Rowe Price Investment Management, Inc. | 5.899.359 | -39,97 | 484 | -28,23 | ||||
| 2026-01-27 | 13F | Regions Financial Corp | 5.006 | 410 | ||||||
| 2025-11-14 | 13F | Petrus Trust Company, LTA | 0 | -100,00 | 0 | |||||
| 2026-02-05 | 13F | Tucker Asset Management Llc | 18 | 1 | ||||||
| 2026-02-11 | 13F | Los Angeles Capital Management Llc | 917 | 64 | ||||||
| 2025-11-14 | 13F | WealthTrak Capital Management LLC | 0 | -100,00 | 0 | |||||
| 2026-04-09 | 13F | Pacific Capital Partners Ltd | 26.410 | 1.888 | ||||||
| 2026-02-17 | 13F | Tudor Investment Corp Et Al | 465.497 | 38.152 | ||||||
| 2026-04-14 | 13F | Zrc Wealth Management, Llc | 33 | 266,67 | 2 | |||||
| 2026-02-17 | 13F | Wealth Watch Advisors, INC | 31 | 55,00 | 3 | 100,00 | ||||
| 2026-02-06 | 13F | Larson Financial Group LLC | 84 | -50,30 | 7 | -45,45 | ||||
| 2026-04-16 | 13F | SG Americas Securities, LLC | 0 | -100,00 | 0 | |||||
| 2026-04-16 | 13F | BI Asset Management Fondsmaeglerselskab A/S | 5.610 | -39,95 | 0 | |||||
| 2026-02-13 | 13F | Kilter Group LLC | 21 | 2 | ||||||
| 2025-11-14 | 13F | Atom Investors LP | 0 | -100,00 | 0 | |||||
| 2026-04-08 | 13F | Thompson Investment Management, Inc. | 56.231 | 1,21 | 4.021 | -11,71 | ||||
| 2026-04-20 | 13F | State of Alaska, Department of Revenue | 24.851 | -1,49 | 2 | -50,00 | ||||
| 2026-02-13 | 13F | Sei Investments Co | 285.442 | -44,79 | 23.395 | -34,00 | ||||
| 2026-02-09 | 13F | Fisher Asset Management, LLC | 10.886 | -86,61 | 892 | -83,99 | ||||
| 2026-02-13 | 13F | Y-Intercept (Hong Kong) Ltd | 0 | -100,00 | 0 | |||||
| 2026-02-10 | 13F | Marshall & Sterling Wealth Advisors Inc. | 0 | -100,00 | 0 | |||||
| 2026-01-30 | 13F | Us Bancorp \de\ | 17.873 | -8,05 | 1.465 | 9,91 | ||||
| 2026-04-17 | 13F | PKO Investment Management Joint-Stock Co | 3.000 | 0,00 | 214 | -12,65 | ||||
| 2026-02-13 | 13F | Mufg Securities Americas Inc. | 5.356 | -0,46 | 439 | 19,02 | ||||
| 2025-11-12 | 13F | NewSquare Capital LLC | 0 | -100,00 | 0 | |||||
| 2026-02-03 | 13F | Mitsubishi UFJ Kokusai Asset Management Co., Ltd. | 421.948 | 6,00 | 34.224 | 25,41 | ||||
| 2026-01-28 | 13F | Universal- Beteiligungs- und Servicegesellschaft mbH | 168.860 | 5,87 | 13.897 | 27,08 | ||||
| 2026-02-13 | 13F | State Street Corp | 8.793.747 | 2,41 | 720.736 | 22,43 | ||||
| 2026-02-11 | 13F | Capital World Investors | 10.208.203 | -3,25 | 836.664 | 15,65 | ||||
| 2026-02-11 | 13F | Ramirez Asset Management, Inc. | 3.943 | 323 | ||||||
| 2026-02-17 | 13F | Modern Wealth Management, LLC | 2.812 | 230 | ||||||
| 2026-04-22 | 13F | Janney Montgomery Scott LLC | 72.396 | 4,17 | 5 | 0,00 | ||||
| 2026-02-13 | 13F | Clal Insurance Enterprises Holdings Ltd | 157 | 18,94 | 0 | |||||
| 2026-02-10 | 13F | Sivia Capital Partners, LLC | 5.801 | 475 | ||||||
| 2025-11-21 | 13F | Nebula Research & Development LLC | 0 | -100,00 | 0 | |||||
| 2026-02-17 | 13F | Aqr Capital Management Llc | 1.653.678 | 247,12 | 135.535 | 316,01 | ||||
| 2025-11-07 | 13F | Synovus Financial Corp | 43.175 | -0,27 | 2.960 | -3,90 | ||||
| 2026-04-29 | 13F | Axxcess Wealth Management, Llc | 0 | -100,00 | 0 | |||||
| 2026-02-10 | 13F | Eurizon Capital SGR S.p.A. | 26.612 | 2.183 | ||||||
| 2026-02-13 | 13F | JustInvest LLC | 41.933 | 82,85 | 3.437 | 118,58 | ||||
| 2025-11-10 | 13F | Lansforsakringar Fondforvaltning AB (publ) | 0 | -100,00 | 0 | |||||
| 2026-02-11 | 13F | Meeder Asset Management Inc | 65 | 4,84 | 5 | 25,00 | ||||
| 2026-02-12 | 13F | State Board Of Administration Of Florida Retirement System | 178.414 | -1,60 | 14.623 | 17,63 | ||||
| 2026-02-11 | 13F | Vestcor Inc | 3.908 | 0,00 | 0 | |||||
| 2026-02-02 | 13F | Breakwater Investment Management | 7 | 1 | ||||||
| 2026-02-13 | 13F | Squarepoint Ops LLC | 73.513 | 1.281,30 | 6.025 | 1.555,22 | ||||
| 2026-02-17 | 13F | Perbak Capital Partners LLP | 3.601 | 295 | ||||||
| 2026-02-11 | 13F | Clearbridge Investments, LLC | 193.305 | -40,46 | 15.843 | -28,83 | ||||
| 2026-02-12 | 13F | California Public Employees Retirement System | 399.191 | -15,07 | 32.718 | 1,53 | ||||
| 2026-01-07 | 13F | Baldwin Brothers Inc/ma | 0 | -100,00 | 0 | |||||
| 2026-02-02 | 13F | Montag A & Associates Inc | 0 | -100,00 | 0 | |||||
| 2026-02-11 | 13F | Brandywine Global Investment Management, LLC | 43.734 | 3.584 | ||||||
| 2026-02-04 | 13F | Swiss Life Asset Management Ltd | 55.786 | 12,91 | 4.572 | 34,99 | ||||
| 2026-02-17 | 13F | Susquehanna International Group, Llp | Put | 66.500 | 11,20 | 5.450 | 32,96 | |||
| 2026-02-17 | 13F | Susquehanna International Group, Llp | Call | 100.100 | 166,22 | 8.204 | 218,35 | |||
| 2026-04-20 | 13F | Jfs Wealth Advisors, Llc | 90 | -8,16 | 6 | -25,00 | ||||
| 2026-02-17 | 13F | Susquehanna International Group, Llp | 75.004 | -44,58 | 6.147 | -33,75 | ||||
| 2026-02-11 | 13F | Simplex Trading, Llc | 3.552 | -53,72 | 291 | |||||
| 2026-02-06 | 13F | Addison Advisors LLC | 295 | 90,32 | 24 | 140,00 | ||||
| 2026-02-17 | 13F | Expect Equity LLC | 34.620 | 29,03 | 2.837 | 54,27 | ||||
| 2026-04-29 | 13F | CVA Family Office, LLC | 283 | 162,04 | 20 | 150,00 | ||||
| 2026-04-16 | 13F | Evolve Private Wealth, Llc | 4.565 | 50,71 | 326 | 31,45 | ||||
| 2026-02-03 | 13F | Bokf, Na | 0 | -100,00 | 0 | |||||
| 2025-11-12 | 13F | Aptus Capital Advisors, LLC | 0 | -100,00 | 0 | |||||
| 2026-02-13 | 13F | Korea Investment CORP | 47.715 | -0,62 | 3.911 | 18,81 | ||||
| 2025-11-13 | 13F/A | Peak6 Llc | 0 | -100,00 | 0 | -100,00 |