Grundlæggende statistik
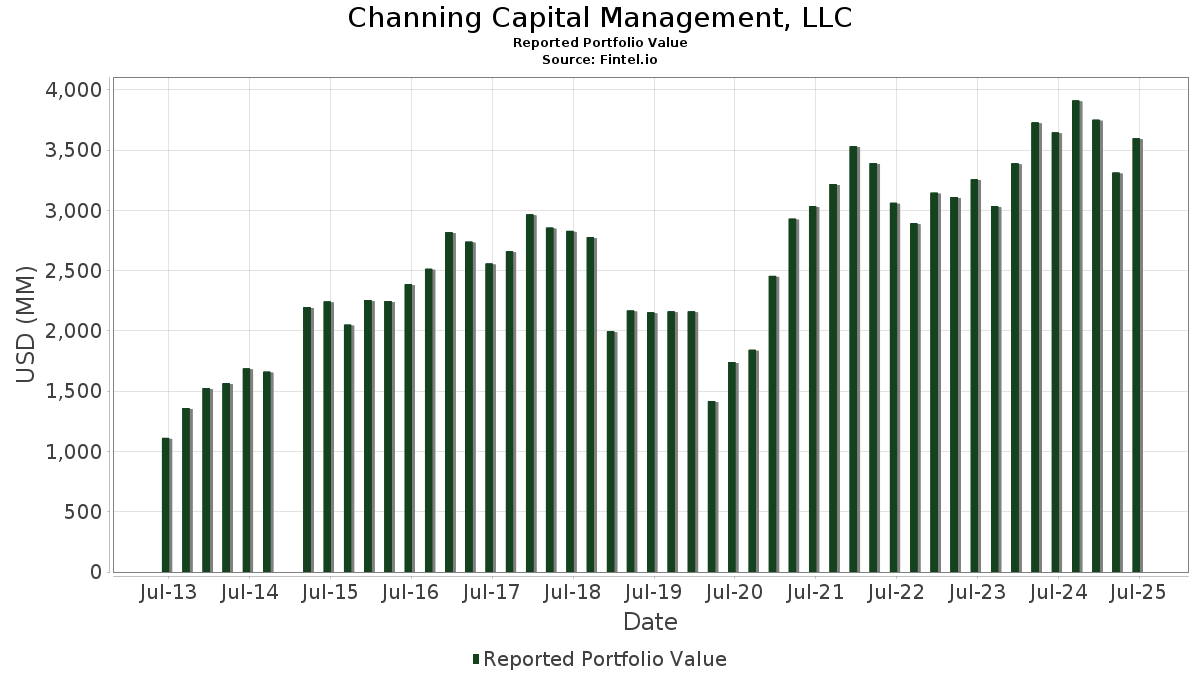
| Porteføljeværdi | $ 3.596.574.628 |
| Nuværende stillinger | 105 |
Seneste beholdninger, ydeevne, AUM (fra 13F, 13D)
Channing Capital Management, LLC har afsløret 105 samlede besiddelser i deres seneste SEC-arkivering. Den seneste porteføljeværdi er beregnet til at være $ 3.596.574.628 USD. Faktiske aktiver under forvaltning (AUM) er denne værdi plus kontanter (som ikke er oplyst). Channing Capital Management, LLCs største beholdninger er MKS Inc. (US:MKSI) , Evercore Inc. (US:EVR) , Stifel Financial Corp. (US:SF) , Parsons Corporation (US:PSN) , and Synovus Financial Corp. (US:SNV) . Channing Capital Management, LLCs nye stillinger omfatter The PNC Financial Services Group, Inc. (US:PNC) , Amazon.com, Inc. (US:AMZN) , Packaging Corporation of America (US:PKG) , Seagate Technology Holdings plc (US:STX) , and Atmus Filtration Technologies Inc. (US:ATMU) .
Top øger dette kvartal
Vi bruger ændringen i porteføljeallokeringen, fordi dette er den mest meningsfulde metrik. Ændringer kan skyldes handler eller ændringer i aktiekurser.
| Sikkerhed | Aktier (MM) |
Værdi (MM$) |
Portefølje % | ΔPortefølje % |
|---|---|---|---|---|
| 0,36 | 98,21 | 2,7306 | 2,5082 | |
| 2,37 | 75,68 | 2,1042 | 2,1042 | |
| 1,32 | 81,25 | 2,2591 | 1,9901 | |
| 2,16 | 81,94 | 2,2782 | 1,4936 | |
| 0,99 | 98,50 | 2,7386 | 1,4004 | |
| 0,95 | 90,15 | 2,5065 | 1,3979 | |
| 1,28 | 91,67 | 2,5488 | 0,6498 | |
| 0,63 | 72,48 | 2,0152 | 0,3852 | |
| 0,14 | 11,36 | 0,3157 | 0,3157 | |
| 0,41 | 68,45 | 1,9032 | 0,2879 |
Top falder i dette kvartal
Vi bruger ændringen i porteføljeallokeringen, fordi dette er den mest meningsfulde metrik. Ændringer kan skyldes handler eller ændringer i aktiekurser.
| Sikkerhed | Aktier (MM) |
Værdi (MM$) |
Portefølje % | ΔPortefølje % |
|---|---|---|---|---|
| 0,11 | 10,49 | 0,2918 | -2,1472 | |
| 1,08 | 44,07 | 1,2253 | -0,9259 | |
| 0,70 | 52,41 | 1,4571 | -0,7881 | |
| 2,41 | 66,39 | 1,8458 | -0,6267 | |
| 1,47 | 41,71 | 1,1597 | -0,5930 | |
| 0,48 | 58,98 | 1,6399 | -0,5394 | |
| 0,83 | 71,37 | 1,9844 | -0,4566 | |
| 1,76 | 56,87 | 1,5812 | -0,3024 | |
| 0,49 | 84,21 | 2,3413 | -0,2818 | |
| 0,83 | 74,47 | 2,0706 | -0,2466 |
13F og Fondsarkivering
Denne formular blev indsendt den 2025-08-13 for rapporteringsperioden 2025-06-30. Klik på linkikonet for at se den fulde transaktionshistorik.
Opgrader for at låse op for premium-data og eksportere til Excel ![]() .
.
| Sikkerhed | Type | Gennemsnitlig aktiekurs | Aktier (MM) |
Δ Aktier (%) |
Δ Aktier (%) |
Værdi ($MM) |
Portefølje (%) |
ΔPortefølje (%) |
|
|---|---|---|---|---|---|---|---|---|---|
| MKSI / MKS Inc. | 0,99 | 79,27 | 98,50 | 122,24 | 2,7386 | 1,4004 | |||
| EVR / Evercore Inc. | 0,36 | 886,34 | 98,21 | 1.233,60 | 2,7306 | 2,5082 | |||
| SF / Stifel Financial Corp. | 0,89 | 7,44 | 91,89 | 18,30 | 2,5550 | 0,2095 | |||
| PSN / Parsons Corporation | 1,28 | 20,25 | 91,67 | 45,76 | 2,5488 | 0,6498 | |||
| SNV / Synovus Financial Corp. | 1,75 | -2,72 | 90,58 | 7,71 | 2,5185 | -0,0207 | |||
| LITE / Lumentum Holdings Inc. | 0,95 | 61,02 | 90,15 | 145,54 | 2,5065 | 1,3979 | |||
| GTES / Gates Industrial Corporation plc | 3,91 | -3,23 | 90,09 | 21,05 | 2,5048 | 0,2577 | |||
| MSA / MSA Safety Incorporated | 0,52 | 4,62 | 86,52 | 19,48 | 2,4057 | 0,2192 | |||
| WTFC / Wintrust Financial Corporation | 0,69 | -2,63 | 85,11 | 7,35 | 2,3664 | -0,0276 | |||
| AMG / Affiliated Managers Group, Inc. | 0,43 | -3,09 | 84,70 | 13,49 | 2,3551 | 0,1014 | |||
| NXST / Nexstar Media Group, Inc. | 0,49 | 0,44 | 84,21 | -3,07 | 2,3413 | -0,2818 | |||
| LFUS / Littelfuse, Inc. | 0,36 | -8,16 | 82,05 | 5,84 | 2,2814 | -0,0594 | |||
| VVV / Valvoline Inc. | 2,16 | 189,85 | 81,94 | 215,33 | 2,2782 | 1,4936 | |||
| TKR / The Timken Company | 1,13 | 4,15 | 81,88 | 5,14 | 2,2767 | -0,0749 | |||
| HRI / Herc Holdings Inc. | 0,62 | 15,42 | 81,41 | 13,21 | 2,2635 | 0,0921 | |||
| FAF / First American Financial Corporation | 1,32 | 875,14 | 81,25 | 812,20 | 2,2591 | 1,9901 | |||
| MSGE / Madison Square Garden Entertainment Corp. | 2,03 | -9,04 | 80,96 | 11,04 | 2,2509 | 0,0495 | |||
| APAM / Artisan Partners Asset Management Inc. | 1,74 | 0,77 | 77,09 | 14,25 | 2,1435 | 0,1061 | |||
| CADE / Cadence Bank | 2,37 | 75,68 | 2,1042 | 2,1042 | |||||
| BCO / The Brink's Company | 0,83 | -6,36 | 74,47 | -2,96 | 2,0706 | -0,2466 | |||
| PNFP / Pinnacle Financial Partners, Inc. | 0,67 | 1,84 | 74,15 | 6,04 | 2,0616 | -0,0497 | |||
| STAG / STAG Industrial, Inc. | 2,02 | -0,95 | 73,28 | -0,51 | 2,0374 | -0,1866 | |||
| AEIS / Advanced Energy Industries, Inc. | 0,55 | -22,72 | 72,77 | 7,43 | 2,0232 | -0,0219 | |||
| ONB / Old National Bancorp | 3,40 | 3,23 | 72,53 | 3,96 | 2,0166 | -0,0900 | |||
| BDC / Belden Inc. | 0,63 | 16,23 | 72,48 | 34,26 | 2,0152 | 0,3852 | |||
| BYD / Boyd Gaming Corporation | 0,92 | -10,29 | 71,84 | 6,61 | 1,9975 | -0,0373 | |||
| HXL / Hexcel Corporation | 1,27 | 7,84 | 71,49 | 11,25 | 1,9876 | 0,0474 | |||
| ATI / ATI Inc. | 0,83 | -46,80 | 71,37 | -11,72 | 1,9844 | -0,4566 | |||
| SPXC / SPX Technologies, Inc. | 0,41 | -1,73 | 68,45 | 27,95 | 1,9032 | 0,2879 | |||
| CDP / COPT Defense Properties | 2,41 | -19,84 | 66,39 | -18,93 | 1,8458 | -0,6267 | |||
| OSW / OneSpaWorld Holdings Limited | 3,26 | 0,14 | 66,38 | 21,61 | 1,8457 | 0,1974 | |||
| BC / Brunswick Corporation | 1,20 | 5,07 | 66,09 | 7,79 | 1,8377 | -0,0139 | |||
| ABG / Asbury Automotive Group, Inc. | 0,27 | 4,00 | 65,13 | 12,33 | 1,8109 | 0,0602 | |||
| LPX / Louisiana-Pacific Corporation | 0,75 | 21,81 | 64,50 | 13,88 | 1,7934 | 0,0831 | |||
| ITGR / Integer Holdings Corporation | 0,48 | -21,58 | 58,98 | -18,28 | 1,6399 | -0,5394 | |||
| MGRC / McGrath RentCorp | 0,50 | 1,58 | 58,21 | 5,73 | 1,6184 | -0,0438 | |||
| AVNT / Avient Corporation | 1,76 | 4,85 | 56,87 | -8,84 | 1,5812 | -0,3024 | |||
| SWX / Southwest Gas Holdings, Inc. | 0,70 | -31,98 | 52,41 | -29,52 | 1,4571 | -0,7881 | |||
| POR / Portland General Electric Company | 1,08 | -32,10 | 44,07 | -38,14 | 1,2253 | -0,9259 | |||
| IBP / Installed Building Products, Inc. | 0,24 | 12,61 | 42,87 | 18,42 | 1,1920 | 0,0989 | |||
| NOG / Northern Oil and Gas, Inc. | 1,47 | -23,38 | 41,71 | -28,15 | 1,1597 | -0,5930 | |||
| WAB / Westinghouse Air Brake Technologies Corporation | 0,09 | -20,27 | 17,97 | -7,97 | 0,4996 | -0,0899 | |||
| CR / Crane Company | 0,07 | -5,05 | 12,67 | 17,71 | 0,3523 | 0,0273 | |||
| GS / The Goldman Sachs Group, Inc. | 0,02 | -0,41 | 12,34 | 29,02 | 0,3432 | 0,0543 | |||
| ITT / ITT Inc. | 0,08 | -0,11 | 12,34 | 21,28 | 0,3431 | 0,0359 | |||
| C / Citigroup Inc. | 0,14 | -0,42 | 12,27 | 19,40 | 0,3413 | 0,0309 | |||
| TXN / Texas Instruments Incorporated | 0,06 | 4,01 | 12,15 | 20,17 | 0,3379 | 0,0326 | |||
| ARMK / Aramark | 0,28 | -0,12 | 11,72 | 21,15 | 0,3260 | 0,0338 | |||
| WFC / Wells Fargo & Company | 0,14 | -0,43 | 11,60 | 11,13 | 0,3225 | 0,0073 | |||
| BAC / Bank of America Corporation | 0,24 | -0,42 | 11,53 | 12,92 | 0,3206 | 0,0123 | |||
| CIEN / Ciena Corporation | 0,14 | 11,36 | 0,3157 | 0,3157 | |||||
| GILD / Gilead Sciences, Inc. | 0,10 | 75,63 | 11,30 | 73,80 | 0,3141 | 0,1178 | |||
| XPO / XPO, Inc. | 0,09 | 0,32 | 11,22 | 17,78 | 0,3119 | 0,0243 | |||
| LH / Labcorp Holdings Inc. | 0,04 | -13,08 | 11,21 | -1,95 | 0,3117 | -0,0336 | |||
| CSL / Carlisle Companies Incorporated | 0,03 | -3,57 | 11,03 | 5,75 | 0,3068 | -0,0083 | |||
| CRM / Salesforce, Inc. | 0,04 | 11,96 | 11,02 | 13,77 | 0,3064 | 0,0139 | |||
| STT / State Street Corporation | 0,10 | 16,70 | 10,81 | 38,61 | 0,3004 | 0,0651 | |||
| ELV / Elevance Health, Inc. | 0,03 | 10,38 | 10,58 | -1,29 | 0,2940 | -0,0295 | |||
| SSB / SouthState Corporation | 0,11 | -86,90 | 10,49 | -87,01 | 0,2918 | -2,1472 | |||
| CG / The Carlyle Group Inc. | 0,20 | 15,28 | 10,45 | 35,95 | 0,2906 | 0,0585 | |||
| RRX / Regal Rexnord Corporation | 0,07 | 1,33 | 10,42 | 29,01 | 0,2896 | 0,0458 | |||
| WSC / WillScot Holdings Corporation | 0,38 | 27,51 | 10,41 | 25,67 | 0,2894 | 0,0393 | |||
| TER / Teradyne, Inc. | 0,12 | 23,18 | 10,40 | 34,10 | 0,2892 | 0,0550 | |||
| BA / The Boeing Company | 0,05 | -3,23 | 10,34 | 18,88 | 0,2876 | 0,0249 | |||
| INTC / Intel Corporation | 0,46 | 7,19 | 10,27 | 5,72 | 0,2856 | -0,0078 | |||
| SEI / Solaris Energy Infrastructure, Inc. | 0,35 | 24,00 | 9,99 | 61,22 | 0,2779 | 0,0907 | |||
| PM / Philip Morris International Inc. | 0,05 | -19,08 | 9,94 | -7,14 | 0,2764 | -0,0469 | |||
| MRVL / Marvell Technology, Inc. | 0,13 | 63,28 | 9,94 | 105,27 | 0,2762 | 0,1301 | |||
| AXTA / Axalta Coating Systems Ltd. | 0,33 | -0,12 | 9,91 | -10,60 | 0,2757 | -0,0592 | |||
| FTAI / FTAI Aviation Ltd. | 0,08 | 0,69 | 9,75 | 4,33 | 0,2711 | -0,0111 | |||
| DG / Dollar General Corporation | 0,08 | -14,22 | 9,42 | 11,57 | 0,2620 | 0,0070 | |||
| ABBV / AbbVie Inc. | 0,05 | 4,72 | 9,35 | -7,22 | 0,2598 | -0,0443 | |||
| LKQ / LKQ Corporation | 0,25 | -0,08 | 9,26 | -13,08 | 0,2576 | -0,0642 | |||
| ENTG / Entegris, Inc. | 0,11 | 27,57 | 9,20 | 17,61 | 0,2557 | 0,0196 | |||
| PNC / The PNC Financial Services Group, Inc. | 0,05 | 9,09 | 0,2527 | 0,2527 | |||||
| ELAN / Elanco Animal Health Incorporated | 0,63 | -22,32 | 9,06 | 5,65 | 0,2520 | -0,0070 | |||
| MCHP / Microchip Technology Incorporated | 0,13 | -10,10 | 9,04 | 30,69 | 0,2514 | 0,0425 | |||
| LAD / Lithia Motors, Inc. | 0,03 | 0,13 | 8,86 | 15,23 | 0,2463 | 0,0142 | |||
| LPLA / LPL Financial Holdings Inc. | 0,02 | -28,66 | 8,83 | -18,23 | 0,2455 | -0,0806 | |||
| ON / ON Semiconductor Corporation | 0,17 | 8,76 | 0,2436 | 0,2436 | |||||
| NKE / NIKE, Inc. | 0,12 | 12,79 | 8,55 | 26,23 | 0,2376 | 0,0332 | |||
| TGT / Target Corporation | 0,09 | 20,14 | 8,54 | 13,56 | 0,2375 | 0,0104 | |||
| AMZN / Amazon.com, Inc. | 0,04 | 8,51 | 0,2367 | 0,2367 | |||||
| BLD / TopBuild Corp. | 0,03 | 28,06 | 8,36 | 35,95 | 0,2324 | 0,0468 | |||
| JLL / Jones Lang LaSalle Incorporated | 0,03 | 0,64 | 8,14 | 3,83 | 0,2264 | -0,0104 | |||
| PR / Permian Resources Corporation | 0,59 | -0,11 | 8,10 | -1,77 | 0,2253 | -0,0238 | |||
| EGP / EastGroup Properties, Inc. | 0,05 | 85,22 | 8,05 | 75,71 | 0,2239 | 0,0855 | |||
| PCAR / PACCAR Inc | 0,08 | 8,04 | 0,2236 | 0,2236 | |||||
| EYE / National Vision Holdings, Inc. | 0,33 | -31,33 | 7,49 | 23,65 | 0,2083 | 0,0253 | |||
| IBM / International Business Machines Corporation | 0,02 | -27,95 | 7,13 | -14,59 | 0,1982 | -0,0538 | |||
| THG / The Hanover Insurance Group, Inc. | 0,04 | 0,03 | 6,72 | -2,33 | 0,1867 | -0,0209 | |||
| FUN / Six Flags Entertainment Corporation | 0,21 | -4,12 | 6,51 | -18,21 | 0,1810 | -0,0593 | |||
| PNW / Pinnacle West Capital Corporation | 0,07 | -40,52 | 6,29 | -44,13 | 0,1749 | -0,1651 | |||
| COO / The Cooper Companies, Inc. | 0,09 | -20,16 | 6,29 | -32,65 | 0,1748 | -0,1071 | |||
| OMF / OneMain Holdings, Inc. | 0,10 | -0,42 | 5,58 | 16,12 | 0,1553 | 0,0101 | |||
| FCX / Freeport-McMoRan Inc. | 0,12 | 9,82 | 5,13 | 25,76 | 0,1427 | 0,0195 | |||
| PKG / Packaging Corporation of America | 0,03 | 4,89 | 0,1360 | 0,1360 | |||||
| STX / Seagate Technology Holdings plc | 0,03 | 4,54 | 0,1263 | 0,1263 | |||||
| GOOG / Alphabet Inc. | 0,02 | 4,22 | 0,1172 | 0,1172 | |||||
| CTRA / Coterra Energy Inc. | 0,14 | 3,47 | 0,0965 | 0,0965 | |||||
| ATMU / Atmus Filtration Technologies Inc. | 0,05 | 1,90 | 0,0527 | 0,0527 | |||||
| CVX / Chevron Corporation | 0,01 | -21,13 | 1,21 | -32,50 | 0,0337 | -0,0205 | |||
| ALK / Alaska Air Group, Inc. | 0,02 | 1,11 | 0,0310 | 0,0310 | |||||
| LUV / Southwest Airlines Co. | 0,03 | 0,84 | 0,0233 | 0,0233 | |||||
| HP / Helmerich & Payne, Inc. | 0,02 | -4,08 | 0,33 | -44,30 | 0,0092 | -0,0088 | |||
| SM / SM Energy Company | 0,00 | -100,00 | 0,00 | 0,0000 | |||||
| CC / The Chemours Company | 0,00 | -100,00 | 0,00 | 0,0000 | |||||
| EPAM / EPAM Systems, Inc. | 0,00 | -100,00 | 0,00 | 0,0000 | |||||
| EL / The Estée Lauder Companies Inc. | 0,00 | -100,00 | 0,00 | 0,0000 | |||||
| UPS / United Parcel Service, Inc. | 0,00 | -100,00 | 0,00 | 0,0000 | |||||
| EW / Edwards Lifesciences Corporation | 0,00 | -100,00 | 0,00 | 0,0000 | |||||
| TMUS / T-Mobile US, Inc. | 0,00 | -100,00 | 0,00 | 0,0000 | |||||
| HWM / Howmet Aerospace Inc. | 0,00 | -100,00 | 0,00 | 0,0000 | |||||
| FORM / FormFactor, Inc. | 0,00 | -100,00 | 0,00 | 0,0000 | |||||
| AVY / Avery Dennison Corporation | 0,00 | -100,00 | 0,00 | 0,0000 | |||||
| PWP / Perella Weinberg Partners | 0,00 | -100,00 | 0,00 | 0,0000 | |||||
| CWK / Cushman & Wakefield plc | 0,00 | -100,00 | 0,00 | 0,0000 | |||||
| HI / Hillenbrand, Inc. | 0,00 | -100,00 | 0,00 | 0,0000 |