Grundlæggende statistik
| Institutionelle aktier (lange) | 147.643.040 - 72,22% (ex 13D/G) - change of -26,66MM shares -15,29% MRQ |
| Institutionel værdi (lang) | $ 8.947.311 USD ($1000) |
Institutionelt ejerskab og aktionærer
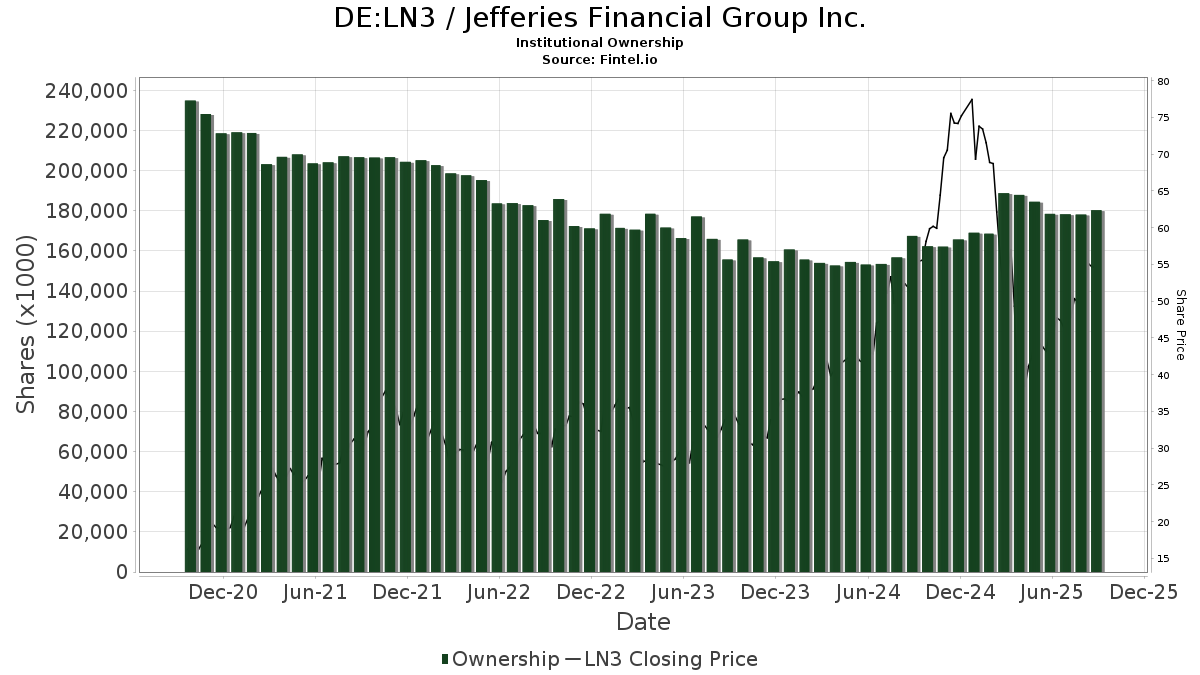
Jefferies Financial Group Inc. (DE:LN3) har 591 institutionelle ejere og aktionærer, der har indsendt 13D/G- eller 13F-formularer til Securities Exchange Commission (SEC). Disse institutioner har i alt 147,643,040 aktier. Største aktionærer omfatter BlackRock, Inc., Vanguard Group Inc, Sumitomo Mitsui Financial Group, Inc., Allspring Global Investments Holdings, LLC, Alliancebernstein L.p., State Street Corp, Massachusetts Mutual Life Insurance Co, Alyeska Investment Group, L.P., Eminence Capital, Lp, and Aqr Capital Management Llc .
Jefferies Financial Group Inc. (DB:LN3) institutionel ejerskabsstruktur viser aktuelle positioner i virksomheden efter institutioner og fonde, samt seneste ændringer i positionsstørrelse. Større aktionærer kan omfatte individuelle investorer, investeringsforeninger, hedgefonde eller institutioner. Skema 13D angiver, at investoren besidder (eller besidder) mere end 5 % af virksomheden og har til hensigt (eller har til hensigt at) aktivt at forfølge en ændring i forretningsstrategi. Skema 13G indikerer en passiv investering på over 5%.
The share price as of April 23, 2026 is 39,75 / share. Previously, on April 28, 2025, the share price was 40,89 / share. This represents a decline of 2,79% over that period.
Fondens stemningsscore
Fund Sentiment Score (fka Ownership Accumulation Score) finder de aktier, der bliver mest købt af fonde. Det er resultatet af en sofistikeret, multi-faktor kvantitativ model, der identificerer virksomheder med de højeste niveauer af institutionel akkumulering. Scoringsmodellen bruger en kombination af den samlede stigning i oplyste ejere, ændringerne i porteføljeallokeringer i disse ejere og andre målinger. Tallet går fra 0 til 100, hvor højere tal indikerer et højere niveau af akkumulering for sine jævnaldrende, og 50 er gennemsnittet.
Opdateringsfrekvens: Dagligt
Se Ownership Explorer, som giver en liste over højest rangerende virksomheder.
AI+ Ask Fintel’s AI assistant about Jefferies Financial Group Inc..
Select a question to share a public post with an AI-crafted answer.
Thinking of good questions…
13F og NPORT arkivering
Detaljer om 13F-arkivering er gratis. Detaljer om NP-ansøgninger kræver et premium-medlemskab. Grønne rækker angiver nye positioner. Røde rækker angiver lukkede positioner. Klik på linket ikon for at se den fulde transaktionshistorik.
Opgrader
for at låse premium-data op og eksportere til Excel ![]() .
.
Important Note
In an effort to reduce load times for our mobile users, we are testing some ways to deliver lighter pages.
In this first test, we will deliver only the most recent 750 transactions (out of 801 for this stock). If you are interested in loading *all* the transactions for this company, click the "load all" button below. This is just a test and if you don't like it, please let us know by submitting some gentle feedback via the link at the bottom of this page.
Load All| Fil dato | Kilde | Investor | Type | Gennemsnitlig pris (Øst) |
Aktier | Δ Aktier (%) |
Rapporteret Værdi ($1000) |
Δ Værdi (%) |
Port Alloc (%) |
|
|---|---|---|---|---|---|---|---|---|---|---|
| 2025-11-07 | 13F | Atticus Wealth Management, Llc | 0 | -100,00 | 0 | -100,00 | ||||
| 2026-02-05 | 13F | ACR Alpine Capital Research, LLC | 95.758 | 79,48 | 5.934 | 70,03 | ||||
| 2026-01-29 | 13F | IMC-Chicago, LLC | 39.339 | -21,15 | 2.438 | -25,31 | ||||
| 2026-01-29 | 13F | IMC-Chicago, LLC | Put | 167.100 | 35,74 | 10.355 | 28,59 | |||
| 2026-01-29 | 13F | IMC-Chicago, LLC | Call | 180.800 | 77,60 | 11.204 | 68,25 | |||
| 2026-02-17 | 13F | Dean Investment Associates, Llc | 55.962 | 23,51 | 3.468 | 16,97 | ||||
| 2026-04-13 | 13F | JCIC Asset Management Inc. | 240 | 0,00 | 10 | -35,71 | ||||
| 2026-02-17 | 13F | ExodusPoint Capital Management, LP | 0 | -100,00 | 0 | -100,00 | ||||
| 2026-02-17 | 13F | Oxford Asset Management Llp | 0 | -100,00 | 0 | -100,00 | ||||
| 2026-02-05 | 13F | Thrivent Financial For Lutherans | 41.367 | -1,79 | 3 | 0,00 | ||||
| 2026-04-16 | 13F | Beese Fulmer Investment Management, Inc. | 0 | -100,00 | 0 | |||||
| 2026-02-11 | 13F | Deutsche Bank Ag\ | 954.291 | 51,53 | 59.137 | 43,54 | ||||
| 2026-02-03 | 13F | Sequoia Financial Advisors, LLC | 176.605 | 3,29 | 10.944 | -2,15 | ||||
| 2026-04-24 | 13F | Oakworth Capital, Inc. | 1.431 | 0,00 | 59 | -32,95 | ||||
| 2026-02-11 | 13F | Prestige Wealth Management Group LLC | 15 | 0,00 | 1 | |||||
| 2026-02-06 | 13F | Leonteq Securities AG | 2.431 | 151 | ||||||
| 2026-02-17 | 13F | Voleon Capital Management Lp | 16.617 | 44,51 | 1.030 | 36,84 | ||||
| 2026-02-13 | 13F | Ubs Asset Management Americas Inc | 411.175 | 2,88 | 25.481 | -2,54 | ||||
| 2026-01-29 | 13F | State Of Michigan Retirement System | 39.016 | -0,76 | 2.418 | -6,03 | ||||
| 2025-11-13 | 13F | Roberts Capital Advisors, LLC | 0 | -100,00 | 0 | |||||
| 2026-03-20 | 13F | Purpose Unlimited Inc. | 850 | 53 | ||||||
| 2026-04-24 | 13F | Strs Ohio | 3.662 | -0,16 | 151 | -33,48 | ||||
| 2026-02-17 | 13F | Parallax Volatility Advisers, L.P. | Put | 112.200 | -1,32 | 6.953 | -6,52 | |||
| 2026-02-05 | 13F | Stephens Inc /ar/ | 0 | -100,00 | 0 | |||||
| 2026-02-13 | 13F | Bay Colony Advisory Group, Inc d/b/a Bay Colony Advisors | 0 | -100,00 | 0 | |||||
| 2026-02-03 | 13F | NewEdge Wealth, LLC | 924.615 | 1,63 | 57.298 | 16,78 | ||||
| 2026-02-17 | 13F | Russell Investments Group, Ltd. | 500.965 | 52,31 | 31.045 | 44,27 | ||||
| 2026-02-17 | 13F | Warren Averett Asset Management, LLC | 8.510 | 135,28 | 527 | 123,31 | ||||
| 2025-11-14 | 13F | Infrastructure Capital Advisors, Llc | 0 | -100,00 | 0 | |||||
| 2026-02-17 | 13F | Parallax Volatility Advisers, L.P. | Call | 33.700 | 0,00 | 2.088 | -5,26 | |||
| 2026-01-07 | 13F | Harbour Capital Advisors, LLC | 0 | -100,00 | 0 | |||||
| 2026-02-17 | 13F | Gotham Asset Management, LLC | 21.479 | 0,32 | 1.331 | -4,93 | ||||
| 2026-02-04 | 13F | Swiss Life Asset Management Ltd | 7.287 | 1,00 | 452 | -4,45 | ||||
| 2026-02-12 | 13F | ROSS\JOHNSON & Associates LLC | 2 | 0,00 | 0 | |||||
| 2026-02-12 | 13F | Federated Hermes, Inc. | 968.551 | -34,65 | 60.021 | -38,09 | ||||
| 2026-01-23 | 13F | Carnegie Capital Asset Management, LLC | 9.257 | -7,15 | 574 | -12,12 | ||||
| 2026-02-05 | 13F | Amalgamated Bank | 73.380 | -3,21 | 5 | 0,00 | ||||
| 2026-04-23 | 13F | Simmons Bank | 0 | -100,00 | 0 | |||||
| 2026-02-12 | 13F | Loomis Sayles & Co L P | 349.783 | -12,92 | 21.676 | -17,51 | ||||
| 2026-02-12 | 13F | JPL Wealth Management, LLC | 0 | -100,00 | 0 | |||||
| 2026-02-02 | 13F | Equitable Trust Co | 10.365 | 0,00 | 642 | -5,31 | ||||
| 2026-02-09 | 13F | Fisher Asset Management, LLC | 2.115.316 | -0,01 | 131.086 | -5,28 | ||||
| 2026-02-05 | 13F | Cambridge Investment Research Advisors, Inc. | 6.107 | 8,53 | 0 | |||||
| 2026-02-17 | 13F | Captrust Financial Advisors | 348.333 | 5,37 | 21.586 | -0,18 | ||||
| 2026-02-17 | 13F | Shelton Capital Management | 5.447 | -6,57 | 338 | -11,55 | ||||
| 2025-10-28 | 13F | Arlington Trust Co LLC | 0 | -100,00 | 0 | |||||
| 2026-02-05 | 13F | Td Private Client Wealth Llc | 1.359 | -2,51 | 84 | -7,69 | ||||
| 2026-01-07 | 13F | Covea Finance | 0 | -100,00 | 0 | |||||
| 2026-02-11 | 13F | Franklin Resources Inc | 128.011 | -46,76 | 7.933 | -49,57 | ||||
| 2026-01-28 | 13F | Klp Kapitalforvaltning As | 33.100 | 2,48 | 2.051 | -2,93 | ||||
| 2026-02-10 | 13F | Nomura Asset Management Co Ltd | 1.520 | 0,00 | 94 | -5,05 | ||||
| 2026-01-20 | 13F | Nvwm, Llc | 500 | 31 | ||||||
| 2026-02-12 | 13F | Summit Financial, LLC | 22.111 | -0,88 | 1.370 | -6,10 | ||||
| 2026-04-23 | 13F | S.E.E.D. Planning Group LLC | 6.000 | 248 | ||||||
| 2026-02-12 | 13F | EntryPoint Capital, LLC | 13.641 | 79,53 | 845 | 70,02 | ||||
| 2026-02-17 | 13F | Canada Pension Plan Investment Board | 6.800 | 421 | ||||||
| 2026-01-28 | 13F | Quent Long Short Global Small Cap Fund, LP | 5.994 | 371 | ||||||
| 2026-02-17 | 13F | Longaeva Partners L.P. | 40.617 | 2.517 | ||||||
| 2026-01-26 | 13F | PFG Investments, LLC | 5.962 | 0,54 | 369 | -4,65 | ||||
| 2026-02-13 | 13F | Searle & Co. | 0 | -100,00 | 0 | |||||
| 2026-02-17 | 13F | Jones Financial Companies Lllp | 1.409 | 110,30 | 87 | 97,73 | ||||
| 2026-01-30 | 13F | Mitsubishi UFJ Trust & Banking Corp | 28.090 | 816,78 | 1.741 | 770,00 | ||||
| 2026-04-16 | 13F | Capital Advisors, Ltd. LLC | 4 | 100,00 | 0 | |||||
| 2026-01-30 | 13F | Levin Capital Strategies, L.p. | 4.000 | 248 | ||||||
| 2026-02-09 | 13F | Arnhold LLC | 8.000 | 0,00 | 496 | -5,35 | ||||
| 2026-02-13 | 13F | Blueshift Asset Management, LLC | 15.006 | 930 | ||||||
| 2026-02-12 | 13F | Brown Brothers Harriman & Co | 37 | -65,09 | 2 | -66,67 | ||||
| 2026-02-17 | 13F | Wiley Bros.-aintree Capital, Llc | 6.737 | -64,67 | 417 | -66,59 | ||||
| 2026-04-20 | 13F | Hilton Head Capital Partners, LLC | 15 | 0,00 | 1 | |||||
| 2026-01-27 | 13F | WealthCollab, LLC | 57 | 0,00 | 4 | 0,00 | ||||
| 2026-02-04 | 13F | Oregon Public Employees Retirement Fund | 32.787 | -1,21 | 2.032 | -6,45 | ||||
| 2026-02-17 | 13F | Nomura Holdings Inc | Put | 149.900 | 9.289 | |||||
| 2026-01-21 | 13F | Greenleaf Trust | 6.049 | 1,02 | 375 | -4,35 | ||||
| 2026-02-11 | 13F | Harvest Fund Management Co., Ltd | 0 | -100,00 | 0 | |||||
| 2026-02-13 | 13F | Victory Capital Management Inc | 698.492 | 7,26 | 43.286 | 1,60 | ||||
| 2026-04-10 | 13F | Quaker Wealth Management, LLC | 2 | -60,00 | 0 | |||||
| 2025-11-13 | 13F | Twin Tree Management, LP | Call | 0 | -100,00 | 0 | -100,00 | |||
| 2025-11-13 | 13F | Twin Tree Management, LP | Put | 0 | -100,00 | 0 | -100,00 | |||
| 2026-04-16 | 13F | Evolve Private Wealth, Llc | 0 | -100,00 | 0 | |||||
| 2026-01-29 | 13F | Rakuten Securities, Inc. | 1 | -90,91 | 0 | |||||
| 2026-02-11 | 13F | Waddell & Associates, Llc | 5.581 | 346 | ||||||
| 2026-04-14 | 13F | Davidson Capital Management Inc. | 0 | -100,00 | 0 | |||||
| 2026-02-12 | 13F | California Public Employees Retirement System | 282.893 | -3,92 | 17.531 | -8,99 | ||||
| 2025-11-14 | 13F | Interval Partners, LP | Call | 0 | -100,00 | 0 | -100,00 | |||
| 2025-11-14 | 13F | Mount Yale Investment Advisors, LLC | 0 | -100,00 | 0 | |||||
| 2026-01-30 | 13F | R Squared Ltd | 5.427 | 66,73 | 336 | 58,49 | ||||
| 2026-01-30 | 13F | Wealth High Governance Capital Ltda | 0 | -100,00 | 0 | -100,00 | ||||
| 2026-04-10 | 13F | Oak Thistle LLC | 96.252 | 3.972 | ||||||
| 2026-02-17 | 13F | Private Capital Management, LLC | 419.429 | 0,19 | 25.992 | -5,10 | ||||
| 2025-10-30 | 13F | Twin Peaks Wealth Advisors, LLC | 0 | -100,00 | 0 | |||||
| 2026-02-17 | 13F | Guggenheim Capital Llc | 3.719 | 230 | ||||||
| 2025-11-19 | 13F | Caitong International Asset Management Co., Ltd | 0 | -100,00 | 0 | |||||
| 2026-04-20 | 13F | Assenagon Asset Management S.A. | 1.094.164 | 740,07 | 45.156 | 459,48 | ||||
| 2026-01-21 | 13F | Albion Financial Group /ut | 1.260 | 0,00 | 78 | -4,88 | ||||
| 2026-02-13 | 13F | Carronade Capital Management, LP | Call | 0 | -100,00 | 0 | ||||
| 2026-02-09 | 13F | Huntington National Bank | 1.207 | -1,71 | 75 | -7,50 | ||||
| 2025-11-14 | 13F | Balyasny Asset Management Llc | Call | 0 | -100,00 | 0 | -100,00 | |||
| 2026-04-10 | 13F | Armstrong Advisory Group, Inc | 50 | 0,00 | 2 | -33,33 | ||||
| 2026-04-16 | 13F | TB Alternative Assets Ltd. | 0 | -100,00 | 0 | |||||
| 2026-01-02 | 13F | Insight Wealth Strategies, LLC | 0 | -100,00 | 0 | |||||
| 2026-01-27 | 13F | First Horizon Corp | 622 | 68,11 | 39 | 58,33 | ||||
| 2026-02-17 | 13F | Advisor Group Holdings, Inc. | 49.399 | -8,85 | 3.062 | -14,45 | ||||
| 2026-02-17 | 13F | Clear Street Markets Llc | 285 | 18 | ||||||
| 2026-04-15 | 13F | Fortitude Family Office, LLC | 173 | 24,46 | 7 | -12,50 | ||||
| 2026-02-13 | 13F | Carronade Capital Management, LP | Put | 0 | -100,00 | 0 | ||||
| 2026-04-16 | 13F | Whitener Capital Management, Inc. | 5.815 | 3,56 | 240 | -31,12 | ||||
| 2026-02-17 | 13F | Freestone Grove Partners LP | 959.288 | 198,28 | 59.447 | 182,56 | ||||
| 2026-02-12 | 13F | DRW Securities, LLC | 0 | -100,00 | 0 | -100,00 | ||||
| 2026-04-20 | 13F | State of Alaska, Department of Revenue | 16.493 | 0,00 | 1 | -100,00 | ||||
| 2026-02-12 | 13F | Tripletail Wealth Management, LLC | 1.140 | 0,00 | 63 | -8,82 | ||||
| 2026-01-28 | 13F | Universal- Beteiligungs- und Servicegesellschaft mbH | 66.871 | 50,36 | 4.171 | 43,35 | ||||
| 2026-01-23 | 13F | Altfest L J & Co Inc | 30.578 | 1.895 | ||||||
| 2026-02-13 | 13F | Wilkerson Advisory Group LLC | 7.658 | 475 | ||||||
| 2026-02-11 | 13F | Meeder Advisory Services, Inc. | 8.379 | 519 | ||||||
| 2026-04-13 | 13F | Artemis Investment Management LLP | 0 | -100,00 | 0 | |||||
| 2026-01-23 | 13F | Legacy Bridge, LLC | 431 | 0,00 | 27 | -7,14 | ||||
| 2026-02-18 | 13F | Caitlin John, LLC | 62 | 0,00 | 4 | -25,00 | ||||
| 2026-01-29 | 13F | Teachers Retirement System Of The State Of Kentucky | 50.535 | 0,00 | 3 | 0,00 | ||||
| 2026-02-17 | 13F | Price T Rowe Associates Inc /md/ | 134.377 | 5,83 | 8 | 0,00 | ||||
| 2026-01-12 | 13F | Salem Investment Counselors Inc | 0 | -100,00 | 0 | |||||
| 2026-02-05 | 13F | High Note Wealth, LLC | 770 | -4,58 | 48 | -9,62 | ||||
| 2026-02-12 | 13F | Ensign Peak Advisors, Inc | 261.245 | -21,39 | 16.189 | -25,54 | ||||
| 2026-01-29 | 13F | Comerica Bank | 56.173 | -14,54 | 3.481 | -19,03 | ||||
| 2026-02-06 | 13F | Handelsbanken Fonder AB | 47.103 | 14,04 | 3 | 0,00 | ||||
| 2026-02-13 | 13F | Walleye Trading LLC | Put | 22.100 | -34,42 | 1.370 | -37,89 | |||
| 2026-02-13 | 13F | Walleye Trading LLC | Call | 30.700 | 448,21 | 1.902 | 419,67 | |||
| 2026-02-13 | 13F | Parkside Financial Bank & Trust | 672 | 50,00 | 42 | 41,38 | ||||
| 2026-02-13 | 13F | Public Employees Retirement Association Of Colorado | 12.896 | 0,00 | 1 | |||||
| 2026-02-13 | 13F | Walleye Trading LLC | 40.004 | 25,86 | 2.479 | 19,24 | ||||
| 2026-02-17 | 13F | Susquehanna Portfolio Strategies, LLC | 82.700 | -16,44 | 5.125 | -20,85 | ||||
| 2026-02-17 | 13F | Shay Capital LLC | 9.000 | 28,57 | 558 | 21,88 | ||||
| 2026-02-18 | 13F | State of Tennessee, Treasury Department | 61.714 | -4,11 | 3.776 | -10,33 | ||||
| 2026-02-17 | 13F | Farringdon Capital, Ltd. | 0 | -100,00 | 0 | |||||
| 2026-02-13 | 13F | Marshall Wace, Llp | 678.550 | 42.050 | ||||||
| 2026-02-13 | 13F | Manufacturers Life Insurance Company, The | 0 | -100,00 | 0 | |||||
| 2026-02-17 | 13F | Signature Equity Partners, LLC | 263 | 16 | ||||||
| 2026-02-17 | 13F | Lazard Asset Management Llc | 3.337 | 207 | ||||||
| 2026-02-13 | 13F | Smartleaf Asset Management LLC | 1.330 | -2,49 | 83 | -7,78 | ||||
| 2026-02-17 | 13F | Mercer Global Advisors Inc /adv | 185.791 | 593,90 | 11.513 | 557,51 | ||||
| 2025-11-13 | 13F | Arrowstreet Capital, Limited Partnership | 0 | -100,00 | 0 | |||||
| 2026-04-22 | 13F | 1492 Capital Management LLC | 107.773 | 13,48 | 4.448 | -24,44 | ||||
| 2026-04-23 | 13F | Farmers & Merchants Investments Inc | 146 | 0,00 | 6 | -33,33 | ||||
| 2026-02-10 | 13F | Axq Capital, Lp | 0 | -100,00 | 0 | |||||
| 2026-02-05 | 13F | Northwestern Mutual Investment Management Company, Llc | 36.922 | 0,38 | 2.288 | -4,90 | ||||
| 2026-02-11 | 13F | O'shaughnessy Asset Management, Llc | 27.198 | -11,21 | 1.685 | -15,88 | ||||
| 2026-02-17 | 13F | Maryland State Retirement & Pension System | 8.158 | 0,00 | 506 | -5,25 | ||||
| 2026-04-17 | 13F | Blankinship & Foster, LLC | 0 | -100,00 | 0 | |||||
| 2026-02-04 | 13F | Virginia Retirement Systems Et Al | 37.750 | 2.339 | ||||||
| 2026-02-17 | 13F | Sender Co & Partners, Inc. | Call | 0 | -100,00 | 0 | ||||
| 2026-01-12 | 13F | Daymark Wealth Partners, Llc | 6.382 | 5,56 | 396 | 0,00 | ||||
| 2026-02-17 | 13F | Sender Co & Partners, Inc. | 0 | -100,00 | 0 | |||||
| 2026-02-13 | 13F | JustInvest LLC | 22.451 | -5,77 | 1.391 | -10,78 | ||||
| 2026-04-10 | 13F | Country Trust Bank | 132 | 73,68 | 5 | 25,00 | ||||
| 2026-04-13 | 13F | Hm Payson & Co | 1.500 | -34,44 | 62 | -56,74 | ||||
| 2026-02-24 | 13F | MidFirst Bank | 100 | 6 | ||||||
| 2026-01-08 | 13F | Thoma Capital Management LLC | 0 | -100,00 | 0 | |||||
| 2026-02-13 | 13F | Bridgefront Capital, LLC | 6.070 | 22,03 | 376 | 15,69 | ||||
| 2026-02-09 | 13F | Wellington Shields Capital Management, LLC | 28.900 | 0,00 | 1.791 | -5,29 | ||||
| 2026-02-09 | 13F | Coldstream Capital Management Inc | 14.823 | 11,78 | 919 | 5,88 | ||||
| 2026-04-14 | 13F | Banque Pictet & Cie Sa | 4.914 | -64,30 | 203 | -76,29 | ||||
| 2026-04-20 | 13F | Jfs Wealth Advisors, Llc | 254 | 3,25 | 10 | -33,33 | ||||
| 2026-04-23 | 13F | Marquette Asset Management, LLC | 68 | 3 | ||||||
| 2026-02-13 | 13F | Valueworks Llc | 251.259 | 15.571 | ||||||
| 2026-02-17 | 13F | Capitolis Liquid Global Markets LLC | 153.000 | 9.481 | ||||||
| 2026-02-17 | 13F | Magnetar Financial LLC | 19.927 | 1.235 | ||||||
| 2026-02-13 | 13F | Great West Life Assurance Co /can/ | 95.286 | -28,91 | 6 | -37,50 | ||||
| 2026-02-17 | 13F | Advisor Group Holdings, Inc. | Call | 5 | 0,00 | 11 | -8,33 | |||
| 2026-02-10 | 13F | BW Gestao de Investimentos Ltda. | 0 | -100,00 | 0 | |||||
| 2026-02-10 | 13F | Norges Bank | 2.349.258 | 145.584 | ||||||
| 2026-02-06 | 13F | Larson Financial Group LLC | 361 | -0,82 | 22 | -4,35 | ||||
| 2026-02-11 | 13F | Picton Mahoney Asset Management | 62.809 | 3.892 | ||||||
| 2026-02-13 | 13F | BNP Paribas Asset Management Holding S.A. | 2.223 | 43,05 | 0 | |||||
| 2026-04-20 | 13F | Miller Howard Investments Inc /ny | 11.843 | -58,60 | 489 | -72,46 | ||||
| 2026-04-10 | 13F | Perigon Wealth Management, LLC | 0 | -100,00 | 0 | |||||
| 2025-11-14 | 13F | Strategic Wealth Partners, Ltd. | 196.390 | 12.848 | ||||||
| 2025-11-13 | 13F | Fuller & Thaler Asset Management, Inc. | 0 | -100,00 | 0 | |||||
| 2026-02-11 | 13F | Brandywine Global Investment Management, LLC | 0 | -100,00 | 0 | |||||
| 2026-02-10 | 13F | Principia Wealth Advisory, LLC | 10 | 11,11 | 1 | |||||
| 2026-02-13 | 13F | Pitcairn Wealth Advisors LLC | 10.499 | 651 | ||||||
| 2026-04-15 | 13F | Financial Management Professionals, Inc. | 12 | 0,00 | 0 | |||||
| 2026-02-03 | 13F | Costello Asset Management, INC | 0 | -100,00 | 0 | |||||
| 2026-02-04 | 13F | Catalyst Financial Partners Llc | 14.367 | -0,02 | 890 | -5,32 | ||||
| 2026-01-16 | 13F | FNY Investment Advisers, LLC | Call | 0 | -100,00 | 0 | ||||
| 2026-02-13 | 13F | Intrepid Capital Management Inc | 36.012 | 0,00 | 2.232 | -5,27 | ||||
| 2026-02-04 | 13F | HighPoint Advisor Group LLC | 7.244 | -5,90 | 449 | -10,93 | ||||
| 2026-02-03 | 13F | American Assets Investment Management, LLC | 100.000 | 0,00 | 6.197 | -5,27 | ||||
| 2026-02-13 | 13F | Quarry LP | 0 | -100,00 | 0 | |||||
| 2026-02-17 | 13F | Toronto Dominion Bank | 3 | 0 | ||||||
| 2026-02-18 | 13F | GWM Advisors LLC | 0 | -100,00 | 0 | |||||
| 2026-02-03 | 13F | Crossmark Global Holdings, Inc. | 11.503 | -4,73 | 713 | -9,76 | ||||
| 2026-04-21 | 13F | Vise Technologies, Inc. | 6.084 | 0,00 | 377 | 0,00 | ||||
| 2026-02-13 | 13F | Walleye Capital LLC | Put | 10.000 | 78,57 | 620 | 69,13 | |||
| 2026-02-13 | 13F | Walleye Capital LLC | 63.166 | 3.914 | ||||||
| 2026-02-17 | 13F | Brevan Howard Capital Management LP | 85.508 | 2.151,40 | 5.303 | 2.037,90 | ||||
| 2026-02-13 | 13F | Walleye Capital LLC | Call | 6.400 | 156,00 | 397 | 142,94 | |||
| 2026-02-13 | 13F | Rhumbline Advisers | 424.335 | -0,57 | 26.296 | -5,82 | ||||
| 2026-02-06 | 13F | Pnc Financial Services Group, Inc. | 74.161 | 0,10 | 4.596 | -5,18 | ||||
| 2026-04-21 | 13F | Financial Consulate, Inc | 13 | 1 | ||||||
| 2026-04-24 | 13F | Boston Trust Walden Corp | 7.500 | 0,00 | 310 | -33,41 | ||||
| 2026-02-10 | 13F | Envestnet Asset Management Inc | 124.024 | -49,64 | 7.686 | -52,30 | ||||
| 2026-02-12 | 13F | State Board Of Administration Of Florida Retirement System | 155.157 | -13,35 | 9.615 | -17,92 | ||||
| 2026-04-20 | 13F | Ritholtz Wealth Management | 0 | -100,00 | 0 | |||||
| 2025-11-14 | 13F | Wolverine Trading, Llc | Call | 118.100 | 39,76 | 7.873 | 67,13 | |||
| 2025-11-14 | 13F | Wolverine Trading, Llc | Put | 44.900 | -30,92 | 2.993 | -17,39 | |||
| 2026-02-17 | 13F | DV Trading LLC | 1.000 | 62 | ||||||
| 2026-01-28 | 13F | Teacher Retirement System Of Texas | 5.118 | -74,75 | 317 | -76,08 | ||||
| 2026-02-11 | 13F | Havemeyer Place LP | 7.423 | 460 | ||||||
| 2026-02-17 | 13F | Credit Agricole S A | 45.000 | 2.789 | ||||||
| 2026-01-12 | 13F | Rialto Wealth Management, LLC | 27 | 8,00 | 2 | 0,00 | ||||
| 2026-02-05 | 13F | AlphaCore Capital LLC | 43.094 | 4,49 | 2.671 | -1,04 | ||||
| 2025-11-14 | 13F | Point72 (DIFC) Ltd | 9.106 | -32,04 | 596 | -18,72 | ||||
| 2026-02-11 | 13F | Vestor Capital, Llc | 819 | -82,37 | 0 | |||||
| 2026-04-14 | 13F | Nbc Securities, Inc. | 21.915 | -0,01 | 904 | -33,43 | ||||
| 2026-02-03 | 13F | Ethic Inc. | 7.838 | -8,08 | 486 | -12,93 | ||||
| 2026-02-17 | 13F | Jump Financial, LLC | 159.200 | 9.866 | ||||||
| 2026-02-11 | 13F | Tiaa Trust, National Association | 23.266 | 0,58 | 1.442 | -4,76 | ||||
| 2026-02-10 | 13F | Daiwa Securities Group Inc. | 11.626 | 58,67 | 1 | |||||
| 2026-02-06 | 13F | Abn Amro Investment Solutions | 0 | -100,00 | 0 | |||||
| 2026-02-11 | 13F | Barrow Hanley Mewhinney & Strauss Llc | 1.755.057 | -12,02 | 108.761 | -16,66 | ||||
| 2026-02-17 | 13F | D. E. Shaw & Co., Inc. | 1.107.070 | 1.246,11 | 68.605 | 1.175,19 | ||||
| 2026-02-17 | 13F | Brown Financial Advisors | 9.707 | 602 | ||||||
| 2026-02-10 | 13F | Moors & Cabot, Inc. | 30.400 | -15,96 | 1.884 | -20,41 | ||||
| 2026-02-11 | 13F | BI Asset Management Fondsmaeglerselskab A/S | 0 | -100,00 | 0 | |||||
| 2026-02-17 | 13F | D. E. Shaw & Co., Inc. | Put | 49.500 | 0,00 | 3.068 | -5,28 | |||
| 2026-02-17 | 13F | D. E. Shaw & Co., Inc. | Call | 152.000 | 43,26 | 9.419 | 35,70 | |||
| 2026-02-13 | 13F | Colony Group, LLC | 182.502 | 13,05 | 11.310 | 7,09 | ||||
| 2026-02-04 | 13F | Tsfg, Llc | 205 | 0,00 | 0 | |||||
| 2026-01-12 | 13F | CVA Family Office, LLC | 12 | 0,00 | 1 | |||||
| 2026-04-22 | 13F | Joel Isaacson & Co., LLC | 19.878 | 0,21 | 820 | -33,28 | ||||
| 2026-02-17 | 13F | Mirabella Financial Services Llp | 6.258 | 388 | ||||||
| 2026-04-14 | 13F | Beacon Investment Advisory Services, Inc. | 18.957 | -89,08 | 782 | -92,73 | ||||
| 2026-01-30 | 13F | Rachor Investment Advisory Services, LLC | 13 | 1 | ||||||
| 2026-02-12 | 13F | Insigneo Advisory Services, Llc | 4.832 | -15,08 | 299 | -19,62 | ||||
| 2026-01-30 | 13F | State of New Jersey Common Pension Fund D | 52.322 | 3,32 | 3.242 | -2,14 | ||||
| 2026-02-04 | 13F | Arena Capital Advisors, LLC- CA | 15.000 | 930 | ||||||
| 2025-11-14 | 13F | Twinbeech Capital Lp | 0 | -100,00 | 0 | |||||
| 2026-02-13 | 13F | Alyeska Investment Group, L.P. | 3.972.352 | 422,01 | 246.167 | 394,48 | ||||
| 2026-02-11 | 13F | Zions Bancorporation, National Association /ut/ | 10 | 1 | ||||||
| 2026-02-17 | 13F | First Pacific Advisors, LP | 2.580.283 | 0,00 | 159.900 | -5,27 | ||||
| 2026-02-17 | 13F | Creative Planning | 87.261 | 60,80 | 5.408 | 52,31 | ||||
| 2025-11-12 | 13F | NewSquare Capital LLC | 0 | -100,00 | 0 | -100,00 | ||||
| 2026-02-11 | 13F | Buckingham Strategic Partners | 17.076 | 103,33 | 1.058 | 118,60 | ||||
| 2026-02-04 | 13F | Nicholas Company, Inc. | 0 | -100,00 | 0 | |||||
| 2026-02-13 | 13F | Bridgewater Associates, LP | 23.848 | 1.478 | ||||||
| 2026-02-17 | 13F | Limestone Investment Advisors LP | Call | 9.600 | 595 | |||||
| 2026-01-28 | 13F | Migdal Insurance & Financial Holdings Ltd. | 398.000 | -50,13 | 25 | -53,85 | ||||
| 2026-02-17 | 13F | Limestone Investment Advisors LP | Put | 1.200 | 74 | |||||
| 2026-02-13 | 13F | National Bank Of Canada /fi/ | 13.141 | -2,39 | 815 | -7,50 | ||||
| 2026-02-13 | 13F | MAI Capital Management | Call | 12 | -7,69 | |||||
| 2026-02-12 | 13F | Moerus Capital Management LLC | 609.721 | -10,31 | 37.784 | -15,04 | ||||
| 2026-02-11 | 13F | Jpmorgan Chase & Co | Call | 0 | -100,00 | 0 | -100,00 | |||
| 2026-02-11 | 13F | Jpmorgan Chase & Co | Put | 0 | -100,00 | 0 | -100,00 | |||
| 2026-02-13 | 13F | Neuberger Berman Group LLC | 26.799 | 1,30 | 1.661 | -4,05 | ||||
| 2026-02-19 | 13F | Invesco Ltd. | 349.958 | -29,77 | 21.687 | -33,48 | ||||
| 2026-02-13 | 13F | MAI Capital Management | 245 | 8,89 | 15 | 7,14 | ||||
| 2026-01-14 | 13F | ORG Partners LLC | 35 | 0,00 | 2 | 0,00 | ||||
| 2026-02-13 | 13F | Dynamic Technology Lab Private Ltd | 11.019 | -49,89 | 683 | -52,54 | ||||
| 2026-02-02 | 13F | Danske Bank A/s | 1.900 | 0,00 | 118 | -5,65 | ||||
| 2026-04-15 | 13F | Merit Financial Group, LLC | 17.040 | 3,45 | 703 | -31,08 | ||||
| 2026-02-06 | 13F | Tortoise Investment Management, LLC | 0 | -100,00 | 0 | |||||
| 2026-02-13 | 13F | Chou Associates Management Inc. | 10.987 | 0,00 | 681 | -5,29 | ||||
| 2025-11-14 | 13F | Natixis | 0 | -100,00 | 0 | -100,00 | ||||
| 2026-02-13 | 13F | Wells Fargo & Company/mn | 196.328 | -46,20 | 12.166 | -49,04 | ||||
| 2026-04-20 | 13F | MBM Wealth Consultants, LLC | 32.353 | 20,95 | 1.335 | -19,43 | ||||
| 2026-02-13 | 13F | Entropy Technologies, LP | 27.118 | 136,14 | 1.681 | 123,70 | ||||
| 2025-11-12 | 13F | Allianz Se | 0 | -100,00 | 0 | -100,00 | ||||
| 2026-04-17 | 13F | Krilogy Financial LLC | 0 | -100,00 | 0 | |||||
| 2026-02-13 | 13F | Toroso Investments, LLC | 11.860 | 111,48 | 735 | 100,55 | ||||
| 2026-02-03 | 13F | Mitsubishi UFJ Kokusai Asset Management Co., Ltd. | 395 | 0,00 | 25 | 0,00 | ||||
| 2026-01-29 | 13F | UBS Group AG | Put | 80.000 | 128,57 | 4.958 | 116,56 | |||
| 2026-01-29 | 13F | UBS Group AG | 991.817 | -6,58 | 61.463 | -11,51 | ||||
| 2026-02-09 | 13F | Prospera Financial Services Inc | 0 | -100,00 | 0 | |||||
| 2026-02-04 | 13F | Lafayette Investments, Inc. | 137.585 | -0,34 | 8.526 | -5,59 | ||||
| 2026-01-26 | 13F | Cwm, Llc | 108.739 | 1.008,79 | 7 | |||||
| 2026-02-17 | 13F | Altshuler Shaham Ltd | 0 | -100,00 | 0 | |||||
| 2026-02-02 | 13F | New England Capital Financial Advisors LLC | 204 | 0,49 | 13 | -7,69 | ||||
| 2026-02-17 | 13F | Trexquant Investment LP | 41.663 | -86,38 | 2.582 | -87,10 | ||||
| 2026-02-13 | 13F | Mariner, LLC | 148.964 | 190,68 | 9.244 | 175,75 | ||||
| 2026-02-17 | 13F | Man Group plc | 166.585 | 4.064,62 | 10.323 | 3.855,17 | ||||
| 2026-02-09 | 13F | Harbour Investments, Inc. | 1.784 | -60,80 | 111 | -62,96 | ||||
| 2026-02-06 | 13F | ProShare Advisors LLC | 6.618 | -5,70 | 410 | -10,68 | ||||
| 2026-04-24 | 13F | Yousif Capital Management, Llc | 50.388 | -5,20 | 2.080 | -35,97 | ||||
| 2026-04-15 | 13F | Activest Wealth Management | 126 | -59,49 | 5 | -73,68 | ||||
| 2026-02-13 | 13F | Kilter Group LLC | 10 | 0,00 | 1 | |||||
| 2026-02-17 | 13F | Susquehanna Fundamental Investments, Llc | 90.346 | 5.599 | ||||||
| 2026-02-10 | 13F/A | Northwestern Mutual Wealth Management Co | 9.420 | -2,55 | 584 | -7,75 | ||||
| 2025-11-14 | 13F | Point72 Hong Kong Ltd | 18.036 | 1.180 | ||||||
| 2026-02-17 | 13F | Shapiro Capital Management Llc | 0 | -100,00 | 0 | |||||
| 2026-02-11 | 13F | Cerity Partners LLC | 282.934 | 30,06 | 17.533 | 23,20 | ||||
| 2025-11-14 | 13F | Bayesian Capital Management, LP | 0 | -100,00 | 0 | |||||
| 2026-04-20 | 13F | Louisiana State Employees Retirement System | 47.900 | 4,81 | 1.977 | -30,23 | ||||
| 2026-02-13 | 13F | Alerus Financial Na | 448 | -10,04 | 28 | -15,62 | ||||
| 2026-02-06 | 13F | Radnor Capital Management, LLC | 0 | -100,00 | 0 | -100,00 | ||||
| 2026-04-16 | 13F | Paladin Wealth, LLC | 0 | -100,00 | 0 | |||||
| 2026-02-17 | 13F | Eminence Capital, Lp | 3.812.615 | 13,52 | 236.268 | 7,53 | ||||
| 2026-04-22 | 13F | Old Point Trust & Financial Services N A | 2.592 | 0,00 | 107 | -33,75 | ||||
| 2026-02-13 | 13F | Headlands Technologies LLC | 0 | -100,00 | 0 | |||||
| 2026-02-12 | 13F | Colonial Trust Advisors | 20 | 0,00 | 1 | 0,00 | ||||
| 2026-02-12 | 13F | Commonwealth Equity Services, Llc | 41.145 | 16,67 | 2.550 | 127.350,00 | ||||
| 2026-02-13 | 13F | Evelyn Partners Investment Management LLP | 17.596 | -34,20 | 1.090 | -37,68 | ||||
| 2026-02-17 | 13F | Cresset Asset Management, LLC | 24.933 | 2,03 | 1.545 | -3,32 | ||||
| 2026-04-15 | 13F | Bayforest Capital Ltd | 554 | 23 | ||||||
| 2026-04-24 | 13F | Essex Financial Services, Inc. | 4.855 | 3,89 | 200 | -30,80 | ||||
| 2026-02-17 | 13F | Polar Asset Management Partners Inc. | 50.787 | 3.147 | ||||||
| 2026-02-17 | 13F | Schonfeld Strategic Advisors LLC | 78.767 | -46,30 | 4.881 | -49,14 | ||||
| 2026-02-18 | 13F/A | Empowered Funds, LLC | 4.017 | -17,07 | 249 | -21,52 | ||||
| 2025-11-04 | 13F | Guerra Advisors Inc | 30 | 2 | ||||||
| 2026-01-28 | 13F | DekaBank Deutsche Girozentrale | 7.864 | 0,00 | 0 | |||||
| 2026-04-21 | 13F | Hosking Partners LLP | 515.654 | 6,03 | 21.281 | -29,39 | ||||
| 2026-02-17 | 13F | Centennial Bank/AR/ | 14.534 | 0,00 | 901 | -5,26 | ||||
| 2026-02-13 | 13F | Pinnacle Wealth Planning Services, Inc. | 7 | 0 | ||||||
| 2026-02-05 | 13F | New York Life Investment Management Llc | 14.794 | 917 | ||||||
| 2026-02-17 | 13F | Public Employees Retirement System Of Ohio | 46.085 | -3,65 | 2.856 | -8,76 | ||||
| 2026-02-17 | 13F | Teza Capital Management LLC | 3.269 | 203 | ||||||
| 2026-04-23 | 13F | Oppenheimer & Co Inc | 161.541 | -21,75 | 6.667 | -47,89 | ||||
| 2026-04-08 | 13F | M.e. Allison & Co., Inc. | 5.400 | 0,00 | 223 | -33,53 | ||||
| 2026-02-06 | 13F | EverSource Wealth Advisors, LLC | 3.963 | 385,66 | 246 | 362,26 | ||||
| 2026-02-23 | 13F | Beaird Harris Wealth Management, LLC | 5 | -86,84 | 0 | -100,00 | ||||
| 2026-01-29 | 13F | Lee Danner & Bass Inc | 83.811 | -7,95 | 5.194 | -12,81 | ||||
| 2026-02-13 | 13F | Squarepoint Ops LLC | Call | 13.100 | -46,75 | 812 | -49,60 | |||
| 2026-02-13 | 13F | Squarepoint Ops LLC | Put | 11.000 | -29,49 | 682 | -33,24 | |||
| 2026-02-13 | 13F | State Street Corp | 4.761.720 | -1,36 | 295.084 | -6,56 | ||||
| 2026-02-13 | 13F | Squarepoint Ops LLC | 271.568 | 67,92 | 16.829 | 59,06 | ||||
| 2026-04-13 | 13F | Massmutual Trust Co Fsb/adv | 1.152 | -2,95 | 48 | -35,62 | ||||
| 2026-01-23 | 13F | U.S. Capital Wealth Advisors, LLC | 0 | -100,00 | 0 | |||||
| 2026-02-11 | 13F | Deseret Mutual Benefit Administrators | 362 | 0,00 | 22 | -4,35 | ||||
| 2026-04-22 | 13F | Sterling Capital Management LLC | 4.150 | -41,66 | 171 | -61,14 | ||||
| 2026-02-12 | 13F | MetLife Investment Management, LLC | 160.957 | 79,75 | 9.975 | 70,29 | ||||
| 2025-11-06 | 13F | Illinois Municipal Retirement Fund | 0 | -100,00 | 0 | |||||
| 2026-02-11 | 13F | Ameritas Investment Partners, Inc. | 46.399 | 2.875 | ||||||
| 2026-02-19 | 13F | Mcguire Capital Advisors Inc | 20 | 1 | ||||||
| 2026-02-14 | 13F | Copley Financial Group, Inc. | 7.760 | 481 | ||||||
| 2026-02-17 | 13F | Punch & Associates Investment Management, Inc. | 3.685 | -32,94 | 228 | -36,49 | ||||
| 2026-02-17 | 13F | Crawford Fund Management, LLC | Put | 31.700 | 1.964 | |||||
| 2026-04-10 | 13F | MKT Advisors LLC | 5.275 | 0,00 | 222 | -35,00 | ||||
| 2026-02-10 | 13F | Bnp Paribas Arbitrage, Sa | 35.053 | -50,84 | 2.172 | -53,43 | ||||
| 2026-02-10 | 13F | Bnp Paribas Arbitrage, Sa | Put | 1.172 | 7.263 | |||||
| 2026-04-08 | 13F | Wealth Enhancement Trust Services, Inc. | 6 | 0,00 | 0 | |||||
| 2026-02-17 | 13F | Bamco Inc /ny/ | 596.528 | 14,82 | 36.967 | 8,77 | ||||
| 2026-01-23 | 13F | Optima Capital Llc | 10 | 1 | ||||||
| 2026-02-11 | 13F | Los Angeles Capital Management Llc | 682 | 36 | ||||||
| 2026-02-12 | 13F | Swiss National Bank | 305.000 | 1,70 | 18.901 | -3,66 | ||||
| 2025-11-13 | 13F | Renaissance Technologies Llc | 0 | -100,00 | 0 | |||||
| 2026-02-17 | 13F | Northern Trust Corp | 1.417.172 | -2,89 | 87.822 | -8,01 | ||||
| 2026-02-17 | 13F | Fmr Llc | 1.560.292 | 4,10 | 96.691 | -1,39 | ||||
| 2026-01-27 | 13F | Pekao Towarzystwo Funduszy Inwestycyjnych S.A. | 10.607 | 657 | ||||||
| 2026-02-02 | 13F | Fifth Third Bancorp | 2.586 | -4,29 | 160 | -9,09 | ||||
| 2026-02-12 | 13F | Quadrant Capital Group Llc | 16.214 | 2,55 | 1.005 | -2,90 | ||||
| 2026-02-17 | 13F | Aqr Capital Management Llc | 3.412.301 | 696,81 | 211.460 | 654,81 | ||||
| 2026-02-17 | 13F | California State Teachers Retirement System | 146.671 | 0,58 | 9.089 | -4,72 | ||||
| 2025-11-12 | 13F | Monetary Management Group Inc | 0 | -100,00 | 0 | -100,00 | ||||
| 2026-04-13 | 13F | Wolff Wiese Magana Llc | 5 | 0,00 | 0 | |||||
| 2026-02-13 | 13F/A | Ontario Teachers Pension Plan Board | 0 | -100,00 | 0 | |||||
| 2025-11-12 | 13F | Burgundy Asset Management Ltd. | 294.896 | -1,69 | 19.124 | 16,58 | ||||
| 2026-04-22 | 13F | Union Bancaire Privee, UBP SA | 6.444 | 246 | ||||||
| 2026-02-06 | 13F | Check Capital Management Inc/ca | 452.487 | 3.211,53 | 28.041 | 8.916,08 | ||||
| 2026-01-15 | 13F | Allspring Global Investments Holdings, LLC | 7.152.838 | -2,73 | 453.919 | -2,77 | ||||
| 2026-02-17 | 13F | Capital Fund Management S.a. | Put | 55.500 | -40,77 | 3.439 | -43,89 | |||
| 2026-02-10 | 13F | Commonwealth Of Pennsylvania Public School Empls Retrmt Sys | 41.296 | -2,50 | 2.559 | -7,62 | ||||
| 2026-02-12 | 13F | Beck Mack & Oliver Llc | 1.232.297 | -2,76 | 76.365 | -7,89 | ||||
| 2026-02-17 | 13F | Capital Fund Management S.a. | Call | 39.700 | -69,20 | 2.460 | -70,83 | |||
| 2026-04-22 | 13F | Spire Wealth Management | 139 | -72,75 | 6 | -83,87 | ||||
| 2026-02-13 | 13F | Integrated Wealth Concepts LLC | 8.848 | 548 | ||||||
| 2026-02-13 | 13F | Alberta Investment Management Corp | 25.400 | 1.574 | ||||||
| 2026-02-13 | 13F | Y-Intercept (Hong Kong) Ltd | 38.511 | 0,16 | 2.387 | -5,13 | ||||
| 2026-02-17 | 13F | Tudor Investment Corp Et Al | 201.999 | 12.518 | ||||||
| 2026-04-17 | 13F | Webster Bank, N. A. | 55 | 0,00 | 2 | -33,33 | ||||
| 2026-04-22 | 13F | Janney Montgomery Scott LLC | 6.589 | 17,01 | 0 | |||||
| 2026-02-17 | 13F | Tudor Investment Corp Et Al | Put | 24.400 | 1.512 | |||||
| 2026-02-13 | 13F | Massachusetts Mutual Life Insurance Co | 4.654.362 | -0,02 | 288.431 | -5,29 | ||||
| 2026-02-17 | 13F | Tudor Investment Corp Et Al | Call | 7.600 | 471 | |||||
| 2026-04-09 | 13F | Kwmg, Llc | 10.178 | -9,44 | 420 | -39,66 | ||||
| 2026-02-06 | 13F | Covestor Ltd | 2.180 | -1,09 | 0 | |||||
| 2026-04-24 | 13F | Root Financial Partners, LLC | 334 | -24,09 | 14 | -51,85 | ||||
| 2026-02-03 | 13F | Maple Capital Management, Inc. | 6.316 | -2,06 | 391 | -7,13 | ||||
| 2026-02-12 | 13F | Chilton Capital Management Llc | 550 | 0,00 | 34 | -2,86 | ||||
| 2026-02-12 | 13F | Xponance, Inc. | 20.030 | -6,21 | 1.241 | -11,17 | ||||
| 2025-11-14 | 13F | Point72 Europe (London) LLP | 170 | 11 | ||||||
| 2026-02-12 | 13F | Skopos Labs, Inc. | 7.587 | 126,14 | 476 | 116,89 | ||||
| 2026-01-16 | 13F | Crewe Advisors LLC | 7.546 | 0,00 | 468 | -5,27 | ||||
| 2026-03-04 | 13F | SHP Wealth Management | 49 | 3 | ||||||
| 2026-02-13 | 13F | Police & Firemen's Retirement System of New Jersey | 64.454 | -5,52 | 3.994 | -10,51 | ||||
| 2026-02-17 | 13F | Munro Partners | 975.795 | 60.470 | ||||||
| 2026-01-15 | 13F | Nisa Investment Advisors, Llc | 72.553 | 0,00 | 4.496 | -5,27 | ||||
| 2026-02-17 | 13F | Boothbay Fund Management, Llc | Put | 5.000 | 310 | |||||
| 2026-02-17 | 13F | Boothbay Fund Management, Llc | 6.633 | 411 | ||||||
| 2026-04-06 | 13F | GAMMA Investing LLC | 835 | -60,31 | 34 | -73,85 | ||||
| 2026-02-17 | 13F | Utah Retirement Systems | 25.267 | 0,00 | 1.566 | -5,27 | ||||
| 2026-02-17 | 13F | Algert Global Llc | 181.670 | 2,71 | 11 | 0,00 | ||||
| 2026-02-13 | 13F | Transamerica Financial Advisors, Inc. | 53 | 3 | ||||||
| 2025-11-14 | 13F | Voloridge Investment Management, Llc | 0 | -100,00 | 0 | |||||
| 2026-02-11 | 13F | Allianz Asset Management GmbH | 92.526 | -3,20 | 5.734 | -8,30 | ||||
| 2026-04-13 | 13F | Mather Group, Llc. | 55 | 2 | ||||||
| 2026-02-10 | 13F | Quantbot Technologies LP | 46.481 | 92,27 | 2.880 | 82,16 | ||||
| 2026-01-27 | 13F | TD Waterhouse Canada Inc. | 0 | -100,00 | 0 | |||||
| 2025-11-12 | 13F | Longfellow Investment Management Co Llc | 0 | -100,00 | 0 | |||||
| 2026-02-17 | 13F | Bank Of America Corp /de/ | 1.723.143 | -3,04 | 106.783 | -8,15 | ||||
| 2026-04-17 | 13F | Total Clarity Wealth Management, Inc. | 0 | -100,00 | 0 | |||||
| 2026-02-23 | 13F | Mv Capital Management, Inc. | 2 | 0,00 | 0 | |||||
| 2025-11-14 | 13F | Aigen Investment Management, Lp | 0 | -100,00 | 0 | |||||
| 2026-02-17 | 13F | Two Sigma Investments, Lp | 231.537 | -84,06 | 14.348 | -84,90 | ||||
| 2025-11-14 | 13F | Gts Securities Llc | 0 | -100,00 | 0 | -100,00 | ||||
| 2026-04-15 | 13F | QTR Family Wealth, LLC | 0 | -100,00 | 0 | |||||
| 2026-02-12 | 13F | Dimensional Fund Advisors Lp | 2.607.512 | 1,13 | 161.595 | -4,21 | ||||
| 2026-01-26 | 13F | Whittier Trust Co Of Nevada Inc | 5.528 | -5,63 | 366 | 0,27 | ||||
| 2026-02-12 | 13F | Voya Investment Management Llc | 57.992 | 14,94 | 3.594 | 8,88 | ||||
| 2026-02-09 | 13F | CBIZ Investment Advisory Services, LLC | 95 | 6 | ||||||
| 2026-02-02 | 13F | Qrg Capital Management, Inc. | 0 | -100,00 | 0 | |||||
| 2026-02-17 | 13F | Dark Forest Capital Management Lp | 18.126 | -18,16 | 1.123 | -22,44 | ||||
| 2026-02-10 | 13F | Private Wealth Asset Management, LLC | 2.040 | 0,00 | 126 | -5,26 | ||||
| 2025-11-10 | 13F | Optiver Holding B.V. | 0 | -100,00 | 0 | |||||
| 2026-01-28 | 13F | Arizona State Retirement System | 43.214 | -5,61 | 2.678 | -10,59 | ||||
| 2026-04-21 | 13F | Paradigm Financial Partners, Llc | 0 | -100,00 | 0 | |||||
| 2026-02-12 | 13F | Nuveen, LLC | 932.357 | -1,60 | 57.778 | -6,79 | ||||
| 2026-04-06 | 13F | CX Institutional | 308 | 0 | ||||||
| 2026-01-28 | 13F | Salomon & Ludwin, LLC | 413 | 75,00 | 27 | 85,71 | ||||
| 2026-02-10 | 13F | CIBC Asset Management Inc | 6.649 | 0,00 | 412 | -5,07 | ||||
| 2026-04-14 | 13F | Perpetual Ltd | 627.141 | 25.882 | ||||||
| 2025-11-14 | 13F | Point72 Asia (Singapore) Pte. Ltd. | 335 | -96,15 | 22 | -95,58 | ||||
| 2026-02-17 | 13F | VR Advisory Services Ltd | 108.747 | 6.739 | ||||||
| 2026-02-17 | 13F | Hbk Investments L P | Put | 0 | -100,00 | 0 | -100,00 | |||
| 2026-02-17 | 13F | Evercore Wealth Management, LLC | 11.963 | -13,02 | 741 | -17,58 | ||||
| 2026-02-09 | 13F | Kingsview Wealth Management, LLC | 5.373 | -8,08 | 333 | -13,09 | ||||
| 2026-01-21 | 13F | Flagship Harbor Advisors, Llc | 60 | 4 | ||||||
| 2025-11-14 | 13F | Cubist Systematic Strategies, LLC | Put | 48.000 | -19,19 | 3.140 | -3,33 | |||
| 2026-02-04 | 13F | Rock Point Advisors, LLC | 180.372 | 4,12 | 11.178 | -1,37 | ||||
| 2026-02-17 | 13F | Sig Brokerage, Lp | Call | 9.000 | 0,00 | 558 | -5,27 | |||
| 2025-11-14 | 13F | Cubist Systematic Strategies, LLC | Call | 47.800 | -38,16 | 3.127 | -26,02 | |||
| 2026-02-13 | 13F | Morgan Stanley | 2.524.669 | -9,26 | 156.454 | -14,04 | ||||
| 2025-11-14 | 13F | Cubist Systematic Strategies, LLC | 212.789 | 445,32 | 13.921 | 552,30 | ||||
| 2026-02-12 | 13F | Hrt Financial Lp | 128.515 | -62,54 | 8 | -68,18 | ||||
| 2026-02-02 | 13F | Truist Financial Corp | 9.264 | -29,33 | 574 | -33,02 | ||||
| 2025-11-07 | 13F | Shell Asset Management Co | 2.564 | -55,55 | 0 | |||||
| 2026-02-13 | 13F | Jacobs Levy Equity Management, Inc | 1.016.854 | 583,17 | 63.014 | 547,16 | ||||
| 2026-04-23 | 13F | Peregrine Capital Management Llc | 340 | 0,00 | 14 | -33,33 | ||||
| 2026-03-31 | 13F/A | Barclays Plc | Call | 0 | -100,00 | 0 | -100,00 | |||
| 2026-04-16 | 13F | Diversified Trust Co | 24.391 | 1.007 | ||||||
| 2026-02-17 | 13F | XTX Topco Ltd | 21.870 | 413,26 | 1.355 | 387,41 | ||||
| 2026-02-09 | 13F | Smithfield Trust Co | 439 | 0 | ||||||
| 2026-01-21 | 13F | Newbridge Financial Services Group, Inc. | 2.900 | 0,00 | 180 | -5,29 | ||||
| 2026-01-27 | 13F | Waterfront Wealth Inc. | 146.156 | 0,01 | 9.230 | 15,00 | ||||
| 2026-02-06 | 13F | Gsa Capital Partners Llp | 0 | -100,00 | 0 | |||||
| 2026-02-13 | 13F | Storgate, LLC | 4.309 | 267 | ||||||
| 2026-02-10 | 13F | Intech Investment Management Llc | 132.263 | 95,71 | 8.196 | 85,39 | ||||
| 2026-04-23 | 13F | Private Wealth Management Group, LLC | 0 | -100,00 | 0 | |||||
| 2026-02-18 | 13F | Mackenzie Financial Corp | 0 | -100,00 | 0 | |||||
| 2026-02-12 | 13F | First Wilshire Securities Management Inc | 0 | -100,00 | 0 | |||||
| 2026-02-11 | 13F | LPL Financial LLC | 325.092 | -9,65 | 20.146 | -14,41 | ||||
| 2026-04-21 | 13F | Pinnacle Wealth Management Advisory Group, LLC | 5.039 | 19,86 | 208 | -20,38 | ||||
| 2026-02-17 | 13F | Two Sigma Advisers, Lp | 255.400 | -80,27 | 15.827 | -81,31 | ||||
| 2026-02-17 | 13F | Glenmede Trust Co Na | 0 | -100,00 | 0 | |||||
| 2025-11-07 | 13F | Readystate Asset Management Lp | 0 | -100,00 | 0 | -100,00 | ||||
| 2026-02-02 | 13F | Cornerstone Planning Group LLC | 96 | -20,00 | 6 | -16,67 | ||||
| 2026-04-07 | 13F | Eastern Bank | 679 | 0,00 | 28 | -33,33 | ||||
| 2026-02-06 | 13F | Condor Capital Management | 46.671 | -2,29 | 2.892 | -7,43 | ||||
| 2026-02-13 | 13F | Pathstone Holdings, LLC | 28.042 | -3,48 | 1.738 | -8,58 | ||||
| 2026-04-21 | 13F | Pallas Capital Advisors LLC | 0 | -100,00 | 0 | |||||
| 2026-02-17 | 13F | Integrated Advisors Network LLC | 0 | -100,00 | 0 | |||||
| 2026-02-17 | 13F | Raymond James Financial Inc | 72.638 | -72,83 | 4.501 | -74,27 | ||||
| 2026-02-17 | 13F | Citadel Advisors Llc | Put | 491.600 | 202,15 | 30.464 | 186,24 | |||
| 2026-02-17 | 13F | Janus Henderson Group Plc | 67.014 | 0,00 | 4.155 | -5,25 | ||||
| 2026-02-10 | 13F | Connor, Clark & Lunn Investment Management Ltd. | 73.222 | 4.538 | ||||||
| 2026-01-30 | 13F | Delta Investment Management, LLC | 4.484 | 278 | ||||||
| 2026-02-17 | 13F | Citadel Advisors Llc | Call | 362.500 | 75,04 | 22.464 | 65,81 | |||
| 2026-04-23 | 13F | Merrion Investment Management Co, LLC | 198.695 | -0,50 | 8.200 | -33,74 | ||||
| 2026-02-17 | 13F | Citadel Advisors Llc | 1.468.373 | 408,11 | 90.995 | 381,33 | ||||
| 2026-02-17 | 13F | Hilltop Holdings Inc. | 7.982 | 28,45 | 495 | 21,67 | ||||
| 2026-02-17 | 13F | Balyasny Asset Management Llc | 427.365 | -51,90 | 26.484 | -54,44 | ||||
| 2026-02-12 | 13F | BlackRock, Inc. | 16.351.672 | 5,18 | 1.013.313 | -0,36 | ||||
| 2026-02-17 | 13F | Point72 Asset Management, L.P. | 0 | -100,00 | 0 | -100,00 | ||||
| 2026-02-05 | 13F | Atria Investments Llc | 5.549 | -9,21 | 344 | -14,04 | ||||
| 2026-02-06 | 13F | Global Retirement Partners, LLC | 3.657 | 20,22 | 227 | 13,57 | ||||
| 2026-01-23 | 13F | Assetmark, Inc | 3.252 | 3,14 | 202 | -2,43 | ||||
| 2026-02-03 | 13F | SBI Securities Co., Ltd. | 27 | 8,00 | 2 | 0,00 | ||||
| 2026-01-27 | 13F | Lecap Asset Management Ltd | 4.668 | -62,86 | 289 | -64,84 | ||||
| 2026-04-14 | 13F | Moisand Fitzgerald Tamayo, LLC | 433 | 0,00 | 18 | -34,62 | ||||
| 2026-02-10 | 13F | Rothschild Investment Llc | 2.295 | 209,72 | 142 | 195,83 | ||||
| 2026-04-20 | 13F | Brian Low Financial Group, Llc | 0 | -100,00 | 0 | |||||
| 2026-02-24 | 13F/A | Pacer Advisors, Inc. | 19.735 | -9,73 | 1.223 | -14,55 | ||||
| 2026-01-23 | 13F | Westside Investment Management, Inc. | 421 | 0,00 | 26 | -3,70 | ||||
| 2025-11-13 | 13F | Total Investment Management Inc | 0 | -100,00 | 0 | |||||
| 2026-02-19 | 13F | Connective Capital Management, LLC | 3.820 | -86,43 | 237 | -87,18 | ||||
| 2026-02-04 | 13F | LRI Investments, LLC | 181 | 0,00 | 11 | 0,00 | ||||
| 2026-02-10 | 13F | Natixis Advisors, L.p. | 29.078 | -16,22 | 2 | -50,00 | ||||
| 2026-02-13 | 13F | Wittenberg Investment Management, Inc. | 37.074 | -0,54 | 2.297 | -5,78 | ||||
| 2026-01-30 | 13F | Us Bancorp \de\ | 28.582 | -3,34 | 1.771 | -8,43 | ||||
| 2026-02-11 | 13F | SOUTH STATE Corp | 32 | -38,46 | 2 | -66,67 | ||||
| 2026-02-13 | 13F | First National Bank Of Omaha | 6.200 | 389 | ||||||
| 2026-04-13 | 13F | Gradient Investments LLC | 301.441 | 3,31 | 12.440 | -31,20 | ||||
| 2026-02-12 | 13F | BRYN MAWR TRUST Co | 0 | -100,00 | 0 | |||||
| 2026-02-09 | 13F | Legal & General Group Plc | 258.358 | -19,39 | 16.010 | -23,65 | ||||
| 2026-01-16 | 13F | Trust Co Of Vermont | 300 | 0,00 | 19 | -5,26 | ||||
| 2026-01-20 | 13F | Aspiriant, Llc | 6.149 | 1,25 | 381 | -4,03 | ||||
| 2026-04-07 | 13F | Farther Finance Advisors, LLC | 9.610 | -32,12 | 397 | -54,73 | ||||
| 2025-11-12 | 13F | Pitcairn Co | 0 | -100,00 | 0 | |||||
| 2026-02-17 | 13F | Prana Capital Management, LP | 93.171 | 1,06 | 5.774 | -4,28 | ||||
| 2026-01-29 | 13F | Vanguard Group Inc | 14.734.593 | -0,95 | 913.103 | -6,17 | ||||
| 2026-02-18 | 13F | EP Wealth Advisors, Inc. | 4.339 | 269 | ||||||
| 2026-04-15 | 13F | Steinberganna Wealth Management | 0 | -100,00 | 0 | |||||
| 2026-02-12 | 13F | Sumitomo Mitsui Financial Group, Inc. | 9.247.081 | 0,00 | 573.042 | -5,27 | ||||
| 2026-02-02 | 13F | Sachetta, LLC | 35 | 0,00 | 2 | 0,00 | ||||
| 2026-02-17 | 13F | State Of Wisconsin Investment Board | 170.297 | 40,56 | 10.553 | 33,14 | ||||
| 2026-02-13 | 13F | Citigroup Inc | 74.633 | -67,09 | 4.625 | -68,82 | ||||
| 2026-01-22 | 13F | Bfsg, Llc | 5.550 | 0,47 | 344 | -4,99 | ||||
| 2026-02-13 | 13F | Citigroup Inc | Put | 100.000 | 6.197 | |||||
| 2026-02-05 | 13F | North Dakota State Investment Board | 5.434 | 337 | ||||||
| 2026-02-05 | 13F | Bessemer Group Inc | 1.006 | -3,27 | 0 | |||||
| 2026-01-28 | 13F | Chicago Partners Investment Group LLC | 8.034 | 93,64 | 501 | 117,39 | ||||
| 2026-02-11 | 13F | Rise Advisors, LLC | 0 | -100,00 | 0 | |||||
| 2026-02-14 | 13F | Rockefeller Capital Management L.P. | 4.257 | 56,74 | 264 | 48,59 | ||||
| 2026-02-17 | 13F/A | Sentinus, LLC | 4.818 | 299 | ||||||
| 2026-01-21 | 13F | Modera Wealth Management, LLC | 26.277 | -2,72 | 1.628 | -7,87 | ||||
| 2026-04-22 | 13F | Sylvest Advisors, LLC | 10.356 | 12,81 | 427 | -24,82 | ||||
| 2026-02-04 | 13F | Securian Asset Management, Inc | 12.026 | -2,57 | 745 | -7,68 | ||||
| 2026-04-15 | 13F | Parsons Capital Management Inc/ri | 10.000 | -50,00 | 413 | -66,75 | ||||
| 2026-02-11 | 13F | Group One Trading, L.p. | 0 | -100,00 | 0 | -100,00 | ||||
| 2026-02-17 | 13F | Cetera Investment Advisers | 52.560 | 17,74 | 3.257 | 11,54 | ||||
| 2026-04-14 | 13F | Bay Harbor Wealth Management, LLC | 13 | 0,00 | 1 | |||||
| 2026-02-17 | 13F | Millennium Management Llc | Put | 8.200 | 30,16 | 508 | 23,30 | |||
| 2026-02-17 | 13F | Cinctive Capital Management LP | 10.000 | -83,61 | 620 | -84,49 | ||||
| 2026-02-19 | 13F | CI Private Wealth, LLC | 44.583 | -5,87 | 2.763 | -10,85 | ||||
| 2026-02-06 | 13F | Cullen/frost Bankers, Inc. | 8 | 0 | ||||||
| 2026-04-16 | 13F | SG Americas Securities, LLC | 20.552 | -93,40 | 1 | -100,00 | ||||
| 2026-02-12 | 13F | Tocqueville Asset Management L.p. | 49.855 | -5,97 | 3.090 | -10,93 | ||||
| 2026-02-17 | 13F | Cambria Investment Management, L.P. | 0 | -100,00 | 0 | -100,00 | ||||
| 2026-02-10 | 13F | Bruce G. Allen Investments, LLC | 103 | 0,00 | 6 | 0,00 | ||||
| 2026-02-12 | 13F | Wealthspire Advisors, LLC | 0 | -100,00 | 0 | |||||
| 2026-02-12 | 13F | CIBC Private Wealth Group, LLC | 59.057 | 0,53 | 3.660 | -4,79 | ||||
| 2026-02-11 | 13F | 111 Capital | 0 | -100,00 | 0 | -100,00 | ||||
| 2026-02-17 | 13F | Millennium Management Llc | 188.162 | -87,72 | 11.660 | -88,37 | ||||
| 2026-02-17 | 13F | Millennium Management Llc | Call | 13.300 | -9,52 | 824 | -14,26 | |||
| 2026-02-17 | 13F | Alpine Woods Capital Investors, Llc | 0 | -100,00 | 0 | -100,00 | ||||
| 2026-04-23 | 13F | North Star Investment Management Corp. | 240 | 0,00 | 10 | -35,71 | ||||
| 2026-01-30 | 13F | Harbor Advisors LLC | 15.000 | 0,00 | 930 | -5,30 | ||||
| 2026-02-09 | 13F | Hantz Financial Services, Inc. | 2.941 | 74,85 | 0 | |||||
| 2026-02-20 | 13F | Dean Capital Management | 29.603 | 27,60 | 1.834 | 20,90 | ||||
| 2025-11-14 | 13F | Holocene Advisors, LP | 0 | -100,00 | 0 | |||||
| 2026-04-17 | 13F | Fifth Third Wealth Advisors LLC | 5.161 | -3,39 | 213 | -35,95 | ||||
| 2026-04-02 | 13F | Marex Group plc | 51.968 | 2.784 | ||||||
| 2026-04-21 | 13F | Creekside Partners | 0 | -100,00 | 0 | |||||
| 2026-02-17 | 13F | Amundi | 108.844 | -11,61 | 6.745 | -10,47 | ||||
| 2026-04-17 | 13F | Vermillion Wealth Management, Inc. | 14 | 1 | ||||||
| 2026-01-30 | 13F/A | M&t Bank Corp | 10.830 | -64,61 | 671 | -66,47 | ||||
| 2026-02-13 | 13F | Resources Investment Advisors, LLC. | 4.723 | -23,79 | 293 | -27,90 | ||||
| 2026-02-04 | 13F | Pure Financial Advisors, Inc. | 4.929 | -9,39 | 305 | -14,08 | ||||
| 2026-02-09 | 13F | Annis Gardner Whiting Capital Advisors, LLC | 174 | 0,00 | 11 | -9,09 | ||||
| 2026-02-17 | 13F | Interval Partners, LP | 0 | -100,00 | 0 | |||||
| 2026-02-11 | 13F | Hughes Financial Services, LLC | 36 | 0,00 | 2 | 0,00 | ||||
| 2026-04-07 | 13F | Cooper Financial Group | 6.932 | 0,90 | 286 | -32,71 | ||||
| 2026-02-11 | 13F | Motley Fool Asset Management LLC | 3.269 | -2,68 | 203 | -7,76 | ||||
| 2026-02-17 | 13F | First Manhattan Co | 0 | -100,00 | 0 | |||||
| 2025-11-07 | 13F | Sierra Ocean, Llc | 0 | -100,00 | 0 | |||||
| 2026-02-06 | 13F | Cedar Wealth Management, LLC | 88 | 0,00 | 5 | 0,00 | ||||
| 2026-02-13 | 13F | Palisade Asset Management, LLC | 0 | -100,00 | 0 | |||||
| 2026-01-29 | 13F | Sanctuary Advisors, LLC | 13.098 | -31,94 | 812 | -35,58 | ||||
| 2026-02-11 | 13F | Syon Capital Llc | 4.751 | 294 | ||||||
| 2026-02-13 | 13F | American Century Companies Inc | 155.050 | -26,00 | 9.608 | -29,90 | ||||
| 2026-04-15 | 13F | Sage Capital Management, LLC | 0 | -100,00 | 0 | |||||
| 2026-02-13 | 13F | Sei Investments Co | 982.398 | 71,11 | 60.879 | 62,09 | ||||
| 2025-11-14 | 13F | Volterra Technologies LP | Put | 0 | -100,00 | 0 | -100,00 | |||
| 2026-04-15 | 13F | Qvr Llc | Put | 0 | -100,00 | 0 | ||||
| 2026-02-17 | 13F | Philadelphia Financial Management of San Francisco, LLC | 0 | -100,00 | 0 | |||||
| 2026-02-13 | 13F | Mml Investors Services, Llc | 20.166 | 39,99 | 1.250 | 32,59 | ||||
| 2026-02-05 | 13F | Elyxium Wealth, LLC | 453 | 28 | ||||||
| 2026-01-30 | 13F | New York State Teachers Retirement System | 173.313 | 0,00 | 11 | -9,09 | ||||
| 2026-02-23 | 13F | Kera Capital Partners, Inc. | 0 | -100,00 | 0 | |||||
| 2026-02-12 | 13F | Steward Partners Investment Advisory, Llc | 2.522 | -8,16 | 156 | -12,85 | ||||
| 2026-02-17 | 13F | NorthRock Partners, LLC | 0 | -100,00 | 0 | |||||
| 2026-02-05 | 13F | Gabelli Funds Llc | 122.210 | -4,90 | 7.573 | -9,92 | ||||
| 2026-01-28 | 13F | B. Metzler seel. Sohn & Co. AG | 25.725 | -7,84 | 1.594 | -12,71 | ||||
| 2026-04-15 | 13F | FNY Investment Advisers, LLC | Put | 0 | -100,00 | 0 | ||||
| 2026-04-17 | 13F | Baker Ellis Asset Management LLC | 0 | -100,00 | 0 | |||||
| 2026-01-23 | 13F | Guyasuta Investment Advisors Inc | 0 | -100,00 | 0 | -100,00 | ||||
| 2026-02-13 | 13F | Financial Network Wealth Advisors LLC | 16 | 0,00 | 1 | -100,00 | ||||
| 2026-02-17 | 13F | Verdad Advisers, LP | 7.009 | 434 | ||||||
| 2026-02-06 | 13F | VSM Wealth Advisory, LLC | 1.710 | 0,00 | 106 | -5,41 | ||||
| 2026-02-12 | 13F | Bank Of Montreal /can/ | 18.778 | -3,66 | 1.164 | -8,78 | ||||
| 2026-02-13 | 13F | A4 Wealth Advisors LLC | 4.358 | 270 | ||||||
| 2026-02-17 | 13F | Engineers Gate Manager LP | 40.260 | 2.495 | ||||||
| 2026-04-08 | 13F | Ervin Investment Management, LLC | 90.308 | 3,68 | 3.727 | -30,94 | ||||
| 2026-04-17 | 13F | Tectonic Advisors Llc | 0 | -100,00 | 0 | |||||
| 2026-02-17 | 13F | Ancora Advisors, LLC | 14.010 | -1,16 | 868 | -6,36 | ||||
| 2026-02-10 | 13F | Jupiter Asset Management Ltd | 18.682 | 1.158 | ||||||
| 2026-02-12 | 13F | Cloud Capital Management, LLC | 0 | -100,00 | 0 | |||||
| 2026-02-11 | 13F | Mattson Financial Services, LLC | 24.150 | 297,27 | 1.497 | 276,83 | ||||
| 2026-04-07 | 13F | Signaturefd, Llc | 3.834 | -23,15 | 158 | -48,87 | ||||
| 2026-04-07 | 13F | Park Avenue Securities Llc | 22.348 | -6,90 | 1 | -100,00 | ||||
| 2026-02-11 | 13F | Group One Trading, L.p. | Put | 153.400 | 2.030,56 | 9.506 | 1.918,26 | |||
| 2026-04-15 | 13F | Journey Strategic Wealth Llc | 0 | -100,00 | 0 | |||||
| 2026-01-22 | 13F | Ofi Invest Asset Management | 15.956 | 10,17 | 842 | 4,34 | ||||
| 2026-02-17 | 13F | Quantinno Capital Management LP | 379.121 | 50,51 | 23.494 | 42,58 | ||||
| 2026-02-13 | 13F | Safeguard Investment Advisory Group, LLC | 39.437 | 0,00 | 2.444 | -5,27 | ||||
| 2026-02-17 | 13F | Susquehanna International Group, Llp | 0 | -100,00 | 0 | -100,00 | ||||
| 2026-04-08 | 13F | Wealth Enhancement Advisory Services, Llc | 115.526 | -21,89 | 3.977 | -59,62 | ||||
| 2026-04-16 | 13F | Citadel Investment Advisory, Inc. | 18.480 | 0,00 | 1 | 0,00 | ||||
| 2026-02-11 | 13F | Fox Run Management, L.l.c. | 0 | -100,00 | 0 | |||||
| 2026-02-13 | 13F | First Trust Advisors Lp | 605.317 | 64,28 | 37.512 | 55,62 | ||||
| 2026-04-10 | 13F/A | Aegon Asset Management Uk Plc | 202.299 | -20,77 | 10.829 | 54.045,00 | ||||
| 2026-04-22 | 13F | Parcion Private Wealth LLC | 0 | -100,00 | 0 | |||||
| 2026-02-13 | 13F | Cynosure Management, Llc | 8.225 | 510 | ||||||
| 2026-02-12 | 13F | Hollencrest Capital Management | 38 | 0,00 | 2 | 0,00 | ||||
| 2026-02-17 | 13F | Royal Bank Of Canada | 135.869 | -43,93 | 8.420 | -46,88 | ||||
| 2026-02-17 | 13F | Blair William & Co/il | 17.239 | 1,65 | 1.068 | -3,70 | ||||
| 2026-02-10 | 13F | Goldman Sachs Group Inc | Call | 0 | -100,00 | 0 | -100,00 | |||
| 2026-02-11 | 13F | Winton Capital Group Ltd | 8.100 | 502 | ||||||
| 2026-04-10 | 13F/A | OP Asset Management Ltd | 3.610 | 149 | ||||||
| 2026-02-17 | 13F/A | American Alpha Advisors, LLC | 17.500 | 1.084 | ||||||
| 2026-02-05 | 13F | Qsemble Capital Management, LP | 6.039 | 39,12 | 374 | 32,16 | ||||
| 2026-02-11 | 13F | Parallel Advisors, LLC | 24.618 | 133,43 | 1.526 | 121,34 | ||||
| 2026-02-17 | 13F | Alliancebernstein L.p. | 5.576.734 | -3,44 | 345.590 | -8,53 | ||||
| 2026-02-17 | 13F | Capital Fund Management S.a. | 388.042 | 138,69 | 24.047 | 126,10 | ||||
| 2026-04-22 | 13F | Yelin Lapidot Holdings Management Ltd. | 8.652 | 0,00 | 357 | -33,40 | ||||
| 2026-02-05 | 13F | Baader Bank INC | 35.037 | 2.170 | ||||||
| 2026-02-17 | 13F | Aster Capital Management (DIFC) Ltd | 334 | -94,65 | 21 | -95,10 | ||||
| 2026-01-26 | 13F | KBC Group NV | 94.945 | -11,55 | 6 | -28,57 | ||||
| 2026-02-17 | 13F | Prelude Capital Management, Llc | 3.655 | 226 | ||||||
| 2026-01-15 | 13F | Boston Common Asset Management, LLC | 0 | -100,00 | 0 | |||||
| 2026-02-13 | 13F | Umb Bank N A/mo | 9.457 | 6,86 | 586 | 1,38 | ||||
| 2026-02-11 | 13F | Group One Trading, L.p. | Call | 738.000 | 643,95 | 45.734 | 604,78 | |||
| 2025-11-04 | 13F | Pineridge Advisors LLC | 0 | -100,00 | 0 | |||||
| 2026-02-13 | 13F | Stifel Financial Corp | 59.153 | -14,64 | 3.665 | -19,17 | ||||
| 2026-02-17 | 13F | Symmetry Peak Management Llc | Put | 9.700 | 601 | |||||
| 2026-01-28 | 13F | CAPROCK Group, Inc. | 0 | -100,00 | 0 | |||||
| 2026-02-10 | 13F | Goldman Sachs Group Inc | Put | 0 | -100,00 | 0 | -100,00 | |||
| 2026-01-27 | 13F | Evergreen Capital Management Llc | 8.855 | 56,78 | 549 | 48,51 | ||||
| 2026-02-02 | 13F | Principal Financial Group Inc | 363.350 | -75,37 | 22.517 | -76,67 | ||||
| 2026-02-12 | 13F | DRW Securities, LLC | Put | 3.300 | 205 | |||||
| 2026-02-10 | 13F | New Mexico Educational Retirement Board | 33.119 | 0,00 | 2 | 0,00 | ||||
| 2026-02-09 | 13F | King Luther Capital Management Corp | 14.365 | -2,09 | 890 | -7,19 | ||||
| 2026-02-06 | 13F | Prescott Group Capital Management, L.l.c. | 25.000 | 0,00 | 1.549 | -5,26 | ||||
| 2026-04-22 | 13F | Pictet Asset Management Holding SA | 24.959 | 10,22 | 1.030 | -26,59 | ||||
| 2026-02-13 | 13F | Caxton Associates Llp | 31.824 | -47,36 | 1.972 | -50,14 | ||||
| 2026-02-09 | 13F | Quest Partners LLC | 36.813 | 41,57 | 2.281 | 34,10 | ||||
| 2026-02-17 | 13F | Advisor Group Holdings, Inc. | Put | 4 | 0,00 | 5 | 0,00 | |||
| 2026-02-05 | 13F | HFM Investment Advisors, LLC | 8 | -33,33 | 0 | |||||
| 2026-02-09 | 13F | SLT Holdings LLC | 0 | -100,00 | 0 | -100,00 | ||||
| 2026-01-27 | 13F | Seeds Investor Llc | 3.426 | 212 | ||||||
| 2026-02-12 | 13F | Rossby Financial, LCC | 76 | 322,22 | 5 | 300,00 | ||||
| 2026-02-17 | 13F | Aquatic Capital Management LLC | 1.654 | -92,55 | 102 | -92,98 | ||||
| 2026-04-17 | 13F | Bell Investment Advisors, Inc | 18 | -40,00 | 1 | -100,00 | ||||
| 2026-02-12 | 13F | Principal Securities, Inc. | 0 | -100,00 | 0 | -100,00 | ||||
| 2026-04-13 | 13F | IFP Advisors, Inc | 3.711 | 37,24 | 153 | -8,38 | ||||
| 2026-01-21 | 13F | Intrinsic Value Partners, LLC | 28.871 | -2,53 | 1.789 | -7,64 | ||||
| 2026-02-12 | 13F | New York State Common Retirement Fund | 70.837 | 0,00 | 4.390 | -5,29 | ||||
| 2026-04-06 | 13F | Versant Capital Management, Inc | 232 | -87,57 | 10 | -92,17 | ||||
| 2026-04-23 | 13F | SJS Investment Consulting Inc. | 474 | -58,16 | 20 | -72,86 | ||||
| 2026-02-10 | 13F | Bank of New York Mellon Corp | 1.428.431 | -9,03 | 88.520 | -13,83 | ||||
| 2025-11-21 | 13F | Nebula Research & Development LLC | 0 | -100,00 | 0 | -100,00 | ||||
| 2026-02-06 | 13F | Vestmark Advisory Solutions, Inc. | 0 | -100,00 | 0 | |||||
| 2026-02-13 | 13F | Edgestream Partners, L.P. | 44.529 | -19,43 | 2.759 | -23,68 | ||||
| 2025-11-12 | 13F | DnB Asset Management AS | 0 | -100,00 | 0 | |||||
| 2026-04-06 | 13F | Washington Trust Advisors, Inc. | 932 | 0,00 | 38 | -33,33 | ||||
| 2026-02-06 | 13F | Lsv Asset Management | 21.378 | 18,77 | 1 | 0,00 | ||||
| 2026-02-17 | 13F | SageView Advisory Group, LLC | 115 | 7 | ||||||
| 2026-02-05 | 13F | Allworth Financial LP | 5.129 | 137,56 | 318 | 124,82 | ||||
| 2026-02-13 | 13F | SRS Capital Advisors, Inc. | 4.546 | -59,85 | 282 | -62,03 | ||||
| 2026-01-29 | 13F | Quent Capital, LLC | 5.994 | 3,88 | 371 | -1,59 | ||||
| 2026-02-13 | 13F | Glen Eagle Advisors, LLC | 1.452 | -15,73 | 90 | -20,54 | ||||
| 2026-04-24 | 13F | Retirement Systems of Alabama | 474.787 | 0,99 | 19.594 | -32,74 | ||||
| 2026-01-29 | 13F | Carmel Capital Partners, LLC | 7.987 | -0,19 | 495 | -5,54 | ||||
| 2026-02-12 | 13F | Colonial Trust Co / SC | 2.578 | 0,00 | 160 | -5,36 | ||||
| 2026-02-17 | 13F | Tower Research Capital LLC (TRC) | 7.510 | -1,44 | 465 | -6,63 | ||||
| 2026-02-12 | 13F | Caerus Investment Advisors, LLC | 6.465 | 401 | ||||||
| 2026-02-18 | 13F | Vident Advisory, LLC | 6.644 | -29,60 | 412 | -33,39 | ||||
| 2026-02-13 | 13F | Segall Bryant & Hamill, Llc | 33.064 | -19,48 | 2.049 | -23,75 | ||||
| 2026-01-14 | 13F | Hennion & Walsh Asset Management, Inc. | 7.600 | -3,61 | 471 | -8,74 | ||||
| 2026-02-17 | 13F | Susquehanna International Group, Llp | Put | 540.300 | 144,37 | 33.482 | 131,49 | |||
| 2026-02-12 | 13F | Brinker Capital Investments, LLC | 31.124 | -16,77 | 1.929 | -21,18 | ||||
| 2026-02-17 | 13F | Susquehanna International Group, Llp | Call | 505.600 | 54,76 | 31.332 | 46,60 | |||
| 2026-02-13 | 13F | Charles Schwab Investment Management Inc | 1.173.560 | 2,02 | 72.726 | -3,36 | ||||
| 2026-02-11 | 13F | Manchester Capital Management LLC | 70 | 4 | ||||||
| 2026-02-13 | 13F | Advisory Research Inc | 33.653 | -5,63 | 2.085 | -10,59 | ||||
| 2026-01-26 | 13F | Private Trust Co Na | 667 | 0,00 | 41 | -4,65 | ||||
| 2026-01-29 | 13F | DecisionPoint Financial, LLC | 12 | 0,00 | 1 | |||||
| 2026-02-10 | 13F | Foundations Investment Advisors, LLC | 0 | -100,00 | 0 | |||||
| 2026-02-03 | 13F | Connable Office Inc | 11.200 | 0,00 | 694 | -5,19 | ||||
| 2026-04-08 | 13F | DiNuzzo Private Wealth, Inc. | 38 | 0,00 | 2 | -50,00 | ||||
| 2026-02-11 | 13F | Private Management Group Inc | 657.900 | -0,75 | 40.770 | -5,99 | ||||
| 2026-02-17 | 13F | Ameriprise Financial Inc | 335.467 | -12,87 | 20.789 | -17,51 | ||||
| 2026-01-28 | 13F | Geneos Wealth Management Inc. | 1.631 | 29,44 | 101 | 23,17 | ||||
| 2025-11-14 | 13F | Texas Permanent School Fund | 0 | -100,00 | 0 | |||||
| 2026-01-30 | 13F | Bogart Wealth, LLC | 9 | 12,50 | 1 | |||||
| 2026-02-17 | 13F | VestGen Advisors, LLC | 16.595 | -21,43 | 1.028 | -25,56 | ||||
| 2026-02-09 | 13F | Geode Capital Management, Llc | 2.942.554 | 0,83 | 182.390 | -4,49 | ||||
| 2026-04-21 | 13F | Pinnacle Associates Ltd | 8.881 | -45,10 | 367 | -63,47 | ||||
| 2026-02-09 | 13F | Hartland & Co., LLC | 19.773 | 5.965,34 | 1.225 | 5.733,33 | ||||
| 2026-01-23 | 13F | Avion Wealth | 39 | 30,00 | 0 | |||||
| 2026-01-26 | 13F | Shelton Wealth Management, Llc | 23.078 | 7,89 | 1.430 | 2,22 | ||||
| 2026-03-06 | 13F | Hsbc Holdings Plc | 12.084 | -62,23 | 750 | -63,94 | ||||
| 2026-04-20 | 13F | Ronald Blue Trust, Inc. | 3.101 | -5,66 | 128 | -37,44 | ||||
| 2026-04-13 | 13F | Gateway Investment Advisers Llc | 10.685 | -83,98 | 441 | -89,35 | ||||
| 2026-02-17 | 13F | Colter Lewis Investment Partners LLC | 4.532 | 281 | ||||||
| 2026-04-07 | 13F | CoreCap Advisors, LLC | 5 | 0 | ||||||
| 2026-02-17 | 13F | LMR Partners LLP | Call | 29.700 | 1.841 | |||||
| 2025-11-14 | 13F | Redwood Investment Management, Llc | 0 | -100,00 | 0 | -100,00 | ||||
| 2026-02-09 | 13F | Jefferies Financial Group Inc. | 15.333 | 5,93 | 950 | 0,42 | ||||
| 2026-04-14 | 13F | American State Bank (Iowa) | 0 | -100,00 | 0 | |||||
| 2025-11-18 | 13F | Apexium Financial, Lp | 5.814 | -21,04 | 380 | -5,47 | ||||
| 2026-02-11 | 13F | Jpmorgan Chase & Co | 1.959.827 | -60,69 | 121.450 | -62,77 | ||||
| 2026-01-29 | 13F | Dunhill Financial, LLC | 3 | 0 | ||||||
| 2026-02-06 | 13F | HighTower Advisors, LLC | 37.004 | -63,36 | 2.293 | -65,29 | ||||
| 2026-03-12 | 13F/A | Peak6 Llc | Call | 5.900 | 7,27 | 366 | 1,67 | |||
| 2026-03-12 | 13F/A | Peak6 Llc | 169.729 | -15,51 | 10.518 | -19,97 | ||||
| 2026-03-12 | 13F/A | Peak6 Llc | Put | 21.700 | -35,22 | 1.345 | -38,66 | |||
| 2026-02-03 | 13F | Everence Capital Management Inc | 4.831 | 0,00 | 0 | |||||
| 2026-01-20 | 13F | Cromwell Holdings LLC | 28 | 0,00 | 2 | 0,00 | ||||
| 2026-01-30 | 13F | Torren Management, LLC | 231 | 14 | ||||||
| 2026-01-27 | 13F | Checchi Capital Advisers, LLC | 4.631 | 2,23 | 287 | -3,38 | ||||
| 2026-02-17 | 13F | Qube Research & Technologies Ltd | 108.669 | -82,12 | 6.734 | -83,07 | ||||
| 2026-04-13 | 13F | True Wealth Design, LLC | 1.336 | 81,52 | 55 | 22,22 | ||||
| 2026-02-10 | 13F | GoodHaven Capital Management, LLC | 442.487 | 0,11 | 27.421 | -5,17 | ||||
| 2026-02-17 | 13F | RMB Capital Management, LLC | 10.646 | 660 | ||||||
| 2025-11-14 | 13F | Lighthouse Investment Partners, LLC | 0 | -100,00 | 0 | -100,00 | ||||
| 2026-02-02 | 13F | Advisors Preferred, LLC | 1.000 | 63 | ||||||
| 2026-02-17 | 13F | ISAM Funds (UK) Ltd | 0 | -100,00 | 0 | |||||
| 2025-11-13 | 13F | Riggs Asset Managment Co. Inc. | 0 | -100,00 | 0 | |||||
| 2026-02-06 | 13F | Bare Financial Services, Inc | 74 | 0,00 | 5 | 0,00 | ||||
| 2026-02-13 | 13F | Fieldview Capital Management, LLC | 0 | -100,00 | 0 | |||||
| 2026-02-09 | 13F | Catalyst Funds Management Pty Ltd | 0 | -100,00 | 0 | |||||
| 2026-02-11 | 13F | Ramirez Asset Management, Inc. | 500 | 31 | ||||||
| 2026-02-06 | 13F | Profund Advisors Llc | 3.349 | -11,21 | 208 | -15,85 | ||||
| 2026-02-11 | 13F | Simplex Trading, Llc | Call | 49.400 | 20,78 | 3.061 | 152.950,00 | |||
| 2026-02-11 | 13F | Simplex Trading, Llc | Put | 24.600 | -8,89 | 1.524 | 152.300,00 | |||
| 2026-01-30 | 13F | AMG National Trust Bank | 0 | -100,00 | 0 | |||||
| 2026-02-13 | 13F | Prudential Financial Inc | 76.727 | 59,57 | 4.813 | 53,04 | ||||
| 2025-10-30 | 13F | Am Investment Strategies Llc | 0 | -100,00 | 0 | |||||
| 2026-02-19 | 13F | Atomi Financial Group, Inc. | 7.090 | 1,65 | 439 | -3,73 | ||||
| 2026-02-17 | 13F | Advisory Services Network, LLC | 5.875 | 1,12 | 364 | -4,21 | ||||
| 2026-02-18 | 13F/A | Robotti Robert | 328.934 | -1,13 | 20.384 | -6,34 | ||||
| 2026-01-30 | 13F | American Capital Advisory, LLC | 8 | 0,00 | 0 | |||||
| 2026-02-13 | 13F | Huber Capital Management LLC | 0 | -100,00 | 0 | |||||
| 2026-04-13 | 13F | Wedge Capital Management L L P/nc | 43.642 | 0,32 | 1.801 | -33,17 | ||||
| 2025-11-06 | 13F | Whipplewood Advisors, LLC | 0 | -100,00 | 0 | -100,00 | ||||
| 2026-02-09 | 13F | Keating Financial Advisory Services, Inc. | 185 | 11 | ||||||
| 2026-02-13 | 13F | Ieq Capital, Llc | 215.762 | 1.632,05 | 13.371 | 1.542,51 | ||||
| 2026-02-13 | 13F | Panagora Asset Management Inc | 5.102 | 0,71 | 316 | -4,53 | ||||
| 2026-01-26 | 13F | Lansing Street Advisors | 15.723 | 974 | ||||||
| 2025-11-14 | 13F | Wolverine Trading, Llc | 0 | -100,00 | 0 | -100,00 | ||||
| 2026-01-15 | 13F | Lewis Asset Management, LLC | 0 | -100,00 | 0 | |||||
| 2026-02-13 | 13F | Volterra Technologies LP | Call | 0 | -100,00 | 0 | ||||
| 2026-04-09 | 13F | Wedmont Private Capital | 0 | -100,00 | 0 | |||||
| 2026-02-12 | 13F | Federation des caisses Desjardins du Quebec | 13.780 | 10,76 | 854 | 4,92 | ||||
| 2026-01-08 | 13F | Sanders Morris Harris Llc | 0 | -100,00 | 0 | |||||
| 2026-02-10 | 13F | Goldman Sachs Group Inc | 1.761.888 | -3,56 | 109.184 | -8,65 | ||||
| 2026-02-12 | 13F | Jane Street Group, Llc | 49.800 | 571,07 | 3.086 | 536,29 | ||||
| 2026-02-12 | 13F | Jane Street Group, Llc | Put | 87.400 | 194,28 | 5.416 | 178,89 | |||
| 2026-02-12 | 13F | Jane Street Group, Llc | Call | 176.200 | 9,71 | 10.919 | 3,93 | |||
| 2026-02-10 | 13F | Mutual Of America Capital Management Llc | 68.679 | -9,88 | 4.256 | -14,62 | ||||
| 2026-02-17 | 13F | Jain Global LLC | Put | 0 | -100,00 | 0 | ||||
| 2025-12-15 | 13F | FNY Investment Advisers, LLC | 0 | -100,00 | 0 |
Other Listings
| US:JEF | 47,46 $ |