Grundlæggende statistik
| Insider-profil | PRESCOTT GROUP CAPITAL MANAGEMENT, L.L.C. |
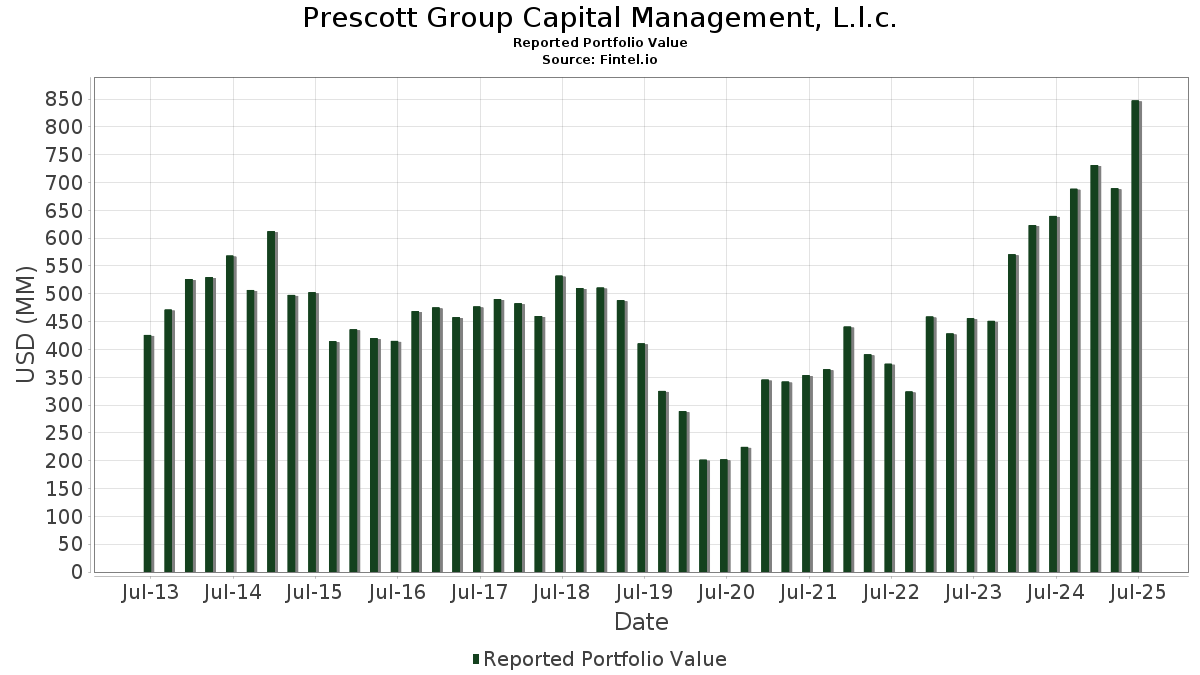
| Porteføljeværdi | $ 948.593.600 |
| Nuværende stillinger | 238 |
Seneste beholdninger, ydeevne, AUM (fra 13F, 13D)
Prescott Group Capital Management, L.l.c. har afsløret 238 samlede besiddelser i deres seneste SEC-arkivering. Den seneste porteføljeværdi er beregnet til at være $ 948.593.600 USD. Faktiske aktiver under forvaltning (AUM) er denne værdi plus kontanter (som ikke er oplyst). Prescott Group Capital Management, L.l.c.s største beholdninger er Performant Healthcare, Inc. (US:PHLT) , American Public Education, Inc. (US:APEI) , Nature's Sunshine Products, Inc. (US:NATR) , SPDR S&P 500 ETF (US:SPY) , and SPDR S&P MidCap 400 ETF Trust (US:MDY) . Prescott Group Capital Management, L.l.c.s nye stillinger omfatter GrafTech International Ltd. (DE:G6G0) , Watts Water Technologies, Inc. (US:WTS) , Vivid Seats Inc. (US:SEAT) , Reliance, Inc. (US:RS) , and AlTi Global, Inc. (US:ALTI) . Prescott Group Capital Management, L.l.c.s topbrancher er "Construction Special Trade Contractors" (sic 17) , "Social Services" (sic 83) , and "General Merchandise Stores" (sic 53) .
Top øger dette kvartal
Vi bruger ændringen i porteføljeallokeringen, fordi dette er den mest meningsfulde metrik. Ændringer kan skyldes handler eller ændringer i aktiekurser.
| Sikkerhed | Aktier (MM) |
Værdi (MM$) |
Portefølje % | ΔPortefølje % |
|---|---|---|---|---|
| PHLT / Performant Healthcare, Inc. | 15,79 | 122,08 | 12,8698 | 5,4135 |
| G6G0 / GrafTech International Ltd. | 0,48 | 6,13 | 0,6462 | 0,6462 |
| NUS / Nu Skin Enterprises, Inc. | 1,73 | 21,14 | 2,2291 | 0,5932 |
| WTS / Watts Water Technologies, Inc. | 0,01 | 4,19 | 0,4416 | 0,4416 |
| TDY / Teledyne Technologies Incorporated | 0,01 | 4,10 | 0,4325 | 0,4325 |
| OR / OR Royalties Inc. | 0,29 | 11,54 | 1,2169 | 0,3429 |
| TPC / Tutor Perini Corporation | 0,22 | 14,67 | 1,5467 | 0,3116 |
| RERE / ATRenew Inc. - Depositary Receipt (Common Stock) | 3,16 | 14,52 | 1,5302 | 0,2974 |
| CDNS / Cadence Design Systems, Inc. | 0,01 | 3,38 | 0,3563 | 0,2973 |
| SNOW / Snowflake Inc. | 0,01 | 2,26 | 0,2378 | 0,2378 |
Top falder i dette kvartal
Vi bruger ændringen i porteføljeallokeringen, fordi dette er den mest meningsfulde metrik. Ændringer kan skyldes handler eller ændringer i aktiekurser.
| Sikkerhed | Aktier (MM) |
Værdi (MM$) |
Portefølje % | ΔPortefølje % |
|---|---|---|---|---|
| APEI / American Public Education, Inc. | 0,86 | 33,83 | 3,5668 | -0,9001 |
| CRMT / America's Car-Mart, Inc. | 0,32 | 9,41 | 0,9916 | -0,6886 |
| MDY / SPDR S&P MidCap 400 ETF Trust | 0,04 | 25,83 | 2,7229 | -0,5749 |
| MP / MP Materials Corp. | 0,01 | 0,37 | 0,0387 | -0,4215 |
| GEO / The GEO Group, Inc. | 0,28 | 5,78 | 0,6091 | -0,3828 |
| FNF / Fidelity National Financial, Inc. | 0,00 | 0,00 | -0,3739 | |
| IT / Gartner, Inc. | 0,00 | 0,24 | 0,0248 | -0,3614 |
| FICO / Fair Isaac Corporation | 0,00 | 2,12 | 0,2236 | -0,2548 |
| VICR / Vicor Corporation | 0,06 | 3,04 | 0,3202 | -0,2210 |
| FI / Fiserv, Inc. | 0,03 | 4,07 | 0,4290 | -0,2133 |
13D/G-arkivering
Dette er en liste over 13D- og 13G-arkiveringer lavet i det sidste år (hvis nogen). Klik på linkikonet for at se den fulde transaktionshistorik. Grønne rækker angiver nye positioner. Røde rækker angiver lukkede positioner.
| Fil dato | Form | Sikkerhed | Forrige Aktier |
Nuværende Aktier |
Δandele % | % Ejerskab |
% ΔEjerskab | |
|---|---|---|---|---|---|---|---|---|
| 2025-11-04 | APEI / American Public Education, Inc. | 1.184.568 | 857.226 | -27,63 | 4,70 | -29,85 | ||
| 2025-10-23 | PHLT / Performant Healthcare, Inc. | 15.793.291 | 0 | -100,00 | 0,00 | -100,00 | ||
| 2025-01-14 | LUNA / Luna Innovations Incorporated | 3.254.415 | 9,40 |
13F og Fondsarkivering
Denne formular blev indsendt den 2025-11-06 for rapporteringsperioden 2025-09-30. Klik på linkikonet for at se den fulde transaktionshistorik.
Opgrader for at låse op for premium-data og eksportere til Excel ![]() .
.
| Sikkerhed | Type | Gennemsnitlig aktiekurs | Aktier (MM) |
Δ Aktier (%) |
Værdi ($MM) |
Δ Aktier (%) |
Portefølje (%) |
ΔPortefølje (%) |
|
|---|---|---|---|---|---|---|---|---|---|
| PHLT / Performant Healthcare, Inc. | 15,79 | 0,00 | 122,08 | 93,25 | 12,8698 | 5,4135 | |||
| APEI / American Public Education, Inc. | 0,86 | -31,01 | 33,83 | -10,60 | 3,5668 | -0,9001 | |||
| NATR / Nature's Sunshine Products, Inc. | 1,78 | 0,00 | 27,67 | 4,93 | 2,9173 | -0,1953 | |||
| SPY / SPDR S&P 500 ETF | 0,04 | 0,00 | 26,37 | 7,82 | 2,7798 | -0,1067 | |||
| MDY / SPDR S&P MidCap 400 ETF Trust | 0,04 | -12,14 | 25,83 | -7,56 | 2,7229 | -0,5749 | |||
| IWL / iShares Trust - iShares Russell Top 200 ETF | 0,13 | 0,00 | 22,33 | 8,48 | 2,3542 | -0,0756 | |||
| NUS / Nu Skin Enterprises, Inc. | 1,73 | 0,00 | 21,14 | 52,57 | 2,2291 | 0,5932 | |||
| DBD / Diebold Nixdorf, Incorporated | 0,37 | 0,00 | 21,00 | 2,94 | 2,2135 | -0,1939 | |||
| TPC / Tutor Perini Corporation | 0,22 | 0,00 | 14,67 | 40,21 | 1,5467 | 0,3116 | |||
| RERE / ATRenew Inc. - Depositary Receipt (Common Stock) | 3,16 | 0,00 | 14,52 | 38,98 | 1,5302 | 0,2974 | |||
| ENVA / Enova International, Inc. | 0,10 | 0,00 | 12,00 | 3,21 | 1,2654 | -0,1074 | |||
| HCA / HCA Healthcare, Inc. | 0,03 | 0,00 | 11,55 | 11,25 | 1,2180 | -0,0078 | |||
| OR / OR Royalties Inc. | 0,29 | 0,00 | 11,54 | 55,90 | 1,2169 | 0,3429 | |||
| FCFS / FirstCash Holdings, Inc. | 0,07 | 0,00 | 11,17 | 17,23 | 1,1779 | 0,0529 | |||
| XIFR / XPLR Infrastructure, LP - Limited Partnership | 1,09 | 5,82 | 11,10 | 31,25 | 1,1698 | 0,1718 | |||
| DAVA / Endava plc - Depositary Receipt (Common Stock) | 1,22 | 100,34 | 11,07 | 19,00 | 1,1669 | 0,0690 | |||
| NET / Cloudflare, Inc. | 0,05 | 0,00 | 10,30 | 9,59 | 1,0859 | -0,0236 | |||
| CRMT / America's Car-Mart, Inc. | 0,32 | 26,77 | 9,41 | -33,93 | 0,9916 | -0,6886 | |||
| FTI / TechnipFMC plc | 0,23 | 0,00 | 9,08 | 14,55 | 0,9573 | 0,0216 | |||
| DHI / D.R. Horton, Inc. | 0,05 | 0,00 | 8,87 | 31,47 | 0,9355 | 0,1387 | |||
| PESI / Perma-Fix Environmental Services, Inc. | 0,78 | 0,00 | 7,85 | -3,99 | 0,8274 | -0,1375 | |||
| ORLY / O'Reilly Automotive, Inc. | 0,07 | 0,00 | 7,79 | 19,63 | 0,8210 | 0,0525 | |||
| IBKR / Interactive Brokers Group, Inc. | 0,11 | 0,00 | 7,68 | 24,20 | 0,8101 | 0,0797 | |||
| AMBC / Octave Specialty Group, Inc. | 0,90 | 2,28 | 7,47 | 20,15 | 0,7877 | 0,0537 | |||
| GPN / Global Payments Inc. | 0,09 | 50,16 | 7,46 | 55,87 | 0,7865 | 0,2215 | |||
| EME / EMCOR Group, Inc. | 0,01 | 0,00 | 7,14 | 21,43 | 0,7532 | 0,0588 | |||
| CVEO / Civeo Corporation | 0,31 | 0,00 | 7,05 | -0,40 | 0,7428 | -0,0921 | |||
| GLDD / Great Lakes Dredge & Dock Corporation | 0,58 | 0,00 | 6,92 | -1,65 | 0,7292 | -0,1008 | |||
| EBS / Emergent BioSolutions Inc. | 0,77 | 0,00 | 6,82 | 38,24 | 0,7185 | 0,1366 | |||
| FSLR / First Solar, Inc. | 0,03 | 0,00 | 6,70 | 33,23 | 0,7067 | 0,1128 | |||
| RTX / RTX Corporation | 0,04 | 0,00 | 6,65 | 14,61 | 0,7014 | 0,0161 | |||
| ONIT / Onity Group Inc. | 0,16 | 0,00 | 6,58 | 4,70 | 0,6934 | -0,0482 | |||
| KRE / SPDR Series Trust - State Street SPDR S&P Regional Banking ETF | 0,10 | 29,36 | 6,55 | 37,89 | 0,6906 | 0,1298 | |||
| FROG / JFrog Ltd. | 0,13 | 0,00 | 6,15 | 7,85 | 0,6486 | -0,0247 | |||
| BKD / Brookdale Senior Living Inc. | 0,72 | 0,00 | 6,14 | 21,70 | 0,6473 | 0,0518 | |||
| G6G0 / GrafTech International Ltd. | 0,48 | 6,13 | 0,6462 | 0,6462 | |||||
| NGL / NGL Energy Partners LP - Limited Partnership | 0,99 | 0,00 | 5,94 | 40,50 | 0,6266 | 0,1273 | |||
| AZO / AutoZone, Inc. | 0,00 | 0,00 | 5,92 | 15,58 | 0,6241 | 0,0195 | |||
| VVX / V2X, Inc. | 0,10 | 0,00 | 5,79 | 19,65 | 0,6106 | 0,0392 | |||
| ADSK / Autodesk, Inc. | 0,02 | 0,00 | 5,78 | 2,61 | 0,6095 | -0,0555 | |||
| GEO / The GEO Group, Inc. | 0,28 | -19,64 | 5,78 | -31,25 | 0,6091 | -0,3828 | |||
| BOKF / BOK Financial Corporation | 0,05 | 0,00 | 5,57 | 14,16 | 0,5873 | 0,0112 | |||
| TJX / The TJX Companies, Inc. | 0,04 | 0,00 | 5,51 | 17,06 | 0,5810 | 0,0252 | |||
| ROST / Ross Stores, Inc. | 0,04 | 0,00 | 5,46 | 19,44 | 0,5753 | 0,0361 | |||
| EVR / Evercore Inc. | 0,02 | 0,00 | 5,44 | 24,93 | 0,5738 | 0,0595 | |||
| ARLP / Alliance Resource Partners, L.P. - Limited Partnership | 0,21 | 0,00 | 5,39 | -3,28 | 0,5683 | -0,0895 | |||
| NVR / NVR, Inc. | 0,00 | 0,00 | 5,35 | 8,80 | 0,5641 | -0,0165 | |||
| EZPW / EZCORP, Inc. | 0,27 | 0,00 | 5,17 | 37,20 | 0,5447 | 0,1001 | |||
| CACI / CACI International Inc | 0,01 | 0,00 | 5,08 | 4,63 | 0,5357 | -0,0375 | |||
| FLEX / Flex Ltd. | 0,09 | 0,00 | 4,93 | 16,12 | 0,5194 | 0,0186 | |||
| PRI / Primerica, Inc. | 0,02 | 0,00 | 4,93 | 1,44 | 0,5192 | -0,0539 | |||
| PWR / Quanta Services, Inc. | 0,01 | 0,00 | 4,84 | 9,62 | 0,5105 | -0,0109 | |||
| NOAH / Noah Holdings Limited - Depositary Receipt (Common Stock) | 0,41 | 0,00 | 4,80 | -2,93 | 0,5062 | -0,0777 | |||
| FANG / Diamondback Energy, Inc. | 0,03 | 0,00 | 4,65 | 4,14 | 0,4903 | -0,0368 | |||
| OMF / OneMain Holdings, Inc. | 0,08 | 0,00 | 4,57 | -0,95 | 0,4821 | -0,0628 | |||
| PFSI / PennyMac Financial Services, Inc. | 0,04 | 0,00 | 4,46 | 24,33 | 0,4703 | 0,0468 | |||
| GHM / Graham Corporation | 0,08 | 0,00 | 4,42 | 10,89 | 0,4661 | -0,0045 | |||
| CTAS / Cintas Corporation | 0,02 | 0,00 | 4,40 | -7,90 | 0,4635 | -0,1000 | |||
| COOP / Mr. Cooper Group Inc. | 0,02 | 0,00 | 4,22 | 41,25 | 0,4444 | 0,0922 | |||
| BILI / Bilibili Inc. - Depositary Receipt (Common Stock) | 0,15 | 0,00 | 4,21 | 30,96 | 0,4442 | 0,0644 | |||
| WTS / Watts Water Technologies, Inc. | 0,01 | 4,19 | 0,4416 | 0,4416 | |||||
| CHKP / Check Point Software Technologies Ltd. | 0,02 | 0,00 | 4,14 | -6,49 | 0,4362 | -0,0860 | |||
| BN / Brookfield Corporation | 0,06 | 0,00 | 4,11 | 10,86 | 0,4338 | -0,0042 | |||
| TDY / Teledyne Technologies Incorporated | 0,01 | 4,10 | 0,4325 | 0,4325 | |||||
| FI / Fiserv, Inc. | 0,03 | 0,00 | 4,07 | -25,22 | 0,4290 | -0,2133 | |||
| BAH / Booz Allen Hamilton Holding Corporation | 0,04 | 0,00 | 4,03 | -4,03 | 0,4245 | -0,0707 | |||
| LDOS / Leidos Holdings, Inc. | 0,02 | 0,00 | 3,97 | 19,81 | 0,4183 | 0,0273 | |||
| SNPS / Synopsys, Inc. | 0,01 | 131,73 | 3,91 | 123,02 | 0,4117 | 0,2050 | |||
| NOW / ServiceNow, Inc. | 0,00 | 0,00 | 3,74 | -10,50 | 0,3947 | -0,0990 | |||
| KBR / KBR, Inc. | 0,08 | 0,00 | 3,66 | -1,37 | 0,3864 | -0,0522 | |||
| CI / The Cigna Group | 0,01 | 0,00 | 3,60 | -12,81 | 0,3790 | -0,1077 | |||
| TSM / Taiwan Semiconductor Manufacturing Company Limited - Depositary Receipt (Common Stock) | 0,01 | 0,00 | 3,46 | 23,32 | 0,3647 | 0,0336 | |||
| PAGP / Plains GP Holdings, L.P. - Limited Partnership | 0,19 | 0,00 | 3,46 | -6,11 | 0,3643 | -0,0702 | |||
| AJG / Arthur J. Gallagher & Co. | 0,01 | -21,22 | 3,45 | -23,78 | 0,3637 | -0,1705 | |||
| CDNS / Cadence Design Systems, Inc. | 0,01 | 492,91 | 3,38 | 576,00 | 0,3563 | 0,2973 | |||
| INSE / Inspired Entertainment, Inc. | 0,36 | 0,00 | 3,36 | 14,80 | 0,3542 | 0,0088 | |||
| DEC / Diversified Energy Company | 0,23 | 16,86 | 3,28 | 11,59 | 0,3460 | -0,0011 | |||
| JBL / Jabil Inc. | 0,01 | 0,00 | 3,26 | -0,43 | 0,3434 | -0,0427 | |||
| LII / Lennox International Inc. | 0,01 | 50,00 | 3,18 | 38,57 | 0,3348 | 0,0642 | |||
| RDNT / RadNet, Inc. | 0,04 | 0,00 | 3,17 | 33,91 | 0,3343 | 0,0548 | |||
| PYPL / PayPal Holdings, Inc. | 0,05 | 0,00 | 3,15 | -9,79 | 0,3323 | -0,0800 | |||
| MEDP / Medpace Holdings, Inc. | 0,01 | -40,00 | 3,08 | -1,72 | 0,3252 | -0,0452 | |||
| BNED / Barnes & Noble Education, Inc. | 0,31 | 6,14 | 3,06 | -10,28 | 0,3229 | -0,0800 | |||
| VICR / Vicor Corporation | 0,06 | -39,57 | 3,04 | -33,76 | 0,3202 | -0,2210 | |||
| MLI / Mueller Industries, Inc. | 0,03 | 0,00 | 3,03 | 27,22 | 0,3198 | 0,0384 | |||
| PEGA / Pegasystems Inc. | 0,05 | 0,00 | 2,99 | 6,25 | 0,3152 | -0,0170 | |||
| LNG / Cheniere Energy, Inc. | 0,01 | 0,00 | 2,96 | -3,52 | 0,3121 | -0,0500 | |||
| CRH / CRH plc | 0,02 | 0,00 | 2,89 | 30,60 | 0,3052 | 0,0436 | |||
| SAND / Sandstorm Gold Ltd. | 0,23 | 0,00 | 2,88 | 33,23 | 0,3035 | 0,0484 | |||
| MSFT / Microsoft Corporation | 0,01 | 0,00 | 2,87 | 4,14 | 0,3024 | -0,0227 | |||
| ZTS / Zoetis Inc. | 0,02 | 0,00 | 2,85 | -6,18 | 0,3008 | -0,0581 | |||
| CBRE / CBRE Group, Inc. | 0,02 | 50,00 | 2,84 | 68,71 | 0,2990 | 0,1005 | |||
| DLTR / Dollar Tree, Inc. | 0,03 | 0,00 | 2,83 | -4,71 | 0,2985 | -0,0522 | |||
| STXS / Stereotaxis, Inc. | 0,90 | -20,89 | 2,80 | 16,02 | 0,2955 | 0,0104 | |||
| SNA / Snap-on Incorporated | 0,01 | 300,00 | 2,77 | 345,66 | 0,2922 | 0,2188 | |||
| PATK / Patrick Industries, Inc. | 0,03 | 0,00 | 2,64 | 12,09 | 0,2785 | 0,0003 | |||
| RUSHA / Rush Enterprises, Inc. | 0,05 | 0,00 | 2,64 | 3,82 | 0,2779 | -0,0218 | |||
| AIT / Applied Industrial Technologies, Inc. | 0,01 | 0,00 | 2,61 | 12,31 | 0,2752 | 0,0008 | |||
| PR / Permian Resources Corporation | 0,20 | 0,00 | 2,59 | -6,03 | 0,2726 | -0,0522 | |||
| NXST / Nexstar Media Group, Inc. | 0,01 | 0,00 | 2,52 | 14,33 | 0,2658 | 0,0055 | |||
| EHC / Encompass Health Corporation | 0,02 | 0,00 | 2,51 | 3,59 | 0,2645 | -0,0214 | |||
| SNX / TD SYNNEX Corporation | 0,01 | 50,00 | 2,46 | 80,99 | 0,2589 | 0,0988 | |||
| KODK / Eastman Kodak Company | 0,37 | 38,65 | 2,40 | 57,31 | 0,2530 | 0,0729 | |||
| BCO / The Brink's Company | 0,02 | 0,00 | 2,34 | 30,92 | 0,2464 | 0,0356 | |||
| SF / Stifel Financial Corp. | 0,02 | 0,00 | 2,31 | 9,34 | 0,2431 | -0,0058 | |||
| COR / Cencora, Inc. | 0,01 | 0,00 | 2,29 | 4,24 | 0,2412 | -0,0179 | |||
| CASY / Casey's General Stores, Inc. | 0,00 | 0,00 | 2,26 | 10,78 | 0,2384 | -0,0025 | |||
| SNOW / Snowflake Inc. | 0,01 | 2,26 | 0,2378 | 0,2378 | |||||
| CPAY / Corpay, Inc. | 0,01 | -28,03 | 2,22 | -37,52 | 0,2339 | -0,1852 | |||
| NNI / Nelnet, Inc. | 0,02 | 0,00 | 2,16 | 3,50 | 0,2274 | -0,0185 | |||
| ICLR / ICON Public Limited Company | 0,01 | 2,14 | 0,2260 | 0,2260 | |||||
| FICO / Fair Isaac Corporation | 0,00 | -36,08 | 2,12 | -47,68 | 0,2236 | -0,2548 | |||
| FLR / Fluor Corporation | 0,05 | 0,00 | 2,10 | -17,95 | 0,2217 | -0,0808 | |||
| ZS / Zscaler, Inc. | 0,01 | 0,00 | 2,10 | -4,55 | 0,2211 | -0,0383 | |||
| BLDR / Builders FirstSource, Inc. | 0,02 | 0,00 | 2,07 | 3,92 | 0,2178 | -0,0169 | |||
| HZO / MarineMax, Inc. | 0,08 | 11,07 | 2,05 | 11,93 | 0,2157 | -0,0001 | |||
| COST / Costco Wholesale Corporation | 0,00 | 0,00 | 1,97 | -6,51 | 0,2076 | -0,0410 | |||
| AMP / Ameriprise Financial, Inc. | 0,00 | 0,00 | 1,97 | -7,92 | 0,2071 | -0,0448 | |||
| BIL / SPDR Series Trust - State Street SPDR Bloomberg 1-3 Month T-Bill ETF | 0,02 | 21,13 | 1,90 | 21,14 | 0,2000 | 0,0152 | |||
| CVLT / Commvault Systems, Inc. | 0,01 | -33,33 | 1,89 | -27,81 | 0,1990 | -0,1096 | |||
| KMX / CarMax, Inc. | 0,04 | 0,00 | 1,84 | -33,25 | 0,1939 | -0,1313 | |||
| PTC / PTC Inc. | 0,01 | 125,00 | 1,83 | 165,17 | 0,1926 | 0,1113 | |||
| BOOT / Boot Barn Holdings, Inc. | 0,01 | 0,00 | 1,81 | 9,03 | 0,1910 | -0,0051 | |||
| AIR / AAR Corp. | 0,02 | 1,79 | 0,1891 | 0,1891 | |||||
| UNH / UnitedHealth Group Incorporated | 0,01 | 0,00 | 1,79 | 10,66 | 0,1884 | -0,0022 | |||
| ORCL / Oracle Corporation | 0,01 | -10,00 | 1,74 | 15,73 | 0,1831 | 0,0060 | |||
| EHAB / Enhabit, Inc. | 0,21 | 0,00 | 1,67 | -16,92 | 0,1760 | -0,0611 | |||
| BR / Broadridge Financial Solutions, Inc. | 0,01 | 0,00 | 1,67 | -2,00 | 0,1758 | -0,0250 | |||
| MASS / 908 Devices Inc. | 0,19 | 0,00 | 1,66 | 22,90 | 0,1755 | 0,0156 | |||
| DECK / Deckers Outdoor Corporation | 0,02 | -30,15 | 1,64 | -31,30 | 0,1733 | -0,1091 | |||
| BARK / BARK, Inc. | 1,97 | 0,00 | 1,64 | -5,53 | 0,1729 | -0,0320 | |||
| JEF / Jefferies Financial Group Inc. | 0,03 | 0,00 | 1,64 | 19,60 | 0,1724 | 0,0110 | |||
| WTTR / Select Water Solutions, Inc. | 0,15 | 1,60 | 0,1690 | 0,1690 | |||||
| CNC / Centene Corporation | 0,04 | 15,53 | 1,59 | -24,08 | 0,1679 | -0,0797 | |||
| LLY / Eli Lilly and Company | 0,00 | 0,00 | 1,59 | -2,15 | 0,1678 | -0,0241 | |||
| SAIC / Science Applications International Corporation | 0,02 | 0,00 | 1,59 | -11,77 | 0,1676 | -0,0451 | |||
| CDXS / Codexis, Inc. | 0,64 | -9,28 | 1,55 | -9,30 | 0,1635 | -0,0383 | |||
| LKQ / LKQ Corporation | 0,05 | 0,00 | 1,53 | -17,46 | 0,1610 | -0,0574 | |||
| EPAM / EPAM Systems, Inc. | 0,01 | 0,00 | 1,51 | -14,76 | 0,1590 | -0,0497 | |||
| ONON / On Holding AG | 0,04 | 0,00 | 1,50 | -18,62 | 0,1585 | -0,0596 | |||
| VAC / Marriott Vacations Worldwide Corporation | 0,02 | 0,00 | 1,46 | -7,92 | 0,1544 | -0,0334 | |||
| WFRD / Weatherford International plc | 0,02 | 0,00 | 1,41 | 35,98 | 0,1483 | 0,0262 | |||
| MNDY / monday.com Ltd. | 0,01 | 0,00 | 1,36 | -38,44 | 0,1429 | -0,1169 | |||
| ATMU / Atmus Filtration Technologies Inc. | 0,03 | 0,00 | 1,35 | 23,81 | 0,1426 | 0,0136 | |||
| SEAT / Vivid Seats Inc. | 0,08 | 1,33 | 0,1402 | 0,1402 | |||||
| GTX / Garrett Motion Inc. | 0,10 | 0,00 | 1,30 | 29,65 | 0,1374 | 0,0187 | |||
| PNR / Pentair plc | 0,01 | 0,00 | 1,30 | 7,88 | 0,1371 | -0,0052 | |||
| APO / Apollo Global Management, Inc. | 0,01 | 0,00 | 1,22 | -6,09 | 0,1286 | -0,0247 | |||
| AXP / American Express Company | 0,00 | 0,00 | 1,22 | 4,11 | 0,1282 | -0,0096 | |||
| WMT / Walmart Inc. | 0,01 | 0,00 | 1,21 | 5,33 | 0,1271 | -0,0079 | |||
| SLP / Simulations Plus, Inc. | 0,08 | 0,00 | 1,21 | -13,68 | 0,1271 | -0,0377 | |||
| NATL / NCR Atleos Corporation | 0,03 | 200,00 | 1,18 | 313,68 | 0,1243 | 0,0906 | |||
| GWRE / Guidewire Software, Inc. | 0,01 | 0,00 | 1,15 | -2,38 | 0,1212 | -0,0178 | |||
| SPSC / SPS Commerce, Inc. | 0,01 | 0,00 | 1,15 | -23,46 | 0,1208 | -0,0559 | |||
| AME / AMETEK, Inc. | 0,01 | 0,00 | 1,13 | 3,96 | 0,1189 | -0,0092 | |||
| FWRD / Forward Air Corporation | 0,04 | 0,00 | 1,13 | 4,46 | 0,1187 | -0,0085 | |||
| RS / Reliance, Inc. | 0,00 | 1,12 | 0,1184 | 0,1184 | |||||
| IQV / IQVIA Holdings Inc. | 0,01 | 0,00 | 1,12 | 20,56 | 0,1181 | 0,0084 | |||
| SPIR / Spire Global, Inc. | 0,10 | 0,00 | 1,10 | -7,65 | 0,1159 | -0,0246 | |||
| MED / Medifast, Inc. | 0,08 | 0,00 | 1,09 | -2,67 | 0,1152 | -0,0174 | |||
| BILL / BILL Holdings, Inc. | 0,02 | 0,00 | 1,06 | 14,49 | 0,1117 | 0,0025 | |||
| ACIW / ACI Worldwide, Inc. | 0,02 | 0,00 | 1,06 | 14,92 | 0,1113 | 0,0029 | |||
| ALTI / AlTi Global, Inc. | 0,29 | 1,04 | 0,1095 | 0,1095 | |||||
| BKSY / BlackSky Technology Inc. | 0,05 | 0,00 | 1,03 | -2,10 | 0,1083 | -0,0155 | |||
| FTNT / Fortinet, Inc. | 0,01 | -49,74 | 1,01 | -60,06 | 0,1064 | -0,1916 | |||
| NKE / NIKE, Inc. | 0,01 | 0,00 | 1,00 | -1,86 | 0,1058 | -0,0149 | |||
| VTWO / Vanguard Scottsdale Funds - Vanguard Russell 2000 ETF | 0,01 | 0,00 | 0,98 | 12,16 | 0,1031 | 0,0002 | |||
| GOOG / Alphabet Inc. | 0,00 | 0,00 | 0,97 | 38,07 | 0,1025 | 0,0193 | |||
| CAR / Avis Budget Group, Inc. | 0,01 | -57,14 | 0,96 | -59,30 | 0,1016 | -0,1778 | |||
| HSY / The Hershey Company | 0,01 | 0,00 | 0,94 | 12,79 | 0,0986 | 0,0007 | |||
| AMZN / Amazon.com, Inc. | 0,00 | 0,00 | 0,91 | 0,11 | 0,0962 | -0,0114 | |||
| FTRE / Fortrea Holdings Inc. | 0,11 | -25,39 | 0,89 | 27,14 | 0,0939 | 0,0112 | |||
| CARR / Carrier Global Corporation | 0,01 | 0,89 | 0,0936 | 0,0936 | |||||
| BTSG / BrightSpring Health Services, Inc. | 0,03 | 0,89 | 0,0935 | 0,0935 | |||||
| JCI / Johnson Controls International plc | 0,01 | 0,00 | 0,88 | 4,15 | 0,0927 | -0,0070 | |||
| NC / NACCO Industries, Inc. | 0,02 | 0,00 | 0,85 | -4,83 | 0,0894 | -0,0158 | |||
| CRAI / CRA International, Inc. | 0,00 | 0,00 | 0,83 | 11,35 | 0,0879 | -0,0005 | |||
| SGC / Superior Group of Companies, Inc. | 0,07 | -0,13 | 0,79 | 3,93 | 0,0836 | -0,0065 | |||
| IAG / IAMGOLD Corporation | 0,06 | 0,00 | 0,78 | 75,74 | 0,0818 | 0,0297 | |||
| NXT / Nextpower Inc. | 0,01 | 0,00 | 0,77 | 36,09 | 0,0815 | 0,0145 | |||
| PENN / PENN Entertainment, Inc. | 0,04 | -33,33 | 0,77 | -28,17 | 0,0812 | -0,0453 | |||
| RTO / Rentokil Initial plc - Depositary Receipt (Common Stock) | 0,03 | 0,00 | 0,76 | 5,14 | 0,0799 | -0,0051 | |||
| AVGO / Broadcom Inc. | 0,00 | 0,00 | 0,75 | 19,68 | 0,0795 | 0,0051 | |||
| NMRK / Newmark Group, Inc. | 0,04 | 0,00 | 0,75 | 53,50 | 0,0786 | 0,0213 | |||
| CYH / Community Health Systems, Inc. | 0,23 | 0,00 | 0,74 | -5,48 | 0,0782 | -0,0145 | |||
| LRCX / Lam Research Corporation | 0,01 | 0,00 | 0,74 | 37,69 | 0,0778 | 0,0145 | |||
| ANET / Arista Networks Inc | 0,00 | 0,00 | 0,71 | 42,48 | 0,0750 | 0,0160 | |||
| VSTS / Vestis Corporation | 0,16 | 0,00 | 0,70 | -20,99 | 0,0743 | -0,0309 | |||
| ALCO / Alico, Inc. | 0,02 | 0,00 | 0,69 | 6,13 | 0,0731 | -0,0041 | |||
| ADBE / Adobe Inc. | 0,00 | 0,00 | 0,67 | -8,84 | 0,0707 | -0,0161 | |||
| NVDA / NVIDIA Corporation | 0,00 | 0,00 | 0,66 | 18,13 | 0,0694 | 0,0036 | |||
| WM / Waste Management, Inc. | 0,00 | 0,00 | 0,63 | -3,54 | 0,0662 | -0,0106 | |||
| SABR / Sabre Corporation | 0,34 | 27,72 | 0,62 | -25,98 | 0,0658 | -0,0338 | |||
| KLAC / KLA Corporation | 0,00 | 0,00 | 0,62 | 20,58 | 0,0655 | 0,0046 | |||
| GOOGL / Alphabet Inc. | 0,00 | 0,00 | 0,62 | 38,03 | 0,0651 | 0,0123 | |||
| SKIN / The Beauty Health Company | 0,30 | -63,69 | 0,60 | -62,22 | 0,0637 | -0,1248 | |||
| MPWR / Monolithic Power Systems, Inc. | 0,00 | 0,00 | 0,60 | 25,79 | 0,0628 | 0,0069 | |||
| HBI / Hanesbrands Inc. | 0,09 | 0,59 | 0,0625 | 0,0625 | |||||
| AXON / Axon Enterprise, Inc. | 0,00 | 0,00 | 0,59 | -13,36 | 0,0623 | -0,0182 | |||
| NFLX / Netflix, Inc. | 0,00 | 0,00 | 0,56 | -10,49 | 0,0594 | -0,0149 | |||
| VATE / INNOVATE Corp. | 0,11 | -17,50 | 0,55 | -21,60 | 0,0578 | -0,0248 | |||
| AGCO / AGCO Corporation | 0,01 | 0,54 | 0,0564 | 0,0564 | |||||
| ETN / Eaton Corporation plc | 0,00 | 0,00 | 0,53 | 4,92 | 0,0562 | -0,0038 | |||
| EDU / New Oriental Education & Technology Group Inc. - Depositary Receipt (Common Stock) | 0,01 | 0,00 | 0,53 | -1,67 | 0,0559 | -0,0077 | |||
| PDFS / PDF Solutions, Inc. | 0,02 | 0,52 | 0,0544 | 0,0544 | |||||
| TRAK / ReposiTrak, Inc. | 0,03 | 30,44 | 0,51 | -1,55 | 0,0536 | -0,0074 | |||
| META / Meta Platforms, Inc. | 0,00 | 0,00 | 0,50 | -0,59 | 0,0531 | -0,0067 | |||
| BX / Blackstone Inc. | 0,00 | 0,00 | 0,50 | 14,35 | 0,0530 | 0,0010 | |||
| FOA / Finance of America Companies Inc. | 0,02 | 0,49 | 0,0520 | 0,0520 | |||||
| TT / Trane Technologies plc | 0,00 | 0,00 | 0,49 | -3,55 | 0,0516 | -0,0083 | |||
| SNDA / Sonida Senior Living, Inc. | 0,02 | 0,00 | 0,49 | 10,93 | 0,0514 | -0,0004 | |||
| AAPL / Apple Inc. | 0,00 | 0,00 | 0,49 | 24,04 | 0,0512 | 0,0050 | |||
| PANW / Palo Alto Networks, Inc. | 0,00 | 0,00 | 0,47 | -0,42 | 0,0500 | -0,0063 | |||
| MELI / MercadoLibre, Inc. | 0,00 | 0,00 | 0,47 | -10,44 | 0,0498 | -0,0125 | |||
| INTU / Intuit Inc. | 0,00 | 0,00 | 0,47 | -13,36 | 0,0493 | -0,0144 | |||
| SBUX / Starbucks Corporation | 0,01 | 0,00 | 0,46 | -7,85 | 0,0484 | -0,0103 | |||
| MA / Mastercard Incorporated | 0,00 | 0,00 | 0,45 | 1,12 | 0,0476 | -0,0051 | |||
| HD / The Home Depot, Inc. | 0,00 | 0,00 | 0,44 | 10,33 | 0,0463 | -0,0006 | |||
| MCO / Moody's Corporation | 0,00 | 0,00 | 0,43 | -5,08 | 0,0454 | -0,0081 | |||
| LIN / Linde plc | 0,00 | 0,00 | 0,43 | 1,18 | 0,0453 | -0,0048 | |||
| BRK.B / Berkshire Hathaway Inc. | 0,00 | 0,00 | 0,43 | 3,40 | 0,0450 | -0,0037 | |||
| MSCI / MSCI Inc. | 0,00 | 0,00 | 0,41 | -1,67 | 0,0436 | -0,0060 | |||
| TDG / TransDigm Group Incorporated | 0,00 | 0,00 | 0,41 | -13,46 | 0,0428 | -0,0125 | |||
| SHW / The Sherwin-Williams Company | 0,00 | 0,00 | 0,40 | 0,75 | 0,0426 | -0,0047 | |||
| SPGI / S&P Global Inc. | 0,00 | 0,00 | 0,40 | -7,59 | 0,0424 | -0,0090 | |||
| TMO / Thermo Fisher Scientific Inc. | 0,00 | 0,00 | 0,40 | 19,70 | 0,0417 | 0,0027 | |||
| PGR / The Progressive Corporation | 0,00 | 0,00 | 0,38 | -7,28 | 0,0403 | -0,0085 | |||
| MP / MP Materials Corp. | 0,01 | -95,32 | 0,37 | -90,59 | 0,0387 | -0,4215 | |||
| ISRG / Intuitive Surgical, Inc. | 0,00 | 0,00 | 0,36 | -17,70 | 0,0378 | -0,0136 | |||
| BRO / Brown & Brown, Inc. | 0,00 | 0,00 | 0,35 | -15,35 | 0,0373 | -0,0121 | |||
| VRTX / Vertex Pharmaceuticals Incorporated | 0,00 | 0,00 | 0,34 | -11,92 | 0,0359 | -0,0098 | |||
| CPRT / Copart, Inc. | 0,01 | 0,00 | 0,33 | -8,49 | 0,0353 | -0,0078 | |||
| CRDO / Credo Technology Group Holding Ltd | 0,00 | 0,29 | 0,0307 | 0,0307 | |||||
| CATO / The Cato Corporation | 0,07 | -33,33 | 0,29 | 0,00 | 0,0301 | -0,0036 | |||
| ILMN / Illumina, Inc. | 0,00 | -66,67 | 0,28 | -66,90 | 0,0300 | -0,0713 | |||
| IT / Gartner, Inc. | 0,00 | -88,94 | 0,24 | -92,82 | 0,0248 | -0,3614 | |||
| FOSL / Fossil Group, Inc. | 0,07 | 0,17 | 0,0180 | 0,0180 | |||||
| QRHC / Quest Resource Holding Corporation | 0,03 | 0,00 | 0,05 | -22,86 | 0,0057 | -0,0026 | |||
| BOX / Box, Inc. | 0,00 | -100,00 | 0,00 | 0,0000 | |||||
| NEO / NeoGenomics, Inc. | 0,00 | -100,00 | 0,00 | -100,00 | -0,0345 | ||||
| HUM / Humana Inc. | 0,00 | -100,00 | 0,00 | 0,0000 | |||||
| AGS / AGS LLC | 0,00 | -100,00 | 0,00 | 0,0000 | |||||
| MANH / Manhattan Associates, Inc. | 0,00 | -100,00 | 0,00 | 0,0000 | |||||
| DNA / Ginkgo Bioworks Holdings, Inc. | 0,00 | -100,00 | 0,00 | 0,0000 | |||||
| TYL / Tyler Technologies, Inc. | 0,00 | -100,00 | 0,00 | 0,0000 | |||||
| CNXC / Concentrix Corporation | 0,00 | -100,00 | 0,00 | 0,0000 | |||||
| PTEN / Patterson-UTI Energy, Inc. | 0,00 | -100,00 | 0,00 | 0,0000 | |||||
| GDRX / GoodRx Holdings, Inc. | 0,00 | -100,00 | 0,00 | 0,0000 | |||||
| FARO / FARO Technologies, Inc. | 0,00 | -100,00 | 0,00 | 0,0000 | |||||
| SKX / Skechers U.S.A., Inc. | 0,00 | -100,00 | 0,00 | 0,0000 | |||||
| MMC / Marsh & McLennan Companies, Inc. | 0,00 | -100,00 | 0,00 | 0,0000 | |||||
| EAF / GrafTech International Ltd. | 0,00 | -100,00 | 0,00 | 0,0000 | |||||
| LULU / lululemon athletica inc. | 0,00 | -100,00 | 0,00 | 0,0000 | |||||
| TLS / Telos Corporation | 0,00 | -100,00 | 0,00 | 0,0000 | |||||
| FNF / Fidelity National Financial, Inc. | 0,00 | -100,00 | 0,00 | -100,00 | -0,3739 |