Grundlæggende statistik
| Porteføljeværdi | $ 74.890.927 |
| Nuværende stillinger | 92 |
Seneste beholdninger, ydeevne, AUM (fra 13F, 13D)
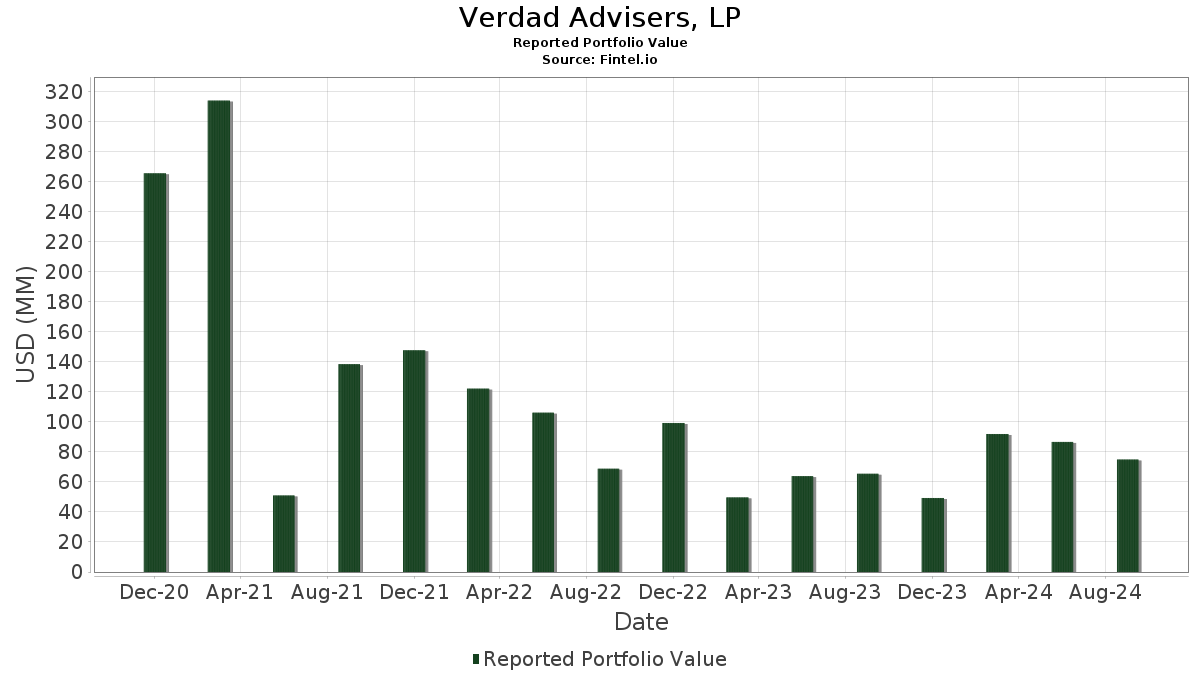
Verdad Advisers, LP har afsløret 92 samlede besiddelser i deres seneste SEC-arkivering. Den seneste porteføljeværdi er beregnet til at være $ 74.890.927 USD. Faktiske aktiver under forvaltning (AUM) er denne værdi plus kontanter (som ikke er oplyst). Verdad Advisers, LPs største beholdninger er Berkshire Hathaway Inc. (US:BRK.A) , The TJX Companies, Inc. (US:TJX) , T-Mobile US, Inc. (US:TMUS) , Walmart Inc. (US:WMT) , and Microsoft Corporation (US:MSFT) . Verdad Advisers, LPs nye stillinger omfatter Lockheed Martin Corporation (US:LMT) , RTX Corporation (US:RTX) , Motorola Solutions, Inc. (US:MSI) , Cisco Systems, Inc. (US:CSCO) , and Northrop Grumman Corporation (US:NOC) .
Top øger dette kvartal
Vi bruger ændringen i porteføljeallokeringen, fordi dette er den mest meningsfulde metrik. Ændringer kan skyldes handler eller ændringer i aktiekurser.
| Sikkerhed | Aktier (MM) |
Værdi (MM$) |
Portefølje % | ΔPortefølje % |
|---|---|---|---|---|
| BRK.A / Berkshire Hathaway Inc. | 0,01 | 4,65 | 6,1643 | 3,0507 |
| AAPL / Apple Inc. | 0,01 | 1,89 | 2,5263 | 2,0250 |
| LMT / Lockheed Martin Corporation | 0,00 | 1,37 | 1,8249 | 1,8249 |
| MSFT / Microsoft Corporation | 0,01 | 2,36 | 3,1550 | 1,6773 |
| TJX / The TJX Companies, Inc. | 0,03 | 3,74 | 4,9932 | 1,5812 |
| RTX / RTX Corporation | 0,01 | 1,01 | 1,3365 | 1,3365 |
| TMUS / T-Mobile US, Inc. | 0,01 | 2,80 | 3,7433 | 1,1947 |
| MSI / Motorola Solutions, Inc. | 0,00 | 0,88 | 1,1761 | 1,1761 |
| CSCO / Cisco Systems, Inc. | 0,02 | 0,83 | 1,1052 | 1,1052 |
| NOC / Northrop Grumman Corporation | 0,00 | 0,79 | 1,0484 | 1,0484 |
Top falder i dette kvartal
Vi bruger ændringen i porteføljeallokeringen, fordi dette er den mest meningsfulde metrik. Ændringer kan skyldes handler eller ændringer i aktiekurser.
| Sikkerhed | Aktier (MM) |
Værdi (MM$) |
Portefølje % | ΔPortefølje % |
|---|---|---|---|---|
| NVDA / NVIDIA Corporation | 0,00 | 0,00 | -1,5054 | |
| AMZN / Amazon.com, Inc. | 0,00 | 0,52 | 0,6986 | -0,8669 |
| COST / Costco Wholesale Corporation | 0,00 | 0,82 | 1,0997 | -0,8252 |
| GOOGL / Alphabet Inc. | 0,00 | 0,38 | 0,5140 | -0,8230 |
| PCAR / PACCAR Inc | 0,00 | 0,00 | -0,7880 | |
| REGN / Regeneron Pharmaceuticals, Inc. | 0,00 | 0,68 | 0,8964 | -0,7300 |
| COR / Cencora, Inc. | 0,00 | 0,97 | 1,2832 | -0,7243 |
| CMG / Chipotle Mexican Grill, Inc. | 0,00 | 0,00 | -0,7199 | |
| ANF / Abercrombie & Fitch Co. | 0,00 | 0,00 | -0,6471 | |
| LLY / Eli Lilly and Company | 0,00 | 0,00 | -0,6430 |
13F og Fondsarkivering
Denne formular blev indsendt den 2024-11-14 for rapporteringsperioden 2024-09-30. Klik på linkikonet for at se den fulde transaktionshistorik.
Opgrader for at låse op for premium-data og eksportere til Excel ![]() .
.
| Sikkerhed | Type | Gennemsnitlig aktiekurs | Aktier (MM) |
Δ Aktier (%) |
Værdi ($MM) |
Δ Aktier (%) |
Portefølje (%) |
ΔPortefølje (%) |
|
|---|---|---|---|---|---|---|---|---|---|
| BRK.A / Berkshire Hathaway Inc. | 0,01 | 52,37 | 4,65 | 72,40 | 6,1643 | 3,0507 | |||
| TJX / The TJX Companies, Inc. | 0,03 | 18,55 | 3,74 | 26,57 | 4,9932 | 1,5812 | |||
| TMUS / T-Mobile US, Inc. | 0,01 | 8,45 | 2,80 | 27,00 | 3,7433 | 1,1947 | |||
| WMT / Walmart Inc. | 0,03 | -5,32 | 2,64 | 12,92 | 3,5009 | 0,8010 | |||
| MSFT / Microsoft Corporation | 0,01 | 91,79 | 2,36 | 84,68 | 3,1550 | 1,6773 | |||
| AAPL / Apple Inc. | 0,01 | 293,98 | 1,89 | 335,71 | 2,5263 | 2,0250 | |||
| GWW / W.W. Grainger, Inc. | 0,00 | 32,71 | 1,69 | 52,77 | 2,2359 | 0,9617 | |||
| ELV / Elevance Health, Inc. | 0,00 | 3,95 | 1,63 | -0,24 | 2,1761 | 0,2895 | |||
| JLL / Jones Lang LaSalle Incorporated | 0,01 | -4,68 | 1,61 | 25,27 | 2,1369 | 0,6517 | |||
| LMT / Lockheed Martin Corporation | 0,00 | 1,37 | 1,8249 | 1,8249 | |||||
| MRK / Merck & Co., Inc. | 0,01 | 0,00 | 1,36 | -8,29 | 1,8178 | 0,1039 | |||
| KR / The Kroger Co. | 0,02 | -5,01 | 1,32 | 9,01 | 1,7625 | 0,3642 | |||
| SNX / TD SYNNEX Corporation | 0,01 | 0,00 | 1,31 | 4,12 | 1,7548 | 0,2963 | |||
| IBM / International Business Machines Corporation | 0,01 | 4,66 | 1,26 | 33,80 | 1,6759 | 0,5926 | |||
| UNH / UnitedHealth Group Incorporated | 0,00 | 26,21 | 1,02 | 44,95 | 1,3515 | 0,5394 | |||
| RTX / RTX Corporation | 0,01 | 1,01 | 1,3365 | 1,3365 | |||||
| MG / Mistras Group, Inc. | 0,09 | -19,24 | 0,97 | 10,82 | 1,2907 | 0,2760 | |||
| COR / Cencora, Inc. | 0,00 | -44,28 | 0,97 | -44,36 | 1,2832 | -0,7243 | |||
| CFG / Citizens Financial Group, Inc. | 0,01 | -1,22 | 0,96 | -14,51 | 1,2828 | -0,0150 | |||
| ACI / Albertsons Companies, Inc. | 0,05 | 0,00 | 0,94 | -6,45 | 1,2503 | 0,0868 | |||
| INTU / Intuit Inc. | 0,00 | 1,43 | 0,92 | -4,15 | 1,2347 | 0,1206 | |||
| STLA / Stellantis N.V. | 0,06 | -17,16 | 0,91 | -41,35 | 1,2003 | -0,5823 | |||
| MSI / Motorola Solutions, Inc. | 0,00 | 0,88 | 1,1761 | 1,1761 | |||||
| ASO / Academy Sports and Outdoors, Inc. | 0,01 | -16,67 | 0,88 | -8,66 | 1,1609 | 0,0541 | |||
| JNJ / Johnson & Johnson | 0,01 | 7,55 | 0,84 | 19,37 | 1,1114 | 0,2998 | |||
| CSCO / Cisco Systems, Inc. | 0,02 | 0,83 | 1,1052 | 1,1052 | |||||
| COST / Costco Wholesale Corporation | 0,00 | -52,63 | 0,82 | -50,60 | 1,0997 | -0,8252 | |||
| IBKR / Interactive Brokers Group, Inc. | 0,01 | 39,58 | 0,81 | 58,86 | 1,0708 | 0,4831 | |||
| NOC / Northrop Grumman Corporation | 0,00 | 0,79 | 1,0484 | 1,0484 | |||||
| NUE / Nucor Corporation | 0,01 | -3,79 | 0,79 | -8,46 | 1,0553 | 0,0579 | |||
| BSX / Boston Scientific Corporation | 0,01 | -19,21 | 0,75 | -12,08 | 1,0016 | 0,0162 | |||
| VRTX / Vertex Pharmaceuticals Incorporated | 0,00 | 0,75 | 1,0004 | 1,0004 | |||||
| XOM / Exxon Mobil Corporation | 0,01 | 27,10 | 0,74 | 29,40 | 0,9756 | 0,3192 | |||
| RS / Reliance, Inc. | 0,00 | 0,00 | 0,72 | 1,26 | 0,9654 | 0,1409 | |||
| VLGEA / Village Super Market, Inc. | 0,02 | 12,50 | 0,72 | 35,42 | 0,9486 | 0,3386 | |||
| V / Visa Inc. | 0,00 | 102,52 | 0,71 | 112,65 | 0,9428 | 0,5585 | |||
| VTRS / Viatris Inc. | 0,06 | -20,00 | 0,70 | -12,67 | 0,9302 | 0,0095 | |||
| T / AT&T Inc. | 0,03 | 0,69 | 0,9183 | 0,9183 | |||||
| REGN / Regeneron Pharmaceuticals, Inc. | 0,00 | -52,01 | 0,68 | -52,06 | 0,8964 | -0,7300 | |||
| ABBV / AbbVie Inc. | 0,00 | 0,68 | 0,9023 | 0,9023 | |||||
| PGR / The Progressive Corporation | 0,00 | -24,82 | 0,67 | -8,15 | 0,8888 | 0,0519 | |||
| JNPR / Juniper Networks, Inc. | 0,02 | 61,69 | 0,66 | 72,92 | 0,8808 | 0,4371 | |||
| SNFCA / Security National Financial Corporation | 0,07 | 3,52 | 0,66 | 19,10 | 0,8777 | 0,2365 | |||
| LOW / Lowe's Companies, Inc. | 0,01 | 0,00 | 0,66 | 5,79 | 0,8794 | 0,1603 | |||
| HIG / The Hartford Insurance Group, Inc. | 0,01 | -56,68 | 0,66 | -49,35 | 0,8733 | -0,6272 | |||
| SFM / Sprouts Farmers Market, Inc. | 0,01 | -13,83 | 0,64 | 13,73 | 0,8527 | 0,2043 | |||
| JILL / J.Jill, Inc. | 0,03 | 42,86 | 0,62 | 0,82 | 0,8179 | 0,1112 | |||
| HRTG / Heritage Insurance Holdings, Inc. | 0,05 | -10,00 | 0,61 | 55,53 | 0,8035 | 0,3538 | |||
| CHKP / Check Point Software Technologies Ltd. | 0,00 | -53,82 | 0,57 | -46,10 | 0,7612 | -0,4670 | |||
| ACN / Accenture plc | 0,00 | 0,57 | 0,7580 | 0,7580 | |||||
| PKOH / Park-Ohio Holdings Corp. | 0,02 | 4,57 | 0,56 | 23,84 | 0,7451 | 0,2219 | |||
| ADBE / Adobe Inc. | 0,00 | 0,55 | 0,7322 | 0,7322 | |||||
| DUK / Duke Energy Corporation | 0,00 | 0,54 | 0,7211 | 0,7211 | |||||
| LRN / Stride, Inc. | 0,01 | 0,00 | 0,53 | 20,86 | 0,7129 | 0,2034 | |||
| MMC / Marsh & McLennan Companies, Inc. | 0,00 | 0,53 | 0,7066 | 0,7066 | |||||
| AMZN / Amazon.com, Inc. | 0,00 | -59,97 | 0,52 | -61,40 | 0,6986 | -0,8669 | |||
| WM / Waste Management, Inc. | 0,00 | 0,52 | 0,6935 | 0,6935 | |||||
| CNC / Centene Corporation | 0,01 | -38,95 | 0,52 | -30,67 | 0,6949 | -0,1721 | |||
| JPM / JPMorgan Chase & Co. | 0,00 | 0,51 | 0,6819 | 0,6819 | |||||
| SPGI / S&P Global Inc. | 0,00 | 0,51 | 0,6809 | 0,6809 | |||||
| CME / CME Group Inc. | 0,00 | 0,50 | 0,6712 | 0,6712 | |||||
| RL / Ralph Lauren Corporation | 0,00 | 0,00 | 0,50 | 10,69 | 0,6595 | 0,1409 | |||
| SND / Smart Sand, Inc. | 0,25 | 0,00 | 0,49 | -6,64 | 0,6576 | 0,0485 | |||
| PAGP / Plains GP Holdings, L.P. - Limited Partnership | 0,03 | 0,00 | 0,48 | -1,65 | 0,6328 | 0,0722 | |||
| LIN / Linde plc | 0,00 | -17,30 | 0,47 | -10,02 | 0,6240 | 0,0235 | |||
| SGC / Superior Group of Companies, Inc. | 0,03 | 0,00 | 0,46 | -18,17 | 0,6205 | -0,0346 | |||
| EOG / EOG Resources, Inc. | 0,00 | 0,45 | 0,6021 | 0,6021 | |||||
| CRM / Salesforce, Inc. | 0,00 | 0,45 | 0,6001 | 0,6001 | |||||
| FFWM / First Foundation Inc. | 0,07 | -12,50 | 0,44 | -16,79 | 0,5832 | -0,0219 | |||
| ULH / Universal Logistics Holdings, Inc. | 0,01 | -20,00 | 0,43 | -14,99 | 0,5717 | -0,0142 | |||
| MCS / The Marcus Corporation | 0,03 | -31,25 | 0,41 | -8,81 | 0,5496 | 0,0244 | |||
| FLEX / Flex Ltd. | 0,01 | -29,10 | 0,41 | -19,61 | 0,5493 | -0,0459 | |||
| TRV / The Travelers Companies, Inc. | 0,00 | -38,37 | 0,41 | -29,04 | 0,5415 | -0,1230 | |||
| OMI / Accendra Health, Inc. | 0,03 | 11,11 | 0,39 | 29,37 | 0,5238 | 0,1730 | |||
| GOOGL / Alphabet Inc. | 0,00 | -63,48 | 0,38 | -66,81 | 0,5140 | -0,8230 | |||
| FI / Fiserv, Inc. | 0,00 | -18,57 | 0,38 | -1,83 | 0,5016 | 0,0596 | |||
| CVX / Chevron Corporation | 0,00 | 0,37 | 0,4952 | 0,4952 | |||||
| PEP / PepsiCo, Inc. | 0,00 | 0,37 | 0,4930 | 0,4930 | |||||
| ADP / Automatic Data Processing, Inc. | 0,00 | 0,37 | 0,4914 | 0,4914 | |||||
| BRY / Berry Corporation | 0,07 | 0,36 | 0,4828 | 0,4828 | |||||
| ZEUS / Olympic Steel, Inc. | 0,01 | 20,00 | 0,35 | 4,46 | 0,4655 | 0,0772 | |||
| ZM / Zoom Communications, Inc. | 0,01 | 0,35 | 0,4676 | 0,4676 | |||||
| MUSA / Murphy USA Inc. | 0,00 | -64,46 | 0,35 | -62,75 | 0,4673 | -0,6159 | |||
| RYI / Ryerson Holding Corporation | 0,02 | 0,00 | 0,35 | 2,05 | 0,4652 | 0,0712 | |||
| FDX / FedEx Corporation | 0,00 | 0,33 | 0,4439 | 0,4439 | |||||
| RSG / Republic Services, Inc. | 0,00 | -47,35 | 0,32 | -45,73 | 0,4230 | -0,2539 | |||
| CXW / CoreCivic, Inc. | 0,03 | -58,33 | 0,32 | -59,38 | 0,4194 | -0,4800 | |||
| O / Realty Income Corporation | 0,00 | 0,31 | 0,4193 | 0,4193 | |||||
| SPY / State Street SPDR S&P 500 ETF Trust | 0,00 | 0,27 | 0,3592 | 0,3592 | |||||
| AXNX / Axonics, Inc. | 0,00 | 0,27 | 0,3571 | 0,3571 | |||||
| CACI / CACI International Inc | 0,00 | 0,24 | 0,3247 | 0,3247 | |||||
| EDR / Endeavor Group Holdings, Inc. | 0,01 | 0,20 | 0,2710 | 0,2710 | |||||
| GM / General Motors Company | 0,00 | -100,00 | 0,00 | -100,00 | -0,4544 | ||||
| CI / The Cigna Group | 0,00 | -100,00 | 0,00 | 0,0000 | |||||
| DECK / Deckers Outdoor Corporation | 0,00 | -100,00 | 0,00 | 0,0000 | |||||
| APG / APi Group Corporation | 0,00 | -100,00 | 0,00 | 0,0000 | |||||
| NSIT / Insight Enterprises, Inc. | 0,00 | -100,00 | 0,00 | 0,0000 | |||||
| HYG / iShares Trust - iShares iBoxx $ High Yield Corporate Bond ETF | 0,00 | -100,00 | 0,00 | 0,0000 | |||||
| LRCX / Lam Research Corporation | 0,00 | -100,00 | 0,00 | 0,0000 | |||||
| MCK / McKesson Corporation | 0,00 | -100,00 | 0,00 | 0,0000 | |||||
| BLDR / Builders FirstSource, Inc. | 0,00 | -100,00 | 0,00 | 0,0000 | |||||
| CRBG / Corebridge Financial, Inc. | 0,00 | -100,00 | 0,00 | 0,0000 | |||||
| AMAT / Applied Materials, Inc. | 0,00 | -100,00 | 0,00 | 0,0000 | |||||
| ARC / ARC Document Solutions, Inc. | 0,00 | -100,00 | 0,00 | 0,0000 | |||||
| ROP / Roper Technologies, Inc. | 0,00 | -100,00 | 0,00 | 0,0000 | |||||
| ANF / Abercrombie & Fitch Co. | 0,00 | -100,00 | 0,00 | -100,00 | -0,6471 | ||||
| META / Meta Platforms, Inc. | 0,00 | -100,00 | 0,00 | -100,00 | -0,6422 | ||||
| AMR / Alpha Metallurgical Resources, Inc. | 0,00 | -100,00 | 0,00 | 0,0000 | |||||
| APP / AppLovin Corporation | 0,00 | -100,00 | 0,00 | -100,00 | -0,4357 | ||||
| WSM / Williams-Sonoma, Inc. | 0,00 | -100,00 | 0,00 | 0,0000 | |||||
| ADMA / ADMA Biologics, Inc. | 0,00 | -100,00 | 0,00 | 0,0000 | |||||
| GE / General Electric Company | 0,00 | -100,00 | 0,00 | -100,00 | -0,5693 | ||||
| CMG / Chipotle Mexican Grill, Inc. | 0,00 | -100,00 | 0,00 | -100,00 | -0,7199 | ||||
| EA / Electronic Arts Inc. | 0,00 | -100,00 | 0,00 | 0,0000 | |||||
| EME / EMCOR Group, Inc. | 0,00 | -100,00 | 0,00 | 0,0000 | |||||
| DKS / DICK'S Sporting Goods, Inc. | 0,00 | -100,00 | 0,00 | 0,0000 | |||||
| CASY / Casey's General Stores, Inc. | 0,00 | -100,00 | 0,00 | 0,0000 | |||||
| APO / Apollo Global Management, Inc. | 0,00 | -100,00 | 0,00 | 0,0000 | |||||
| NVDA / NVIDIA Corporation | 0,00 | -100,00 | 0,00 | -100,00 | -1,5054 | ||||
| THC / Tenet Healthcare Corporation | 0,00 | -100,00 | 0,00 | 0,0000 | |||||
| CRWD / CrowdStrike Holdings, Inc. | 0,00 | -100,00 | 0,00 | -100,00 | -0,5146 | ||||
| PSX / Phillips 66 | 0,00 | -100,00 | 0,00 | 0,0000 | |||||
| MU / Micron Technology, Inc. | 0,00 | -100,00 | 0,00 | -100,00 | -0,4655 | ||||
| LLY / Eli Lilly and Company | 0,00 | -100,00 | 0,00 | -100,00 | -0,6430 | ||||
| CVLT / Commvault Systems, Inc. | 0,00 | -100,00 | 0,00 | 0,0000 | |||||
| JXN / Jackson Financial Inc. | 0,00 | -100,00 | 0,00 | 0,0000 | |||||
| CB / Chubb Limited | 0,00 | -100,00 | 0,00 | 0,0000 | |||||
| PFGC / Performance Food Group Company | 0,00 | -100,00 | 0,00 | 0,0000 | |||||
| PH / Parker-Hannifin Corporation | 0,00 | -100,00 | 0,00 | 0,0000 | |||||
| MPC / Marathon Petroleum Corporation | 0,00 | -100,00 | 0,00 | 0,0000 | |||||
| ALL / The Allstate Corporation | 0,00 | -100,00 | 0,00 | 0,0000 | |||||
| VST / Vistra Corp. | 0,00 | -100,00 | 0,00 | 0,0000 | |||||
| CDNS / Cadence Design Systems, Inc. | 0,00 | -100,00 | 0,00 | 0,0000 | |||||
| PCAR / PACCAR Inc | 0,00 | -100,00 | 0,00 | -100,00 | -0,7880 | ||||
| CNM / Core & Main, Inc. | 0,00 | -100,00 | 0,00 | 0,0000 | |||||
| QCOM / QUALCOMM Incorporated | 0,00 | -100,00 | 0,00 | 0,0000 | |||||
| SKX / Skechers U.S.A., Inc. | 0,00 | -100,00 | 0,00 | 0,0000 | |||||
| SBOW / SilverBow Resources, Inc. | 0,00 | -100,00 | 0,00 | 0,0000 | |||||
| ACGL / Arch Capital Group Ltd. | 0,00 | -100,00 | 0,00 | 0,0000 |