Grundlæggende statistik
| Institutionelle ejere | 346 total, 344 long only, 0 short only, 2 long/short - change of -4,13% MRQ |
| Gennemsnitlig porteføljeallokering | 0.8710 % - change of -8,83% MRQ |
| Institutionelle aktier (lange) | 152.686.053 (ex 13D/G) - change of 13,16MM shares 9,44% MRQ |
| Institutionel værdi (lang) | $ 7.010.211 USD ($1000) |
Institutionelt ejerskab og aktionærer
Vanguard Scottsdale Funds - Vanguard Long-Term Corporate Bond ETF (US:VCLT) har 346 institutionelle ejere og aktionærer, der har indsendt 13D/G- eller 13F-formularer til Securities Exchange Commission (SEC). Disse institutioner har i alt 152,686,053 aktier. Største aktionærer omfatter Gallagher Fiduciary Advisors, LLC, Prudential Plc, Morgan Stanley, VTC - Vanguard Total Corporate Bond ETF ETF Shares, Meiji Yasuda Life Insurance Co, State of Tennessee, Treasury Department, Allianz Investment Management U.S. LLC, Bank Of America Corp /de/, Charles Schwab Investment Management Inc, and Angeles Investment Advisors, LLC .
Vanguard Scottsdale Funds - Vanguard Long-Term Corporate Bond ETF (NasdaqGM:VCLT) institutionel ejerskabsstruktur viser aktuelle positioner i virksomheden efter institutioner og fonde, samt seneste ændringer i positionsstørrelse. Større aktionærer kan omfatte individuelle investorer, investeringsforeninger, hedgefonde eller institutioner. Skema 13D angiver, at investoren besidder (eller besidder) mere end 5 % af virksomheden og har til hensigt (eller har til hensigt at) aktivt at forfølge en ændring i forretningsstrategi. Skema 13G indikerer en passiv investering på over 5%.
The share price as of September 12, 2025 is 78,16 / share. Previously, on September 16, 2024, the share price was 82,19 / share. This represents a decline of 4,90% over that period.

Fondens stemningsscore
Fund Sentiment Score (fka Ownership Accumulation Score) finder de aktier, der bliver mest købt af fonde. Det er resultatet af en sofistikeret, multi-faktor kvantitativ model, der identificerer virksomheder med de højeste niveauer af institutionel akkumulering. Scoringsmodellen bruger en kombination af den samlede stigning i oplyste ejere, ændringerne i porteføljeallokeringer i disse ejere og andre målinger. Tallet går fra 0 til 100, hvor højere tal indikerer et højere niveau af akkumulering for sine jævnaldrende, og 50 er gennemsnittet.
Opdateringsfrekvens: Dagligt
Se Ownership Explorer, som giver en liste over højest rangerende virksomheder.
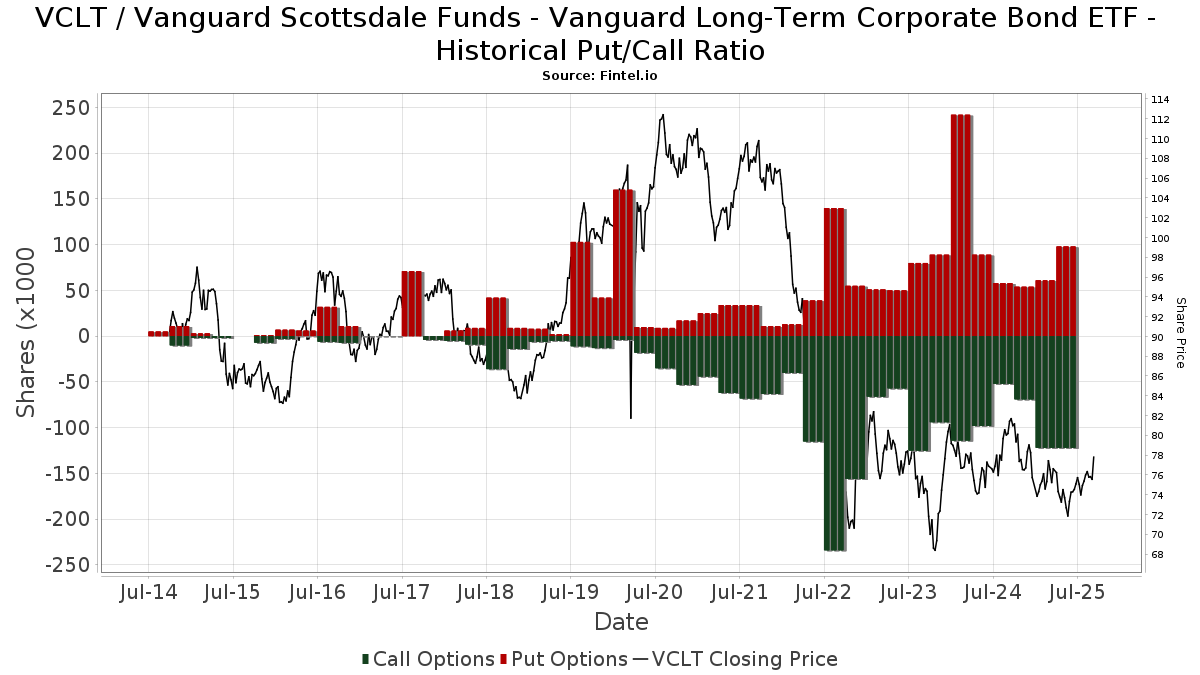
Institutionel Put/Call-forhold
Ud over at indberette standardaktie- og gældsudstedelser skal institutter med mere end 100 mill. aktiver under forvaltning også oplyse deres put- og call-optionsbeholdninger. Da salgsoptioner generelt indikerer negativ stemning, og købsoptioner indikerer positiv stemning, kan vi få en fornemmelse af den overordnede institutionelle stemning ved at plotte forholdet mellem put og kald. Diagrammet til højre viser det historiske put/call-forhold for dette instrument.
Brug af Put/Call Ratio som en indikator for investorernes stemning overvinder en af de vigtigste mangler ved at bruge totalt institutionelt ejerskab, som er, at en betydelig mængde af aktiver under forvaltning investeres passivt for at spore indekser. Passivt forvaltede fonde køber typisk ikke optioner, så indikatoren for put/call-forholdet følger mere nøje følelsen af aktivt forvaltede fonde.
13D/G-arkivering
Vi præsenterer 13D/G ansøgninger separat fra 13F ansøgninger på grund af den forskellige behandling af SEC. 13D/G-ansøgninger kan indgives af grupper af investorer (med én ledende), hvorimod 13F-ansøgninger ikke kan. Dette resulterer i situationer, hvor en investor kan indsende en 13D/G, der rapporterer én værdi for de samlede aktier (der repræsenterer alle de aktier, der ejes af investorgruppen), men derefter indsender en 13F, der rapporterer en anden værdi for de samlede aktier (der udelukkende repræsenterer deres egne) ejendomsret). Det betyder, at aktieejerskab af 13D/G-arkiver og 13F-arkiveringer ofte ikke er direkte sammenlignelige, så vi præsenterer dem separat.
Bemærk: Fra den 16. maj 2021 viser vi ikke længere ejere, der ikke har indsendt en 13D/G inden for det seneste år. Tidligere viste vi den fulde historie af 13D/G-arkiver. Generelt skal enheder, der er forpligtet til at indgive 13D/G-ansøgninger, indgive mindst årligt, før de indsender en afsluttende ansøgning. Dog forlader fonde nogle gange positioner uden at indsende en afsluttende ansøgning (dvs. de afvikler), så visning af den fulde historie resulterede nogle gange i forvirring om det nuværende ejerskab. For at undgå forvirring viser vi nu kun 'aktuelle' ejere - det vil sige - ejere, der har anmeldt inden for det seneste år.
Upgrade to unlock premium data.
| Fil dato | Form | Investor | Forrige Aktier |
Seneste Aktier |
Δ Aktier (Procent) |
Ejendomsret (Procent) |
Δ Ejerskab (Procent) |
|
|---|---|---|---|---|---|---|---|---|
| 2025-07-15 | BlackRock Portfolio Management LLC | 7,394,021 | 622,629 | -91.58 | 0.50 | -90.57 |
13F og NPORT arkivering
Detaljer om 13F-arkivering er gratis. Detaljer om NP-ansøgninger kræver et premium-medlemskab. Grønne rækker angiver nye positioner. Røde rækker angiver lukkede positioner. Klik på linket ikon for at se den fulde transaktionshistorik.
Opgrader
for at låse premium-data op og eksportere til Excel ![]() .
.
| Fil dato | Kilde | Investor | Type | Gennemsnitlig pris (Øst) |
Aktier | Δ Aktier (%) |
Rapporteret Værdi ($1000) |
Δ Værdi (%) |
Port Alloc (%) |
|
|---|---|---|---|---|---|---|---|---|---|---|
| 2025-08-14 | 13F | Raymond James Financial Inc | 694.259 | -3,41 | 52.694 | -3,42 | ||||
| 2025-07-23 | 13F | H&H Retirement Design & Management INC | 99.207 | 9,50 | 7.422 | 13,38 | ||||
| 2025-07-28 | 13F | Sagace Wealth Management LLC | 42.973 | 1,88 | 3.262 | 1,87 | ||||
| 2025-07-22 | 13F | Sage Investment Counsel LLC | 5.265 | 0,00 | 400 | 0,00 | ||||
| 2025-07-22 | 13F | Oak Hill Wealth Advisors, Llc | 6.163 | 459 | ||||||
| 2025-08-07 | 13F | Alpha Cubed Investments, LLC | 8.269 | 628 | ||||||
| 2025-08-14 | 13F | Citadel Advisors Llc | 77.737 | -76,63 | 5.900 | -76,63 | ||||
| 2025-07-28 | 13F | Perfromance Wealth Partners, LLC | 4.291 | -24,67 | 326 | -24,77 | ||||
| 2025-08-08 | 13F | Hartland & Co., LLC | 0 | -100,00 | 0 | |||||
| 2025-08-14 | 13F | Citadel Advisors Llc | Put | 15.800 | 12,86 | 1.199 | 12,90 | |||
| 2025-08-14 | 13F | Citadel Advisors Llc | Call | 6.700 | 31,37 | 509 | 31,27 | |||
| 2025-07-25 | 13F | NorthRock Partners, LLC | 906 | 655,00 | 69 | 655,56 | ||||
| 2025-07-23 | 13F | Kingswood Wealth Advisors, Llc | 26.927 | 0,89 | 2.044 | 0,89 | ||||
| 2025-08-08 | 13F | Pnc Financial Services Group, Inc. | 163.392 | -19,37 | 12.401 | -19,38 | ||||
| 2025-07-31 | 13F | City State Bank | 48 | 0,00 | 4 | 0,00 | ||||
| 2025-05-15 | 13F | BTG Pactual Asset Management US LLC | 0 | -100,00 | 0 | |||||
| 2025-08-11 | 13F | Lcnb Corp | 5.190 | 4,05 | 394 | 3,97 | ||||
| 2025-08-15 | 13F | Morgan Stanley | 5.324.964 | -8,63 | 404.165 | -8,64 | ||||
| 2025-08-14 | 13F | Bnp Paribas | 118.378 | 2.534,13 | 8.985 | 2.534,60 | ||||
| 2025-08-14 | 13F | Transamerica Financial Advisors, Inc. | 4 | 0,00 | 0 | |||||
| 2025-08-14 | 13F | CoreCap Advisors, LLC | 9.615 | -97,81 | 730 | -97,81 | ||||
| 2025-08-28 | NP | SCLAX - SIMT MULTI-ASSET CAPITAL STABILITY FUND Class F | 1.901 | -43,96 | 144 | -43,97 | ||||
| 2025-08-15 | 13F | United Services Automobile Association | 189.350 | -50,00 | 14.372 | -49,91 | ||||
| 2025-07-15 | 13F | Fifth Third Bancorp | 557 | 1,09 | 42 | 2,44 | ||||
| 2025-08-13 | 13F | Jones Financial Companies Lllp | 54.236 | 8,49 | 4.079 | 7,91 | ||||
| 2025-08-05 | 13F | McGinn Investment Management, Inc. | 0 | -100,00 | 0 | |||||
| 2025-08-06 | 13F | Wedbush Securities Inc | 0 | -100,00 | 0 | |||||
| 2025-08-29 | NP | BHILX - BHILL Fund Managed Account Completion Shares | 18.416 | 1.398 | ||||||
| 2025-08-05 | 13F | NewSquare Capital LLC | 59.597 | 2,92 | 4.523 | 2,91 | ||||
| 2025-07-29 | 13F | Stableford Capital Ii Llc | 3.689 | 4,56 | 278 | 6,95 | ||||
| 2025-07-29 | 13F | Tide Cove Capital Partners LLC | 31.293 | 2,62 | 2.345 | 1,30 | ||||
| 2025-08-14 | 13F | Sunbelt Securities, Inc. | 300 | -0,66 | 22 | 0,00 | ||||
| 2025-08-05 | 13F | Bank Of Montreal /can/ | 2.727 | 0,07 | 207 | 0,00 | ||||
| 2025-08-14 | 13F | Cardiff Park Advisors, Llc | 280 | 1,45 | 21 | 5,00 | ||||
| 2025-07-22 | 13F | Checchi Capital Advisers, LLC | 28.080 | -82,94 | 2.131 | -82,94 | ||||
| 2025-08-06 | 13F | Anchor Capital Advisors Llc | 4.135 | 0,00 | 314 | 0,00 | ||||
| 2025-07-23 | 13F | WestEnd Advisors, LLC | 533 | 17,66 | 40 | 17,65 | ||||
| 2025-08-14 | 13F | Capitolis Liquid Global Markets LLC | 670.500 | 50.891 | ||||||
| 2025-07-28 | 13F | Rosenberg Matthew Hamilton | 10.565 | -6,85 | 802 | -6,86 | ||||
| 2025-05-02 | 13F | Dakota Wealth Management | 0 | -100,00 | 0 | |||||
| 2025-07-15 | 13F | Avaii Wealth Management, Llc | 6.224 | 2,27 | 472 | 2,39 | ||||
| 2025-08-05 | 13F | Tsfg, Llc | 1.500 | 1,49 | 0 | |||||
| 2025-08-21 | 13F | Aveo Capital Partners, LLC | 0 | -100,00 | 0 | |||||
| 2025-08-11 | 13F | Capital Square, LLC | 14.036 | -2,32 | 1.044 | -4,31 | ||||
| 2025-08-14 | 13F | Peapack Gladstone Financial Corp | 0 | -100,00 | 0 | |||||
| 2025-08-14 | 13F | Mariner, LLC | 6.494 | -2,83 | 493 | -2,96 | ||||
| 2025-07-10 | 13F | Websterrogers Financial Advisors, Llc | 87.630 | 1,42 | 6.651 | 1,40 | ||||
| 2025-06-25 | NP | RLGAX - RiverFront Asset Allocation Growth & Income Investor Shares | 0 | -100,00 | 0 | -100,00 | ||||
| 2025-05-02 | 13F | First Command Advisory Services, Inc. | 0 | -100,00 | 0 | |||||
| 2025-08-29 | 13F | Centaurus Financial, Inc. | 1.450 | -5,91 | 0 | |||||
| 2025-04-28 | 13F | Principal Financial Group Inc | 0 | -100,00 | 0 | |||||
| 2025-08-14 | 13F | Optiver Holding B.V. | 118 | 9 | ||||||
| 2025-08-14 | 13F | Old Mission Capital Llc | 0 | -100,00 | 0 | |||||
| 2025-05-15 | 13F | Keebeck Wealth Management, LLC | 0 | -100,00 | 0 | |||||
| 2025-07-16 | 13F | Register Financial Advisors LLC | 152 | 12 | ||||||
| 2025-08-14 | 13F | Mml Investors Services, Llc | 387.173 | -5,58 | 29 | -6,45 | ||||
| 2025-07-15 | 13F | Td Private Client Wealth Llc | 1.042 | 79 | ||||||
| 2025-04-25 | NP | VTC - Vanguard Total Corporate Bond ETF ETF Shares | 5.066.991 | 9,39 | 391.729 | 7,06 | ||||
| 2025-08-20 | 13F/A | Coppell Advisory Solutions LLC | 6.423 | -3,01 | 483 | -2,82 | ||||
| 2025-07-21 | 13F | Crews Bank & Trust | 5.475 | -14,09 | 416 | -14,08 | ||||
| 2025-07-30 | 13F | Nottingham Advisors, Inc. | 18.582 | -73,82 | 1.410 | -73,83 | ||||
| 2025-07-23 | 13F | Prime Capital Investment Advisors, LLC | 10.467 | 6,61 | 794 | 6,58 | ||||
| 2025-07-17 | 13F | Raleigh Capital Management Inc. | 0 | -100,00 | 0 | |||||
| 2025-08-13 | 13F | 1832 Asset Management L.P. | 357.866 | 5,26 | 27.162 | 5,25 | ||||
| 2025-07-30 | 13F | White Lighthouse Investment Management Inc. | 78.502 | 0,01 | 5.958 | 0,00 | ||||
| 2025-05-15 | 13F | BlueCrest Capital Management Ltd | 0 | -100,00 | 0 | |||||
| 2025-08-28 | NP | BlackRock Funds V - BlackRock Strategic Income Opportunities Portfolio Investor A Shares | 570.850 | 0,00 | 43.328 | -0,01 | ||||
| 2025-05-27 | NP | TINIX - AXS Tactical Income Fund Class I Shares | 20.187 | 1.532 | ||||||
| 2025-07-18 | 13F | Institute for Wealth Management, LLC. | 3.672 | 0,03 | 279 | 0,00 | ||||
| 2025-08-14 | 13F | Bnp Paribas Arbitrage, Sa | 902.723 | -18,14 | 68.517 | -18,15 | ||||
| 2025-04-15 | 13F | Ibex Wealth Advisors | 0 | -100,00 | 0 | |||||
| 2025-08-19 | 13F | National Asset Management, Inc. | 0 | -100,00 | 0 | |||||
| 2025-04-15 | 13F | Focus Financial Network, Inc. | 0 | -100,00 | 0 | -100,00 | ||||
| 2025-08-14 | 13F | Meiji Yasuda Life Insurance Co | 2.833.000 | 0,00 | 215.025 | -0,01 | ||||
| 2025-07-10 | 13F | Exchange Traded Concepts, Llc | 212.142 | 16.102 | ||||||
| 2025-07-21 | 13F | Ameriflex Group, Inc. | 16.156 | -9,47 | 1.218 | -10,04 | ||||
| 2025-04-30 | 13F | AlphaStar Capital Management, LLC | 0 | -100,00 | 0 | |||||
| 2025-08-12 | 13F | CIBC Private Wealth Group, LLC | 959 | 0,95 | 73 | 5,88 | ||||
| 2025-05-29 | NP | Northern Lights Fund Trust - Sierra Tactical Risk Spectrum 30 Fund Instl Class | 67.600 | 5.132 | ||||||
| 2025-08-13 | 13F | Scotia Capital Inc. | 0 | -100,00 | 0 | |||||
| 2025-08-13 | 13F | EverSource Wealth Advisors, LLC | 1.046 | 0,00 | 79 | 0,00 | ||||
| 2025-07-17 | 13F | Janney Montgomery Scott LLC | 124.487 | 2,04 | 9 | 0,00 | ||||
| 2025-08-13 | 13F | Cresset Asset Management, LLC | 11.266 | -21,04 | 855 | -21,05 | ||||
| 2025-08-14 | 13F | Two Sigma Securities, Llc | 0 | -100,00 | 0 | |||||
| 2025-08-01 | 13F | First National Trust Co | 4.415 | -3,03 | 335 | -2,90 | ||||
| 2025-08-14 | 13F | Gallagher Fiduciary Advisors, LLC | 59.297.124 | 19.539,62 | 786 | -96,57 | ||||
| 2025-08-12 | 13F | XTX Topco Ltd | 8.187 | 99,34 | 621 | 99,68 | ||||
| 2025-08-11 | 13F | Beaumont Capital Management, LLC | 33.748 | 1,21 | 2.561 | 1,19 | ||||
| 2025-07-08 | 13F | Nbc Securities, Inc. | 5.390 | 27,45 | 0 | |||||
| 2025-08-06 | 13F | Legacy Investment Solutions, LLC | 23 | 0,00 | 2 | 0,00 | ||||
| 2025-07-15 | 13F | Farrell Financial LLC | 26.913 | 7,12 | 2.043 | 7,08 | ||||
| 2025-07-30 | 13F | Avidian Wealth Solutions, LLC | 6.821 | -3,43 | 518 | -3,54 | ||||
| 2025-08-12 | 13F | Allianz Investment Management U.S. LLC | 2.416.012 | 0,00 | 183.375 | 3,60 | ||||
| 2025-07-15 | 13F | Sightline Wealth Advisors, LLC | 43.352 | 0,91 | 3.290 | 0,89 | ||||
| 2025-08-12 | 13F | RiverFront Investment Group, LLC | 64.839 | -49,01 | 4.921 | -49,02 | ||||
| 2025-08-11 | 13F | Nomura Asset Management Co Ltd | 0 | -100,00 | 0 | |||||
| 2025-08-14 | 13F | Goldman Sachs Group Inc | 95.577 | -39,58 | 7.254 | -39,59 | ||||
| 2025-08-01 | 13F | Ashton Thomas Private Wealth, LLC | 5.111 | 388 | ||||||
| 2025-07-22 | 13F | Belpointe Asset Management LLC | 146.005 | 11.082 | ||||||
| 2025-08-08 | 13F | Globe Life Inc. | 474.500 | 0,00 | 36.015 | -0,01 | ||||
| 2025-08-13 | 13F | Custom Index Systems, Llc | 8.549 | 649 | ||||||
| 2025-07-31 | 13F | Nisa Investment Advisors, Llc | 183.600 | 2,53 | 13.935 | 2,52 | ||||
| 2025-07-16 | 13F | Beaumont Financial Advisors, LLC | 3.480 | -11,25 | 264 | -11,11 | ||||
| 2025-07-31 | 13F | Topsail Wealth Management, LLC | 23.786 | 1,46 | 1.805 | 1,46 | ||||
| 2025-07-31 | 13F | Glass Jacobson Investment Advisors llc | 0 | -100,00 | 0 | |||||
| 2025-08-14 | 13F/A | Barclays Plc | 109.647 | 996.690,91 | 8 | |||||
| 2025-07-15 | 13F | Sheets Smith Wealth Management | 8.297 | 7,82 | 630 | 7,71 | ||||
| 2025-08-12 | 13F | Sandhill Capital Partners LLC | 4.143 | 0,00 | 314 | 0,00 | ||||
| 2025-08-14 | 13F | Daiwa Securities Group Inc. | 15.900 | 0,00 | 1 | 0,00 | ||||
| 2025-07-29 | 13F | Stephens Inc /ar/ | 2.640 | 200 | ||||||
| 2025-08-13 | 13F | Cerity Partners LLC | 0 | -100,00 | 0 | |||||
| 2025-07-30 | 13F | Bogart Wealth, LLC | 89 | 0,00 | 7 | 0,00 | ||||
| 2025-08-05 | 13F | Gould Asset Management Llc /ca/ | 5.894 | -39,49 | 447 | -39,51 | ||||
| 2025-08-04 | 13F | IFG Advisory, LLC | 34.490 | -6,56 | 2.618 | -6,57 | ||||
| 2025-05-29 | NP | SSIZX - Sierra Tactical Core Income Fund Class A Shares | 1.156.700 | 421,74 | 87.805 | 387,59 | ||||
| 2025-07-23 | 13F | Elm3 Financial Group, LLC | 5.907 | -47,07 | 448 | -47,11 | ||||
| 2025-08-15 | 13F | CI Private Wealth, LLC | 25.272 | 80,54 | 1.918 | 80,60 | ||||
| 2025-08-12 | 13F | Northwestern Mutual Investment Management Company, Llc | 274.190 | 20.811 | ||||||
| 2025-08-07 | 13F | Guidance Capital, Inc | 45.637 | 12,51 | 3.455 | 15,79 | ||||
| 2025-08-13 | 13F | Northern Trust Corp | 0 | -100,00 | 0 | |||||
| 2025-08-11 | 13F | TAGStone Capital, Inc. | 0 | -100,00 | 0 | |||||
| 2025-04-21 | 13F | Hartford Financial Management Inc. | 0 | -100,00 | 0 | |||||
| 2025-08-11 | 13F | Anfield Capital Management, LLC | 397 | 185,61 | 30 | 200,00 | ||||
| 2025-05-30 | NP | TBFG - The Brinsmere Fund - Growth ETF | 0 | -100,00 | 0 | -100,00 | ||||
| 2025-05-01 | 13F | High Note Wealth, LLC | 0 | -100,00 | 0 | |||||
| 2025-08-04 | 13F | Econ Financial Services Corp | 71.983 | 0,90 | 5.464 | 0,89 | ||||
| 2025-08-08 | 13F | Creative Planning | 7.854 | 1,21 | 596 | 1,19 | ||||
| 2025-08-26 | 13F/A | Thrivent Financial For Lutherans | 9.872 | 1 | ||||||
| 2025-08-08 | 13F | Emerald Investment Partners, Llc | 26.487 | -2,45 | 2.010 | -2,47 | ||||
| 2025-08-15 | 13F | Semmax Financial Advisors Inc. | 191 | 14 | ||||||
| 2025-05-29 | NP | Northern Lights Fund Trust - Sierra Tactical Risk Spectrum 70 Fund Investor Class | 7.300 | 2,82 | 554 | -3,82 | ||||
| 2025-07-21 | 13F | Mirae Asset Global Investments Co., Ltd. | 324.336 | 18,73 | 24.617 | 38,46 | ||||
| 2025-08-14 | 13F | Jane Street Group, Llc | 250.852 | -72,37 | 19.040 | -72,38 | ||||
| 2025-08-12 | 13F | Employees' Retirement Fund of the City of Fort Worth | 416.500 | 0,00 | 31.617 | 0,00 | ||||
| 2025-08-07 | 13F | Sound View Wealth Advisors Group, LLC | 5.195 | 0,00 | 394 | 0,00 | ||||
| 2025-08-11 | 13F | Aptus Capital Advisors, LLC | 204 | 0,00 | 15 | 0,00 | ||||
| 2025-07-31 | 13F | Wright Fund Managment, LLC | 1.327.700 | 0,00 | 100.786 | 0,00 | ||||
| 2025-07-30 | 13F | Onyx Bridge Wealth Group LLC | 4.408 | -40,33 | 335 | -40,36 | ||||
| 2025-08-08 | 13F | Pinney & Scofield, Inc. | 607 | 1,51 | 46 | 2,22 | ||||
| 2025-08-12 | 13F | Coldstream Capital Management Inc | 0 | -100,00 | 0 | |||||
| 2025-08-11 | 13F | AXS Investments LLC | 0 | -100,00 | 0 | |||||
| 2025-08-12 | 13F | MAI Capital Management | 1.198 | -17,21 | 91 | -17,43 | ||||
| 2025-08-14 | 13F | Ameriprise Financial Inc | 732.016 | -13,13 | 55.497 | -13,09 | ||||
| 2025-04-29 | 13F | Penserra Capital Management LLC | 0 | -100,00 | 0 | |||||
| 2025-08-05 | 13F | Cassaday & Co Wealth Management LLC | 0 | -100,00 | 0 | |||||
| 2025-08-06 | 13F | AE Wealth Management LLC | 319 | 8,50 | 24 | 9,09 | ||||
| 2025-08-13 | 13F | Dow Chemical Co /de/ | 264.221 | 0,00 | 20.054 | -0,01 | ||||
| 2025-08-08 | 13F | Avantax Advisory Services, Inc. | 17.958 | 2,62 | 1.363 | 2,64 | ||||
| 2025-08-13 | 13F | Invesco Ltd. | 64.985 | 0,24 | 4.932 | 0,22 | ||||
| 2025-07-29 | 13F | Private Trust Co Na | 5.869 | 0,00 | 445 | 0,00 | ||||
| 2025-08-14 | 13F | Toroso Investments, LLC | 7.950 | 601 | ||||||
| 2025-08-15 | 13F | First Heartland Consultants, Inc. | 5.053 | 4,53 | 839 | 128,96 | ||||
| 2025-08-01 | 13F | Boyd Watterson Asset Management Llc/oh | 3.235 | -94,68 | 246 | -94,70 | ||||
| 2025-08-11 | 13F | Principal Securities, Inc. | 2.425 | 26,76 | 184 | 28,67 | ||||
| 2025-08-11 | 13F | NewEdge Wealth, LLC | 187.172 | -40,62 | 14.214 | -40,60 | ||||
| 2025-08-04 | 13F | AMG National Trust Bank | 180.805 | -7,29 | 13.723 | -7,30 | ||||
| 2025-04-23 | 13F | Golden State Wealth Management, LLC | 311 | 1.627,78 | 24 | 2.200,00 | ||||
| 2025-08-13 | 13F | Capital Group Private Client Services, Inc. | 0 | -100,00 | 0 | |||||
| 2025-08-14 | 13F | MidWestOne Financial Group, Inc. | 219.590 | -26,27 | 16.667 | -26,29 | ||||
| 2025-07-22 | 13F | Visionary Horizons, LLC | 5.806 | -74,51 | 441 | -74,55 | ||||
| 2025-08-12 | 13F | DiMeo Schneider & Associates, L.L.C. | 468.948 | 4,20 | 35.593 | 4,19 | ||||
| 2025-07-30 | 13F | Denali Advisors Llc | 18.665 | -4,04 | 1.417 | -4,07 | ||||
| 2025-08-12 | 13F | Horizon Financial Services, Llc | 50.793 | -0,29 | 3.855 | -0,28 | ||||
| 2025-05-13 | 13F | Quadrature Capital Ltd | 0 | -100,00 | 0 | -100,00 | ||||
| 2025-05-15 | 13F/A | Orion Portfolio Solutions, LLC | 6.369 | 1,40 | 483 | 2,99 | ||||
| 2025-08-05 | 13F | Marion Wealth Management | 75.286 | 1,08 | 5.714 | 1,06 | ||||
| 2025-08-12 | 13F | SRS Capital Advisors, Inc. | 27.075 | -1,70 | 2.055 | -1,72 | ||||
| 2025-08-14 | 13F | Fmr Llc | 341 | -88,82 | 26 | -89,18 | ||||
| 2025-07-07 | 13F | Insight Wealth Strategies, LLC | 380.395 | 0,86 | 28.845 | 0,76 | ||||
| 2025-08-04 | 13F | Creative Financial Designs Inc /adv | 1.900 | 5,56 | 144 | 5,88 | ||||
| 2025-08-04 | 13F | Atria Investments Llc | 37.805 | 11,26 | 2.869 | 11,24 | ||||
| 2025-07-16 | 13F | Signaturefd, Llc | 148 | -27,80 | 11 | -26,67 | ||||
| 2025-07-25 | 13F | Transcendent Capital Group LLC | 33.521 | 0,16 | 2.544 | 0,16 | ||||
| 2025-07-24 | 13F | Us Bancorp \de\ | 47 | -84,64 | 4 | -86,96 | ||||
| 2025-08-12 | 13F | BlackRock, Inc. | 622.629 | 0,07 | 47.258 | 0,06 | ||||
| 2025-04-28 | 13F | Mainstream Capital Management LLC | 0 | -100,00 | 0 | |||||
| 2025-08-15 | 13F | Orcam Financial Group | 2.678 | 0,60 | 203 | 0,50 | ||||
| 2025-08-13 | 13F | Guggenheim Capital Llc | 121.048 | 37,91 | 9.188 | 37,90 | ||||
| 2025-08-13 | 13F | Everstar Asset Management, LLC | 3.790 | 0,00 | 288 | 0,00 | ||||
| 2025-08-12 | 13F | LPL Financial LLC | 649.206 | -18,07 | 49.275 | -18,08 | ||||
| 2025-07-22 | 13F | 4Thought Financial Group Inc. | 52.712 | 6,31 | 4.001 | 6,30 | ||||
| 2025-08-05 | 13F | Sigma Planning Corp | 5.482 | -77,66 | 416 | -77,66 | ||||
| 2025-07-14 | 13F | Abacus Wealth Partners, LLC | 6.529 | 496 | ||||||
| 2025-08-07 | 13F | Palouse Capital Management, Inc. | 49.803 | 0,34 | 3.780 | 0,35 | ||||
| 2025-08-14 | 13F | Hrt Financial Lp | 12.829 | 1 | ||||||
| 2025-07-14 | 13F | Argentarii, LLC | 2.696 | 205 | ||||||
| 2025-05-14 | 13F | Estate Counselors, LLC | 0 | -100,00 | 0 | |||||
| 2025-08-14 | 13F | Stifel Financial Corp | 35.398 | 8,41 | 2.687 | 8,39 | ||||
| 2025-08-14 | 13F/A | Skopos Labs, Inc. | 454 | 15.033,33 | 34 | |||||
| 2025-08-11 | 13F | Private Advisor Group, LLC | 7.742 | -7,50 | 588 | -7,56 | ||||
| 2025-07-24 | 13F | Robertson Stephens Wealth Management, LLC | 28.329 | 35,81 | 2.150 | 35,82 | ||||
| 2025-08-14 | 13F | Janus Henderson Group Plc | 3.415 | -92,12 | 259 | -92,09 | ||||
| 2025-07-08 | 13F | GK Wealth Management LLC | 9.456 | 68,23 | 718 | 68,31 | ||||
| 2025-08-14 | 13F | State Street Corp | 1.121.846 | 20,57 | 85.148 | 20,55 | ||||
| 2025-08-12 | 13F | Eisler Capital Management Ltd. | 0 | -100,00 | 0 | |||||
| 2025-08-11 | 13F | Regal Investment Advisors LLC | 72.982 | 0,50 | 5.539 | 0,49 | ||||
| 2025-08-14 | 13F | Harmony Asset Management Llc | 8.824 | 36,30 | 670 | 36,25 | ||||
| 2025-08-13 | 13F | Sumitomo Mitsui Financial Group, Inc. | 81.693 | -10,96 | 6.200 | -10,97 | ||||
| 2025-08-14 | 13F | Colony Group, LLC | 50.273 | -4,90 | 3.816 | -4,91 | ||||
| 2025-07-11 | 13F/A | Umb Bank N A/mo | 3.068 | 0,00 | 233 | 0,00 | ||||
| 2025-05-08 | 13F | BRYN MAWR TRUST Co | 0 | -100,00 | 0 | |||||
| 2025-08-14 | 13F | Mercer Global Advisors Inc /adv | 0 | -100,00 | 0 | |||||
| 2025-09-11 | 13F | Silicon Valley Capital Partners | 23 | 2 | ||||||
| 2025-08-06 | 13F | Aspect Partners, LLC | 254 | 19 | ||||||
| 2025-08-12 | 13F | Mufg Securities Americas Inc. | 0 | -100,00 | 0 | |||||
| 2025-08-12 | 13F | Absolute Capital Management, LLC | 24.218 | -2,99 | 1.838 | -3,01 | ||||
| 2025-07-28 | 13F | Moran Wealth Management, LLC | 38.863 | 8,37 | 2.950 | 8,34 | ||||
| 2025-05-09 | 13F | Vanguard Group Inc | 0 | -100,00 | 0 | |||||
| 2025-08-05 | 13F | Huntington National Bank | 5 | |||||||
| 2025-08-13 | 13F | Wealthedge Investment Advisors, Llc | 0 | -100,00 | 0 | |||||
| 2025-08-05 | 13F | Transatlantique Private Wealth Llc | 8.300 | 2,77 | 630 | 2,61 | ||||
| 2025-08-07 | 13F | King Luther Capital Management Corp | 3.587 | -3,03 | ||||||
| 2025-05-08 | 13F | Plante Moran Financial Advisors, LLC | 0 | -100,00 | 0 | |||||
| 2025-08-14 | 13F | Bramshill Investments, LLC | 314.098 | 5,48 | 23.840 | 5,47 | ||||
| 2025-08-15 | 13F | Kestra Advisory Services, LLC | 7.147 | 165,19 | 542 | 165,69 | ||||
| 2025-05-12 | 13F | SOUTH STATE Corp | 0 | -100,00 | 0 | |||||
| 2025-08-14 | 13F | Alliancebernstein L.p. | 542.428 | 0,28 | 41.170 | 0,27 | ||||
| 2025-07-23 | 13F | Eagle Strategies LLC | 4.974 | 7,85 | 378 | 7,71 | ||||
| 2025-04-22 | 13F | Echo Wealth Management, LLC | 0 | -100,00 | 0 | |||||
| 2025-04-21 | 13F | Ronald Blue Trust, Inc. | 0 | -100,00 | 0 | |||||
| 2025-07-17 | 13F | Independence Bank of Kentucky | 2.742 | -7,80 | 208 | -7,56 | ||||
| 2025-08-13 | 13F | Nyl Investors Llc | 625.629 | 1,05 | 47.485 | 1,04 | ||||
| 2025-08-13 | 13F | Beacon Pointe Advisors, LLC | 4.317 | 4,25 | 328 | 4,14 | ||||
| 2025-08-13 | 13F | Fortress Financial Solutions, LLC | 16.546 | 3,24 | 1.256 | 3,21 | ||||
| 2025-08-08 | 13F | Fortis Group Advisors, LLC | 266 | 0,00 | 20 | 0,00 | ||||
| 2025-07-29 | 13F | Signature Estate & Investment Advisors Llc | 9.262 | 17,30 | 703 | 17,36 | ||||
| 2025-08-12 | 13F | Howe & Rusling Inc | 369 | 292,55 | 28 | 300,00 | ||||
| 2025-08-14 | 13F/A | Rockefeller Capital Management L.P. | 12.224 | 0,16 | 928 | 0,11 | ||||
| 2025-08-14 | 13F | GWM Advisors LLC | 186.473 | 54,11 | 14.153 | 54,09 | ||||
| 2025-07-30 | 13F | Phillips Financial Management, Llc | 86 | 7 | ||||||
| 2025-04-23 | 13F | Aspetuck Financial Management LLC | 0 | -100,00 | 0 | -100,00 | ||||
| 2025-05-05 | 13F | Transce3nd, LLC | 0 | -100,00 | 0 | |||||
| 2025-04-15 | 13F | Integrated Advisors Network LLC | 0 | -100,00 | 0 | |||||
| 2025-08-11 | 13F | Lighthouse Financial LLC | 130.698 | -0,42 | 9.920 | -0,44 | ||||
| 2025-08-14 | 13F | Wells Fargo & Company/mn | 1.591.904 | -4,67 | 120.826 | -4,68 | ||||
| 2025-08-07 | 13F | PFG Advisors | 8.242 | -9,02 | 626 | -9,02 | ||||
| 2025-08-11 | 13F | Heritage Wealth Advisors | 0 | -100,00 | 0 | |||||
| 2025-08-12 | 13F | Insigneo Advisory Services, Llc | 9.649 | 0,00 | 732 | 0,00 | ||||
| 2025-04-22 | 13F | Buck Wealth Strategies, LLC | 0 | -100,00 | 0 | |||||
| 2025-08-14 | 13F | TT Capital Management LLC | 54.100 | 4.001 | ||||||
| 2025-08-12 | 13F | Founders Financial Alliance, LLC | 0 | -100,00 | 0 | |||||
| 2025-07-30 | 13F | D.a. Davidson & Co. | 5.493 | 0,16 | 417 | 0,00 | ||||
| 2025-05-16 | 13F | CTC Alternative Strategies, Ltd. | 0 | -100,00 | 0 | |||||
| 2025-08-19 | 13F | Newbridge Financial Services Group, Inc. | 981 | 5,83 | 74 | 5,71 | ||||
| 2025-08-27 | NP | Brighthouse Funds Trust I - SSGA Growth and Income ETF Portfolio Class A | 779.375 | 20,55 | 59.155 | 20,53 | ||||
| 2025-07-31 | 13F | Pacitti Group Inc. | 23.844 | 8,98 | 1.810 | 8,98 | ||||
| 2025-07-31 | 13F | Ssa Swiss Advisors Ag | 0 | -100,00 | 0 | |||||
| 2025-07-17 | 13F | Catalytic Wealth RIA, LLC | 5.029 | 12,53 | 382 | 12,39 | ||||
| 2025-08-13 | 13F | Dai-Ichi Life Insurance Company, Ltd | 11.859 | -80,86 | 900 | -80,86 | ||||
| 2025-08-14 | 13F | Boston Private Wealth Llc | 0 | -100,00 | 0 | |||||
| 2025-08-14 | 13F | Wiley Bros.-aintree Capital, Llc | 55.046 | -13,15 | 4.178 | -12,81 | ||||
| 2025-07-18 | 13F | Consolidated Portfolio Review Corp | 10.681 | 1,24 | 811 | 1,25 | ||||
| 2025-08-12 | 13F | Charles Schwab Investment Management Inc | 2.274.819 | 2,62 | 172.659 | 2,61 | ||||
| 2025-08-12 | 13F | Change Path, LLC | 4.701 | -91,66 | 357 | -91,68 | ||||
| 2025-08-28 | NP | GPARX - GuidePath(R) Absolute Return Allocation Fund Service Shares | 59.081 | -60,09 | 4.484 | -60,10 | ||||
| 2025-07-30 | 13F | Berkeley Capital Partners, LLC | 202.842 | 3,58 | 15.396 | 3,57 | ||||
| 2025-04-17 | 13F | Vicus Capital | 0 | -100,00 | 0 | |||||
| 2025-08-07 | 13F | Resources Investment Advisors, LLC. | 4.077 | 28,98 | 309 | 29,29 | ||||
| 2025-07-31 | 13F | Wealthfront Advisers Llc | 17.876 | -13,73 | 1.357 | -13,74 | ||||
| 2025-08-12 | 13F | Tradition Wealth Management, LLC | 9.760 | -31,30 | 741 | -31,35 | ||||
| 2025-07-31 | 13F | United Community Bank | 117 | -81,63 | 9 | -83,33 | ||||
| 2025-08-18 | 13F | Geneos Wealth Management Inc. | 10.604 | 101,83 | 805 | 102,01 | ||||
| 2025-05-12 | 13F | Cahill Wealth Management, LLC | 3.200 | 0,00 | 243 | 1,26 | ||||
| 2025-07-16 | 13F | Marmo Financial Group, LLC | 127.911 | -0,22 | 9.708 | -0,24 | ||||
| 2025-07-17 | 13F | San Luis Wealth Advisors LLC | 169.348 | 13 | ||||||
| 2025-07-25 | 13F | Allspring Global Investments Holdings, LLC | 633.641 | 28,57 | 48.093 | 28,55 | ||||
| 2025-08-05 | 13F | GPS Wealth Strategies Group, LLC | 142 | 0,00 | 11 | 0,00 | ||||
| 2025-08-08 | 13F/A | Prospect Financial Services LLC | 119.970 | -34,64 | 9.106 | -34,65 | ||||
| 2025-08-08 | 13F | Foundations Investment Advisors, LLC | 2.846 | -21,12 | 216 | -20,88 | ||||
| 2025-08-14 | 13F | Royal Bank Of Canada | 595.360 | -20,36 | 45.187 | -20,38 | ||||
| 2025-07-11 | 13F | Compass Ion Advisors, LLC | 8.812 | 0,00 | 669 | 0,00 | ||||
| 2025-08-18 | 13F | Wolverine Trading, Llc | Put | 0 | -100,00 | 0 | ||||
| 2025-07-11 | 13F | Farther Finance Advisors, LLC | 1.070 | 618,12 | 81 | 636,36 | ||||
| 2025-08-27 | 13F/A | Brinker Capital Investments, LLC | 7.704 | 20,96 | 585 | 20,91 | ||||
| 2025-08-07 | 13F | Hennion & Walsh Asset Management, Inc. | 5.542 | 4,33 | 421 | 4,22 | ||||
| 2025-07-10 | 13F | Security National Bank | 150 | 0,00 | 11 | 0,00 | ||||
| 2025-07-15 | 13F | Revisor Wealth Management LLC | 119.517 | 21,58 | 8.981 | 20,34 | ||||
| 2025-08-04 | 13F | Wealth Management Associates, Inc. | 3.650 | -21,51 | 277 | -21,31 | ||||
| 2025-08-14 | 13F | Bank Of Hawaii | 84.162 | 4,91 | 6.388 | 4,89 | ||||
| 2025-07-25 | 13F | Prostatis Group LLC | 3.882 | -73,21 | 295 | -73,25 | ||||
| 2025-08-13 | 13F | Northwestern Mutual Wealth Management Co | 23.951 | -70,27 | 1.818 | -70,29 | ||||
| 2025-08-12 | 13F | O'shaughnessy Asset Management, Llc | 1.313 | 23,63 | 100 | 23,75 | ||||
| 2025-08-11 | 13F | Citigroup Inc | 1.356.114 | 4.898,02 | 102.929 | 4.898,98 | ||||
| 2025-07-10 | 13F | Rockland Trust Co | 9.903 | 0,45 | 752 | 0,40 | ||||
| 2025-08-11 | 13F | Angeles Investment Advisors, LLC | 1.606.000 | 0,00 | 121.895 | -0,01 | ||||
| 2025-08-13 | 13F | Farnam Financial LLC | 3.856 | 2,39 | 293 | 2,46 | ||||
| 2025-07-22 | 13F | Simplicity Wealth,LLC | 33.720 | 2.559 | ||||||
| 2025-04-25 | 13F | Tradewinds Capital Management, LLC | 0 | -100,00 | 0 | -100,00 | ||||
| 2025-05-08 | 13F | Harbour Investments, Inc. | 0 | -100,00 | 0 | |||||
| 2025-08-13 | 13F | Manning & Napier Advisors Llc | 15.853 | 48,62 | 1.203 | 48,70 | ||||
| 2025-08-11 | 13F | Banque Cantonale Vaudoise | 1.568 | 0,00 | 0 | |||||
| 2025-08-12 | 13F | Steward Partners Investment Advisory, Llc | 4.608 | -13,29 | 350 | -13,40 | ||||
| 2025-08-13 | 13F | Alerus Financial Na | 409.515 | 0,96 | 31.082 | 0,95 | ||||
| 2025-08-01 | 13F | James Investment Research Inc | 20.652 | -2,42 | 1.567 | -2,43 | ||||
| 2025-08-14 | 13F | Headlands Technologies LLC | 2.866 | 218 | ||||||
| 2025-08-14 | 13F | Heritage Wealth Management, Inc. | 4.845 | -23,84 | 368 | -23,86 | ||||
| 2025-08-11 | 13F | HighTower Advisors, LLC | 37.506 | 8,07 | 2.847 | 8,05 | ||||
| 2025-07-30 | 13F | Caliber Wealth Management, LLC / KS | 5.281 | 0,94 | 401 | 0,76 | ||||
| 2025-08-15 | 13F/A | Rakuten Securities, Inc. | 295 | 150,00 | 22 | 175,00 | ||||
| 2025-07-29 | 13F | Woodard & Co Asset Management Group Inc /adv | 86 | 0,00 | 7 | 0,00 | ||||
| 2025-08-12 | 13F | Bokf, Na | 0 | -100,00 | 0 | |||||
| 2025-08-14 | 13F | McIlrath & Eck, LLC | 51 | 0,00 | 4 | 0,00 | ||||
| 2025-08-12 | 13F | GDS Wealth Management | 567.222 | -8,01 | 43.052 | -8,02 | ||||
| 2025-08-14 | 13F | Financial Engines Advisors L.L.C. | 3.212 | 244 | ||||||
| 2025-07-24 | 13F | Galvin, Gaustad & Stein, LLC | 10.041 | -9,82 | 762 | -9,82 | ||||
| 2025-08-11 | 13F | Y.D. More Investments Ltd | 150 | 0,00 | 11 | 0,00 | ||||
| 2025-08-01 | 13F | Providence First Trust Co | 146.640 | -0,24 | 11.130 | -0,26 | ||||
| 2025-07-07 | 13F | Wesbanco Bank Inc | 40.017 | 4,11 | 3.037 | 4,11 | ||||
| 2025-07-10 | 13F | Wealth Enhancement Advisory Services, Llc | 10.455 | -31,20 | 788 | -31,66 | ||||
| 2025-07-02 | 13F | S. R. Schill & Associates | 17.387 | 1.320 | ||||||
| 2025-08-14 | 13F | Tudor Investment Corp Et Al | 0 | -100,00 | 0 | |||||
| 2025-07-14 | 13F | GAMMA Investing LLC | 0 | -100,00 | 0 | |||||
| 2025-07-17 | 13F | LifeGoal Wealth Advisors | 19.078 | 19,30 | 1.448 | 19,37 | ||||
| 2025-08-12 | 13F | Barings Llc | 35.856 | 0,00 | 2.721 | 0,00 | ||||
| 2025-08-27 | NP | FFSAX - Touchstone Flexible Income Fund Class A | 46.791 | 2,68 | 3.551 | 2,66 | ||||
| 2025-07-25 | 13F | Cwm, Llc | 960 | 1.115,19 | 0 | |||||
| 2025-08-01 | 13F | Envestnet Asset Management Inc | 336.965 | -13,15 | 25.570 | -13,19 | ||||
| 2025-08-13 | 13F | Johnson Financial Group, Inc. | 0 | -100,00 | 0 | |||||
| 2025-08-18 | 13F | Wolverine Trading, Llc | Call | 0 | -100,00 | 0 | ||||
| 2025-08-15 | 13F | Tower Research Capital LLC (TRC) | 20 | -57,45 | 2 | -66,67 | ||||
| 2025-08-08 | 13F | Francis Financial, Inc. | 0 | -100,00 | 0 | |||||
| 2025-08-04 | 13F | Assetmark, Inc | 59.120 | -60,22 | 4.487 | -60,23 | ||||
| 2025-08-15 | 13F | Captrust Financial Advisors | 14.474 | 218,67 | 1.099 | 219,19 | ||||
| 2025-07-18 | 13F | Union Bancaire Privee, UBP SA | 0 | -100,00 | 0 | |||||
| 2025-08-08 | 13F | SBI Securities Co., Ltd. | 35.005 | 6,19 | 2.657 | 6,16 | ||||
| 2025-08-06 | 13F | Commonwealth Equity Services, Llc | 77.217 | -3,06 | 6 | -16,67 | ||||
| 2025-07-07 | 13F | Thurston, Springer, Miller, Herd & Titak, Inc. | 103 | 0,00 | 8 | 0,00 | ||||
| 2025-08-06 | 13F | Prospera Financial Services Inc | 37.662 | -50,15 | 2.859 | -50,15 | ||||
| 2025-08-27 | NP | Brighthouse Funds Trust I - SSGA Growth ETF Portfolio Class A | 342.471 | 20,62 | 25.994 | 20,61 | ||||
| 2025-07-14 | 13F | Mechanics Bank Trust Department | 25.660 | 51,79 | 1.948 | 51,75 | ||||
| 2025-07-23 | 13F | Sax Wealth Advisors, Llc | 9.531 | 129,66 | 723 | 129,52 | ||||
| 2025-08-05 | 13F | Scarborough Advisors, LLC | 1.593 | 121 | ||||||
| 2025-04-25 | 13F | New Perspectives, Inc | 0 | -100,00 | 0 | |||||
| 2025-08-14 | 13F | Benjamin Edwards Inc | 436.328 | 35,30 | 33.117 | 35,28 | ||||
| 2025-07-10 | 13F | Redhawk Wealth Advisors, Inc. | 18.520 | 1.406 | ||||||
| 2025-07-10 | 13F | High Net Worth Advisory Group LLC | 11.414 | -16,61 | 866 | -16,65 | ||||
| 2025-08-13 | 13F | Cary Street Partner Investment Advisory Llc | 0 | -100,00 | 0 | |||||
| 2025-05-15 | 13F | Gwn Securities Inc. | 0 | -100,00 | 0 | |||||
| 2025-08-07 | 13F | Varma Mutual Pension Insurance Co | 1.600.000 | 0,00 | 121.440 | -0,01 | ||||
| 2025-06-27 | NP | Calamos ETF Trust - Calamos Alternative Nasdaq & Bond ETF | 1.204 | 75,00 | 90 | 74,51 | ||||
| 2025-08-07 | 13F | Davidson Capital Management Inc. | 292.881 | 22,06 | 22.230 | 22,04 | ||||
| 2025-08-07 | 13F | CENTRAL TRUST Co | 112 | 86,67 | 9 | 100,00 | ||||
| 2025-07-17 | 13F | Refined Wealth Management | 65.669 | 0,04 | 4.984 | 0,02 | ||||
| 2025-05-15 | 13F | Rakuten Investment Management, Inc. | 86.525 | 25,70 | 6.542 | 16,65 | ||||
| 2025-08-14 | 13F | Snowden Capital Advisors LLC | 31.674 | -1,14 | 2.404 | -1,15 | ||||
| 2025-08-12 | 13F | Proequities, Inc. | 0 | 0 | ||||||
| 2025-08-14 | 13F | Great Valley Advisor Group, Inc. | 5.806 | -73,46 | 440 | -73,49 | ||||
| 2025-05-13 | 13F | Resona Asset Management Co.,Ltd. | 0 | -100,00 | 0 | |||||
| 2025-08-18 | 13F | Castleark Management Llc | 236.450 | 17.947 | ||||||
| 2025-07-25 | 13F | Atria Wealth Solutions, Inc. | 11.817 | -32,79 | 895 | -32,98 | ||||
| 2025-08-13 | 13F | Cary Street Partners Financial Llc | 3.643 | -15,73 | 277 | -15,85 | ||||
| 2025-07-18 | 13F | Northeast Financial Group, Inc. | 139.065 | 11,01 | 10.555 | 11,00 | ||||
| 2025-07-24 | 13F | Conning Inc. | 11.380 | 0,00 | 864 | 0,00 | ||||
| 2025-08-11 | 13F | WPG Advisers, LLC | 206 | 121,51 | 16 | 114,29 | ||||
| 2025-08-14 | 13F | Dearborn Partners Llc | 23.968 | 77,70 | 1.819 | 77,81 | ||||
| 2025-07-29 | 13F | Quotient Wealth Partners, LLC | 0 | -100,00 | 0 | |||||
| 2025-08-12 | 13F | Global Retirement Partners, LLC | 16.817 | 107,18 | 1.276 | 110,56 | ||||
| 2025-08-12 | 13F | Running Point Capital Advisors, LLC | 736 | 0,00 | 56 | 0,00 | ||||
| 2025-08-14 | 13F | Bank Of America Corp /de/ | 2.389.158 | 0,46 | 181.337 | 0,45 | ||||
| 2025-08-05 | 13F | Bank of New York Mellon Corp | 49.808 | 155,15 | 3.780 | 155,23 | ||||
| 2025-07-24 | 13F | Stonebridge Financial Group, LLC | 8.557 | 17,06 | 649 | 17,15 | ||||
| 2025-07-24 | 13F | Aurora Private Wealth, Inc. | 2.798 | 1,45 | 0 | |||||
| 2025-07-28 | 13F | Courier Capital Llc | 32.148 | 5,96 | 2.440 | 5,95 | ||||
| 2025-09-04 | 13F/A | Advisor Group Holdings, Inc. | 268.855 | 20,56 | 20.418 | 20,59 | ||||
| 2025-04-25 | 13F | Wall Street Financial Group, Inc. | 17.123 | -10,52 | 1.300 | -9,16 | ||||
| 2025-08-13 | 13F | Victory Financial Group, Llc | 57.998 | -4,79 | 4.402 | -4,05 | ||||
| 2025-07-30 | 13F | Brookstone Capital Management | 3.708 | 7,42 | 281 | 7,25 | ||||
| 2025-08-06 | 13F | First Horizon Advisors, Inc. | 2.838 | 0,00 | 215 | 0,00 | ||||
| 2025-08-13 | 13F | Flow Traders U.s. Llc | 0 | -100,00 | 0 | |||||
| 2025-05-12 | 13F | Richard W. Paul & Associates, LLC | 0 | -100,00 | 0 | |||||
| 2025-08-01 | 13F | Advisory Alpha, LLC | 503.551 | -1,39 | 38.220 | -1,25 | ||||
| 2025-08-14 | 13F | Susquehanna International Group, Llp | Call | 115.800 | 14,31 | 8.789 | 14,31 | |||
| 2025-08-14 | 13F | Susquehanna International Group, Llp | Put | 82.200 | 108,10 | 6.239 | 108,07 | |||
| 2025-04-10 | 13F | Smith Anglin Financial, LLC | 0 | -100,00 | 0 | |||||
| 2025-08-29 | 13F | Evolution Wealth Management Inc. | 99 | 8 | ||||||
| 2025-08-12 | 13F | Ameritas Investment Partners, Inc. | 780 | 1,17 | 59 | 1,72 | ||||
| 2025-08-28 | NP | Northern Lights Fund Trust - Sierra Tactical Risk Spectrum 50 Fund Investor Class | 0 | -100,00 | 0 | -100,00 | ||||
| 2025-08-28 | NP | SIRAX - Sierra Tactical All Asset Fund Class A | 0 | -100,00 | 0 | -100,00 | ||||
| 2025-08-14 | 13F | Susquehanna International Group, Llp | 131.038 | -37,64 | 9.946 | -37,65 | ||||
| 2025-08-13 | 13F | Safe Harbor Fiduciary, LLC | 0 | -100,00 | 0 | |||||
| 2025-08-05 | 13F | Mma Asset Management Llc | 28.615 | -55,89 | 2.172 | -55,91 | ||||
| 2025-04-30 | 13F | POM Investment Strategies, LLC | 0 | -100,00 | 0 | |||||
| 2025-08-12 | 13F | Prudential Financial Inc | 10.865 | 832 | ||||||
| 2025-07-14 | 13F | Signature Securities Group Corporation | 0 | -100,00 | 0 | |||||
| 2025-08-08 | 13F | Cetera Investment Advisers | 154.519 | -41,45 | 11.728 | -41,46 | ||||
| 2025-08-08 | 13F | Capital Investment Advisory Services, LLC | 800 | 0,00 | 61 | 0,00 | ||||
| 2025-07-29 | 13F | Elevation Capital Advisory, LLC | 0 | -100,00 | 0 | -100,00 | ||||
| 2025-08-15 | 13F | State of Tennessee, Treasury Department | 2.827.927 | 3,94 | 214.640 | 3,93 | ||||
| 2025-08-15 | 13F | Provenance Wealth Advisors, LLC | 0 | -100,00 | 0 | |||||
| 2025-07-25 | 13F | Community Bank, N.A. | 0 | -100,00 | 0 | |||||
| 2025-04-14 | 13F | RWM Asset Management, LLC | 0 | -100,00 | 0 | |||||
| 2025-07-15 | 13F | LeConte Wealth Management, LLC | 75.996 | -9,14 | 5.768 | -9,15 | ||||
| 2025-07-28 | 13F | Mutual Advisors, LLC | 7.384 | 125,74 | 555 | 127,46 | ||||
| 2025-08-11 | 13F | Nations Financial Group Inc, /ia/ /adv | 41.751 | 8,57 | 3.169 | 8,53 | ||||
| 2025-08-08 | 13F | Gts Securities Llc | 0 | -100,00 | 0 | |||||
| 2025-07-14 | 13F | Painted Porch Advisors LLC | 0 | -100,00 | 0 | |||||
| 2025-07-17 | 13F | Beacon Capital Management, LLC | 847 | 1,56 | 64 | 1,59 | ||||
| 2025-08-26 | NP | TFPN - Blueprint Chesapeake Multi-Asset Trend ETF | 1.565 | 0,00 | 119 | 0,00 | ||||
| 2025-07-14 | 13F | Golden State Equity Partners | 10.103 | -5,45 | 767 | -5,55 | ||||
| 2025-08-14 | 13F | Comerica Bank | 50.096 | -8,63 | 3.802 | -8,63 | ||||
| 2025-07-21 | 13F | Ameritas Advisory Services, LLC | 2.798 | 2,23 | 212 | 3,92 | ||||
| 2025-08-14 | 13F | Toronto Dominion Bank | 200.000 | 15.180 | ||||||
| 2025-08-14 | 13F | Navigoe, LLC | 17 | 0 | ||||||
| 2025-07-01 | 13F | GP Brinson Investments LLC | 13.210 | 0,00 | 1.003 | 0,00 | ||||
| 2025-07-07 | 13F | Investors Research Corp | 843 | 0,00 | 64 | 0,00 | ||||
| 2025-07-31 | 13F | Hobart Private Capital, LLC | 5.695 | -79,30 | 432 | -79,31 | ||||
| 2025-04-28 | 13F | Financial Advocates Investment Management | 0 | -100,00 | 0 | |||||
| 2025-04-30 | 13F | Stratos Wealth Advisors, LLC | 0 | -100,00 | 0 | -100,00 | ||||
| 2025-08-08 | 13F | Diana Davis Spencer Foundation | 461.000 | 0,00 | 34.990 | -0,01 | ||||
| 2025-04-08 | 13F | Rooted Wealth Advisors, Inc. | 0 | -100,00 | 0 | |||||
| 2025-08-11 | 13F | TD Waterhouse Canada Inc. | 9.794 | -30,49 | 741 | -30,49 | ||||
| 2025-08-12 | 13F | PSI Advisors, LLC | 0 | -100,00 | 0 | |||||
| 2025-08-14 | 13F | Qube Research & Technologies Ltd | 0 | -100,00 | 0 | |||||
| 2025-07-24 | 13F | Antonelli Financial Advisors, LLC | 72.943 | 15,01 | 5.536 | 15,00 | ||||
| 2025-08-14 | 13F | Sei Investments Co | 146.574 | 664,60 | 11.125 | 664,60 | ||||
| 2025-07-14 | 13F | Financial Advisory Partners, Llc | 84.605 | 7,80 | 6.422 | 7,79 | ||||
| 2025-07-23 | 13F | Narwhal Capital Management | 0 | -100,00 | 0 | |||||
| 2025-08-12 | 13F | Jpmorgan Chase & Co | 219.122 | -37,34 | 16.631 | -37,35 | ||||
| 2025-08-13 | 13F/A | StoneX Group Inc. | 2.965 | 217 | ||||||
| 2025-05-13 | 13F | Brooklyn FI, LLC | 0 | -100,00 | 0 | -100,00 | ||||
| 2025-08-13 | 13F | GeoWealth Management, LLC | 5.036 | 12,51 | 382 | 12,68 | ||||
| 2025-08-04 | 13F | Lockheed Martin Investment Management Co | 0 | -100,00 | 0 | |||||
| 2025-07-24 | 13F | IFP Advisors, Inc | 0 | -100,00 | 0 | |||||
| 2025-08-07 | 13F | LFA - Lugano Financial Advisors SA | 7.266 | -4,07 | 546 | -5,05 | ||||
| 2025-07-17 | 13F | Fifth Third Securities, Inc. | 2.734 | 208 | ||||||
| 2025-05-15 | 13F | DSC Meridian Capital LP | 0 | -100,00 | 0 | |||||
| 2025-07-30 | NP | WTBN - WisdomTree Bianco Total Return Fund | 8.502 | -84,23 | 630 | -84,91 | ||||
| 2025-07-18 | 13F | Truist Financial Corp | 186.379 | -37,45 | 14.146 | -37,46 | ||||
| 2025-08-06 | 13F | Legacy Wealth Managment, LLC/ID | 23 | 0,00 | 2 | 0,00 | ||||
| 2025-08-12 | 13F | Franklin Resources Inc | 3.101 | 0,00 | 235 | 0,00 | ||||
| 2025-07-23 | 13F | Friedenthal Financial | 304 | 0,00 | 23 | 0,00 | ||||
| 2025-07-31 | 13F | Cambridge Investment Research Advisors, Inc. | 112.500 | 5,17 | 9 | 0,00 | ||||
| 2025-08-14 | 13F | SWAN Capital LLC | 245.377 | -5,91 | 18.624 | -5,92 | ||||
| 2025-07-07 | 13F | Bangor Savings Bank | 9.190 | 0,00 | 698 | 0,00 | ||||
| 2025-08-07 | 13F | Commerce Bank | 10.970 | 39,66 | 833 | 39,60 | ||||
| 2025-05-14 | 13F | Idaho Trust Bank | 0 | -100,00 | 0 | |||||
| 2025-07-17 | 13F | Nelson, Van Denburg & Campbell Wealth Management Group, LLC | 5.909 | 0,00 | 448 | 0,00 | ||||
| 2025-07-24 | 13F | Blair William & Co/il | 894 | 36,28 | 68 | 36,73 | ||||
| 2025-08-11 | 13F | United Capital Financial Advisers, Llc | 7.590 | 1,85 | 576 | 1,95 | ||||
| 2025-08-12 | 13F | Prudential Plc | 40.444.804 | -52,22 | 3.069.761 | -52,22 | ||||
| 2025-07-14 | 13F | Ridgewood Investments LLC | 200 | 0,00 | 15 | 0,00 | ||||
| 2025-08-14 | 13F | UBS Group AG | 649.790 | 2,13 | 49.319 | 2,12 | ||||
| 2025-08-05 | 13F | Palogic Value Management, L.P. | 34.565 | -3,20 | 2.620 | -3,25 | ||||
| 2025-08-06 | 13F | Summit Wealth Group, LLC | 3.186 | 0,00 | 0 | |||||
| 2025-08-29 | NP | BRMSX - Bramshill Income Performance Fund Institutional Class | 41.519 | 0,00 | 3.151 | 0,00 | ||||
| 2025-07-22 | 13F | Merit Financial Group, LLC | 6.710 | 509 | ||||||
| 2025-08-18 | 13F/A | National Bank Of Canada /fi/ | 342 | -7,82 | 26 | -10,71 | ||||
| 2025-07-14 | 13F | Sellwood Investment Partners LLC | 91.606 | 6,84 | 6.953 | 6,82 |