Grundlæggende statistik
| Institutionelle aktier (lange) | 514.770.435 - 88,63% (ex 13D/G) - change of -52,68MM shares -9,28% MRQ |
| Institutionel værdi (lang) | $ 42.533.538 USD ($1000) |
Institutionelt ejerskab og aktionærer
Edwards Lifesciences Corporation (US:EW) har 1512 institutionelle ejere og aktionærer, der har indsendt 13D/G- eller 13F-formularer til Securities Exchange Commission (SEC). Disse institutioner har i alt 514,771,893 aktier. Største aktionærer omfatter Vanguard Group Inc, BlackRock, Inc., Jpmorgan Chase & Co, State Street Corp, Wellington Management Group Llp, Bank of New York Mellon Corp, Fmr Llc, Jennison Associates Llc, Geode Capital Management, Llc, and VGHCX - Vanguard Health Care Fund Investor Shares .
Edwards Lifesciences Corporation (NYSE:EW) institutionel ejerskabsstruktur viser aktuelle positioner i virksomheden efter institutioner og fonde, samt seneste ændringer i positionsstørrelse. Større aktionærer kan omfatte individuelle investorer, investeringsforeninger, hedgefonde eller institutioner. Skema 13D angiver, at investoren besidder (eller besidder) mere end 5 % af virksomheden og har til hensigt (eller har til hensigt at) aktivt at forfølge en ændring i forretningsstrategi. Skema 13G indikerer en passiv investering på over 5%.
The share price as of March 19, 2026 is 82,48 / share. Previously, on March 19, 2025, the share price was 70,90 / share. This represents an increase of 16,33% over that period.

Fondens stemningsscore
Fund Sentiment Score (fka Ownership Accumulation Score) finder de aktier, der bliver mest købt af fonde. Det er resultatet af en sofistikeret, multi-faktor kvantitativ model, der identificerer virksomheder med de højeste niveauer af institutionel akkumulering. Scoringsmodellen bruger en kombination af den samlede stigning i oplyste ejere, ændringerne i porteføljeallokeringer i disse ejere og andre målinger. Tallet går fra 0 til 100, hvor højere tal indikerer et højere niveau af akkumulering for sine jævnaldrende, og 50 er gennemsnittet.
Opdateringsfrekvens: Dagligt
Se Ownership Explorer, som giver en liste over højest rangerende virksomheder.
AI+ Ask Fintel’s AI assistant about Edwards Lifesciences Corporation.
Select a question to share a public post with an AI-crafted answer.
Thinking of good questions…
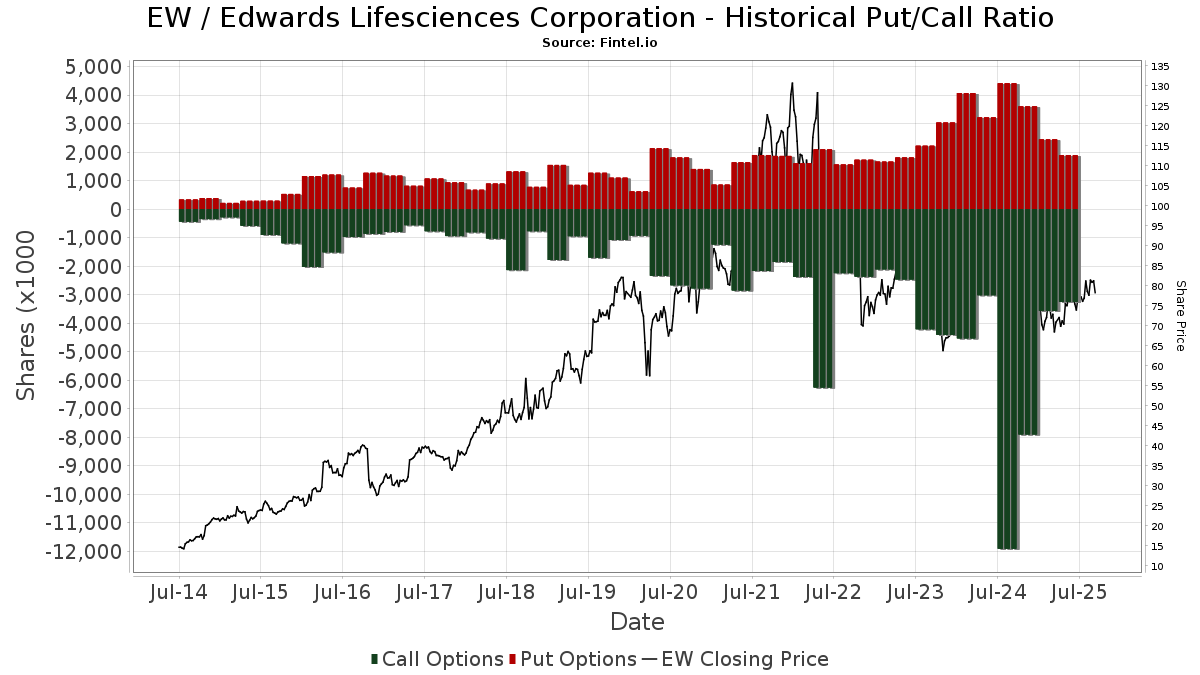
Institutionel Put/Call-forhold
Ud over at indberette standardaktie- og gældsudstedelser skal institutter med mere end 100 mill. aktiver under forvaltning også oplyse deres put- og call-optionsbeholdninger. Da salgsoptioner generelt indikerer negativ stemning, og købsoptioner indikerer positiv stemning, kan vi få en fornemmelse af den overordnede institutionelle stemning ved at plotte forholdet mellem put og kald. Diagrammet til højre viser det historiske put/call-forhold for dette instrument.
Brug af Put/Call Ratio som en indikator for investorernes stemning overvinder en af de vigtigste mangler ved at bruge totalt institutionelt ejerskab, som er, at en betydelig mængde af aktiver under forvaltning investeres passivt for at spore indekser. Passivt forvaltede fonde køber typisk ikke optioner, så indikatoren for put/call-forholdet følger mere nøje følelsen af aktivt forvaltede fonde.
13D/G-arkivering
Vi præsenterer 13D/G ansøgninger separat fra 13F ansøgninger på grund af den forskellige behandling af SEC. 13D/G-ansøgninger kan indgives af grupper af investorer (med én ledende), hvorimod 13F-ansøgninger ikke kan. Dette resulterer i situationer, hvor en investor kan indsende en 13D/G, der rapporterer én værdi for de samlede aktier (der repræsenterer alle de aktier, der ejes af investorgruppen), men derefter indsender en 13F, der rapporterer en anden værdi for de samlede aktier (der udelukkende repræsenterer deres egne) ejendomsret). Det betyder, at aktieejerskab af 13D/G-arkiver og 13F-arkiveringer ofte ikke er direkte sammenlignelige, så vi præsenterer dem separat.
Bemærk: Fra den 16. maj 2021 viser vi ikke længere ejere, der ikke har indsendt en 13D/G inden for det seneste år. Tidligere viste vi den fulde historie af 13D/G-arkiver. Generelt skal enheder, der er forpligtet til at indgive 13D/G-ansøgninger, indgive mindst årligt, før de indsender en afsluttende ansøgning. Dog forlader fonde nogle gange positioner uden at indsende en afsluttende ansøgning (dvs. de afvikler), så visning af den fulde historie resulterede nogle gange i forvirring om det nuværende ejerskab. For at undgå forvirring viser vi nu kun 'aktuelle' ejere - det vil sige - ejere, der har anmeldt inden for det seneste år.
Upgrade to unlock premium data.
| Fil dato | Form | Investor | Forrige Aktier |
Seneste Aktier |
Δ Aktier (Procent) |
Ejendomsret (Procent) |
Δ Ejerskab (Procent) |
|
|---|---|---|---|---|---|---|---|---|
| 2025-10-17 | BlackRock, Inc. | 52,171,889 | 44,267,376 | -15.15 | 7.50 | -12.79 | ||
| 2025-08-12 | WELLINGTON MANAGEMENT GROUP LLP | 31,532,725 | 19,826,483 | -37.12 | 3.40 | -34.99 |
13F og NPORT arkivering
Detaljer om 13F-arkivering er gratis. Detaljer om NP-ansøgninger kræver et premium-medlemskab. Grønne rækker angiver nye positioner. Røde rækker angiver lukkede positioner. Klik på linket ikon for at se den fulde transaktionshistorik.
Opgrader
for at låse premium-data op og eksportere til Excel ![]() .
.
Important Note
In an effort to reduce load times for our mobile users, we are testing some ways to deliver lighter pages.
In this first test, we will deliver only the most recent 750 transactions (out of 1795 for this stock). If you are interested in loading *all* the transactions for this company, click the "load all" button below. This is just a test and if you don't like it, please let us know by submitting some gentle feedback via the link at the bottom of this page.
Load All| Fil dato | Kilde | Investor | Type | Gennemsnitlig pris (Øst) |
Aktier | Δ Aktier (%) |
Rapporteret Værdi ($1000) |
Δ Værdi (%) |
Port Alloc (%) |
|
|---|---|---|---|---|---|---|---|---|---|---|
| 2026-02-17 | 13F | ExodusPoint Capital Management, LP | 0 | -100,00 | 0 | -100,00 | ||||
| 2026-01-26 | 13F | Chicago Capital, LLC | 19.685 | 0,00 | 1.678 | 9,67 | ||||
| 2026-02-17 | 13F | Capstone Investment Advisors, Llc | 0 | -100,00 | 0 | -100,00 | ||||
| 2026-02-17 | 13F | Capstone Investment Advisors, Llc | Call | 0 | -100,00 | 0 | -100,00 | |||
| 2026-02-17 | 13F | Wedgewood Partners Inc | 180.882 | -2,07 | 15.420 | 7,35 | ||||
| 2026-02-17 | 13F | Capstone Investment Advisors, Llc | Put | 0 | -100,00 | 0 | -100,00 | |||
| 2025-09-25 | NP | Dfa Investment Trust Co - The U.s. Large Cap Value Series This fund is a listed as child fund of Dimensional Fund Advisors Lp and if that institution has disclosed ownership in this security, then these positions will not be double counted when calculating total shares and total value | 898.221 | 6,99 | 71.238 | 12,40 | ||||
| 2026-02-02 | 13F | Caisse Des Depots Et Consignations | 51.766 | -19,36 | 4.413 | -11,60 | ||||
| 2026-02-10 | 13F | Moors & Cabot, Inc. | 55.272 | 1,74 | 4.712 | 11,50 | ||||
| 2026-01-28 | 13F | United Asset Strategies, Inc. | 191.745 | 1,29 | 16.346 | 11,03 | ||||
| 2026-01-06 | 13F | Unique Wealth, Llc | 3.291 | -12,24 | 281 | -3,78 | ||||
| 2026-02-06 | 13F | Midwest Professional Planners, LTD. | 28.991 | -21,16 | 2.471 | -13,57 | ||||
| 2026-02-13 | 13F | Quarry LP | 0 | -100,00 | 0 | -100,00 | ||||
| 2026-02-17 | 13F | Polar Capital Holdings Plc | 0 | -100,00 | 0 | |||||
| 2026-01-13 | 13F | Argentarii, LLC | 13.492 | -3,74 | 1.150 | 5,50 | ||||
| 2026-01-27 | 13F/A | GraniteShares Advisors LLC | 9.945 | 4,66 | 848 | 14,77 | ||||
| 2026-02-05 | 13F | AlphaCore Capital LLC | 6.745 | 46,19 | 575 | 60,61 | ||||
| 2026-02-05 | 13F | Northwestern Mutual Investment Management Company, Llc | 18.542 | -0,90 | 1.581 | 8,59 | ||||
| 2026-02-06 | 13F | Global Retirement Partners, LLC | 0 | -100,00 | 0 | -100,00 | ||||
| 2026-01-15 | 13F | Acima Private Wealth, Llc | 5.904 | 0,00 | 503 | 9,59 | ||||
| 2026-02-13 | 13F | Toroso Investments, LLC | 70.893 | -73,48 | 6.044 | -70,93 | ||||
| 2026-02-04 | 13F | HighPoint Advisor Group LLC | 10.939 | 4,68 | 933 | 14,78 | ||||
| 2026-02-17 | 13F | Woodline Partners LP | 1.070.634 | 91,34 | 91.272 | 109,75 | ||||
| 2026-02-18 | 13F | EP Wealth Advisors, Inc. | 44.378 | 0,69 | 3.783 | 9,75 | ||||
| 2026-02-10 | 13F | Ellevest, Inc. | 6.598 | -3,76 | 562 | 5,44 | ||||
| 2026-02-17 | 13F | Delta Global Management LP | 22.175 | 1.890 | ||||||
| 2026-02-17 | 13F | Perbak Capital Partners LLP | 0 | -100,00 | 0 | |||||
| 2026-02-13 | 13F | Neuberger Berman Group LLC | 328.766 | -4,54 | 28.027 | 4,64 | ||||
| 2026-02-05 | 13F | Beese Fulmer Investment Management, Inc. | 158.820 | 3,98 | 13.539 | 13,97 | ||||
| 2026-01-29 | 13F | D.a. Davidson & Co. | 10.794 | 7,27 | 920 | 17,65 | ||||
| 2026-02-17 | 13F | Maryland State Retirement & Pension System | 28.530 | 0,00 | 2.432 | 9,65 | ||||
| 2026-02-17 | 13F | Tcw Group Inc | 26.542 | 44,67 | 2.263 | 58,63 | ||||
| 2026-01-20 | 13F | Stratos Wealth Partners, LTD. | 14.991 | 2,26 | 1.278 | 12,02 | ||||
| 2026-01-15 | 13F | Bright Rock Capital Management, Llc | 25.000 | 0,00 | 2.131 | 9,62 | ||||
| 2026-02-13 | 13F | AlTi Global, Inc. | 5.052 | -3,57 | 431 | 5,65 | ||||
| 2026-02-04 | 13F | Virginia Retirement Systems Et Al | 675.711 | -26,82 | 57.604 | -19,78 | ||||
| 2026-02-10 | 13F | Westpac Banking Corp | 4.739 | 0,00 | 404 | 9,78 | ||||
| 2026-02-13 | 13F | Level Four Advisory Services, Llc | 3.521 | 6,66 | 300 | 17,19 | ||||
| 2026-02-10 | 13F | Core Wealth Advisors, Llc | 55 | 5 | ||||||
| 2026-01-26 | 13F | JNBA Financial Advisors | 481 | 6,89 | 41 | 20,59 | ||||
| 2026-01-26 | 13F | Provenance Wealth Advisors, LLC | 125 | 0,00 | 11 | 11,11 | ||||
| 2026-01-20 | 13F | Perpetual Ltd | 4.476 | 382 | ||||||
| 2025-09-22 | NP | IBALX - Transamerica Multi-Managed Balanced A | 34.419 | 14,11 | 2.730 | 19,85 | ||||
| 2026-02-11 | 13F | Fjarde Ap-fonden /fourth Swedish National Pension Fund | 134.035 | 11.426 | ||||||
| 2026-02-13 | 13F | NLB Skladi, upravljanje premozenja, d.o.o. | 31.959 | 2.725 | ||||||
| 2026-01-08 | 13F | NorthCrest Asset Manangement, LLC | 7.189 | 6,80 | 605 | 17,25 | ||||
| 2026-02-10 | 13F | Norges Bank | 9.427.396 | 803.686 | ||||||
| 2026-02-17 | 13F | Man Group plc | 1.610.036 | -18,17 | 137.256 | -10,29 | ||||
| 2025-09-24 | NP | PLFMX - LargeCap S&P 500 Index Fund R-3 | 101.426 | -2,39 | 8.044 | 2,55 | ||||
| 2026-01-23 | 13F | Assetmark, Inc | 4.253 | 37,68 | 363 | 50,83 | ||||
| 2025-09-24 | NP | BlackRock ETF Trust - Blackrock Future U.S. Themes ETF This fund is a listed as child fund of BlackRock, Inc. and if that institution has disclosed ownership in this security, then these positions will not be double counted when calculating total shares and total value | 222.430 | 410,08 | 17.641 | 436,01 | ||||
| 2026-01-13 | 13F | Parsons Capital Management Inc/ri | 3.169 | 0,00 | 270 | 9,76 | ||||
| 2026-01-29 | 13F | State Of Michigan Retirement System | 257.351 | -2,76 | 21.939 | 6,60 | ||||
| 2026-02-05 | 13F | Mesirow Financial Investment Management, Inc. | 4.942 | -3,61 | 421 | 5,78 | ||||
| 2026-02-17 | 13F | Citadel Advisors Llc | Put | 147.900 | 18,70 | 12.608 | 30,11 | |||
| 2025-09-29 | NP | PTLC - Pacer Trendpilot US Large Cap ETF | 36.588 | -9,84 | 2.902 | -1,29 | ||||
| 2026-01-27 | 13F | Highview Capital Management LLC/DE/ | 2.775 | 0,00 | 237 | 9,77 | ||||
| 2026-02-13 | 13F | Charles Schwab Investment Management Inc | 3.448.040 | -0,15 | 293.945 | 9,46 | ||||
| 2025-11-14 | 13F | Strategic Wealth Partners, Ltd. | 4.521 | 25,55 | 352 | 24,91 | ||||
| 2025-09-23 | NP | GCEQX - GREEN CENTURY EQUITY FUND Individual Investor Class | 16.729 | 7,64 | 1.327 | 13,04 | ||||
| 2026-02-17 | 13F | Citadel Advisors Llc | Call | 198.200 | -38,62 | 16.897 | -32,71 | |||
| 2026-02-17 | 13F | Citadel Advisors Llc | 2.203.927 | -47,95 | 187.885 | -42,95 | ||||
| 2026-02-11 | 13F | Illinois Municipal Retirement Fund | 30.967 | 0,30 | 2.640 | 9,91 | ||||
| 2026-02-10 | 13F | Principia Wealth Advisory, LLC | 38 | -92,59 | 3 | -92,31 | ||||
| 2026-02-17 | 13F | Tudor Investment Corp Et Al | Put | 7.600 | -63,64 | 648 | -60,18 | |||
| 2026-01-20 | 13F | Toth Financial Advisory Corp | 100 | 0,00 | 9 | 14,29 | ||||
| 2026-02-03 | 13F | Asset Planning,Inc | 25.927 | -5,20 | 2.210 | 3,95 | ||||
| 2026-02-10 | 13F | Arcadia Investment Management Corp/mi | 11 | 1 | ||||||
| 2026-02-17 | 13F | Tudor Investment Corp Et Al | Call | 13.300 | -57,91 | 1.134 | -53,89 | |||
| 2026-01-22 | 13F | Red Tortoise LLC | 155 | 0,00 | 13 | 8,33 | ||||
| 2026-02-10 | 13F | Fideuram Asset Management (Ireland) dac | 6.713 | 485 | ||||||
| 2025-10-08 | 13F | RDA Financial Network | 0 | -100,00 | 0 | -100,00 | ||||
| 2025-11-14 | 13F | Binnacle Investments Inc | 277 | 23,11 | 22 | 23,53 | ||||
| 2026-02-02 | 13F | Oppenheimer & Co Inc | 0 | -100,00 | 0 | -100,00 | ||||
| 2026-01-30 | 13F | Us Bancorp \de\ | 363.376 | -4,07 | 30.978 | 5,16 | ||||
| 2026-02-06 | 13F | Twin Capital Management Inc | 8.627 | 0,34 | 735 | 10,03 | ||||
| 2026-02-17 | 13F | DV Trading LLC | 700 | 60 | ||||||
| 2025-09-25 | NP | JCTR - JPMorgan Carbon Transition U.S. Equity ETF | 120 | -9,77 | 10 | -10,00 | ||||
| 2026-01-21 | 13F | Clayton Financial Group LLC | 37 | 3 | ||||||
| 2026-02-12 | 13F | Steward Partners Investment Advisory, Llc | 84.948 | 0,09 | 7.242 | 9,71 | ||||
| 2025-11-04 | 13F | Gitterman Wealth Management, LLC | 0 | -100,00 | 0 | -100,00 | ||||
| 2025-09-24 | NP | FHLC - Fidelity MSCI Health Care Index ETF This fund is a listed as child fund of Fmr Llc and if that institution has disclosed ownership in this security, then these positions will not be double counted when calculating total shares and total value | 250.481 | -3,13 | 19.866 | 1,77 | ||||
| 2025-09-29 | NP | LGDX - Intech S&P Large Cap Diversified Alpha ETF | 0 | -100,00 | 0 | -100,00 | ||||
| 2026-02-17 | 13F | Longaeva Partners L.P. | 259.367 | 3,96 | 22.111 | 13,96 | ||||
| 2026-02-18 | 13F | State of Tennessee, Treasury Department | 118.825 | -9,94 | 9.668 | -5,79 | ||||
| 2025-09-26 | NP | SUNAMERICA SERIES TRUST - SA JPMorgan Mid-Cap Growth Portfolio Class 1 | 40.152 | 3.184 | ||||||
| 2025-09-26 | NP | FITLX - Fidelity U.S. Sustainability Index Fund This fund is a listed as child fund of Fmr Llc and if that institution has disclosed ownership in this security, then these positions will not be double counted when calculating total shares and total value | 83.939 | 0,00 | 6.657 | 5,07 | ||||
| 2026-02-17 | 13F | Palo Alto Investors LP | 0 | -100,00 | 0 | |||||
| 2025-09-26 | NP | BRNY - Burney U.S. Factor Rotation ETF | 25.357 | 2.011 | ||||||
| 2026-01-16 | 13F | First Community Trust Na | 314 | 0,00 | 27 | 8,33 | ||||
| 2026-01-30 | 13F | Oakworth Capital, Inc. | 3.500 | 0,00 | 298 | 9,56 | ||||
| 2026-02-11 | 13F | MidWestOne Financial Group, Inc. | 2.636 | -31,17 | 225 | -24,58 | ||||
| 2026-02-17 | 13F | Longaeva Partners L.P. | Call | 845.000 | 0,00 | 72.036 | 9,62 | |||
| 2026-01-20 | 13F | AdvisorNet Financial, Inc | 1.940 | 15,96 | 165 | 26,92 | ||||
| 2026-02-02 | 13F | CENTRAL TRUST Co | 2.536 | 0,20 | 216 | 10,20 | ||||
| 2026-02-17 | 13F | CHICAGO TRUST Co NA | 0 | -100,00 | 0 | |||||
| 2026-02-03 | 13F | Crossmark Global Holdings, Inc. | 37.110 | 12,01 | 3.164 | 22,79 | ||||
| 2026-01-21 | 13F | Sound Income Strategies, LLC | 249 | 7,33 | 21 | 23,53 | ||||
| 2025-10-24 | 13F | Hemington Wealth Management | 656 | -1,06 | 0 | |||||
| 2025-09-26 | NP | RSEAX - U.S. Strategic Equity Fund Class A | 171.815 | -20,12 | 13.627 | -16,09 | ||||
| 2026-01-20 | 13F | Signaturefd, Llc | 7.705 | 0,90 | 657 | 10,62 | ||||
| 2025-11-10 | 13F | Y.D. More Investments Ltd | 0 | -100,00 | 0 | -100,00 | ||||
| 2025-09-26 | NP | Eaton Vance Tax-managed Diversified Equity Income Fund | 292.852 | 0,00 | 23.226 | 5,06 | ||||
| 2025-09-25 | NP | HART - IQ Healthy Hearts ETF | 1.693 | 13,24 | 134 | 19,64 | ||||
| 2026-02-02 | 13F | Oppenheimer Asset Management Inc. | 0 | -100,00 | 0 | |||||
| 2026-01-27 | 13F | Ninety One UK Ltd | 7.734.946 | -2,20 | 659.404 | 7,21 | ||||
| 2026-01-26 | 13F | Spectrum Asset Management, Inc. (NB/CA) | 35.770 | -8,19 | 3.049 | 0,66 | ||||
| 2026-02-05 | 13F | Atria Investments Llc | 11.285 | 32,11 | 962 | 44,88 | ||||
| 2026-02-05 | 13F | Bessemer Group Inc | 18.636 | -1,48 | 2 | 0,00 | ||||
| 2026-02-23 | 13F | Mv Capital Management, Inc. | 308 | 0,98 | 26 | 13,04 | ||||
| 2026-02-12 | 13F | SWAN Capital LLC | 16 | -58,97 | 1 | -66,67 | ||||
| 2026-02-11 | 13F | Los Angeles Capital Management Llc | 2.674 | -3,33 | 223 | 3,72 | ||||
| 2026-02-14 | 13F | Frec Markets, Inc. | 3.663 | 312 | ||||||
| 2026-02-13 | 13F | Towarzystwo Funduszy Inwestycyjnych Pzu Sa | 0 | -100,00 | 0 | |||||
| 2026-01-30 | 13F | Ares Financial Consulting, LLC | 247 | 21 | ||||||
| 2026-01-22 | 13F | Financial Consulate, Inc | 6 | 0,00 | 1 | |||||
| 2026-02-06 | 13F | McKinley Carter Wealth Services, Inc. | 5.283 | -1,53 | 450 | 7,91 | ||||
| 2026-02-18 | 13F | GWM Advisors LLC | 27.138 | -0,02 | 2.314 | 9,62 | ||||
| 2026-02-17 | 13F | California State Teachers Retirement System | 906.044 | -0,08 | 77.240 | 9,53 | ||||
| 2026-02-04 | 13F | C WorldWide Group Holding A/S | 461.353 | 16,35 | 39 | 30,00 | ||||
| 2026-02-17 | 13F | Credit Agricole S A | 237.036 | 277,93 | 20.207 | 314,33 | ||||
| 2025-11-12 | 13F | Simplex Trading, Llc | 0 | -100,00 | 0 | |||||
| 2026-01-29 | 13F | Financial Life Planners | 0 | -100,00 | 0 | |||||
| 2026-02-13 | 13F | Rafferty Asset Management, LLC | 62.479 | -4,13 | 5.326 | 5,09 | ||||
| 2026-02-17 | 13F | LMR Partners LLP | 0 | -100,00 | 0 | |||||
| 2026-01-16 | 13F | Linden Thomas Advisory Services, LLC | 11.516 | -1,12 | 982 | 8,40 | ||||
| 2026-02-12 | 13F | Xponance, Inc. | 88.130 | 6,02 | 7.513 | 16,23 | ||||
| 2026-01-28 | 13F | Caliber Wealth Management, LLC / KS | 21.674 | 7,38 | 1.848 | 17,72 | ||||
| 2026-02-13 | 13F | Neo Ivy Capital Management | 0 | -100,00 | 0 | -100,00 | ||||
| 2026-01-21 | 13F | Azzad Asset Management Inc /adv | 0 | -100,00 | 0 | |||||
| 2026-02-12 | 13F | Ankerstar Wealth, LLC | 27 | 2 | ||||||
| 2026-02-12 | 13F | Swiss National Bank | 1.608.800 | -4,86 | 137.150 | 4,29 | ||||
| 2026-02-17 | 13F | Public Employees Retirement System Of Ohio | 246.276 | -3,88 | 20.995 | 5,37 | ||||
| 2025-11-12 | 13F | Berry Wealth Group, LP | 0 | -100,00 | 0 | |||||
| 2026-02-17 | 13F | Parkman Healthcare Partners LLC | 150.985 | -3,07 | 12.871 | 6,26 | ||||
| 2026-02-11 | 13F | Allianz Asset Management GmbH | Call | 21.400 | 40,79 | 1.824 | 54,31 | |||
| 2026-01-23 | 13F | Whitener Capital Management, Inc. | 8.348 | -11,41 | 712 | -2,87 | ||||
| 2026-02-11 | 13F | Allianz Asset Management GmbH | 2.192.270 | 25,35 | 186.891 | 37,40 | ||||
| 2026-02-04 | 13F | Tsfg, Llc | 71.290 | -0,44 | 6 | 20,00 | ||||
| 2026-01-30 | 13F | Jennison Associates Llc | 13.780.515 | -1,28 | 1.174.789 | 8,22 | ||||
| 2026-01-20 | 13F | Independence Bank of Kentucky | 2.550 | 0,00 | 217 | 9,60 | ||||
| 2026-01-21 | 13F | Baker Ellis Asset Management LLC | 3.350 | 0,00 | 286 | 9,62 | ||||
| 2026-02-06 | 13F | Resona Asset Management Co.,Ltd. | 184.684 | -3,86 | 15.801 | 5,90 | ||||
| 2025-09-26 | NP | ETTOX - E*TRADE No Fee Total Market Index Fund | 285 | 122,66 | 23 | 144,44 | ||||
| 2026-01-15 | 13F | Fulcrum Capital LLC | 137.220 | 2,50 | 11.698 | 12,37 | ||||
| 2026-02-17 | 13F | Boothbay Fund Management, Llc | 3.201 | -6,65 | 273 | 2,26 | ||||
| 2026-02-17 | 13F | Advanced Portfolio Management, LLC | 0 | -100,00 | 0 | |||||
| 2026-02-20 | 13F | Kovitz Investment Group Partners, LLC | 14.985 | -54,14 | 1.277 | -49,74 | ||||
| 2026-01-30 | 13F | State of New Jersey Common Pension Fund D | 201.347 | -1,33 | 17.165 | 8,15 | ||||
| 2026-02-12 | 13F | IFC & Insurance Marketing, Inc. | 39 | 0 | ||||||
| 2026-02-09 | 13F | Legal & General Group Plc | 4.415.969 | 7,53 | 376.461 | 17,87 | ||||
| 2026-02-13 | 13F | Kempen Capital Management N.v. | 176.519 | 33,42 | 15.048 | 46,27 | ||||
| 2026-02-06 | 13F | Vestmark Advisory Solutions, Inc. | 11.796 | 56,70 | 1.006 | 71,79 | ||||
| 2025-09-26 | NP | IMCG - iShares Morningstar Mid-Cap Growth ETF | 285.979 | 7,66 | 22.681 | 13,11 | ||||
| 2025-09-26 | NP | RNIN - Bushido Capital US SMID Cap Equity ETF | 57 | 5 | ||||||
| 2026-02-13 | 13F | Banco Santander, S.A. | 4.389 | 10,44 | 374 | 21,04 | ||||
| 2026-02-02 | 13F | Chapman Financial Group, Llc | 800 | 0,00 | 68 | 9,68 | ||||
| 2025-11-14 | 13F | Point72 (DIFC) Ltd | 386.867 | 0,23 | 30.087 | -0,33 | ||||
| 2026-01-08 | 13F | American National Bank of Texas | 3.852 | -6,00 | 328 | 3,14 | ||||
| 2026-02-10 | 13F | Wormser Freres Gestion | 91.851 | -2,84 | 7.833 | 6,00 | ||||
| 2025-11-14 | 13F | Point72 (DIFC) Ltd | Put | 100 | 8 | |||||
| 2026-02-11 | 13F | Allianz Asset Management GmbH | Put | 24.400 | 25,77 | 2.080 | 37,93 | |||
| 2025-09-26 | NP | INVESCO ACTIVELY MANAGED EXCHANGE-TRADED FUND TRUST - Invesco Global Equity Net Zero ETF | 1.108 | 88 | ||||||
| 2026-01-23 | 13F | Rede Wealth, LLC | 0 | -100,00 | 0 | |||||
| 2026-02-12 | 13F | M&G Plc | 4.661 | 0,00 | 396 | 9,09 | ||||
| 2026-02-11 | 13F | Schulhoff & Co Inc | 2.856 | 0,00 | 243 | 9,95 | ||||
| 2025-11-13 | 13F | Wells Fargo & Company/mn | Put | 0 | -100,00 | 0 | -100,00 | |||
| 2026-01-15 | 13F | Bourgeon Capital Management Llc | 3.007 | 0,00 | 256 | 9,87 | ||||
| 2025-09-25 | NP | WRND - IQ Global Equity R&D Leaders ETF | 96 | -6,80 | 8 | 0,00 | ||||
| 2026-02-12 | 13F | Jasper Ridge Partners, L.P. | 105.000 | 0,00 | 8.951 | 9,63 | ||||
| 2026-02-12 | 13F | Lansforsakringar Fondforvaltning AB (publ) | 189.396 | -30,71 | 16.146 | -24,04 | ||||
| 2026-02-04 | 13F | Nwam Llc | 32.005 | 143,46 | 2.698 | 172,15 | ||||
| 2026-02-02 | 13F | Truist Financial Corp | 55.104 | 2,38 | 4.698 | 12,23 | ||||
| 2026-02-10 | 13F | Peapack Gladstone Financial Corp | 261.416 | -3,06 | 22 | 10,00 | ||||
| 2026-02-13 | 13F | Ostrum Asset Management | 54.052 | 0,86 | 4.608 | 10,56 | ||||
| 2026-02-13 | 13F | Bridgewater Associates, LP | 76.762 | -57,43 | 6.544 | -53,34 | ||||
| 2026-01-15 | 13F | Fifth Third Wealth Advisors LLC | 5.035 | -4,60 | 429 | 4,63 | ||||
| 2026-02-06 | 13F | Verde Capital Management | 2.730 | 0,00 | 233 | 9,43 | ||||
| 2026-01-20 | 13F | Trust Co Of Toledo Na /oh/ | 1.854 | -28,99 | 158 | -22,17 | ||||
| 2026-02-03 | 13F | SBI Securities Co., Ltd. | 547 | -28,87 | 47 | -22,03 | ||||
| 2026-01-27 | 13F | Leisure Capital Management | 7.701 | 0,00 | 657 | 9,70 | ||||
| 2026-02-17 | 13F | Jump Financial, LLC | 21.934 | -69,44 | 1.870 | -66,52 | ||||
| 2026-01-26 | 13F | KBC Group NV | 371.758 | -22,35 | 32 | -16,22 | ||||
| 2026-02-06 | 13F | HighTower Advisors, LLC | 141.326 | 5,38 | 12.048 | 15,52 | ||||
| 2026-02-12 | 13F | Keel Point, LLC | 5.149 | -2,68 | 439 | 6,57 | ||||
| 2026-01-26 | 13F | Townsend & Associates, Inc | 193.657 | 1,75 | 16.362 | 15,18 | ||||
| 2026-01-23 | 13F | Steigerwald, Gordon & Koch Inc. | 368 | -5,88 | 31 | 3,33 | ||||
| 2026-03-17 | 13F | Stance Capital Llc | 0 | -100,00 | 0 | |||||
| 2026-02-10 | 13F | Lido Advisors, LLC | 35.111 | -0,43 | 2.739 | -0,15 | ||||
| 2026-01-05 | 13F | Park Avenue Securities Llc | 8.521 | 59,93 | 1 | |||||
| 2026-02-11 | 13F | West Family Investments, Inc. | 2.655 | 0,00 | 226 | 9,71 | ||||
| 2026-02-09 | 13F | Frazier Financial Advisors, LLC | 1.402 | 9,70 | 120 | 20,20 | ||||
| 2026-02-17 | 13F | Ameriprise Financial Inc | 674.344 | 10,34 | 57.221 | 20,95 | ||||
| 2026-01-16 | 13F | Tema Etfs Llc | 19.947 | -10,74 | 1.700 | -2,19 | ||||
| 2026-02-11 | 13F | Fox Run Management, L.l.c. | 24.308 | 2.072 | ||||||
| 2026-01-23 | 13F | Bowman & Co S.C. | 8.407 | -0,24 | 717 | 9,31 | ||||
| 2025-09-25 | NP | STNC - Hennessy Stance ESG Large Cap ETF | 38.222 | 108,82 | 3.031 | 147,23 | ||||
| 2026-02-09 | 13F | Wellington Shields Capital Management, LLC | 47.531 | 0,00 | 4.052 | 9,63 | ||||
| 2026-02-17 | 13F | Titan Wealth (CI) Ltd | 83.561 | 7.123 | ||||||
| 2026-02-06 | 13F | Covestor Ltd | 1.784 | 9,65 | 0 | |||||
| 2026-02-06 | 13F | Creative Financial Designs Inc /adv | 170 | 0,00 | 14 | 7,69 | ||||
| 2026-02-10 | 13F | Intech Investment Management Llc | 69.347 | 22,18 | 5.912 | 33,95 | ||||
| 2026-02-13 | 13F | Mml Investors Services, Llc | 17.782 | 48,01 | 1.516 | 62,21 | ||||
| 2026-02-13 | 13F | Pinnacle Wealth Planning Services, Inc. | 488 | 42 | ||||||
| 2025-09-24 | NP | SFLNX - Schwab Fundamental US Large Company Index Fund Institutional Shares | 85.490 | 4,21 | 6.780 | 9,48 | ||||
| 2026-02-03 | 13F | Wilson Asset Management (international) Pty Ltd | 144.918 | -3,27 | 12.354 | 6,03 | ||||
| 2026-02-10 | 13F | Rothschild Investment Llc | 14.006 | -1,62 | 1.194 | 7,86 | ||||
| 2026-02-05 | 13F | High Note Wealth, LLC | 31 | -39,22 | 3 | -33,33 | ||||
| 2025-09-25 | NP | DFLV - Dimensional US Large Cap Value ETF | 138.652 | 46,06 | 10.996 | 53,45 | ||||
| 2026-02-02 | 13F | Danske Bank A/s | 346.523 | 10,24 | 29.541 | 20,85 | ||||
| 2025-12-01 | 13F/A | Polar Asset Management Partners Inc. | 0 | -100,00 | 0 | -100,00 | ||||
| 2026-02-05 | 13F | Allworth Financial LP | 78.182 | 1.320,20 | 6.665 | 1.457,01 | ||||
| 2026-02-13 | 13F | Squarepoint Ops LLC | Put | 0 | -100,00 | 0 | -100,00 | |||
| 2026-01-21 | 13F | SJS Investment Consulting Inc. | 92 | 360,00 | 8 | 600,00 | ||||
| 2026-02-17 | 13F | Advisor Group Holdings, Inc. | 43.202 | -2,24 | 3.683 | 5,26 | ||||
| 2025-09-24 | NP | SWLVX - Schwab U.S. Large-Cap Value Index Fund This fund is a listed as child fund of Charles Schwab Investment Management Inc and if that institution has disclosed ownership in this security, then these positions will not be double counted when calculating total shares and total value | 17.617 | 16,10 | 1.397 | 22,01 | ||||
| 2025-11-07 | 13F | Beacon Capital Management, LLC | 0 | -100,00 | 0 | |||||
| 2026-01-16 | 13F | Standard Life Aberdeen plc | 503.502 | -1,01 | 42.924 | 9,33 | ||||
| 2026-02-17 | 13F | Ancora Advisors, LLC | 339 | 606,25 | 29 | 833,33 | ||||
| 2026-02-17 | 13F | Boreal Capital Management LLC | 120 | 0,00 | 10 | 11,11 | ||||
| 2026-01-28 | 13F | DekaBank Deutsche Girozentrale | 1.747.168 | 0,00 | 164 | 22,39 | ||||
| 2026-01-30 | 13F | Kohmann Bosshard Financial Services, LLC | 330 | 28 | ||||||
| 2026-02-03 | 13F | Orion Capital Management LLC | 1.524 | 0,00 | 130 | 9,32 | ||||
| 2025-09-26 | NP | RGEAX - Global Equity Fund Class A | 37.662 | 498,76 | 2.987 | 529,96 | ||||
| 2026-01-28 | 13F | Torray Llc | 2.994 | 0,00 | 255 | 9,91 | ||||
| 2026-02-06 | 13F | Cullen/frost Bankers, Inc. | 14.750 | -1,36 | 1.257 | 8,18 | ||||
| 2025-09-26 | NP | TIGRX - TIAA-CREF Growth & Income Fund Institutional Class | 560.383 | 1,47 | 44.444 | 6,60 | ||||
| 2026-01-23 | 13F | Parthenon Llc | 2.526 | 215 | ||||||
| 2025-11-10 | 13F | Siligmueller & Norvid Wealth Advisors LLC | 4.911 | 382 | ||||||
| 2026-01-07 | 13F | Retirement Wealth Solutions LLC | 10 | 11,11 | 1 | |||||
| 2025-10-15 | 13F | Stephens Consulting, LLC | 0 | -100,00 | 0 | |||||
| 2026-02-17 | 13F | Harvest Investment Services, LLC | 2.364 | 202 | ||||||
| 2026-02-13 | 13F | Arete Wealth Advisors, LLC | 3.626 | -7,64 | 0 | |||||
| 2026-02-03 | 13F | Farmers & Merchants Investments Inc | 125.707 | 1,59 | 10.717 | 11,36 | ||||
| 2026-02-09 | 13F/A | Swedbank AB | 307.563 | -38,49 | 26.220 | -32,57 | ||||
| 2026-02-10 | 13F | Natixis Advisors, L.p. | 253.082 | -1,64 | 22 | 5,00 | ||||
| 2025-09-26 | NP | LVPIX - Large-cap Value Profund Investor Class | 109 | -96,65 | 9 | -96,73 | ||||
| 2026-01-14 | 13F | Wealthcare Advisory Partners LLC | 6.888 | 6,08 | 587 | 16,47 | ||||
| 2026-02-05 | 13F | Applied Finance Capital Management, LLC | 0 | -100,00 | 0 | |||||
| 2026-02-17 | 13F | Two Sigma Advisers, Lp | 110.006 | 25,86 | 9.378 | 37,97 | ||||
| 2025-09-24 | NP | SWTSX - Schwab Total Stock Market Index Fund This fund is a listed as child fund of Charles Schwab Investment Management Inc and if that institution has disclosed ownership in this security, then these positions will not be double counted when calculating total shares and total value | 281.883 | 0,01 | 22.356 | 5,08 | ||||
| 2026-03-04 | 13F/A | Pure Financial Advisors, Inc. | 2.547 | 217 | ||||||
| 2026-01-27 | 13F | Tributary Capital Management, LLC | 5.020 | -1,95 | 428 | 7,29 | ||||
| 2025-11-07 | 13F | Sierra Ocean, Llc | 0 | -100,00 | 0 | |||||
| 2026-02-13 | 13F | Ossiam | 20.633 | -29,73 | 1.759 | -23,00 | ||||
| 2026-02-12 | 13F | JPL Wealth Management, LLC | 0 | -100,00 | 0 | |||||
| 2026-01-15 | 13F | Trust Co | 725 | -22,04 | 62 | -15,28 | ||||
| 2025-09-29 | NP | PEVC - Pacer PE/VC ETF | 12 | -7,69 | 1 | |||||
| 2026-02-03 | 13F | Generali Asset Management SPA SGR | 72.539 | 79,71 | 6.184 | 96,97 | ||||
| 2026-02-05 | 13F | Center for Financial Planning, Inc. | 1.904 | -17,97 | 162 | -10,00 | ||||
| 2026-01-29 | 13F | Nbc Securities, Inc. | 75 | 0,00 | 6 | 20,00 | ||||
| 2025-11-06 | 13F | Versor Investments LP | 0 | -100,00 | 0 | |||||
| 2026-02-11 | 13F | Vestor Capital, Llc | 1.894 | -35,58 | 0 | |||||
| 2026-02-17 | 13F | Alliancebernstein L.p. | 2.512.284 | 143,38 | 214.172 | 166,79 | ||||
| 2026-01-12 | 13F | Abound Wealth Management | 103 | -0,96 | 9 | 0,00 | ||||
| 2026-02-17 | 13F | Blair William & Co/il | 344.800 | -7,40 | 29.394 | 1,51 | ||||
| 2026-01-27 | 13F | Forum Financial Management, LP | 7.702 | 0,00 | 657 | 9,70 | ||||
| 2026-02-12 | 13F | Voya Investment Management Llc | 91.462 | -10,07 | 7.797 | -1,42 | ||||
| 2025-09-29 | NP | PBP - Invesco S&P 500 BuyWrite ETF This fund is a listed as child fund of Invesco Ltd. and if that institution has disclosed ownership in this security, then these positions will not be double counted when calculating total shares and total value | 3.132 | 76,15 | 248 | 85,07 | ||||
| 2026-02-12 | 13F | McMillan Office, Inc. | 10.890 | 928 | ||||||
| 2025-11-13 | 13F | Texas Capital Bancshares Inc/tx | 17 | 1 | ||||||
| 2025-11-04 | 13F | Cornerstone Wealth Management, LLC | 0 | -100,00 | 0 | |||||
| 2026-01-23 | 13F | Patton Fund Management, Inc. | 2.739 | -5,42 | 234 | 3,56 | ||||
| 2026-02-04 | 13F | Advisor OS, LLC | 2.471 | 211 | ||||||
| 2026-02-13 | 13F | Sei Investments Co | 408.660 | -5,41 | 34.840 | 3,70 | ||||
| 2025-09-24 | NP | SWPPX - Schwab S&P 500 Index Fund This fund is a listed as child fund of Charles Schwab Investment Management Inc and if that institution has disclosed ownership in this security, then these positions will not be double counted when calculating total shares and total value | 1.306.547 | -0,01 | 103.622 | 5,05 | ||||
| 2025-09-29 | NP | XYLG - Global X S&P 500 Covered Call & Growth ETF This fund is a listed as child fund of Mirae Asset Global Investments Co., Ltd. and if that institution has disclosed ownership in this security, then these positions will not be double counted when calculating total shares and total value | 555 | -15,53 | 44 | -10,20 | ||||
| 2026-01-12 | 13F | Avanza Fonder AB | 73.043 | 1,82 | 6.227 | 11,62 | ||||
| 2026-02-02 | 13F | Saranac Partners Ltd | 0 | -100,00 | 0 | -100,00 | ||||
| 2026-01-26 | 13F | Main Street Group, LTD | 0 | -100,00 | 0 | |||||
| 2026-02-13 | 13F | Kcm Investment Advisors Llc | 2.518 | 215 | ||||||
| 2026-01-14 | 13F | Wolff Wiese Magana Llc | 141 | 36,89 | 12 | 50,00 | ||||
| 2026-02-13 | 13F | Seneschal Advisors, LLC | 6 | 0,00 | 1 | |||||
| 2025-11-14 | 13F | Caption Management, LLC | 0 | -100,00 | 0 | |||||
| 2026-02-13 | 13F | Pathstone Holdings, LLC | 76.386 | -8,40 | 6.512 | 0,40 | ||||
| 2026-02-17 | 13F | Laird Norton Trust Company, Llc | 22.020 | 1.877 | ||||||
| 2026-02-17 | 13F | Qube Research & Technologies Ltd | Put | 1.900 | -53,66 | 162 | -49,37 | |||
| 2026-02-17 | 13F | Qube Research & Technologies Ltd | Call | 5.200 | -55,17 | 443 | -50,89 | |||
| 2025-09-26 | NP | QRFT - QRAFT AI-Enhanced U.S. Large Cap ETF | 135 | -18,18 | 11 | -16,67 | ||||
| 2026-02-17 | 13F | Qube Research & Technologies Ltd | 1.115.224 | 67,77 | 95.073 | 83,90 | ||||
| 2026-02-17 | 13F | Kemnay Advisory Services Inc. | 320 | 27 | ||||||
| 2026-02-10 | 13F | Shepherd Street Advisors LLC | 5.134 | 438 | ||||||
| 2026-02-12 | 13F | Logan Capital Management Inc | 3.621 | 0,00 | 309 | 9,61 | ||||
| 2026-02-13 | 13F | Alberta Investment Management Corp | 49.730 | -27,19 | 4.239 | -20,18 | ||||
| 2025-09-26 | NP | HTEC - ROBO Global(R) Healthcare Technology and Innovation ETF | 9.122 | -18,35 | 723 | -14,23 | ||||
| 2026-02-13 | 13F | L2 Asset Management, LLC | 3.121 | 6,77 | 266 | 17,18 | ||||
| 2026-02-12 | 13F | Dimensional Fund Advisors Lp | 3.600.884 | -2,25 | 306.997 | 7,17 | ||||
| 2026-01-29 | 13F | Munich Reinsurance Co Stock Corp in Munich | 53.923 | 3.673,48 | 4.648 | 4.087,39 | ||||
| 2026-02-13 | 13F | Kestra Advisory Services, LLC | 0 | -100,00 | 0 | |||||
| 2025-09-25 | NP | JDOC - JPMorgan Healthcare Leaders ETF | 1.458 | -3,89 | 116 | -10,16 | ||||
| 2026-02-17 | 13F | Liontrust Investment Partners LLP | 1.244.381 | -8,51 | 106.083 | 0,29 | ||||
| 2026-01-23 | 13F | Aspect Partners, LLC | 10 | 1 | ||||||
| 2026-01-09 | 13F | Seilern Investment Management Ltd | 923.260 | -12,55 | 78.708 | -4,14 | ||||
| 2026-02-03 | 13F | Morse Asset Management, Inc | 164 | 31,20 | 14 | 44,44 | ||||
| 2026-02-02 | 13F | JDM Financial Group LLC | 135 | 0,00 | 12 | 10,00 | ||||
| 2025-09-24 | NP | SUSA - iShares MSCI USA ESG Select ETF | 280.044 | -3,26 | 22.210 | 1,64 | ||||
| 2025-11-17 | 13F | LGT Financial Advisors LLC | 0 | -100,00 | 0 | |||||
| 2026-02-17 | 13F | Quantinno Capital Management LP | 403.347 | 18,14 | 34.385 | 29,50 | ||||
| 2026-02-02 | 13F | Mutual Advisors, LLC | 3.063 | -3,41 | 261 | 7,85 | ||||
| 2026-01-09 | 13F | Dynamic Advisor Solutions LLC | 15.788 | 1,27 | 1.346 | 10,97 | ||||
| 2026-02-10 | 13F | DT Investment Partners, LLC | 81 | 0,00 | 7 | 0,00 | ||||
| 2026-02-10 | 13F | Bank of New York Mellon Corp | 17.492.589 | -7,98 | 1.491.243 | 0,87 | ||||
| 2026-02-17 | 13F | Quantitative Investment Management, LLC | 4.165 | 0 | ||||||
| 2026-02-13 | 13F | Y-Intercept (Hong Kong) Ltd | 9.550 | 814 | ||||||
| 2025-11-14 | 13F | ICONIQ Capital, LLC | 0 | -100,00 | 0 | |||||
| 2026-01-05 | 13F | GAMMA Investing LLC | 10.383 | 5,40 | 885 | 15,54 | ||||
| 2026-01-12 | 13F | CVA Family Office, LLC | 1.016 | -9,04 | 87 | 0,00 | ||||
| 2026-02-05 | 13F | Avantax Planning Partners, Inc. | 2.447 | 209 | ||||||
| 2026-01-23 | 13F | Sage Mountain Advisors LLC | 3.080 | 10,55 | 263 | 21,30 | ||||
| 2026-02-09 | 13F | Smithfield Trust Co | 771 | 0,00 | 0 | |||||
| 2026-01-27 | 13F | MASTERINVEST Kapitalanlage GmbH | 22.274 | 0,00 | 1.920 | 10,85 | ||||
| 2026-01-27 | 13F | Birch Hill Investment Advisors LLC | 743.680 | -1,77 | 63.399 | 7,68 | ||||
| 2026-02-17 | 13F | Mirabella Financial Services Llp | 3.936 | 336 | ||||||
| 2026-01-08 | 13F | True Wealth Design, LLC | 337 | -6,91 | 29 | 0,00 | ||||
| 2026-02-09 | 13F | Atlantic Trust, LLC | 43 | 168,75 | 4 | 200,00 | ||||
| 2026-02-17 | 13F | Fwl Investment Management, Llc | 440 | 0,00 | 38 | 8,82 | ||||
| 2026-02-03 | 13F | RFG Advisory, LLC | 2.358 | 201 | ||||||
| 2026-02-10 | 13F | Commonwealth Of Pennsylvania Public School Empls Retrmt Sys | 134.981 | -4,26 | 11.507 | 4,95 | ||||
| 2026-02-13 | 13F | Chevy Chase Trust Holdings, Inc. | 300.451 | -1,44 | 25.613 | 8,04 | ||||
| 2026-01-05 | 13F | Argent Capital Management Llc | 14.080 | 0,00 | 1.200 | 9,59 | ||||
| 2026-02-02 | 13F | Citizens Business Bank | 31.024 | 1,80 | 2.645 | 11,56 | ||||
| 2025-11-14 | 13F | PineBridge Investments, L.P. | 195.713 | 21,14 | 15.221 | 20,46 | ||||
| 2026-02-13 | 13F | Healthcare Of Ontario Pension Plan Trust Fund | 22.940 | -94,62 | 1.956 | -94,11 | ||||
| 2025-10-31 | 13F | Northern Oak Wealth Management Inc | 0 | -100,00 | 0 | |||||
| 2025-11-14 | 13F | Point72 Hong Kong Ltd | 0 | -100,00 | 0 | |||||
| 2026-02-02 | 13F | Robertson Stephens Wealth Management, LLC | 6.445 | 2,71 | 549 | 12,50 | ||||
| 2026-01-28 | 13F | Davis Capital Management | 5 | 0,00 | 0 | |||||
| 2026-02-12 | 13F | Advocate Investing Services LLC | 39 | 3 | ||||||
| 2026-02-17 | 13F | Cape Investment Advisory, Inc. | 29 | 1.350,00 | 2 | |||||
| 2026-02-12 | 13F | Triumph Capital Management | 6 | 0,00 | 1 | |||||
| 2025-09-29 | NP | AIM INTERNATIONAL MUTUAL FUNDS (INVESCO INTERNATIONAL MUTUAL FUNDS) - Invesco Global Responsibility Equity Fund Class A | 661 | 14,96 | 52 | 20,93 | ||||
| 2026-02-10 | 13F | Godfrey Financial Associates, Inc. | 99 | 8 | ||||||
| 2026-02-02 | 13F | Strs Ohio | 130.424 | -3,87 | 11.119 | 5,37 | ||||
| 2026-02-06 | 13F | EverSource Wealth Advisors, LLC | 4.918 | 11,52 | 419 | 22,51 | ||||
| 2025-09-29 | NP | XTR - Global X S&P 500 Tail Risk ETF This fund is a listed as child fund of Mirae Asset Global Investments Co., Ltd. and if that institution has disclosed ownership in this security, then these positions will not be double counted when calculating total shares and total value | 22 | 0,00 | 2 | 0,00 | ||||
| 2026-02-13 | 13F | Mariner, LLC | 204.269 | -13,53 | 17.423 | -5,16 | ||||
| 2026-02-17 | 13F | Private Advisor Group, LLC | 22.280 | -5,60 | 1.899 | 3,49 | ||||
| 2026-01-15 | 13F | Capital Advisors Inc/ok | 5.385 | 0,00 | 459 | 9,81 | ||||
| 2026-02-13 | 13F | Jacobs Levy Equity Management, Inc | 3.114.850 | 1,19 | 265.541 | 10,92 | ||||
| 2026-01-21 | 13F | Groesbeck Investment Management Corp /nj/ | 2.700 | 0,00 | 0 | |||||
| 2026-02-11 | 13F | Group One Trading, L.p. | Put | 62.900 | 191,20 | 5.362 | 219,36 | |||
| 2025-10-20 | 13F | YANKCOM Partnership | 0 | -100,00 | 0 | -100,00 | ||||
| 2026-01-20 | 13F | Savvy Advisors, Inc. | 2.467 | 210 | ||||||
| 2026-02-11 | 13F | Group One Trading, L.p. | Call | 64.600 | 150,39 | 5.507 | 174,53 | |||
| 2026-02-11 | 13F | Everett Harris & Co /ca/ | 84.658 | -3,39 | 7.217 | 5,91 | ||||
| 2026-02-12 | 13F | Brinker Capital Investments, LLC | 14.554 | -17,36 | 1.241 | -9,42 | ||||
| 2026-03-06 | 13F | Hsbc Holdings Plc | 2.148.974 | -1,90 | 183.188 | 7,57 | ||||
| 2026-02-10 | 13F | Private Wealth Asset Management, LLC | 252 | 0,00 | 21 | 10,53 | ||||
| 2026-01-13 | 13F | Trust Point Inc. | 8.741 | -1,08 | 745 | 8,44 | ||||
| 2026-02-03 | 13F | Ballentine Partners, LLC | 5.903 | -2,86 | 503 | 6,57 | ||||
| 2026-02-04 | 13F | LRI Investments, LLC | 14.421 | -2,04 | 82 | -18,18 | ||||
| 2026-02-11 | 13F | Hilton Head Capital Partners, LLC | 328 | 28 | ||||||
| 2026-02-02 | 13F | Partners in Financial Planning | 11.584 | 0,00 | 988 | 9,67 | ||||
| 2026-01-29 | 13F | LCM Capital Management Inc | 2.679 | -3,94 | 228 | 5,56 | ||||
| 2026-01-27 | 13F | Gf Fund Management Co. Ltd. | 15.919 | -1,84 | 1.357 | 7,61 | ||||
| 2026-02-17 | 13F | Engineers Gate Manager LP | 232.547 | -30,52 | 19.825 | -23,84 | ||||
| 2026-01-27 | 13F | Evergreen Capital Management Llc | 8.498 | 73,11 | 724 | 90,03 | ||||
| 2026-02-11 | 13F | Jessup Wealth Management, Inc | 123 | 10 | ||||||
| 2026-02-11 | 13F | Arrowpoint Investment Partners (Singapore) Pte. Ltd. | 16.364 | 1.395 | ||||||
| 2026-02-11 | 13F | Inceptionr Llc | 0 | -100,00 | 0 | |||||
| 2026-02-12 | 13F | Bradley Foster & Sargent Inc/ct | 14.179 | -0,15 | 1.209 | 9,42 | ||||
| 2026-02-10 | 13F | CIBC World Markets Inc. | 33.601 | 37,25 | 2.864 | 50,50 | ||||
| 2026-01-09 | 13F | Clear Trail Advisors, LLC | 6.007 | 512 | ||||||
| 2025-09-25 | NP | HELO - JPMorgan Hedged Equity Laddered Overlay ETF | 132.109 | 21,75 | 10.478 | 27,91 | ||||
| 2025-09-26 | NP | ULPIX - Ultrabull Profund Investor Class | 1.311 | 11,57 | 104 | 17,05 | ||||
| 2026-02-17 | 13F | Forefront Analytics, LLC | 6.113 | 36,09 | 521 | 49,28 | ||||
| 2026-02-02 | 13F | Addison Capital Co | 3.666 | 0,00 | 313 | 9,47 | ||||
| 2026-02-13 | 13F | Palisade Asset Management, LLC | 4.317 | -0,46 | 368 | 9,20 | ||||
| 2026-02-17 | 13F | Jones Financial Companies Lllp | 12.551 | -12,20 | 1.070 | -1,93 | ||||
| 2026-02-09 | 13F | MQS Management LLC | 0 | -100,00 | 0 | |||||
| 2026-02-05 | 13F | Amalgamated Bank | 111.007 | -0,41 | 9 | 12,50 | ||||
| 2026-03-02 | 13F | Tobam | 85.646 | 27,72 | 7 | 40,00 | ||||
| 2026-02-06 | 13F | Forefront Wealth Partners, LLC | 0 | -100,00 | 0 | |||||
| 2026-01-30 | 13F | Chapin Davis, Inc. | 7.267 | 9,74 | 620 | 20,43 | ||||
| 2026-02-12 | 13F | Colonial Trust Advisors | 67.132 | -3,88 | 5.723 | 5,36 | ||||
| 2026-02-06 | 13F | Radnor Capital Management, LLC | 26.915 | -0,65 | 2.295 | 8,93 | ||||
| 2025-10-21 | 13F | Taylor Frigon Capital Management LLC | 0 | -100,00 | 0 | -100,00 | ||||
| 2025-09-29 | NP | DUBS - Aptus Large Cap Enhanced Yield ETF | 3.081 | -2,10 | 244 | 2,95 | ||||
| 2026-02-11 | 13F | Mirova US LLC | 2.739.071 | -2,94 | 233.506 | 6,39 | ||||
| 2026-02-17 | 13F | Limestone Investment Advisors LP | Put | 0 | -100,00 | 0 | ||||
| 2026-02-17 | 13F | Limestone Investment Advisors LP | Call | 0 | -100,00 | 0 | ||||
| 2026-02-11 | 13F | Vise Technologies, Inc. | 7.113 | 6,23 | 606 | 16,54 | ||||
| 2026-02-14 | 13F | Howe & Rusling Inc | 85.863 | -0,05 | 7.320 | 9,55 | ||||
| 2026-02-09 | 13F | Hantz Financial Services, Inc. | 383 | 1,32 | 0 | |||||
| 2026-02-11 | 13F | Winnow Wealth Llc | 21 | 10,53 | 2 | 0,00 | ||||
| 2026-02-17 | 13F | SageView Advisory Group, LLC | 2.337 | 199 | ||||||
| 2026-01-12 | 13F | Perkins Coie Trust Co | 1.869 | -9,93 | 159 | -1,24 | ||||
| 2026-01-26 | 13F | PDS Planning, Inc | 2.689 | -2,99 | 229 | 6,51 | ||||
| 2026-02-12 | 13F | Penserra Capital Management LLC | 48 | 0,00 | 0 | |||||
| 2026-01-28 | 13F | Mowery & Schoenfeld Wealth Management, LLC | 0 | -100,00 | 0 | |||||
| 2026-02-06 | 13F | CWS Financial Advisors, LLC | 6.000 | 0,00 | 512 | 9,66 | ||||
| 2026-01-16 | 13F | Trust Co Of Vermont | 2.945 | 5,75 | 251 | 16,20 | ||||
| 2026-01-28 | 13F | Arizona State Retirement System | 165.317 | -3,48 | 14.093 | 5,80 | ||||
| 2025-11-14 | 13F | Hawk Ridge Capital Management Lp | 0 | -100,00 | 0 | |||||
| 2026-02-13 | 13F | Avanda Investment Management Pte. Ltd. | 0 | -100,00 | 0 | |||||
| 2026-02-09 | 13F | Kingsview Wealth Management, LLC | 40.204 | -5,68 | 3.427 | 3,41 | ||||
| 2026-02-12 | 13F | Marex Group plc | 4.142 | -28,55 | 353 | -21,56 | ||||
| 2026-02-06 | 13F/A | Rathbone Brothers plc | 16.695 | -81,02 | 1.423 | -79,20 | ||||
| 2026-01-29 | 13F | Calamos Advisors LLC | 163.065 | -3,89 | 13.901 | 5,36 | ||||
| 2026-02-10 | 13F | GKV Capital Management Co., Inc. | 12.755 | 0,00 | 1.087 | 9,69 | ||||
| 2026-01-26 | 13F | Private Trust Co Na | 3.901 | -2,67 | 333 | 6,75 | ||||
| 2025-09-25 | NP | DFA INVESTMENT DIMENSIONS GROUP INC - U.S. Sustainability Core 1 Portfolio Shares | 88.415 | 1,59 | 7.012 | 6,74 | ||||
| 2025-09-26 | NP | TEC - Harbor Transformative Technologies ETF | 437 | 15,00 | 35 | 21,43 | ||||
| 2025-09-29 | NP | POAGX - PRIMECAP Odyssey Aggressive Growth Fund | 156.300 | 68,06 | 12.396 | 76,58 | ||||
| 2026-01-26 | 13F | Whittier Trust Co Of Nevada Inc | 637 | -26,53 | 55 | -18,18 | ||||
| 2026-01-29 | 13F | Lee Danner & Bass Inc | 5.576 | 0,00 | 475 | 9,70 | ||||
| 2026-02-17 | 13F | Aquatic Capital Management LLC | 0 | -100,00 | 0 | |||||
| 2025-09-29 | NP | POGRX - PRIMECAP Odyssey Growth Fund | 34.812 | 86,16 | 2.761 | 95,61 | ||||
| 2026-02-12 | 13F | Empire Financial Management Company, LLC | 3.000 | 0,00 | 256 | 9,44 | ||||
| 2026-02-11 | 13F | Rise Advisors, LLC | 0 | -100,00 | 0 | |||||
| 2026-01-09 | 13F | Bdf-gestion | 34.524 | -6,25 | 2.943 | 2,79 | ||||
| 2026-02-06 | 13F | Cumberland Partners Ltd | 10.000 | 852 | ||||||
| 2026-02-02 | 13F | Principal Financial Group Inc | 821.825 | 2,06 | 70.061 | 11,88 | ||||
| 2026-02-03 | 13F | Koshinski Asset Management, Inc. | 4.673 | 0,00 | 398 | 9,64 | ||||
| 2026-01-05 | 13F | Jacobs & Co/ca | 100.515 | -10,78 | 9 | 0,00 | ||||
| 2025-09-26 | NP | USSCX - Science & Technology Fund Shares | 3.175 | 118,66 | 252 | 130,28 | ||||
| 2026-02-17 | 13F | Susquehanna Fundamental Investments, Llc | 0 | -100,00 | 0 | |||||
| 2026-01-21 | 13F | Aaron Wealth Advisors LLC | 9.389 | -1,03 | 800 | 8,55 | ||||
| 2026-01-29 | 13F | Teachers Retirement System Of The State Of Kentucky | 133.589 | -7,48 | 11 | 0,00 | ||||
| 2026-02-03 | 13F | Broadwater Capital Management Llc | 1.200 | 0,00 | 102 | 9,68 | ||||
| 2026-02-05 | 13F | Rossmore Private Capital | 17.850 | -3,72 | 1.522 | 5,55 | ||||
| 2026-02-09 | 13F | Cary Street Partners Financial Llc | 5.064 | -6,86 | 432 | 2,13 | ||||
| 2026-02-13 | 13F | Royal London Asset Management Ltd | 248.538 | -2,12 | 21.188 | 7,29 | ||||
| 2025-09-26 | NP | GGHCX - INVESCO Health Care Fund Class A | 52.225 | -41,21 | 4.142 | -44,94 | ||||
| 2026-01-26 | 13F | Valmark Advisers, Inc. | 5.191 | 0,00 | 443 | 9,68 | ||||
| 2025-10-24 | 13F | Opal Wealth Advisors, LLC | 0 | -100,00 | 0 | |||||
| 2025-11-13 | 13F | Magnetar Financial LLC | 0 | -100,00 | 0 | |||||
| 2026-02-09 | 13F | Fidelis Capital Partners, LLC | 4.145 | 1,54 | 353 | 11,36 | ||||
| 2026-02-06 | 13F | Larson Financial Group LLC | 2.497 | -15,30 | 213 | -7,42 | ||||
| 2026-01-12 | 13F | Benin Management CORP | 4.276 | -10,47 | 365 | -1,89 | ||||
| 2025-09-29 | NP | KCXIX - Knights of Columbus U.S. All Cap Index Fund I Shares | 2.614 | 2,11 | 207 | 7,25 | ||||
| 2026-02-17 | 13F | Bank Of America Corp /de/ | Put | 0 | -100,00 | 0 | -100,00 | |||
| 2026-02-04 | 13F | Boston Private Wealth Llc | 3.875 | -0,92 | 330 | 8,55 | ||||
| 2026-02-05 | 13F | 1st Source Bank | 10.194 | 0,00 | 869 | 9,72 | ||||
| 2025-09-24 | NP | CDAZX - Multi-Manager Directional Alternative Strategies Fund Institutional Class | 0 | -100,00 | 0 | -100,00 | ||||
| 2026-01-27 | 13F | Journey Advisory Group, LLC | 2.666 | 0,00 | 227 | 9,66 | ||||
| 2026-02-10 | 13F | Envestnet Asset Management Inc | 213.495 | -18,38 | 18.200 | -10,53 | ||||
| 2026-02-02 | 13F | Sachetta, LLC | 85 | -26,09 | 7 | -12,50 | ||||
| 2026-02-05 | 13F | WealthPlan Investment Management, LLC | 7.009 | 598 | ||||||
| 2026-02-13 | 13F | Umb Bank N A/mo | 2.561 | 4,11 | 218 | 14,14 | ||||
| 2026-01-29 | 13F | Impax Asset Management Group plc | 22.632 | 0,00 | 1.929 | 9,60 | ||||
| 2026-02-17 | 13F | Prosperity Consulting Group, LLC | 3.737 | 2,64 | 319 | 12,37 | ||||
| 2026-02-10 | 13F | Connor, Clark & Lunn Investment Management Ltd. | 687.091 | 26,57 | 58.575 | 38,75 | ||||
| 2026-02-11 | 13F | Signet Private Wealth LLC | 4.303 | 367 | ||||||
| 2026-02-09 | 13F | Hartland & Co., LLC | 9.141 | 54,96 | 779 | 70,09 | ||||
| 2025-10-30 | 13F | Twin Peaks Wealth Advisors, LLC | 0 | -100,00 | 0 | |||||
| 2026-01-21 | 13F | Newbridge Financial Services Group, Inc. | 71 | 0,00 | 6 | 20,00 | ||||
| 2026-02-11 | 13F | Deseret Mutual Benefit Administrators | 505 | 0,00 | 43 | 10,26 | ||||
| 2026-02-10 | 13F | MJT & Associates Financial Advisory Group, Inc. | 0 | -100,00 | 0 | |||||
| 2025-09-26 | NP | BKLC - BNY Mellon US Large Cap Core Equity ETF | 39.595 | 26,81 | 3.140 | 33,22 | ||||
| 2026-02-12 | 13F | Tiemann Investment Advisors, Llc | 2.550 | 217 | ||||||
| 2026-02-02 | 13F | Advisors Preferred, LLC | 0 | -100,00 | 0 | |||||
| 2026-01-12 | 13F | Seacrest Wealth Management, Llc | 2.531 | 215 | ||||||
| 2026-01-29 | 13F | Pictet Asset Management Holding SA | 352.216 | -1,65 | 30.026 | 7,82 | ||||
| 2025-09-26 | NP | JHML - John Hancock Multifactor Large Cap ETF | 11.350 | 0,74 | 900 | 5,88 | ||||
| 2026-01-20 | 13F | Tritonpoint Wealth, Llc | 0 | -100,00 | 0 | |||||
| 2026-01-29 | 13F | RMG Wealth Management LLC | 300 | 0,00 | 26 | 8,70 | ||||
| 2026-01-29 | 13F | Concurrent Investment Advisors, LLC | 31.330 | 3,76 | 2.671 | 13,71 | ||||
| 2026-02-11 | 13F | CNB Bank | 89 | 0,00 | 8 | 16,67 | ||||
| 2026-01-23 | 13F | Brown, Lisle/cummings, Inc. | 42 | 0,00 | 4 | 0,00 | ||||
| 2026-01-27 | 13F | TriaGen Wealth Management LLC | 53.398 | 4.552 | ||||||
| 2026-01-29 | 13F | Cornerstone National Bank & Trust Co | 3.000 | 0,00 | 256 | 9,44 | ||||
| 2026-02-02 | 13F | Horizon Investments, LLC | 21.943 | -11,59 | 1.871 | -3,11 | ||||
| 2026-01-16 | 13F | Perigon Wealth Management, LLC | 6.783 | 3,68 | 578 | 13,78 | ||||
| 2026-02-17 | 13F | Investment Management Corp of Ontario | 61.450 | 123,71 | 5.239 | 145,22 | ||||
| 2026-02-05 | 13F | Canada Post Corp Registered Pension Plan | 162.998 | 1,95 | 13.896 | 12,60 | ||||
| 2026-02-17 | 13F | Russell Investments Group, Ltd. | 1.822.386 | -4,48 | 155.489 | 4,82 | ||||
| 2026-02-09 | 13F | Harbour Investments, Inc. | 2.908 | 8,63 | 248 | 18,75 | ||||
| 2026-01-30 | 13F | Caldwell Securities, Inc | 9 | 0,00 | 1 | |||||
| 2026-01-07 | 13F | Harbor Investment Advisory, Llc | 20.720 | -4,08 | 1.766 | 5,18 | ||||
| 2026-02-06 | 13F | Marble Harbor Investment Counsel, LLC | 59.741 | 0,00 | 5.093 | 9,60 | ||||
| 2026-02-06 | 13F | Pnc Financial Services Group, Inc. | 538.041 | -2,36 | 45.868 | 7,03 | ||||
| 2026-01-12 | 13F | Willner & Heller, Llc | 2.640 | 0,00 | 225 | 9,76 | ||||
| 2026-01-27 | 13F | Penobscot Investment Management Company, Inc. | 9.636 | -0,04 | 821 | 9,61 | ||||
| 2026-02-13 | 13F | Entropy Technologies, LP | 39.425 | 3.361 | ||||||
| 2026-01-30 | 13F | Wealthfront Advisers Llc | 32.316 | 8,95 | 2.755 | 19,43 | ||||
| 2026-02-11 | 13F | Hughes Financial Services, LLC | 301 | 1,01 | 26 | 0,00 | ||||
| 2025-09-26 | NP | RTDAX - Multifactor U.S. Equity Fund Class A | 3.871 | 71,66 | 307 | 80,59 | ||||
| 2026-01-26 | 13F | Asset Dedication, LLC | 49 | 0,00 | 4 | 33,33 | ||||
| 2026-01-16 | 13F | West Branch Capital LLC | 150 | 13 | ||||||
| 2026-02-17 | 13F | Rakuten Investment Management, Inc. | 76.626 | 727,05 | 6.662 | 1.048,45 | ||||
| 2026-02-11 | 13F | IMA Wealth, Inc. | 3 | 0,00 | 0 | |||||
| 2025-09-26 | NP | SUNAMERICA SERIES TRUST - SA Large Cap Value Index Portfolio Class 1 | 15.431 | -0,49 | 1.224 | 4,53 | ||||
| 2026-02-12 | 13F | Johnson Financial Group, Inc. | 1.799 | 35,98 | 153 | 50,00 | ||||
| 2026-02-09 | 13F | Mizuho Securities Usa Llc | 42.254 | -1,19 | 3.662 | 5,29 | ||||
| 2026-02-13 | 13F | Itau Unibanco Holding S.A. | 0 | -100,00 | 0 | |||||
| 2026-01-12 | 13F | National Wealth Management Group, LLC | 8.219 | 701 | ||||||
| 2025-09-26 | NP | HCPIX - Health Care Ultrasector Profund Investor Class | 989 | -30,50 | 78 | -27,10 | ||||
| 2026-01-26 | 13F | Consolidated Portfolio Review Corp | 0 | -100,00 | 0 | |||||
| 2026-02-13 | 13F | Schroder Investment Management Group | 0 | -100,00 | 0 | |||||
| 2025-09-25 | NP | DCOR - Dimensional US Core Equity 1 ETF | 17.777 | 17,10 | 1.410 | 22,95 | ||||
| 2025-09-24 | NP | PPSFX - LargeCap Value Fund III R-3 | 10.463 | -9,87 | 830 | -5,37 | ||||
| 2026-01-22 | 13F | WELLCOME TRUST LTD (THE) as trustee of the WELLCOME TRUST | 4.800.000 | 0,00 | 409.200 | 9,62 | ||||
| 2026-01-30 | 13F | Strategic Blueprint, LLC | 0 | -100,00 | 0 | |||||
| 2026-01-23 | 13F | Avion Wealth | 129 | 4,88 | 0 | |||||
| 2026-02-10 | 13F | Future Fund LLC | 25.650 | -3,12 | 2.187 | 6,22 | ||||
| 2026-02-11 | 13F | J.Safra Asset Management Corp | 196 | 1.860,00 | 17 | |||||
| 2025-10-27 | 13F | Touchstone Capital, Inc. | 0 | -100,00 | 0 | -100,00 | ||||
| 2026-02-12 | 13F | Skopos Labs, Inc. | 6.827 | -25,21 | 593 | -16,83 | ||||
| 2026-02-13 | 13F | Cozad Asset Management Inc | 2.448 | 209 | ||||||
| 2026-02-17 | 13F | DZ BANK AG Deutsche Zentral Genossenschafts Bank, Frankfurt am Main | 7.732.010 | -16,32 | 659.154 | -8,27 | ||||
| 2026-01-29 | 13F | Calamos Wealth Management LLC | 3.961 | 1,30 | 338 | 10,86 | ||||
| 2026-02-06 | 13F | Ironwood Investment Counsel, LLC | 8.356 | -0,19 | 712 | 9,37 | ||||
| 2026-02-17 | 13F | Evercore Wealth Management, LLC | 2.658 | 0,00 | 227 | 9,71 | ||||
| 2026-02-17 | 13F | Humankind Investments LLC | 0 | -100,00 | 0 | |||||
| 2026-02-10 | 13F | Meramec Financial Planners, LLC | 10 | 1 | ||||||
| 2026-01-29 | 13F | Vanguard Group Inc | 70.079.435 | -0,40 | 5.974.272 | 9,18 | ||||
| 2025-10-28 | 13F | Global Trust Asset Management, LLC | 0 | -100,00 | 0 | -100,00 | ||||
| 2026-02-11 | 13F | Nemes Rush Group LLC | 105 | 9,38 | 9 | 14,29 | ||||
| 2026-01-09 | 13F | Atlas Brown,Inc. | 5.924 | -0,67 | 505 | 9,07 | ||||
| 2026-02-04 | 13F | Midwest Trust Co | 3.368 | -0,41 | 287 | 9,13 | ||||
| 2025-09-25 | NP | AALGX - Thrivent Global Stock Fund Class A | 797 | 63 | ||||||
| 2025-09-24 | NP | TNRAX - 1290 Avantis U.S. Large Cap Growth Fund Class A | 3.762 | 0,00 | 298 | 5,30 | ||||
| 2026-03-12 | 13F/A | Peak6 Llc | 751 | -96,26 | 64 | -95,90 | ||||
| 2025-10-07 | 13F | Nova Wealth Management, Inc. | 0 | -100,00 | 0 | -100,00 | ||||
| 2026-03-12 | 13F/A | Peak6 Llc | Put | 117.700 | -6,29 | 10.034 | 2,72 | |||
| 2026-02-13 | 13F | Brown Advisory Inc | 7.332.126 | -0,35 | 625.064 | 9,24 | ||||
| 2026-02-13 | 13F | Gts Securities Llc | 5.463 | 466 | ||||||
| 2026-02-17 | 13F | Orbimed Advisors Llc | Call | 150.000 | 12.788 | |||||
| 2026-01-13 | 13F | Trust Asset Management LLC | 6.582 | -3,56 | 561 | 5,85 | ||||
| 2026-02-11 | 13F | Capital Group Private Client Services, Inc. | 5.068 | 0,00 | 432 | 9,64 | ||||
| 2025-11-12 | 13F | Mach-1 Financial Group, Inc. | 0 | -100,00 | 0 | |||||
| 2026-02-17 | 13F | Orbimed Advisors Llc | 1.842.900 | 9,44 | 157.107 | 19,96 | ||||
| 2026-02-09 | 13F | CBIZ Investment Advisory Services, LLC | 44 | 37,50 | 4 | 50,00 | ||||
| 2026-02-10 | 13F | Sittner & Nelson, Llc | 24.575 | -2,27 | 1.934 | -1,07 | ||||
| 2025-11-07 | 13F | Shell Asset Management Co | 22.264 | -63,60 | 2 | -75,00 | ||||
| 2026-01-30 | 13F | Activest Wealth Management | 284 | 67,06 | 24 | 84,62 | ||||
| 2026-02-13 | 13F | Allianz Se | 9.857 | 295,86 | 840 | 335,23 | ||||
| 2026-02-05 | 13F | Peak Asset Management, LLC | 6.178 | 0,00 | 527 | 9,58 | ||||
| 2026-01-23 | 13F | Eagle Bay Advisors LLC | 2.640 | 0,00 | 225 | 9,76 | ||||
| 2025-11-03 | 13F | AustralianSuper Pty Ltd | 0 | -100,00 | 0 | |||||
| 2026-01-30 | 13F | Bogart Wealth, LLC | 36 | 63,64 | 3 | 200,00 | ||||
| 2026-02-10 | 13F | NS Partners Ltd | 193.939 | -3,61 | 16.533 | 5,66 | ||||
| 2026-03-12 | 13F/A | Peak6 Llc | Call | 39.400 | -34,98 | 3.359 | -28,74 | |||
| 2026-01-27 | 13F | Probity Advisors, Inc. | 3.181 | -37,50 | 271 | -31,39 | ||||
| 2026-01-08 | 13F | Versant Capital Management, Inc | 2.700 | -1,35 | 230 | 8,49 | ||||
| 2026-02-05 | 13F | S&co Inc | 81.497 | 0,00 | 7 | 0,00 | ||||
| 2026-02-02 | 13F | PKO Investment Management Joint-Stock Co | 6.500 | -31,58 | 554 | -24,93 | ||||
| 2026-01-26 | 13F | Merit Financial Group, LLC | 28.282 | 71,83 | 2.411 | 88,51 | ||||
| 2026-01-27 | 13F | HCR Wealth Advisors | 2.416 | 206 | ||||||
| 2025-09-23 | NP | MXCCX - Federated Max-Cap Index Fund Class C Shares This fund is a listed as child fund of Federated Hermes, Inc. and if that institution has disclosed ownership in this security, then these positions will not be double counted when calculating total shares and total value | 2.553 | -1,50 | 202 | 3,59 | ||||
| 2025-09-29 | NP | XCLR - Global X S&P 500 Collar 95-110 ETF This fund is a listed as child fund of Mirae Asset Global Investments Co., Ltd. and if that institution has disclosed ownership in this security, then these positions will not be double counted when calculating total shares and total value | 37 | 8,82 | 3 | 0,00 | ||||
| 2026-01-14 | 13F | USA Financial Portformulas Corp | 10.014 | -35,18 | 854 | -28,98 | ||||
| 2026-02-12 | 13F | Brown Brothers Harriman & Co | 4.892 | 158,43 | 417 | 183,67 | ||||
| 2026-01-27 | 13F | Lecap Asset Management Ltd | 12.564 | 1.071 | ||||||
| 2026-01-15 | 13F | DB Fitzpatrick & Co, Inc | 17.956 | -1,00 | 1.531 | 8,51 | ||||
| 2025-11-14 | 13F | Zurich Insurance Group Ltd/FI | 0 | -100,00 | 0 | |||||
| 2025-09-24 | NP | BLACKROCK FUNDS - iShares Total U.S. Stock Market Index Fund Investor A | 38.950 | -2,12 | 3.089 | 2,83 | ||||
| 2026-02-12 | 13F | Paradigm Capital Management Inc/ny | 4.400 | 0,00 | 375 | 9,65 | ||||
| 2026-02-13 | 13F | USS Investment Management Ltd | 117.423 | 2,96 | 10.010 | 12,84 | ||||
| 2026-01-15 | 13F | Presidio Capital Management, LLC | 0 | -100,00 | 0 | |||||
| 2026-02-09 | 13F | White Lighthouse Investment Management Inc. | 7.107 | -14,80 | 606 | -6,64 | ||||
| 2026-02-04 | 13F | Independent Advisor Alliance | 22.375 | 25,51 | 1.907 | 37,59 | ||||
| 2025-09-25 | NP | VESGX - Vanguard Global ESG Select Stock Fund Admiral Shares | 582.726 | -0,32 | 46.216 | 4,72 | ||||
| 2026-02-04 | 13F | Plato Investment Management Ltd | 8.509 | 92,29 | 729 | 113,49 | ||||
| 2025-09-26 | NP | FLCOX - Fidelity Large Cap Value Index Fund This fund is a listed as child fund of Fmr Llc and if that institution has disclosed ownership in this security, then these positions will not be double counted when calculating total shares and total value | 237.118 | 14,14 | 18.806 | 19,91 | ||||
| 2026-01-26 | 13F | West Wealth Group, LLC | 2.360 | 201 | ||||||
| 2026-02-06 | 13F | BOK Financial Private Wealth, Inc. | 12.085 | 0,00 | 1.030 | 9,69 | ||||
| 2026-02-12 | 13F | New York State Common Retirement Fund | 664.493 | -12,61 | 56.648 | -4,21 | ||||
| 2026-01-08 | 13F | Sound View Wealth Advisors Group, LLC | 4.680 | -5,66 | 399 | 3,38 | ||||
| 2026-02-13 | 13F | Change Path, LLC | 3.156 | -2,86 | 269 | 6,75 | ||||
| 2026-02-13 | 13F | Sterling Capital Management LLC | 1.191 | -38,45 | 102 | -32,67 | ||||
| 2025-09-26 | NP | FNILX - Fidelity ZERO Large Cap Index Fund This fund is a listed as child fund of Fmr Llc and if that institution has disclosed ownership in this security, then these positions will not be double counted when calculating total shares and total value | 150.189 | 3,09 | 11.911 | 8,31 | ||||
| 2026-02-18 | 13F | Beacon Pointe Advisors, LLC | 19.344 | 3,76 | 1.649 | 13,80 | ||||
| 2026-01-29 | 13F | RMR Wealth Builders | 4.301 | 0,00 | 367 | 9,58 | ||||
| 2026-01-14 | 13F | ORG Partners LLC | 116 | 10,48 | 10 | 12,50 | ||||
| 2026-01-16 | 13F | Crowley Wealth Management, Inc. | 0 | -100,00 | 0 | |||||
| 2026-02-11 | 13F | Harvest Fund Management Co., Ltd | 602 | 0,00 | 0 | |||||
| 2026-02-17 | 13F | Raymond James Financial Inc | 2.137.309 | 5,38 | 182.218 | 15,52 | ||||
| 2026-01-30 | 13F | North Star Investment Management Corp. | 6.895 | 0,63 | 588 | 10,34 | ||||
| 2026-01-26 | 13F | La Banque Postale Asset Management SA | 128.702 | 502,20 | 10.972 | 560,11 | ||||
| 2026-01-28 | 13F | Financial Perspectives, Inc | 62 | 0,00 | 5 | 25,00 | ||||
| 2026-02-12 | 13F | Rossby Financial, LCC | 402 | 2,55 | 34 | 17,24 | ||||
| 2026-01-08 | 13F | Fulton Bank, N.a. | 5.026 | -1,06 | 428 | 8,35 | ||||
| 2026-02-12 | 13F | Commonwealth Equity Services, Llc | 119.083 | -7,22 | 10.152 | 112.688,89 | ||||
| 2026-02-03 | 13F | ASR Vermogensbeheer N.V. | 81.839 | -0,93 | 6.977 | 8,59 | ||||
| 2025-09-26 | NP | NSCR - Nuveen Sustainable Core ETF | 637 | 12,74 | 51 | 19,05 | ||||
| 2025-09-26 | NP | SUNAMERICA SERIES TRUST - SA Schroders VCP Global Allocation Portfolio Class 3 | 905 | 29,47 | 72 | 36,54 | ||||
| 2026-02-09 | 13F | Huntington National Bank | 146.738 | -3,07 | 12.509 | 6,25 | ||||
| 2026-02-13 | 13F | Ieq Capital, Llc | 218.897 | 0,84 | 18.661 | 10,54 | ||||
| 2026-02-09 | 13F | Cypress Capital Management LLC (WY) | 780 | -6,02 | 66 | 3,13 | ||||
| 2025-09-26 | NP | ILCG - iShares Morningstar Large-Cap Growth ETF | 55.629 | 5,54 | 4.412 | 10,86 | ||||
| 2026-01-30 | 13F | Citizens National Bank Trust Department | 625 | 0,00 | 53 | 10,42 | ||||
| 2026-02-13 | 13F | Walleye Capital LLC | Put | 3.300 | 312,50 | 281 | 353,23 | |||
| 2026-02-13 | 13F | Walleye Capital LLC | 272.871 | 36,16 | 23.262 | 49,26 | ||||
| 2026-02-13 | 13F | Walleye Capital LLC | Call | 32.100 | 379,10 | 2.737 | 425,14 | |||
| 2025-09-29 | NP | XYLD - Global X S&P 500 Covered Call ETF This fund is a listed as child fund of Mirae Asset Global Investments Co., Ltd. and if that institution has disclosed ownership in this security, then these positions will not be double counted when calculating total shares and total value | 36.274 | -9,36 | 2.877 | -4,77 | ||||
| 2025-11-04 | 13F | IMC-Chicago, LLC | 0 | -100,00 | 0 | -100,00 | ||||
| 2026-02-10 | 13F | Gulf International Bank (UK) Ltd | 29.245 | 0,00 | 2 | 0,00 | ||||
| 2026-02-12 | 13F | Cloud Capital Management, LLC | 0 | -100,00 | 0 | |||||
| 2026-02-12 | 13F | Elo Mutual Pension Insurance Co | 85.408 | -4,76 | 7.281 | 4,42 | ||||
| 2026-02-06 | 13F | Aviance Capital Partners, LLC | 7.194 | 0,00 | 613 | 9,66 | ||||
| 2025-11-17 | 13F | FSA Wealth Management LLC | 455 | 0,00 | 35 | 0,00 | ||||
| 2026-01-30 | 13F | Cullinan Associates Inc | 12.600 | 0,00 | 1.074 | 9,70 | ||||
| 2026-01-20 | 13F | Cromwell Holdings LLC | 1.905 | -2,95 | 162 | 6,58 | ||||
| 2026-02-11 | 13F | Primecap Management Co/ca/ | 3.418.791 | -2,97 | 291.452 | 6,37 | ||||
| 2026-02-03 | 13F | Strengthening Families & Communities, LLC | 433 | -0,69 | 37 | 9,09 | ||||
| 2026-01-09 | 13F | 180 Wealth Advisors, Llc | 17.652 | -1,52 | 1.505 | 7,89 | ||||
| 2026-02-13 | 13F | Victory Capital Management Inc | 213.120 | 3,83 | 18.168 | 13,82 | ||||
| 2026-02-17 | 13F | Deerfield Management Company, L.p. (series C) | 13.702 | 115,81 | 1.168 | 136,92 | ||||
| 2026-01-28 | 13F | Quaker Wealth Management, LLC | 612 | 0,16 | 52 | 10,64 | ||||
| 2026-02-10 | 13F | MUFG Securities EMEA plc | 23.790 | 111,71 | 2.028 | 132,30 | ||||
| 2026-02-11 | 13F | BLI - Banque de Luxembourg Investments | 169.530 | 14.615 | ||||||
| 2026-02-04 | 13F | Dogwood Wealth Management LLC | 89 | 71,15 | 8 | 75,00 | ||||
| 2026-01-15 | 13F | Frank, Rimerman Advisors LLC | 6.510 | 6,79 | 555 | 16,88 | ||||
| 2026-02-06 | 13F | Profund Advisors Llc | 9.749 | 28,67 | 831 | 41,09 | ||||
| 2025-10-21 | 13F | Simon Quick Advisors, Llc | 0 | -100,00 | 0 | -100,00 | ||||
| 2026-01-20 | 13F | Pflug Koory, LLC | 109 | 0,00 | 9 | 12,50 | ||||
| 2026-01-26 | 13F | Whittier Trust Co | 5.709 | -32,82 | 490 | -25,08 | ||||
| 2026-02-17 | 13F | Wiley Bros.-aintree Capital, Llc | 24.873 | 3,35 | 2.120 | 13,73 | ||||
| 2026-02-13 | 13F | MAI Capital Management | 87.948 | -1,53 | 7.498 | 7,93 | ||||
| 2026-02-17 | 13F | Fmr Llc | 16.582.547 | 13,74 | 1.413.662 | 24,68 | ||||
| 2026-01-29 | 13F | Deltec Asset Management Llc | 6.000 | 512 | ||||||
| 2025-09-26 | NP | CVAR - Cultivar ETF | 5.034 | 0,78 | 399 | 5,84 | ||||
| 2025-11-14 | 13F | Voloridge Investment Management, Llc | 0 | -100,00 | 0 | |||||
| 2026-01-12 | 13F | E. Ohman J:or Asset Management AB | 22.300 | -14,41 | 1.901 | -6,17 | ||||
| 2026-02-02 | 13F | Cairn Investment Group, Inc. | 17.800 | 0,00 | 2 | 0,00 | ||||
| 2025-09-24 | NP | IYH - iShares U.S. Healthcare ETF | 319.666 | -3,46 | 25.353 | 1,43 | ||||
| 2026-01-23 | 13F | TFC Financial Management | 34 | 0,00 | 3 | 0,00 | ||||
| 2026-02-17 | 13F | Imprint Wealth LLC | 697 | -50,00 | 59 | -45,37 | ||||
| 2026-02-09 | 13F | Quest Partners LLC | 3.849 | -37,92 | 328 | -31,95 | ||||
| 2026-02-17 | 13F | Worldquant Millennium Advisors Llc | 452.566 | 38.581 | ||||||
| 2026-01-15 | 13F | Meyer Handelman Co | 25.200 | -20,20 | 2.148 | -12,51 | ||||
| 2026-02-17 | 13F | Wealth Watch Advisors, INC | 17 | 0,00 | 1 | 0,00 | ||||
| 2025-10-27 | 13F | Pacific Capital Partners Ltd | 0 | -100,00 | 0 | |||||
| 2026-02-05 | 13F | IMG Wealth Management, Inc. | 34 | 0,00 | 3 | 0,00 | ||||
| 2026-01-14 | 13F | Spire Wealth Management | 2.480 | 2,18 | 211 | 12,23 | ||||
| 2026-01-08 | 13F | Maridea Wealth Management LLC | 16.422 | 36,06 | 1.400 | 54,07 | ||||
| 2026-02-06 | 13F | HealthInvest Partners AB | 0 | -100,00 | 0 | |||||
| 2026-01-28 | 13F | Loring Wolcott & Coolidge Fiduciary Advisors Llp/ma | 29.737 | -14,44 | 2.486 | -6,51 | ||||
| 2026-02-10 | 13F | Heritage Trust Co | 2.796 | 0,76 | 238 | 10,70 | ||||
| 2026-02-13 | 13F | Titan Investment Solutions Ltd | 86.905 | 7.409 | ||||||
| 2026-01-15 | 13F | J. Safra Sarasin Holding AG | 32.466 | 139,46 | 2.768 | 162,52 | ||||
| 2025-11-14 | 13F | Financial Advisors Network, Inc. | 23.860 | 14,77 | 1.856 | 14,15 | ||||
| 2025-09-26 | NP | NULV - Nuveen ESG Large-Cap Value ETF | 203.471 | -14,45 | 16.137 | -10,12 | ||||
| 2026-02-17 | 13F | Captrust Financial Advisors | 59.171 | 1,93 | 5.044 | 11,74 | ||||
| 2026-01-26 | 13F | Annex Advisory Services, LLC | 5.441 | 0,29 | 464 | 9,98 | ||||
| 2026-02-11 | 13F | Manchester Capital Management LLC | 398 | 34 | ||||||
| 2026-01-27 | 13F | Checchi Capital Advisers, LLC | 3.696 | 0,68 | 315 | 10,53 | ||||
| 2026-02-03 | 13F | Costello Asset Management, INC | 400 | 0,00 | 34 | 9,68 | ||||
| 2026-01-30 | 13F | Catalytic Wealth RIA, LLC | 0 | -100,00 | 0 | |||||
| 2026-02-13 | 13F | Champlain Investment Partners, LLC | 0 | -100,00 | 0 | |||||
| 2026-02-06 | 13F | Van Hulzen Asset Management, LLC | 34.024 | 0,00 | 2.901 | 9,60 | ||||
| 2026-01-27 | 13F | Brighton Jones Llc | 0 | -100,00 | 0 | |||||
| 2026-01-27 | 13F | Oak Harvest Investment Services | 39.936 | 33,90 | 3.405 | 46,79 | ||||
| 2025-11-12 | 13F | Empirical Asset Management, LLC | 0 | -100,00 | 0 | |||||
| 2026-01-23 | 13F | Webster Bank, N. A. | 219 | 0,00 | 19 | 5,88 | ||||
| 2026-01-28 | 13F | CAPROCK Group, Inc. | 11.078 | 81,19 | 944 | 89,94 | ||||
| 2026-02-05 | 13F | DnB Asset Management AS | 300.237 | -1,45 | 25.595 | 8,03 | ||||
| 2026-02-11 | 13F | Paces Ferry Wealth Advisors, Llc | 7.370 | -0,78 | 628 | 8,84 | ||||
| 2026-02-11 | 13F | Clifford Swan Investment Counsel Llc | 251.555 | -0,68 | 21.445 | 8,87 | ||||
| 2026-01-16 | 13F | Empirical Financial Services, LLC d.b.a. Empirical Wealth Management | 22.586 | 2,32 | 1.925 | 12,18 | ||||
| 2026-02-09 | 13F | HBK Sorce Advisory LLC | 2.921 | -25,92 | 230 | -23,15 | ||||
| 2025-09-25 | NP | DFVEX - U.s. Vector Equity Portfolio - Institutional Class This fund is a listed as child fund of Dimensional Fund Advisors Lp and if that institution has disclosed ownership in this security, then these positions will not be double counted when calculating total shares and total value | 57.971 | 0,00 | 4.598 | 5,05 | ||||
| 2026-02-13 | 13F | OMERS ADMINISTRATION Corp | 45.991 | 3,34 | 3.921 | 13,26 | ||||
| 2026-01-21 | 13F | Signature Resources Capital Management, LLC | 4 | 0 | ||||||
| 2026-02-09 | 13F | Keating Financial Advisory Services, Inc. | 286 | 24 | ||||||
| 2025-10-27 | 13F | Stone House Investment Management, LLC | 0 | -100,00 | 0 | |||||
| 2026-01-29 | 13F | Comerica Bank | 104.324 | -10,34 | 8.894 | -1,71 | ||||
| 2026-02-17 | 13F | Meridiem Capital Partners LP | 114.765 | 9.784 | ||||||
| 2025-11-13 | 13F | Glenmede Investment Management, LP | 182.172 | -6,90 | 14.168 | -7,42 | ||||
| 2026-02-17 | 13F | Adage Capital Partners Gp, L.l.c. | 1.954.631 | 43,78 | 166.632 | 57,61 | ||||
| 2026-02-13 | 13F | TritonPoint Partners, LLC | 3.025 | 258 | ||||||
| 2025-09-26 | NP | PASIX - PACE Alternative Strategies Investments Class A | 63 | 0,00 | 5 | 0,00 | ||||
| 2026-01-28 | 13F | B. Metzler seel. Sohn & Co. AG | 55.280 | 0,24 | 4.715 | 9,96 | ||||
| 2026-01-30 | 13F | Torren Management, LLC | 79 | 7 | ||||||
| 2026-02-17 | 13F | Edmond De Rothschild Holding S.a. | 587.697 | -12,61 | 50.101 | -4,20 | ||||
| 2026-02-17 | 13F | IHT Wealth Management, LLC | 3.229 | 1,89 | 275 | 11,79 | ||||
| 2025-09-26 | NP | Invesco Exchange-Traded Fund Trust II - Invesco MSCI Global Climate 500 ETF | 13.698 | -22,75 | 1.086 | -18,83 | ||||
| 2026-02-13 | 13F | Glen Eagle Advisors, LLC | 533 | -11,61 | 45 | -2,17 | ||||
| 2026-02-17 | 13F | Cim Investment Mangement Inc | 5.001 | 0,00 | 426 | 9,79 | ||||
| 2026-02-09 | 13F | Choate Investment Advisors | 107.927 | -3,92 | 9.201 | 5,32 | ||||
| 2026-02-02 | 13F | Pittenger & Anderson Inc | 17.517 | 3,04 | 1.493 | 12,93 | ||||
| 2025-11-12 | 13F | Group One Trading, L.p. | 0 | -100,00 | 0 | -100,00 | ||||
| 2026-01-26 | 13F | Clean Yield Group | 1.010 | 0,00 | 86 | 10,26 | ||||
| 2026-02-06 | 13F | New Millennium Group LLC | 7 | 0,00 | 1 | |||||
| 2026-01-22 | 13F | Ofi Invest Asset Management | 507.022 | 2,00 | 36.895 | 12,14 | ||||
| 2026-02-17 | 13F | VestGen Advisors, LLC | 4.508 | 384 | ||||||
| 2025-09-23 | NP | Allianzgi Diversified Income & Convertible Fund | 6.455 | -46,89 | 512 | -50,34 | ||||
| 2026-02-10 | 13F | Bruce G. Allen Investments, LLC | 67 | 0,00 | 6 | 0,00 | ||||
| 2026-02-09 | 13F | Leavell Investment Management, Inc. | 3.525 | 0,00 | 301 | 9,49 | ||||
| 2026-02-13 | 13F | Rhenman & Partners Asset Management AB | 193.500 | 24,84 | 16.496 | 36,84 | ||||
| 2026-02-03 | 13F | Sequoia Financial Advisors, LLC | 33.380 | 10,39 | 2.846 | 21,01 | ||||
| 2026-02-09 | 13F | Wellington Shields & Co., LLC | 1.150 | 0,00 | 98 | 10,11 | ||||
| 2026-01-27 | 13F | TD Waterhouse Canada Inc. | 6.241 | -6,75 | 532 | 4,32 | ||||
| 2026-02-10 | 13F | Welch & Forbes Llc | 181.671 | -0,52 | 15.487 | 9,05 | ||||
| 2026-02-12 | 13F | Federated Hermes, Inc. | 4.145 | -2,01 | 353 | 7,62 | ||||
| 2026-02-13 | 13F | Public Sector Pension Investment Board | 0 | -100,00 | 0 | |||||
| 2025-09-25 | NP | DFEOX - U.s. Core Equity 1 Portfolio - Institutional Class This fund is a listed as child fund of Dimensional Fund Advisors Lp and if that institution has disclosed ownership in this security, then these positions will not be double counted when calculating total shares and total value | 212.366 | 1,00 | 16.843 | 6,11 | ||||
| 2026-01-26 | 13F | Seamount Financial Group Inc | 3.312 | 0,00 | 282 | 9,73 | ||||
| 2026-01-06 | 13F | Board of the Pension Protection Fund | 400 | 34 | ||||||
| 2026-01-15 | 13F | Boston Common Asset Management, LLC | 144.703 | 6,65 | 12.336 | 16,91 | ||||
| 2026-02-27 | 13F | Groupama Asset Managment | 0 | -100,00 | 0 | |||||
| 2025-11-14 | 13F | Voleon Capital Management Lp | 0 | -100,00 | 0 | -100,00 | ||||
| 2026-02-09 | 13F | Onefund, Llc | 1.741 | 5,64 | 148 | 15,63 | ||||
| 2026-02-17 | 13F | Capital Insight Partners, Llc | 13.873 | -64,50 | 1.183 | -61,06 | ||||
| 2026-02-13 | 13F | Panagora Asset Management Inc | 3.977 | -13,81 | 339 | -5,31 | ||||
| 2026-02-09 | 13F | AIA Group Ltd | 126.960 | -58,81 | 10.823 | -54,85 | ||||
| 2026-02-17 | 13F | Warren Averett Asset Management, LLC | 32.592 | 39,32 | 2.778 | 52,72 | ||||
| 2026-02-20 | 13F | Sunbelt Securities, Inc. | 662 | 1,07 | 56 | 12,00 | ||||
| 2026-02-04 | 13F | Mascoma Wealth Management LLC | 8 | 1 | ||||||
| 2026-02-17 | 13F | Nomura Holdings Inc | 77.638 | 18,00 | 6.619 | 29,33 | ||||
| 2026-01-20 | 13F | Nvwm, Llc | 17.166 | 74.534,78 | 1.463 | 146.200,00 | ||||
| 2026-02-17 | 13F | Nomura Holdings Inc | Call | 100.000 | -33,33 | 8.525 | -26,92 | |||
| 2026-02-17 | 13F | Nomura Holdings Inc | Put | 216.200 | 116,20 | 18.431 | 136,99 | |||
| 2025-11-12 | 13F | HAP Trading, LLC | Call | 78.000 | 332 | |||||
| 2026-02-13 | 13F | Ingalls & Snyder Llc | 3.750 | -3,85 | 0 | |||||
| 2026-02-12 | 13F | Summit Financial, LLC | 5.188 | -39,61 | 442 | -33,83 | ||||
| 2026-01-29 | 13F | Middleton & Co Inc/ma | 0 | -100,00 | 0 | |||||
| 2026-02-10 | 13F | Nomura Asset Management Co Ltd | 432.032 | 18,90 | 36.831 | 30,33 | ||||
| 2026-02-17 | 13F | Caisse De Depot Et Placement Du Quebec | 1.455.842 | 156,20 | 124.111 | 180,84 | ||||
| 2025-10-27 | 13F | Bangor Savings Bank | 0 | -100,00 | 0 | |||||
| 2025-09-29 | NP | QDPL - Pacer Metaurus US Large Cap Dividend Multiplier 400 ETF | 10.698 | 13,81 | 848 | 19,61 | ||||
| 2026-02-17 | 13F | Capital Fund Management S.a. | Put | 0 | -100,00 | 0 | ||||
| 2026-02-12 | 13F | Ci Investments Inc. | 16.994 | 5,57 | 1.449 | 144.700,00 | ||||
| 2026-02-17 | 13F | Suvretta Capital Management, Llc | 11.100 | 0,00 | 946 | 9,62 | ||||
| 2026-02-13 | 13F | Destination Wealth Management | 6.217 | -1,58 | 530 | 7,74 | ||||
| 2026-02-11 | 13F | Jpmorgan Chase & Co | Call | 70.100 | 1.391,49 | 5.976 | 1.537,26 | |||
| 2026-02-11 | 13F | Jpmorgan Chase & Co | Put | 254.500 | 119,02 | 21.696 | 140,11 | |||
| 2026-02-12 | 13F | Federation des caisses Desjardins du Quebec | 203.174 | -4,33 | 17.321 | 4,87 | ||||
| 2026-01-07 | 13F | Sagespring Wealth Partners, Llc | 10.572 | 2,37 | 901 | 12,20 | ||||
| 2026-02-11 | 13F | Jpmorgan Chase & Co | 26.024.852 | 3,86 | 2.218.619 | 13,84 | ||||
| 2026-02-13 | 13F | Truvestments Capital Llc | 1.076 | 0,00 | 92 | 9,64 | ||||
| 2025-09-25 | NP | DFSU - Dimensional US Sustainability Core 1 ETF | 18.332 | 6,89 | 1.454 | 12,29 | ||||
| 2026-01-23 | 13F | Cove Private Wealth, LLC | 12.783 | 0,00 | 1.090 | 9,56 | ||||
| 2025-11-14 | 13F | Freestone Grove Partners LP | 0 | -100,00 | 0 | |||||
| 2025-11-10 | 13F | China Universal Asset Management Co., Ltd. | 0 | -100,00 | 0 | |||||
| 2025-09-26 | NP | FLCPX - Fidelity SAI U.S. Large Cap Index Fund This fund is a listed as child fund of Fmr Llc and if that institution has disclosed ownership in this security, then these positions will not be double counted when calculating total shares and total value | 153.558 | -13,14 | 12.179 | -8,75 | ||||
| 2026-02-13 | 13F | Treasurer of the State of North Carolina | 241.156 | -6,81 | 21 | 0,00 | ||||
| 2025-10-07 | 13F | GFG Capital, LLC | 0 | -100,00 | 0 | |||||
| 2026-01-30 | 13F | American Capital Advisory, LLC | 259 | 1,57 | 22 | 15,79 | ||||
| 2026-02-13 | 13F | Walleye Trading LLC | 4.224 | 360 | ||||||
| 2026-02-09 | 13F | Cary Street Partner Investment Advisory Llc | 1.441 | 8,59 | 123 | 18,45 | ||||
| 2026-02-13 | 13F | Walleye Trading LLC | Put | 125.500 | 250,56 | 10.699 | 284,27 | |||
| 2026-02-13 | 13F | Walleye Trading LLC | Call | 118.100 | 72,91 | 10.068 | 89,57 | |||
| 2026-02-19 | 13F | Atomi Financial Group, Inc. | 3.921 | 20,91 | 334 | 32,54 | ||||
| 2026-02-09 | 13F | Simplify Asset Management Inc. | 19.338 | 92,34 | 1.649 | 111,01 | ||||
| 2026-01-15 | 13F | Econ Financial Services Corp | 22.073 | -18,84 | 1.882 | -11,06 | ||||
| 2025-09-29 | NP | EGLE - Global X S&P 500 U.S. Revenue Leaders ETF | 34 | -32,00 | 3 | -33,33 | ||||
| 2026-01-21 | 13F | Yousif Capital Management, Llc | 78.030 | -4,84 | 6.512 | 2,12 | ||||
| 2026-02-17 | 13F | Silvercrest Asset Management Group Llc | 8.797 | 0,00 | 750 | 9,50 | ||||
| 2026-01-29 | 13F | IMC-Chicago, LLC | Put | 189.400 | 22,91 | 16.146 | 34,73 | |||
| 2026-01-29 | 13F | IMC-Chicago, LLC | Call | 134.100 | -8,34 | 11.432 | 0,48 | |||
| 2026-02-10 | 13F | Allred Capital Management, LLC | 5.959 | -1,65 | 508 | 7,86 | ||||
| 2026-02-06 | 13F | Brown Wealth Management, Llc | 4.984 | 425 | ||||||
| 2026-01-21 | 13F | Westfuller Advisors, LLC | 938 | -7,31 | 80 | 1,28 | ||||
| 2026-02-13 | 13F | Fayez Sarofim & Co | 10.037 | -4,20 | 856 | 5,04 | ||||
| 2026-02-13 | 13F | Fieldview Capital Management, LLC | 5.808 | 495 | ||||||
| 2026-02-23 | 13F | Monetary Solutions, Ltd | 28 | 2 | ||||||
| 2025-09-26 | NP | HAPI - Harbor Corporate Culture ETF | 8.469 | 0,34 | 672 | 5,34 |