Grundlæggende statistik
| Institutionelle aktier (lange) | 967.044.061 - 78,69% (ex 13D/G) - change of -7,70MM shares -0,69% MRQ |
| Institutionel værdi (lang) | $ 16.463.811 USD ($1000) |
Institutionelt ejerskab og aktionærer
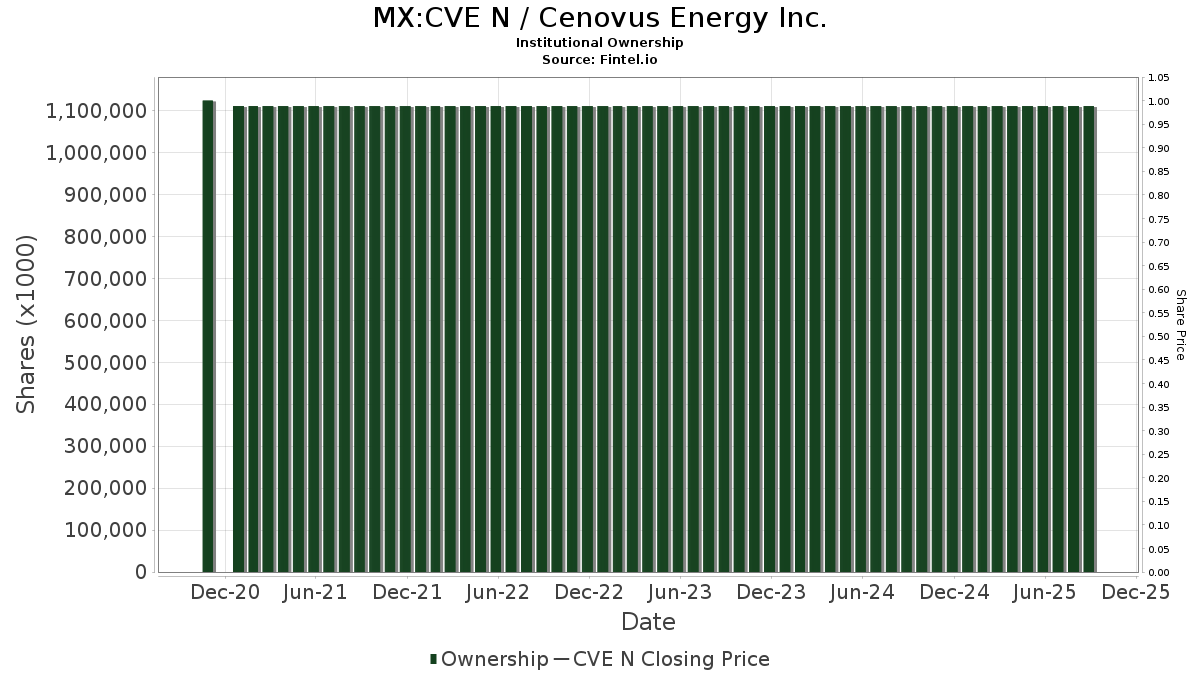
Cenovus Energy Inc. (MX:CVE N) har 452 institutionelle ejere og aktionærer, der har indsendt 13D/G- eller 13F-formularer til Securities Exchange Commission (SEC). Disse institutioner har i alt 967,044,061 aktier. Største aktionærer omfatter Capital Research Global Investors, Capital World Investors, Vanguard Group Inc, Capital International Investors, Royal Bank Of Canada, FIL Ltd, Fmr Llc, Mackenzie Financial Corp, Bank Of Montreal /can/, and Dimensional Fund Advisors Lp .
Cenovus Energy Inc. (BMV:CVE N) institutionel ejerskabsstruktur viser aktuelle positioner i virksomheden efter institutioner og fonde, samt seneste ændringer i positionsstørrelse. Større aktionærer kan omfatte individuelle investorer, investeringsforeninger, hedgefonde eller institutioner. Skema 13D angiver, at investoren besidder (eller besidder) mere end 5 % af virksomheden og har til hensigt (eller har til hensigt at) aktivt at forfølge en ændring i forretningsstrategi. Skema 13G indikerer en passiv investering på over 5%.
Fondens stemningsscore
Fund Sentiment Score (fka Ownership Accumulation Score) finder de aktier, der bliver mest købt af fonde. Det er resultatet af en sofistikeret, multi-faktor kvantitativ model, der identificerer virksomheder med de højeste niveauer af institutionel akkumulering. Scoringsmodellen bruger en kombination af den samlede stigning i oplyste ejere, ændringerne i porteføljeallokeringer i disse ejere og andre målinger. Tallet går fra 0 til 100, hvor højere tal indikerer et højere niveau af akkumulering for sine jævnaldrende, og 50 er gennemsnittet.
Opdateringsfrekvens: Dagligt
Se Ownership Explorer, som giver en liste over højest rangerende virksomheder.
AI+ Ask Fintel’s AI assistant about Cenovus Energy Inc..
Select a question to share a public post with an AI-crafted answer.
Thinking of good questions…
13F og NPORT arkivering
Detaljer om 13F-arkivering er gratis. Detaljer om NP-ansøgninger kræver et premium-medlemskab. Grønne rækker angiver nye positioner. Røde rækker angiver lukkede positioner. Klik på linket ikon for at se den fulde transaktionshistorik.
Opgrader
for at låse premium-data op og eksportere til Excel ![]() .
.
| Fil dato | Kilde | Investor | Type | Gennemsnitlig pris (Øst) |
Aktier | Δ Aktier (%) |
Rapporteret Værdi ($1000) |
Δ Værdi (%) |
Port Alloc (%) |
|
|---|---|---|---|---|---|---|---|---|---|---|
| 2026-02-12 | 13F | Swiss National Bank | 3.761.635 | -3,65 | 63.767 | -3,85 | ||||
| 2025-11-13 | 13F | Sei Investments Co | 0 | -100,00 | 0 | -100,00 | ||||
| 2026-02-13 | 13F | Parkside Financial Bank & Trust | 87 | 0,00 | 1 | 0,00 | ||||
| 2026-02-17 | 13F | Turas Capital Management LP | 589.869 | 9.981 | ||||||
| 2026-02-10 | 13F | Bank of New York Mellon Corp | 1.385.379 | 15,91 | 23.441 | 15,43 | ||||
| 2026-02-17 | 13F | Talaria Asset Management Pty Ltd | 0 | -100,00 | 0 | -100,00 | ||||
| 2026-02-05 | 13F | Bessemer Group Inc | 1.373 | -32,36 | 0 | |||||
| 2026-02-17 | 13F | United Capital Financial Advisers, Llc | 16.408 | 16,39 | 278 | 15,90 | ||||
| 2026-02-17 | 13F | Qube Research & Technologies Ltd | 817.084 | 502,61 | 13.824 | 500,78 | ||||
| 2026-01-21 | 13F | Sound Income Strategies, LLC | 85 | 0,00 | 2 | 0,00 | ||||
| 2026-02-12 | 13F | CIBC Private Wealth Group, LLC | 655 | 11 | ||||||
| 2026-02-12 | 13F | Nuveen, LLC | 1.477.574 | 3,09 | 25.030 | 2,83 | ||||
| 2026-02-10 | 13F | Acadian Asset Management Llc | 164.372 | -25,85 | 3 | -33,33 | ||||
| 2026-02-11 | 13F | Allianz Asset Management GmbH | 1.748.824 | 343,20 | 29.624 | 342,08 | ||||
| 2026-02-17 | 13F | Quantinno Capital Management LP | 424.697 | 6,59 | 7.186 | 6,15 | ||||
| 2026-02-12 | 13F | BlackRock, Inc. | 2.777.768 | 1,85 | 47.000 | 1,43 | ||||
| 2026-02-03 | 13F | Manning & Napier Advisors Llc | 161.661 | -2,16 | 2.755 | -3,47 | ||||
| 2026-02-09 | 13F | Geode Capital Management, Llc | 13.274.142 | 10,90 | 226.307 | 10,64 | ||||
| 2026-02-13 | 13F | Bridgewater Associates, LP | 91.078 | -4,91 | 1.543 | -5,17 | ||||
| 2026-02-17 | 13F | Caption Management, LLC | Put | 0 | -100,00 | 0 | -100,00 | |||
| 2025-10-30 | 13F | Twin Peaks Wealth Advisors, LLC | 0 | -100,00 | 0 | |||||
| 2026-02-17 | 13F | State Of Wisconsin Investment Board | 665.750 | 11.278 | ||||||
| 2026-01-20 | 13F | Meridian Investment Counsel Inc. | 23.275 | 0,00 | 394 | -0,51 | ||||
| 2026-02-17 | 13F | Caption Management, LLC | Call | 0 | -100,00 | 0 | -100,00 | |||
| 2025-11-10 | 13F | Waratah Capital Advisors Ltd. | Call | 0 | -100,00 | 0 | -100,00 | |||
| 2025-11-12 | 13F | Transce3nd, LLC | 0 | -100,00 | 0 | -100,00 | ||||
| 2026-04-24 | 13F | Triasima Portfolio Management inc. | 345.352 | -24,19 | 9.136 | 18,40 | ||||
| 2026-02-27 | 13F | Strategic Investment Solutions, Inc. /IL | 0 | -100,00 | 0 | |||||
| 2026-04-20 | 13F | Ritholtz Wealth Management | 14.178 | 9,91 | 376 | 72,48 | ||||
| 2026-02-13 | 13F | Mariner, LLC | 91.411 | 4,98 | 1.547 | 4,60 | ||||
| 2026-02-17 | 13F | Balyasny Asset Management Llc | 1.571.629 | -39,07 | 26.592 | -39,31 | ||||
| 2026-01-28 | 13F | CAPROCK Group, Inc. | 24.484 | 14,90 | 414 | 17,28 | ||||
| 2026-02-12 | 13F | Jane Street Group, Llc | 1.267.975 | 133,57 | 21.454 | 132,61 | ||||
| 2026-02-13 | 13F | Smartleaf Asset Management LLC | 3.786 | 491,56 | 65 | 481,82 | ||||
| 2026-02-17 | 13F | Ninepoint Partners LP | 4.500.000 | 27,12 | 76.140 | 26,60 | ||||
| 2025-11-14 | 13F | Lincluden Management Ltd | 0 | -100,00 | 0 | |||||
| 2026-04-24 | 13F | Bayban | 1.444 | 0,00 | 38 | 58,33 | ||||
| 2026-02-12 | 13F | Jane Street Group, Llc | Put | 1.472.400 | -23,05 | 24.913 | -23,36 | |||
| 2026-04-20 | 13F | Assenagon Asset Management S.A. | 11.189 | 295 | ||||||
| 2026-02-12 | 13F | Jane Street Group, Llc | Call | 1.778.100 | -9,91 | 30.085 | -10,28 | |||
| 2026-02-13 | 13F | OMERS ADMINISTRATION Corp | 46.192 | -54,76 | 782 | -54,88 | ||||
| 2025-11-14 | 13F | Maverick Capital Ltd | 0 | -100,00 | 0 | -100,00 | ||||
| 2026-01-12 | 13F | Castleview Partners, Llc | 10.300 | 174 | ||||||
| 2026-01-07 | 13F | Aventura Private Wealth, LLC | 839 | -39,60 | 14 | -39,13 | ||||
| 2026-02-13 | 13F | Walleye Trading LLC | Put | 551.700 | -1,64 | 9.335 | -2,05 | |||
| 2026-04-13 | 13F | True Wealth Design, LLC | 283 | 122,83 | 8 | 250,00 | ||||
| 2026-02-13 | 13F | Walleye Trading LLC | Call | 340.500 | -30,52 | 5.761 | -30,81 | |||
| 2026-02-12 | 13F | Cibc World Markets Corp | Put | 112.200 | 0,00 | 1.898 | 24,46 | |||
| 2026-04-13 | 13F | JCIC Asset Management Inc. | 292.184 | 2,86 | 7.739 | 61,03 | ||||
| 2025-11-12 | 13F | Cambria Investment Management, L.P. | 218.906 | 0,00 | 2.979 | 0,00 | ||||
| 2026-02-13 | 13F | Squarepoint Ops LLC | 0 | -100,00 | 0 | -100,00 | ||||
| 2026-04-08 | 13F | Wealth Science Advisors LLC | 21.962 | 0,00 | 372 | 0,00 | ||||
| 2026-02-17 | 13F | Graham Capital Management, L.P. | 32.408 | 548 | ||||||
| 2026-04-22 | 13F | Summerhill Capital Management lnc. | 82.822 | 2.194 | ||||||
| 2026-02-04 | 13F | Beverly Hills Private Wealth, LLC | 164.584 | 0,00 | 2.796 | 0,00 | ||||
| 2026-02-09 | 13F | Bleakley Financial Group, LLC | 21.225 | 5,24 | 359 | 4,97 | ||||
| 2026-02-12 | 13F | Commonwealth Equity Services, Llc | 12.931 | 8,32 | 219 | |||||
| 2026-02-13 | 13F | Citigroup Inc | 623.452 | -2,03 | 10.561 | -2,28 | ||||
| 2026-02-11 | 13F | Fore Capital, LLC | 65.000 | 1.100 | ||||||
| 2026-04-22 | 13F | Spire Wealth Management | 2.309 | 0,22 | 61 | 60,53 | ||||
| 2026-01-29 | 13F | IMC-Chicago, LLC | Put | 266.700 | -31,69 | 4.513 | -31,97 | |||
| 2026-02-12 | 13F | Northwest & Ethical Investments L.P. | 500.366 | 2,70 | 8.485 | 1,62 | ||||
| 2026-01-29 | 13F | IMC-Chicago, LLC | Call | 401.000 | -35,49 | 6.785 | -35,76 | |||
| 2026-04-08 | 13F | Grove Bank & Trust | 0 | -100,00 | 0 | |||||
| 2026-02-17 | 13F | Clear Street Markets Llc | 2.800 | 47 | ||||||
| 2026-02-17 | 13F | Adage Capital Partners Gp, L.l.c. | 5.368.262 | 19,47 | 90.831 | 18,98 | ||||
| 2026-02-14 | 13F | Rockefeller Capital Management L.P. | 2.664 | -36,18 | 45 | -35,71 | ||||
| 2026-02-17 | 13F | Clear Street Markets Llc | Call | 1.000 | 17 | |||||
| 2026-04-13 | 13F | Massmutual Trust Co Fsb/adv | 5.832 | -6,64 | 155 | 46,67 | ||||
| 2026-02-18 | 13F | GWM Advisors LLC | 10.222 | -33,33 | 173 | -33,85 | ||||
| 2026-04-07 | 13F | Signaturefd, Llc | 66.483 | -2,57 | 1.764 | 52,77 | ||||
| 2026-01-30 | 13F | Caldwell Securities, Inc | 7.250 | 0,00 | 123 | -0,81 | ||||
| 2026-02-12 | 13F | Marex Group plc | 235.060 | 0,00 | 3.977 | -0,33 | ||||
| 2026-02-04 | 13F | Heronetta Management, L.P. | 15.000 | 0,00 | 348 | -1,69 | ||||
| 2025-11-12 | 13F | CIBC Bancorp USA Inc. | 9.909 | 234 | ||||||
| 2026-02-06 | 13F | VSM Wealth Advisory, LLC | 48 | 0,00 | 1 | |||||
| 2026-02-13 | 13F | Aviso Financial Inc. | 0 | -100,00 | 0 | |||||
| 2026-04-15 | 13F | Addenda Capital Inc. | 642.604 | -2,05 | 23.725 | 55,74 | ||||
| 2025-11-14 | 13F | Black Maple Capital Management LP | 0 | -100,00 | 0 | -100,00 | ||||
| 2026-03-20 | 13F | Purpose Unlimited Inc. | 513.267 | 8.685 | ||||||
| 2026-01-30 | 13F | NJ State Employees Deferred Compensation Plan | 0 | -100,00 | 0 | -100,00 | ||||
| 2026-02-13 | 13F | Barclays Plc | 87.232 | -78,35 | 1.476 | -78,45 | ||||
| 2026-02-18 | 13F | Vident Advisory, LLC | 25.503 | 16,99 | 432 | 16,49 | ||||
| 2026-04-21 | 13F | One Wealth Advisors, LLC | 10.923 | 290 | ||||||
| 2026-02-17 | 13F | T. Rowe Price Investment Management, Inc. | 61.991 | 1 | ||||||
| 2026-02-17 | 13F | Sender Co & Partners, Inc. | Call | 0 | -100,00 | 0 | -100,00 | |||
| 2026-02-12 | 13F | Wealthspire Advisors, LLC | 0 | -100,00 | 0 | |||||
| 2025-11-13 | 13F | Marshall Wace, Llp | 0 | -100,00 | 0 | -100,00 | ||||
| 2026-02-05 | 13F | AlphaCore Capital LLC | 12.314 | 208 | ||||||
| 2026-02-12 | 13F | Aegis Financial Corp | 3.454.121 | 275,24 | 58.444 | 273,70 | ||||
| 2026-04-22 | 13F | Pictet Asset Management Holding SA | 467.384 | -10,58 | 12.365 | 39,64 | ||||
| 2026-02-12 | 13F | Cibc World Markets Corp | Call | 39.600 | -58,32 | 670 | -48,14 | |||
| 2026-02-13 | 13F | L1 Capital Pty Ltd | 5.655.769 | -13,22 | 95.696 | -15,81 | ||||
| 2026-02-11 | 13F | Metis Global Partners, LLC | 108.539 | -1,86 | 1.836 | -2,18 | ||||
| 2026-02-17 | 13F | Captrust Financial Advisors | 63.815 | 204,82 | 1.080 | 203,94 | ||||
| 2026-02-13 | 13F | Morgan Stanley | 8.578.317 | 43,77 | 145.145 | 43,17 | ||||
| 2026-02-11 | 13F | Deutsche Bank Ag\ | 3.312.789 | -6,61 | 56.052 | -7,00 | ||||
| 2026-02-13 | 13F | Aptus Capital Advisors, LLC | 17.461 | 295 | ||||||
| 2026-04-22 | 13F | Nicholson Meyer Capital Management, Inc. | 26.048 | 0,00 | 691 | 57,05 | ||||
| 2026-02-10 | 13F | Savant Capital, LLC | 43.875 | 7,24 | 742 | 6,76 | ||||
| 2026-02-11 | 13F | Parallel Advisors, LLC | 17.006 | 4,70 | 288 | 4,36 | ||||
| 2026-04-24 | 13F | Yousif Capital Management, Llc | 17.539 | 0,00 | 465 | 50,00 | ||||
| 2025-10-31 | 13F | Lorne Steinberg Wealth Management Inc. | 0 | -100,00 | 0 | -100,00 | ||||
| 2026-02-13 | 13F | Ubs Asset Management Americas Inc | 1.017 | 17 | ||||||
| 2026-02-11 | 13F | Picton Mahoney Asset Management | 6.824.438 | 6,80 | 115.615 | 106.950,00 | ||||
| 2026-02-12 | 13F | Sprott Inc. | 38.441 | 650 | ||||||
| 2026-02-12 | 13F | Prudent Man Investment Management, Inc. | 292 | 0,00 | 5 | 0,00 | ||||
| 2026-01-27 | 13F | Zurcher Kantonalbank (Zurich Cantonalbank) | 928.129 | 12,47 | 15.722 | 12,19 | ||||
| 2026-02-13 | 13F | Transamerica Financial Advisors, Inc. | 1.543 | 26 | ||||||
| 2026-02-17 | 13F | SummitTX Capital, L.P. | 27.206 | 460 | ||||||
| 2026-02-17 | 13F | Investment Management Corp of Ontario | 349.466 | 55,49 | 5.913 | 54,85 | ||||
| 2025-10-30 | 13F | Ridgewood Investments LLC | 0 | -100,00 | 0 | -100,00 | ||||
| 2026-01-27 | 13F | Miller Howard Investments Inc /ny | 0 | -100,00 | 0 | -100,00 | ||||
| 2026-02-11 | 13F | Sunrise Financial Services, LLC | 40 | 1 | ||||||
| 2026-02-13 | 13F | Atlas Capital Advisors Llc | 4.499 | 2,95 | 76 | 28,81 | ||||
| 2025-11-03 | 13F | AustralianSuper Pty Ltd | 0 | -100,00 | 0 | |||||
| 2025-11-21 | 13F/A | CIBC Bancorp USA Inc. | Put | 112.200 | 1.906 | |||||
| 2026-02-02 | 13F | Truist Financial Corp | 45.616 | -22,62 | 772 | -22,98 | ||||
| 2026-02-11 | 13F | Capital International Sarl | 1.395.055 | -1,66 | 23.628 | -1,93 | ||||
| 2026-03-12 | 13F | Nalls Sherbakoff Group, Llc | 0 | -100,00 | 0 | -100,00 | ||||
| 2026-02-12 | 13F | Intesa Sanpaolo Wealth Management | 93 | 2 | ||||||
| 2026-02-13 | 13F | Wexford Capital Lp | 200.000 | 23.624,79 | 3.384 | 24.071,43 | ||||
| 2026-02-17 | 13F | SIG North Trading, ULC | Put | 2.763.300 | 27,56 | 46.755 | 27,03 | |||
| 2026-02-17 | 13F | SIG North Trading, ULC | Call | 1.657.700 | 72,44 | 28.048 | 71,74 | |||
| 2026-02-04 | 13F | Atlantic Union Bankshares Corp | 1.960 | 0,00 | 33 | 0,00 | ||||
| 2026-02-17 | 13F | SIG North Trading, ULC | 109.916 | -86,44 | 1.860 | -86,50 | ||||
| 2026-02-09 | 13F | Arista Wealth Management, LLC | 15.000 | 254 | ||||||
| 2026-02-13 | 13F | Recurrent Investment Advisors LLC | 6.363.516 | -0,92 | 111.062 | -1,19 | ||||
| 2025-11-14 | 13F | ExodusPoint Capital Management, LP | 479.700 | 162,94 | 8.150 | 407.400,00 | ||||
| 2026-02-13 | 13F | Mml Investors Services, Llc | 112.182 | 124,04 | 1.898 | 123,29 | ||||
| 2025-11-07 | 13F | Sierra Ocean, Llc | 0 | -100,00 | 0 | -100,00 | ||||
| 2026-02-13 | 13F | Arkadios Wealth Advisors | 31.133 | 123,26 | 527 | 122,88 | ||||
| 2026-02-06 | 13F | HighTower Advisors, LLC | 31.345 | 2,46 | 530 | 2,12 | ||||
| 2026-02-09 | 13F | Huntington National Bank | 1 | -99,18 | 0 | -100,00 | ||||
| 2025-11-13 | 13F | Arrowstreet Capital, Limited Partnership | 0 | -100,00 | 0 | -100,00 | ||||
| 2026-02-17 | 13F | Raymond James Financial Inc | 522.923 | 16,59 | 8.848 | 16,10 | ||||
| 2026-02-02 | 13F | Fifth Third Bancorp | 1.255 | 15,99 | 21 | 16,67 | ||||
| 2026-02-06 | 13F | Harvest Portfolios Group Inc. | 192.610 | 12,66 | 3.258 | 12,27 | ||||
| 2026-04-09 | 13F | Pacifica Partners Inc. | 182.587 | -1,72 | 4.835 | 48,92 | ||||
| 2026-02-11 | 13F | Simplex Trading, Llc | 59.916 | 1.014 | ||||||
| 2026-02-17 | 13F | Numerai GP LLC | 163.777 | 2.771 | ||||||
| 2026-02-11 | 13F | Simplex Trading, Llc | Call | 335.200 | -61,35 | 5.672 | 40.407,14 | |||
| 2026-02-11 | 13F | Simplex Trading, Llc | Put | 218.200 | -30,13 | 3.692 | 73.720,00 | |||
| 2026-04-23 | 13F | SevenBridge Financial Group, LLC | 17.060 | -0,01 | 442 | 37,27 | ||||
| 2026-01-27 | 13F | First Horizon Corp | 781 | -17,79 | 13 | -18,75 | ||||
| 2026-04-21 | 13F | Guinness Asset Management LTD | 566.709 | 38,53 | 14.986 | 116,94 | ||||
| 2026-02-09 | 13F | Life Cycle Investment Partners Ltd | 866.482 | 20.120 | ||||||
| 2026-02-11 | 13F | Capital International Investors | 50.979.140 | 3,88 | 862.505 | 3,48 | ||||
| 2026-04-21 | 13F | Gilpin Wealth Management, Llc | 114 | -20,28 | 3 | 50,00 | ||||
| 2025-11-14 | 13F | Cubist Systematic Strategies, LLC | Put | 7.600 | 0,00 | 129 | 25,24 | |||
| 2025-11-14 | 13F | Cubist Systematic Strategies, LLC | Call | 15.600 | 0,00 | 265 | 25,00 | |||
| 2026-02-17 | 13F | Capital Fund Management S.a. | 238.007 | 112,13 | 4.027 | 111,28 | ||||
| 2026-02-09 | 13F | Legal & General Group Plc | 5.198.130 | -5,16 | 88.054 | -5,40 | ||||
| 2026-02-13 | 13F | National Bank Of Canada /fi/ | 12.925.216 | 108,48 | 218.518 | 107,90 | ||||
| 2026-02-17 | 13F | Holocene Advisors, LP | 0 | -100,00 | 0 | -100,00 | ||||
| 2026-02-12 | 13F | M&G Plc | 3.345.588 | -9,27 | 56.064 | -11,82 | ||||
| 2026-01-20 | 13F | Cromwell Holdings LLC | 2.875 | 0,00 | 49 | 0,00 | ||||
| 2025-11-13 | 13F | Capital Group Private Client Services, Inc. | 0 | -100,00 | 0 | -100,00 | ||||
| 2026-04-21 | 13F | Penbrook Management LLC | 29.880 | 0,00 | 793 | 56,83 | ||||
| 2026-01-20 | 13F | Stratos Wealth Partners, LTD. | 155.845 | 0,04 | 2.637 | -0,38 | ||||
| 2026-02-13 | 13F | Pinnacle Wealth Planning Services, Inc. | 1.720 | 29 | ||||||
| 2026-04-22 | 13F | Pinnacle Bancorp, Inc. | 664 | 0,00 | 18 | 54,55 | ||||
| 2025-11-14 | 13F | Wood Tarver Financial Group, LLC | 0 | -100,00 | 0 | |||||
| 2026-02-11 | 13F | Franklin Resources Inc | 4.917.368 | 2,41 | 83.192 | 2,05 | ||||
| 2026-02-09 | 13F | GeoSphere Capital Management | 165.000 | -48,44 | 2.792 | -48,66 | ||||
| 2026-02-12 | 13F | Advisors Asset Management, Inc. | 18.575 | 86,98 | 314 | 86,90 | ||||
| 2026-02-03 | 13F | International Assets Investment Management, Llc | 65.248 | 0,87 | 1.104 | 22,97 | ||||
| 2026-02-17 | 13F | Bank Of America Corp /de/ | 10.778.127 | -30,61 | 182.366 | -30,89 | ||||
| 2026-02-13 | 13F | American Century Companies Inc | 3.197.195 | 225,37 | 54.088 | 224,19 | ||||
| 2026-04-23 | 13F | Harbor Investment Advisory, Llc | 24 | -95,61 | 1 | -100,00 | ||||
| 2026-02-17 | 13F | Ancora Advisors, LLC | 63 | 1 | ||||||
| 2026-02-13 | 13F | Public Sector Pension Investment Board | 0 | -100,00 | 0 | |||||
| 2026-04-10 | 13F | Pure Financial Advisors, Inc. | 14.437 | 32,55 | 383 | 108,15 | ||||
| 2026-04-13 | 13F | Wolff Wiese Magana Llc | 2.000 | 53 | ||||||
| 2026-04-22 | 13F | Avise Financial Cooperative, Inc. | 10.019 | -24,52 | 266 | 18,30 | ||||
| 2026-02-10 | 13F | Envestnet Asset Management Inc | 601.768 | -32,88 | 10.182 | -33,16 | ||||
| 2026-02-17 | 13F | FIL Ltd | 38.533.059 | 40,05 | 651.880 | 39,54 | ||||
| 2025-11-14 | 13F | AXA Investment Managers S.A. | 96.957 | 1.647 | ||||||
| 2025-11-04 | 13F | IMC-Chicago, LLC | 0 | -100,00 | 0 | -100,00 | ||||
| 2025-11-13 | 13F | De Lisle Partners LLP | 0 | -100,00 | 0 | -100,00 | ||||
| 2026-02-12 | 13F | Scotia Capital Inc. | 1.111.056 | 18,50 | 18.772 | 18,15 | ||||
| 2026-02-03 | 13F | K.J. Harrison & Partners Inc | 29.272 | 1,51 | 496 | 2,70 | ||||
| 2026-02-17 | 13F | Wellington Management Group Llp | 7.910.973 | -4,05 | 134.007 | -4,30 | ||||
| 2026-02-13 | 13F | Natixis | 11.981 | 3,32 | 203 | 2,54 | ||||
| 2026-02-17 | 13F | Advisory Services Network, LLC | 0 | -100,00 | 0 | |||||
| 2026-02-13 | 13F | Motiv8 Investments LLC | 95 | 0 | ||||||
| 2025-11-12 | 13F | Headlands Technologies LLC | 0 | -100,00 | 0 | -100,00 | ||||
| 2025-11-14 | 13F | Walleye Trading LLC | 0 | -100,00 | 0 | -100,00 | ||||
| 2026-02-12 | 13F | Hrt Financial Lp | 83.785 | 1 | ||||||
| 2026-02-17 | 13F | Trexquant Investment LP | 0 | -100,00 | 0 | -100,00 | ||||
| 2025-11-13 | 13F | Prudential Financial Inc | 0 | -100,00 | 0 | -100,00 | ||||
| 2025-11-14 | 13F | Axa S.a. | 0 | -100,00 | 0 | -100,00 | ||||
| 2026-04-24 | 13F | USS Investment Management Ltd | 32.253 | 856 | ||||||
| 2026-02-13 | 13F | Y-Intercept (Hong Kong) Ltd | 86.113 | -15,82 | 1.457 | -16,12 | ||||
| 2026-02-10 | 13F | Hillsdale Investment Management Inc. | 1.145.115 | 105,00 | 19.407 | 104,66 | ||||
| 2026-04-10 | 13F | Viking Fund Management Llc | 60.000 | 1.592 | ||||||
| 2026-02-13 | 13F | National Bank Of Canada /fi/ | Call | 8.354 | -22,13 | 14.131 | -22,43 | |||
| 2026-02-11 | 13F | Capital International Ltd /ca/ | 729.348 | -2,24 | 12.339 | -2,60 | ||||
| 2026-02-13 | 13F | National Bank Of Canada /fi/ | Put | 6.725 | 3,76 | 11.376 | 3,36 | |||
| 2026-02-13 | 13F | Hudson Bay Capital Management LP | Call | 0 | -100,00 | 0 | -100,00 | |||
| 2026-02-13 | 13F | NewGen Asset Management Ltd | 290.500 | 4.915 | ||||||
| 2026-02-04 | 13F | Asahi Life Asset Management Co., Ltd. | 0 | -100,00 | 0 | -100,00 | ||||
| 2026-02-13 | 13F | Cloverfields Capital Group, Lp | 29.854 | 0,03 | 505 | -0,39 | ||||
| 2026-04-14 | 13F | American State Bank (Iowa) | 0 | -100,00 | 0 | |||||
| 2026-02-17 | 13F | Quadrature Capital Ltd | 1.026.500 | 17.389 | ||||||
| 2026-02-17 | 13F | Two Sigma Advisers, Lp | 10.200 | 173 | ||||||
| 2026-02-13 | 13F | Alyeska Investment Group, L.P. | 4.073.270 | 173,93 | 68.920 | 172,81 | ||||
| 2025-11-13 | 13F | Panview Capital Ltd | 0 | -100,00 | 0 | -100,00 | ||||
| 2026-02-10 | 13F | Bruce G. Allen Investments, LLC | 1.914 | 0,00 | 32 | 0,00 | ||||
| 2026-01-16 | 13F | Crewe Advisors LLC | 150 | 0,00 | 3 | 0,00 | ||||
| 2026-02-02 | 13F | Avidian Wealth Solutions, LLC | 11.210 | 0,00 | 190 | -0,53 | ||||
| 2026-02-11 | 13F | Group One Trading, L.p. | Put | 161.500 | -42,99 | 2.733 | -43,24 | |||
| 2026-02-11 | 13F | Group One Trading, L.p. | Call | 691.800 | -46,99 | 11.705 | -47,21 | |||
| 2026-01-28 | 13F | Financial Perspectives, Inc | 1.676 | 0,00 | 28 | 0,00 | ||||
| 2026-02-11 | 13F | Group One Trading, L.p. | 133.054 | 2.251 | ||||||
| 2026-02-13 | 13F | Evelyn Partners Investment Management Services Ltd | 201 | 0,00 | 3 | 0,00 | ||||
| 2026-02-17 | 13F | Capital Fund Management S.a. | Put | 141.300 | -30,05 | 2.391 | -30,34 | |||
| 2026-02-17 | 13F | Capital Fund Management S.a. | Call | 29.600 | -73,45 | 501 | -73,60 | |||
| 2026-04-06 | 13F | Washington Trust Advisors, Inc. | 588 | 0,00 | 16 | 66,67 | ||||
| 2026-02-17 | 13F | Optiver Holding B.V. | 0 | -100,00 | 0 | |||||
| 2026-02-17 | 13F | Schonfeld Strategic Advisors LLC | 121.259 | 2.052 | ||||||
| 2026-04-15 | 13F | Paragon Capital Management Ltd | 15.253 | -5,10 | 405 | 49,08 | ||||
| 2026-02-13 | 13F | SRS Capital Advisors, Inc. | 2.769 | -9,86 | 47 | -11,54 | ||||
| 2026-02-13 | 13F | Pathstone Holdings, LLC | 73.290 | 6,64 | 1.240 | 6,26 | ||||
| 2026-02-02 | 13F | Mutual Advisors, LLC | 13.323 | 225 | ||||||
| 2026-02-17 | 13F | Cape Investment Advisory, Inc. | 246 | 0,41 | 4 | 0,00 | ||||
| 2026-02-23 | 13F | Mv Capital Management, Inc. | 13 | 0 | ||||||
| 2026-02-18 | 13F | Guardian Capital Lp | 239.597 | 4.059 | ||||||
| 2026-02-17 | 13F | Alliancebernstein L.p. | 158.721 | -64,47 | 2.686 | -64,62 | ||||
| 2025-11-17 | 13F | FSA Wealth Management LLC | 188 | 0,00 | 3 | 50,00 | ||||
| 2026-02-13 | 13F | Stifel Financial Corp | 21.958 | 10,75 | 372 | 10,42 | ||||
| 2026-04-22 | 13F | Canoe Financial LP | 4.211.181 | -30,60 | 111.726 | 8,83 | ||||
| 2026-02-17 | 13F | Credit Agricole S A | 21.494 | 5,68 | 364 | 5,22 | ||||
| 2025-11-14 | 13F | ICONIQ Capital, LLC | 0 | -100,00 | 0 | -100,00 | ||||
| 2026-02-17 | 13F | Janus Henderson Group Plc | 86.167 | -7,11 | 1.460 | -7,37 | ||||
| 2026-02-17 | 13F | Cinctive Capital Management LP | 74.823 | 1.266 | ||||||
| 2026-02-13 | 13F | Healthcare Of Ontario Pension Plan Trust Fund | 15.414.179 | 440,85 | 260.797 | 439,06 | ||||
| 2026-02-13 | 13F | BRITISH COLUMBIA INVESTMENT MANAGEMENT Corp | 3.876.731 | 37,30 | 65.586 | 36,83 | ||||
| 2026-02-13 | 13F | Van Eck Associates Corp | 299.700 | -31,75 | 5 | -28,57 | ||||
| 2026-04-07 | 13F | CoreCap Advisors, LLC | 4.023 | -45,17 | 107 | -14,52 | ||||
| 2026-02-10 | 13F | Bnp Paribas Arbitrage, Sa | 5.624 | 0,00 | 95 | 0,00 | ||||
| 2026-02-13 | 13F | Beutel, Goodman & Co Ltd. | 139.111 | -0,20 | 2 | 0,00 | ||||
| 2026-02-10 | 13F | PCJ Investment Counsel Ltd. | 406.470 | -1,72 | 6.877 | -2,11 | ||||
| 2026-04-08 | 13F | Castle Rock Wealth Management, LLC | 100.877 | -2,03 | 2.679 | 31,58 | ||||
| 2026-04-13 | 13F | Gateway Investment Advisers Llc | 19.034 | -79,75 | 505 | -68,30 | ||||
| 2026-02-17 | 13F | Tower Research Capital LLC (TRC) | 4.765 | -82,10 | 81 | -82,30 | ||||
| 2026-02-10 | 13F | Godfrey Financial Associates, Inc. | 12 | 0 | ||||||
| 2025-11-14 | 13F | Point72 (DIFC) Ltd | 5.461 | 93 | ||||||
| 2026-04-22 | 13F | Gold Investment Management Ltd. | 21.200 | 6,13 | 562 | 66,77 | ||||
| 2025-11-06 | 13F | MidWestOne Financial Group, Inc. | 0 | -100,00 | 0 | -100,00 | ||||
| 2026-01-15 | 13F | Frank, Rimerman Advisors LLC | 23.364 | -0,15 | 395 | -0,50 | ||||
| 2026-04-21 | 13F | Decker Retirement Planning Inc. | 50 | 1 | ||||||
| 2026-04-21 | 13F | Fruth Investment Management | 8.850 | 0 | ||||||
| 2026-02-18 | 13F | Beacon Pointe Advisors, LLC | 12.494 | -0,79 | 211 | -0,94 | ||||
| 2026-01-16 | 13F | Hopwood Financial Services, Inc. | 0 | -100,00 | 0 | -100,00 | ||||
| 2026-02-17 | 13F | Susquehanna International Group, Llp | Call | 1.018.200 | -54,96 | 17.228 | -55,15 | |||
| 2026-02-11 | 13F | Letko, Brosseau & Associates Inc | 5.949.541 | -0,93 | 100.783 | -1,18 | ||||
| 2026-02-17 | 13F | Susquehanna International Group, Llp | 383.237 | 106,32 | 6.484 | 105,52 | ||||
| 2026-02-17 | 13F | Susquehanna International Group, Llp | Put | 1.221.200 | 1,46 | 20.663 | 1,04 | |||
| 2025-11-13 | 13F | Wells Fargo & Company/mn | Call | 0 | -100,00 | 0 | -100,00 | |||
| 2026-01-29 | 13F | Sanctuary Advisors, LLC | 13.690 | 8,46 | 232 | 7,94 | ||||
| 2026-02-13 | 13F | Charles Schwab Investment Management Inc | 6.293.862 | 14,87 | 106.616 | 14,58 | ||||
| 2026-04-20 | 13F | Edge Wealth Management LLC | 10.000 | 0,00 | 265 | 56,80 | ||||
| 2026-02-02 | 13F | Wolverine Asset Management Llc | Put | 2.000 | 34 | |||||
| 2026-02-10 | 13F | Scheer, Rowlett & Associates Investment Management Ltd. | 3.448.636 | -12,51 | 58.343 | -12,81 | ||||
| 2026-02-17 | 13F | XTX Topco Ltd | 99.457 | -10,24 | 1.683 | -10,63 | ||||
| 2026-02-17 | 13F | Private Advisor Group, LLC | 48.808 | 33,42 | 826 | 32,85 | ||||
| 2026-04-20 | 13F | Sowell Financial Services LLC | 31.069 | 824 | ||||||
| 2026-04-22 | 13F | Stone House Investment Management, LLC | 100 | 0,00 | 3 | 100,00 | ||||
| 2025-11-14 | 13F | Challenger Wealth Management | 0 | -100,00 | 0 | -100,00 | ||||
| 2026-02-09 | 13F | Smead Capital Management, Inc. | 16.763.978 | 2,28 | 283.634 | 1,94 | ||||
| 2026-01-14 | 13F | Clarius Group, LLC | 10.802 | 0,00 | 183 | -0,55 | ||||
| 2026-02-13 | 13F | Integrated Wealth Concepts LLC | 22.425 | 6,23 | 379 | 5,87 | ||||
| 2026-02-17 | 13F | Persistent Asset Partners Ltd | 35.975 | -31,27 | 609 | -31,61 | ||||
| 2026-01-16 | 13F | Empirical Financial Services, LLC d.b.a. Empirical Wealth Management | 18.803 | 318 | ||||||
| 2026-02-17 | 13F | PenderFund Capital Management Ltd. | 40.000 | 300,00 | 677 | 300,00 | ||||
| 2026-01-15 | 13F | J. Safra Sarasin Holding AG | 27.316 | -21,55 | 463 | -21,83 | ||||
| 2026-02-13 | 13F | Aigen Investment Management, Lp | 20.214 | 436 | ||||||
| 2026-02-13 | 13F | Ieq Capital, Llc | 70.647 | 5,31 | 1.195 | 4,92 | ||||
| 2026-04-17 | 13F | CENTRAL TRUST Co | 25 | 0,00 | 1 | |||||
| 2026-02-05 | 13F | Blume Capital Management, Inc. | 600 | 0,00 | 10 | 0,00 | ||||
| 2026-02-12 | 13F | Principal Securities, Inc. | 15.752 | -0,66 | 267 | -1,12 | ||||
| 2026-01-27 | 13F | Cushing Asset Management, Lp | 460.000 | 33,72 | 7.783 | 33,18 | ||||
| 2026-02-17 | 13F | Hartree Partners, LP | 0 | -100,00 | 0 | |||||
| 2026-02-05 | 13F | Atria Investments Llc | 134.400 | 4,63 | 2.274 | 4,22 | ||||
| 2026-02-13 | 13F | Golden State Wealth Management, LLC | 336 | 0,90 | 6 | 0,00 | ||||
| 2026-02-11 | 13F | O'shaughnessy Asset Management, Llc | 916.749 | 18,51 | 15.509 | 18,10 | ||||
| 2025-11-21 | 13F | Nebula Research & Development LLC | 0 | -100,00 | 0 | -100,00 | ||||
| 2026-02-10 | 13F | Gulf International Bank (UK) Ltd | 66.679 | 0,00 | 1 | 0,00 | ||||
| 2026-02-12 | 13F | UniSuper Management Pty Ltd | 23.300 | 0,00 | 541 | -1,64 | ||||
| 2026-01-14 | 13F | Net Worth Advisory Group | 0 | -100,00 | 0 | -100,00 | ||||
| 2026-04-15 | 13F | FNY Investment Advisers, LLC | 0 | -100,00 | 0 | |||||
| 2026-02-17 | 13F | Worldquant Millennium Advisors Llc | 106.478 | 1.802 | ||||||
| 2026-02-13 | 13F | Vontobel Holding Ltd. | 115.100 | 18,79 | 1.947 | 18,43 | ||||
| 2026-01-26 | 13F | Cwm, Llc | 5.426 | 7,70 | 0 | |||||
| 2026-02-17 | 13F | Corigliano Investment Advisers, LLC | 545.000 | -48,58 | 9.221 | -48,80 | ||||
| 2025-11-13 | 13F | Portland Investment Counsel Inc. | 0 | -100,00 | 0 | -100,00 | ||||
| 2026-02-12 | 13F | Dimensional Fund Advisors Lp | 18.018.995 | 4,99 | 304.894 | 4,55 | ||||
| 2026-04-16 | 13F | Annex Advisory Services, LLC | 146.567 | -12,75 | 3.888 | 36,81 | ||||
| 2026-02-10 | 13F | Goldman Sachs Group Inc | Put | 394.200 | 0,00 | 6.670 | -0,42 | |||
| 2026-02-13 | 13F | Towarzystwo Funduszy Inwestycyjnych Pzu Sa | 0 | -100,00 | 0 | |||||
| 2026-01-22 | 13F | Bartlett & Co. Wealth Management Llc | 2.000 | 0,00 | 34 | 0,00 | ||||
| 2026-02-11 | 13F | Clearbridge Investments, LLC | 3.456.694 | 29,81 | 58.487 | 29,27 | ||||
| 2026-02-10 | 13F | Goldman Sachs Group Inc | Call | 394.200 | 0,00 | 6.670 | -0,42 | |||
| 2025-11-13 | 13F | Entropy Technologies, LP | 0 | -100,00 | 0 | -100,00 | ||||
| 2026-01-28 | 13F | Geneos Wealth Management Inc. | 3.256 | 0,03 | 55 | 0,00 | ||||
| 2026-04-22 | 13F | Janney Montgomery Scott LLC | 19.121 | 57,83 | 1 | |||||
| 2026-02-10 | 13F | Goldman Sachs Group Inc | 7.695.985 | -62,52 | 130.216 | -62,68 | ||||
| 2026-02-13 | 13F | Manufacturers Life Insurance Company, The | 0 | -100,00 | 0 | |||||
| 2026-02-13 | 13F | Korea Investment CORP | 1.275.948 | 16,59 | 21.614 | 16,29 | ||||
| 2026-02-17 | 13F | BCV Asset Management Inc. | 202.909 | 5.842 | ||||||
| 2026-04-24 | 13F | Fulton Bank, N.a. | 22.798 | 30,38 | 605 | 104,75 | ||||
| 2026-02-13 | 13F | JustInvest LLC | 17.981 | 2,40 | 304 | 2,01 | ||||
| 2026-02-04 | 13F | Swiss Life Asset Management Ltd | 93.763 | 0,93 | 1.586 | 0,38 | ||||
| 2026-02-17 | 13F | Millennium Management Llc | Call | 258.600 | 2,05 | 4.376 | 1,63 | |||
| 2026-02-17 | 13F | Tudor Investment Corp Et Al | Call | 12.900 | -40,28 | 218 | -40,44 | |||
| 2026-02-17 | 13F | Millennium Management Llc | 2.076.407 | -26,36 | 35.134 | -26,66 | ||||
| 2026-04-22 | 13F | Adams Natural Resources Fund, Inc. | 209.900 | -7,98 | 5.569 | 44,29 | ||||
| 2026-01-20 | 13F | Cigna Investments Inc /new | 25.938 | 6,83 | 0 | |||||
| 2026-02-13 | 13F | Royal London Asset Management Ltd | 49.391 | 0,24 | 836 | -0,24 | ||||
| 2026-02-17 | 13F | Millennium Management Llc | Put | 227.100 | -1,52 | 3.843 | -1,91 | |||
| 2026-02-02 | 13F | Benjamin Edwards Inc | 10.149 | 172 | ||||||
| 2026-04-22 | 13F | Larry Mathis Financial Planning, LLC | 10.504 | -2,06 | 279 | 53,59 | ||||
| 2026-01-15 | 13F | Nisa Investment Advisors, Llc | 600 | 0,00 | 10 | 0,00 | ||||
| 2026-02-09 | 13F | Waratah Capital Advisors Ltd. | 0 | -100,00 | 0 | -100,00 | ||||
| 2026-02-13 | 13F | Caitong International Asset Management Co., Ltd | 797 | 13 | ||||||
| 2026-02-17 | 13F | Engineers Gate Manager LP | 84.785 | 347,41 | 1.435 | 346,73 | ||||
| 2026-01-23 | 13F | Bridgewater Advisors Inc. | 12.898 | -5,76 | 238 | 3,48 | ||||
| 2026-01-30 | 13F | Us Bancorp \de\ | 65.238 | -1,42 | 1.104 | -1,87 | ||||
| 2026-02-12 | 13F | Cibc World Markets Corp | 0 | -100,00 | 0 | -100,00 | ||||
| 2026-02-13 | 13F | Victory Capital Management Inc | 75.501 | 18,64 | 1.277 | 18,13 | ||||
| 2026-02-17 | 13F | Parallax Volatility Advisers, L.P. | 159.856 | 2.705 | ||||||
| 2026-02-17 | 13F | Parallax Volatility Advisers, L.P. | Call | 251.500 | -54,28 | 4.255 | -54,47 | |||
| 2026-02-17 | 13F | Royal Bank Of Canada | Put | 4.157.000 | -16,22 | 70.336 | -16,57 | |||
| 2025-11-13 | 13F | HITE Hedge Asset Management LLC | 0 | -100,00 | 0 | -100,00 | ||||
| 2026-02-12 | 13F | Brown Brothers Harriman & Co | 991 | 57,05 | 17 | 60,00 | ||||
| 2025-11-10 | 13F | Vestmark Advisory Solutions, Inc. | 0 | -100,00 | 0 | -100,00 | ||||
| 2026-02-10 | 13F | Td Asset Management Inc | 16.995.459 | 3,63 | 287.897 | 3,37 | ||||
| 2026-02-17 | 13F | Royal Bank Of Canada | Call | 468.800 | -24,39 | 7.932 | -24,70 | |||
| 2025-11-13 | 13F | Magnetar Financial LLC | 0 | -100,00 | 0 | -100,00 | ||||
| 2026-04-20 | 13F | Jfs Wealth Advisors, Llc | 285 | -24,60 | 8 | 16,67 | ||||
| 2026-02-17 | 13F | Parallax Volatility Advisers, L.P. | Put | 250.000 | 0,00 | 4.230 | -0,40 | |||
| 2026-02-17 | 13F | Public Employees Retirement System Of Ohio | 92.428 | 1,75 | 1.566 | 1,49 | ||||
| 2026-02-17 | 13F | Moore Capital Management, Lp | 450.000 | 7.614 | ||||||
| 2026-01-21 | 13F | Bank Of Stockton | 15.246 | 4,99 | 258 | 4,47 | ||||
| 2026-01-30 | 13F | Rogco, Lp | 626 | 0,00 | 11 | 0,00 | ||||
| 2026-02-10 | 13F | Connor, Clark & Lunn Investment Management Ltd. | 7.148.530 | 49,93 | 120.938 | 49,42 | ||||
| 2025-11-13 | 13F | Jump Financial, LLC | 0 | -100,00 | 0 | -100,00 | ||||
| 2026-04-24 | 13F | Root Financial Partners, LLC | 158 | 16,18 | 4 | 100,00 | ||||
| 2026-01-22 | 13F | Bear Mountain Capital, Inc. | 0 | -100,00 | 0 | |||||
| 2026-02-11 | 13F | Erste Asset Management GmbH | 60.657 | 1.023 | ||||||
| 2026-02-17 | 13F | Virtus Investment Advisers, Inc. | 9.725 | -3,74 | 165 | -4,09 | ||||
| 2026-02-13 | 13F | Verition Fund Management LLC | 636.137 | -50,20 | 10.763 | -50,41 | ||||
| 2026-01-29 | 13F | Vanguard Group Inc | 63.525.477 | 12,78 | 1.074.660 | 12,37 | ||||
| 2026-02-18 | 13F | NFP Retirement, Inc. | 37.333 | 14,87 | 632 | 14,31 | ||||
| 2026-02-12 | 13F | Bank Of Nova Scotia Trust Co | 22.287 | 49,51 | 377 | 49,01 | ||||
| 2025-11-14 | 13F | Yaupon Capital Management LP | Call | 0 | -100,00 | 0 | -100,00 | |||
| 2026-04-01 | 13F | Confluence Investment Management Llc | 63.727 | 1.691 | ||||||
| 2026-02-13 | 13F | SIR Capital Management, L.P. | 525.700 | -61,82 | 8.895 | -61,98 | ||||
| 2026-02-11 | 13F | Prudential Plc | 20.513 | 0,00 | 347 | -0,29 | ||||
| 2026-02-17 | 13F | Mak Capital One Llc | 536.832 | 9.083 | ||||||
| 2026-02-02 | 13F | Intact Investment Management Inc. | 3.366.588 | -7,91 | 56.952 | -8,26 | ||||
| 2026-04-15 | 13F | Merit Financial Group, LLC | 7.576 | 201 | ||||||
| 2026-02-11 | 13F | Westerkirk Capital Inc. | 3.990 | -92,55 | 68 | -92,64 | ||||
| 2026-02-17 | 13F | SageView Advisory Group, LLC | 160 | 3 | ||||||
| 2026-02-06 | 13F | Kingdom Financial Group LLC. | 25 | 0 | ||||||
| 2026-02-17 | 13F | Aqr Capital Management Llc | 3.804.849 | 4.866,26 | 64.370 | 4.847,66 | ||||
| 2026-02-12 | 13F | Federation des caisses Desjardins du Quebec | 10.074.616 | 0,13 | 170.325 | -0,16 | ||||
| 2026-02-06 | 13F | Global Retirement Partners, LLC | 557 | 101,81 | 9 | 125,00 | ||||
| 2026-02-13 | 13F | Squarepoint Ops LLC | Call | 15.300 | -29,82 | 259 | -30,27 | |||
| 2025-11-13 | 13F | Kayne Anderson Rudnick Investment Management Llc | 0 | -100,00 | 0 | |||||
| 2026-02-13 | 13F | Squarepoint Ops LLC | Put | 11.600 | -92,07 | 196 | -92,11 | |||
| 2026-02-17 | 13F | PDT Partners, LLC | 519.050 | 0,00 | 8.782 | -0,41 | ||||
| 2026-01-26 | 13F | Keystone Wealth Services, LLC | 24.418 | 0,83 | 413 | 0,49 | ||||
| 2026-02-12 | 13F | Moerus Capital Management LLC | 12.377 | 209 | ||||||
| 2026-04-23 | 13F | MQS Management LLC | 36.274 | -8,11 | 962 | 44,23 | ||||
| 2026-02-10 | 13F | Natixis Advisors, L.p. | 56.803 | -19,55 | 1 | -100,00 | ||||
| 2026-02-11 | 13F | Capital International Inc /ca/ | 4.525.223 | 26,34 | 76.563 | 25,88 | ||||
| 2026-02-02 | 13F | Cornerstone Planning Group LLC | 204 | 48,91 | 4 | 100,00 | ||||
| 2025-11-14 | 13F | Anson Funds Management LP | 0 | -100,00 | 0 | -100,00 | ||||
| 2026-02-17 | 13F | Gotham Asset Management, LLC | 299.472 | 1.249,46 | 5.067 | 1.244,03 | ||||
| 2026-02-12 | 13F | denkapparat Operations GmbH | 15.296 | 259 | ||||||
| 2026-04-20 | 13F | Cardinal Point Capital Management, ULC | 33.842 | -86,12 | 896 | -78,30 | ||||
| 2026-02-11 | 13F | Twin Tree Management, LP | Call | 125.500 | 0,00 | 2.123 | -0,42 | |||
| 2025-11-14 | 13F | Mount Yale Investment Advisors, LLC | 0 | -100,00 | 0 | -100,00 | ||||
| 2026-02-11 | 13F | Twin Tree Management, LP | Put | 252.100 | 4.266 | |||||
| 2026-02-11 | 13F | Twin Tree Management, LP | 88.638 | -85,27 | 1.500 | -85,34 | ||||
| 2026-04-23 | 13F | J.w. Cole Advisors, Inc. | 13.411 | 0,03 | 356 | 57,08 | ||||
| 2026-02-13 | 13F | Boston Partners | 13.415.262 | -39,66 | 227.844 | -44,33 | ||||
| 2026-02-17 | 13F | D. E. Shaw & Co., Inc. | Put | 1.187.300 | 30,86 | 20.088 | 30,40 | |||
| 2026-02-17 | 13F | Jones Financial Companies Lllp | 13.783 | 116,41 | 233 | 106,19 | ||||
| 2026-02-17 | 13F | D. E. Shaw & Co., Inc. | 1.502.453 | -58,42 | 25.420 | -58,57 | ||||
| 2026-02-05 | 13F | Td Private Client Wealth Llc | 20.153 | -23,93 | 341 | -24,44 | ||||
| 2026-02-17 | 13F | D. E. Shaw & Co., Inc. | Call | 565.700 | -42,00 | 9.571 | -42,20 | |||
| 2026-04-17 | 13F | AdvisorNet Financial, Inc | 0 | -100,00 | 0 | |||||
| 2025-10-28 | 13F | BRYN MAWR TRUST Co | 212 | 0,00 | 4 | 50,00 | ||||
| 2026-02-17 | 13F | Northern Trust Corp | 1.218.299 | 0,94 | 20.614 | 0,53 | ||||
| 2026-01-15 | 13F | Lodestone Wealth Management LLC | 117.470 | 5,41 | 1.988 | 4,97 | ||||
| 2026-02-17 | 13F | Royal Bank Of Canada | 43.494.436 | 11,82 | 735.925 | 11,36 | ||||
| 2026-02-17 | 13F | Condire Management, LP | 1.100.000 | 0,00 | 18.612 | -0,41 | ||||
| 2025-11-14 | 13F | Truvestments Capital Llc | 0 | -100,00 | 0 | -100,00 | ||||
| 2026-04-21 | 13F | GHP Investment Advisors, Inc. | 0 | -100,00 | 0 | |||||
| 2026-02-03 | 13F | Orion Capital Management LLC | 0 | -100,00 | 0 | -100,00 | ||||
| 2025-11-04 | 13F | Compass Financial Services Inc | 0 | -100,00 | 0 | -100,00 | ||||
| 2026-02-05 | 13F | Cambridge Investment Research Advisors, Inc. | 25.716 | -28,20 | 0 | |||||
| 2026-02-02 | 13F | Principal Financial Group Inc | 104.612 | 30,48 | 1.772 | 30,20 | ||||
| 2026-02-13 | 13F | Dixon Mitchell Investment Counsel Inc. | 140 | 2 | ||||||
| 2026-02-06 | 13F | GPS Wealth Strategies Group, LLC | 0 | -100,00 | 0 | -100,00 | ||||
| 2026-02-18 | 13F | Mackenzie Financial Corp | 28.793.011 | -6,04 | 489.884 | -5,83 | ||||
| 2026-02-06 | 13F | Larson Financial Group LLC | 1.148 | -4,73 | 19 | -5,00 | ||||
| 2026-02-12 | 13F | Summit Financial, LLC | 92.501 | 0,00 | 1.565 | -0,38 | ||||
| 2025-11-13 | 13F | Css Llc/il | 0 | -100,00 | 0 | -100,00 | ||||
| 2025-11-06 | 13F | Whipplewood Advisors, LLC | 0 | -100,00 | 0 | |||||
| 2025-11-14 | 13F | Point72 Europe (London) LLP | 716.000 | 12.158 | ||||||
| 2026-02-17 | 13F | Two Sigma Securities, Llc | 10.758 | 182 | ||||||
| 2026-02-13 | 13F | First Trust Advisors Lp | 245.375 | -56,62 | 4.152 | -56,80 | ||||
| 2026-04-06 | 13F | Versant Capital Management, Inc | 59 | 2 | ||||||
| 2025-11-04 | 13F | Tejara Capital Ltd | 0 | -100,00 | 0 | -100,00 | ||||
| 2026-02-11 | 13F | Cerity Partners LLC | 66.763 | 28,79 | 1.130 | 28,30 | ||||
| 2026-02-03 | 13F | Sequoia Financial Advisors, LLC | 39.487 | 4,77 | 668 | 4,38 | ||||
| 2026-04-07 | 13F | U.S. Capital Wealth Advisors, LLC | 685.981 | -10,95 | 18.199 | 39,63 | ||||
| 2026-02-05 | 13F | Leuthold Group, Llc | 18.060 | 0,67 | 306 | 0,33 | ||||
| 2026-02-17 | 13F | Quantitative Investment Management, LLC | 27.819 | 0 | ||||||
| 2026-02-23 | 13F | Wealth Preservation Advisors, LLC | 116 | -12,12 | 2 | -50,00 | ||||
| 2026-04-15 | 13F | Bayforest Capital Ltd | 0 | -100,00 | 0 | |||||
| 2026-02-17 | 13F | Point72 Asset Management, L.P. | Call | 84.000 | -84,94 | 1.421 | -85,00 | |||
| 2026-02-17 | 13F | Interval Partners, LP | 0 | -100,00 | 0 | -100,00 | ||||
| 2026-02-17 | 13F | Point72 Asset Management, L.P. | 3.127.032 | -17,00 | 52.912 | -17,29 | ||||
| 2026-01-27 | 13F | TD Waterhouse Canada Inc. | 4.383.603 | 14,96 | 74.066 | 24,36 | ||||
| 2026-02-17 | 13F | Point72 Asset Management, L.P. | Put | 28.600 | -23,32 | 484 | -23,70 | |||
| 2026-02-17 | 13F | Lighthouse Investment Partners, LLC | 0 | -100,00 | 0 | |||||
| 2026-02-17 | 13F | Utah Retirement Systems | 140.292 | 0,00 | 2.376 | -0,25 | ||||
| 2026-02-10 | 13F | Dynasty Wealth Management, Llc | 107.071 | 5,25 | 1.812 | 4,80 | ||||
| 2026-02-13 | 13F | C M Bidwell & Associates Ltd | 7.862 | 133 | ||||||
| 2026-02-13 | 13F | Dynamic Technology Lab Private Ltd | 51.874 | -40,47 | 878 | -40,72 | ||||
| 2026-02-19 | 13F | Invesco Ltd. | 8.250.326 | -2,02 | 139.596 | -2,43 | ||||
| 2026-01-28 | 13F | DekaBank Deutsche Girozentrale | 678.918 | 0,00 | 16 | 36,36 | ||||
| 2026-02-03 | 13F | Tweedy, Browne Co LLC | 0 | -100,00 | 0 | -100,00 | ||||
| 2026-02-06 | 13F | Gables Capital Management Inc. | 1.400 | 0,00 | 24 | 0,00 | ||||
| 2026-02-17 | 13F | Laird Norton Trust Company, Llc | 104.358 | 1.766 | ||||||
| 2026-02-13 | 13F | BNP Paribas Asset Management Holding S.A. | 111.269 | 3 | ||||||
| 2026-02-19 | 13F | Atomi Financial Group, Inc. | 11.729 | 12,21 | 198 | 11,86 | ||||
| 2026-02-13 | 13F | Umb Bank N A/mo | 100 | 0,00 | 2 | 0,00 | ||||
| 2026-02-17 | 13F | Cetera Investment Advisers | 56.175 | -3,75 | 950 | -4,14 | ||||
| 2026-04-21 | 13F | Old National Bancorp /in/ | 12.597 | 5,16 | 334 | 65,35 | ||||
| 2026-04-21 | 13F | Montgomery Investment Management Inc | 58.835 | 4,07 | 1.561 | 63,18 | ||||
| 2026-04-21 | 13F | Guinness Atkinson Asset Management Inc | 20.286 | 8,14 | 536 | 69,62 | ||||
| 2026-02-10 | 13F | Nomura Asset Management Co Ltd | 0 | 0 | ||||||
| 2026-02-13 | 13F | Alberta Investment Management Corp | 5.518.825 | 996,75 | 93.367 | 992,14 | ||||
| 2026-04-15 | 13F | Financial Management Professionals, Inc. | 0 | -100,00 | 0 | |||||
| 2026-01-21 | 13F | Signature Resources Capital Management, LLC | 500 | 0,00 | 8 | 0,00 | ||||
| 2026-02-12 | 13F | Verbena Value LP | 2.412.600 | 40.821 | ||||||
| 2026-02-17 | 13F | Guardian Partners Inc. | 129.804 | 186,98 | 2.619 | 245,38 | ||||
| 2026-02-17 | 13F | Advisor Group Holdings, Inc. | 9.626 | -45,11 | 163 | -45,08 | ||||
| 2026-02-17 | 13F | Maryland State Retirement & Pension System | 287.912 | 2,78 | 4.873 | 2,50 | ||||
| 2026-02-02 | 13F | Wolverine Asset Management Llc | 392 | 7 | ||||||
| 2026-02-13 | 13F/A | Ontario Teachers Pension Plan Board | 0 | -100,00 | 0 | -100,00 | ||||
| 2025-11-14 | 13F | Spears Abacus Advisors LLC | 0 | -100,00 | 0 | -100,00 | ||||
| 2026-02-12 | 13F | Aviva Plc | 47.575 | 0,25 | 805 | 0,00 | ||||
| 2026-01-16 | 13F | FNY Investment Advisers, LLC | Call | 0 | -100,00 | 0 | ||||
| 2026-02-13 | 13F | MAI Capital Management | 469 | 55,30 | 8 | 40,00 | ||||
| 2026-02-13 | 13F | Neuberger Berman Group LLC | 531.281 | 3,04 | 8.994 | 2,69 | ||||
| 2026-04-14 | 13F | Nbc Securities, Inc. | 1.006 | -39,25 | 27 | -7,14 | ||||
| 2026-02-17 | 13F | Merewether Investment Management, LP | 2.076.591 | -70,91 | 35.136 | -71,03 | ||||
| 2026-02-12 | 13F | Quadrant Capital Group Llc | 49.875 | -0,47 | 844 | -0,94 | ||||
| 2025-11-07 | 13F | Shell Asset Management Co | 13.283 | -42,46 | 0 | |||||
| 2026-02-12 | 13F | Bank Of Montreal /can/ | Put | 174.900 | 0,00 | 2.959 | -0,37 | |||
| 2026-02-17 | 13F | Farringdon Capital, Ltd. | 48.440 | 820 | ||||||
| 2026-02-11 | 13F | Caldwell Investment Management Ltd. | 110.800 | 0,00 | 1.888 | -1,41 | ||||
| 2026-02-12 | 13F | Bank Of Montreal /can/ | 23.827.472 | 28,89 | 403.107 | 28,45 | ||||
| 2026-02-06 | 13F | Cullen/frost Bankers, Inc. | 355 | 0,57 | 6 | 20,00 | ||||
| 2026-01-30 | 13F | Mitsubishi UFJ Trust & Banking Corp | 415.200 | 6.942 | ||||||
| 2026-02-13 | 13F | Kestra Advisory Services, LLC | 2.265 | 38 | ||||||
| 2026-02-13 | 13F | Rhumbline Advisers | 345 | 0,00 | 6 | 0,00 | ||||
| 2026-02-12 | 13F | CoreCommodity Management, LLC | 25.455 | 1,00 | 431 | 0,70 | ||||
| 2026-02-13 | 13F | Walleye Capital LLC | Put | 83.600 | 216,67 | 1.415 | 215,63 | |||
| 2026-02-13 | 13F | Walleye Capital LLC | 45.198 | -33,01 | 765 | -33,33 | ||||
| 2026-02-13 | 13F | Walleye Capital LLC | Call | 31.600 | 117,93 | 535 | 117,07 | |||
| 2026-02-17 | 13F | Polar Capital Holdings Plc | 702.794 | -35,77 | 10.620 | -53,96 | ||||
| 2026-01-23 | 13F | LOM Asset Management Ltd | 850 | 20 | ||||||
| 2026-02-10 | 13F | WCG Wealth Advisors LLC | 41.208 | 697 | ||||||
| 2026-04-21 | 13F | Foundation Resource Management Inc | 505.637 | 5,04 | 13.415 | 64,71 | ||||
| 2026-02-13 | 13F | Gen-Wealth Partners Inc | 436 | 0,00 | 7 | 0,00 | ||||
| 2026-01-29 | 13F | UBS Group AG | 2.552.055 | -38,80 | 43.181 | -39,05 | ||||
| 2026-02-17 | 13F | Blackstone Group Inc | 0 | -100,00 | 0 | |||||
| 2026-04-20 | 13F | Banque Cantonale Vaudoise | 285 | 8 | ||||||
| 2026-04-17 | 13F | Vermillion Wealth Management, Inc. | 74 | 2 | ||||||
| 2026-04-23 | 13F | SJS Investment Consulting Inc. | 0 | -100,00 | 0 | |||||
| 2026-04-20 | 13F | Ronald Blue Trust, Inc. | 125 | -6,02 | 3 | 50,00 | ||||
| 2026-04-21 | 13F | Hosking Partners LLP | 816.045 | -12,17 | 21.650 | 37,71 | ||||
| 2026-02-13 | 13F | Colony Group, LLC | 0 | -100,00 | 0 | -100,00 | ||||
| 2026-02-17 | 13F | Ameriprise Financial Inc | 38.931 | 7,03 | 659 | 6,65 | ||||
| 2026-02-03 | 13F | SBI Securities Co., Ltd. | 1.136 | 135,68 | 19 | 137,50 | ||||
| 2026-02-11 | 13F | Jpmorgan Chase & Co | 6.956.486 | 22,82 | 117.704 | 22,32 | ||||
| 2026-02-13 | 13F | Toroso Investments, LLC | 36.607 | 72,92 | 619 | 72,42 | ||||
| 2026-02-17 | 13F | Bayesian Capital Management, LP | 15.900 | 269 | ||||||
| 2026-02-10 | 13F/A | Northwestern Mutual Wealth Management Co | 588.486 | 3.341,44 | 9.957 | 3.333,45 | ||||
| 2026-02-13 | 13F | Wells Fargo & Company/mn | 522.277 | 9,74 | 8.841 | 9,34 | ||||
| 2026-02-17 | 13F | Ritter Alpha, LP | 0 | -100,00 | 0 | |||||
| 2026-02-17 | 13F | Polar Asset Management Partners Inc. | 235.000 | 3.977 | ||||||
| 2026-02-11 | 13F | Capital Research Global Investors | 124.313.513 | 16,64 | 2.103.090 | 16,21 | ||||
| 2025-11-14 | 13F | Wahed Invest LLC | 0 | -100,00 | 0 | -100,00 | ||||
| 2026-04-08 | 13F | Wealth Enhancement Advisory Services, Llc | 8.399 | 223 | ||||||
| 2026-02-09 | 13F | Delta Asset Management Llc/tn | 709 | 0,00 | 12 | -8,33 | ||||
| 2025-11-13 | 13F | WealthCollab, LLC | 0 | -100,00 | 0 | -100,00 | ||||
| 2026-03-20 | 13F/A | Hsbc Holdings Plc | 0 | -100,00 | 0 | -100,00 | ||||
| 2026-02-17 | 13F | Tudor Investment Corp Et Al | Put | 0 | -100,00 | 0 | -100,00 | |||
| 2026-02-17 | 13F | Caption Management, LLC | 26.100 | 442 | ||||||
| 2026-04-14 | 13F | Drive Wealth Management, Llc | 8.733 | 232 | ||||||
| 2026-04-23 | 13F | North Star Investment Management Corp. | 2 | 0,00 | 0 | |||||
| 2026-02-03 | 13F | Crossmark Global Holdings, Inc. | 25.895 | -38,34 | 438 | -38,57 | ||||
| 2026-02-17 | 13F | Fmr Llc | 33.748.919 | -2,40 | 570.949 | -2,76 | ||||
| 2026-02-17 | 13F | Creative Planning | 456.846 | 9,80 | 7.730 | 9,34 | ||||
| 2026-02-17 | 13F | Prelude Capital Management, Llc | 11.785 | 199 | ||||||
| 2026-02-12 | 13F | Logan Capital Management Inc | 0 | -100,00 | 0 | |||||
| 2026-01-30 | 13F | Archer Investment Corp | 314 | 0,00 | 5 | 0,00 | ||||
| 2026-02-09 | 13F | Harbour Investments, Inc. | 1.281 | 0,00 | 22 | 0,00 | ||||
| 2026-02-12 | 13F | Callan Family Office, LLC | 21.912 | 371 | ||||||
| 2026-02-12 | 13F | Ensign Peak Advisors, Inc | 65.134 | 0,00 | 1.103 | -0,27 | ||||
| 2025-11-06 | 13F | Abich Financial Wealth Management LLC | 784 | 13 | ||||||
| 2026-02-11 | 13F | CoreFirst Bank & Trust | 0 | -100,00 | 0 | |||||
| 2026-04-07 | 13F | Farther Finance Advisors, LLC | 3.106 | -6,08 | 80 | 45,45 | ||||
| 2026-01-12 | 13F | AllSquare Wealth Management LLC | 500 | -66,67 | 8 | -60,00 | ||||
| 2026-02-10 | 13F | DiMeo Schneider & Associates, L.L.C. | 0 | -100,00 | 0 | |||||
| 2026-02-13 | 13F | Evelyn Partners Investment Management LLP | 2.031 | 0,00 | 34 | 0,00 | ||||
| 2026-02-12 | 13F | Qtron Investments LLC | 0 | -100,00 | 0 | |||||
| 2026-02-13 | 13F | Bank Of Nova Scotia | 4.991.723 | 26,29 | 84.444 | 25,73 | ||||
| 2026-02-17 | 13F | Amundi | 5.294.305 | 5,80 | 89.580 | 2,47 | ||||
| 2026-02-10 | 13F | Quantbot Technologies LP | 195.144 | 3.302 | ||||||
| 2026-01-20 | 13F | Ascent Group, LLC | 13.193 | -7,69 | 223 | -7,85 | ||||
| 2026-02-06 | 13F | Pnc Financial Services Group, Inc. | 82.269 | 5,02 | 1.392 | 4,59 | ||||
| 2026-02-12 | 13F | Penserra Capital Management LLC | 117 | -23,53 | 0 | |||||
| 2026-03-12 | 13F/A | Peak6 Llc | Call | 701.800 | 24,10 | 11.874 | 23,60 | |||
| 2026-02-10 | 13F | CIBC Asset Management Inc | 13.634.010 | 19,16 | 231.328 | 18,94 | ||||
| 2026-03-12 | 13F/A | Peak6 Llc | 68.222 | 1.154 | ||||||
| 2026-02-09 | 13F | Mediolanum International Funds Ltd | 137.619 | -48,99 | 2.349 | -49,61 | ||||
| 2026-03-12 | 13F/A | Peak6 Llc | Put | 161.700 | 0,00 | 2.736 | -0,44 | |||
| 2026-02-17 | 13F | Toronto Dominion Bank | 10.723.476 | 24,28 | 181.419 | 23,77 | ||||
| 2025-11-14 | 13F | Cubist Systematic Strategies, LLC | 0 | -100,00 | 0 | -100,00 | ||||
| 2026-04-23 | 13F | Kohmann Bosshard Financial Services, LLC | 2.000 | -83,33 | 53 | -73,89 | ||||
| 2026-02-11 | 13F | 111 Capital | 39.180 | 663 | ||||||
| 2026-02-17 | 13F | Toronto Dominion Bank | Put | 2.589.800 | 49,29 | 43.814 | 48,79 | |||
| 2026-02-17 | 13F | Toronto Dominion Bank | Call | 700.400 | 93,32 | 11.849 | 92,67 | |||
| 2025-11-14 | 13F | Boothbay Fund Management, Llc | 0 | -100,00 | 0 | -100,00 | ||||
| 2026-01-23 | 13F | Westside Investment Management, Inc. | 1.117 | 0,00 | 20 | 5,56 | ||||
| 2026-02-17 | 13F | Man Group plc | 54.613 | -46,80 | 925 | -46,96 | ||||
| 2026-02-10 | 13F | CIBC World Markets Inc. | 16.573.368 | 52,16 | 280.421 | 51,66 | ||||
| 2026-02-04 | 13F | Meridian Wealth Management, LLC | 21.405 | 0,00 | 362 | -0,28 | ||||
| 2026-02-10 | 13F | CIBC World Markets Inc. | Put | 300.000 | 200,00 | 5.076 | 199,12 | |||
| 2026-02-10 | 13F | Principia Wealth Advisory, LLC | 80 | 0,00 | 1 | 0,00 | ||||
| 2026-04-03 | 13F | Investors Research Corp | 0 | -100,00 | 0 | -100,00 | ||||
| 2026-02-17 | 13F | Citadel Advisors Llc | Put | 517.500 | -52,02 | 8.756 | -52,22 | |||
| 2025-11-21 | 13F/A | CIBC Bancorp USA Inc. | Call | 80.000 | 1.359 | |||||
| 2026-02-17 | 13F | Citadel Advisors Llc | Call | 835.700 | -0,84 | 14.140 | -1,25 | |||
| 2026-02-17 | 13F | Citadel Advisors Llc | 265.377 | 247,31 | 4.490 | 245,92 | ||||
| 2026-04-20 | 13F | TrueMark Investments, LLC | 0 | -100,00 | 0 | |||||
| 2026-02-13 | 13F | Mufg Securities (canada), Ltd. | 2.094.102 | 0,51 | 35.435 | 0,18 | ||||
| 2026-02-17 | 13F | Canada Pension Plan Investment Board | 8.038.441 | 67,83 | 135.992 | 67,26 | ||||
| 2026-02-17 | 13F | Yaupon Capital Management LP | 4.346.820 | 34,13 | 73.548 | 33,57 | ||||
| 2026-02-09 | 13F | Morningstar Investment Management LLC | 14.714 | 0 | ||||||
| 2026-02-18 | 13F | State of Tennessee, Treasury Department | 744.861 | 4,18 | 14.780 | 21,73 | ||||
| 2026-02-06 | 13F | Mraz, Amerine & Associates, Inc. | 363.218 | -0,92 | 6.146 | -1,33 | ||||
| 2026-04-17 | 13F | PKO Investment Management Joint-Stock Co | 46.500 | 34,78 | 1.232 | 110,79 | ||||
| 2026-04-21 | 13F | Financial Consulate, Inc | 159 | 4 | ||||||
| 2026-01-22 | 13F | Massachusetts Financial Services Co /ma/ | 17.935.599 | 24,31 | 303.470 | 23,80 | ||||
| 2026-02-13 | 13F | 1832 Asset Management L.P. | 47.679 | 155,68 | 807 | 155,06 | ||||
| 2026-02-17 | 13F | Aventail Capital Group, LP | 98.616 | -94,43 | 1.669 | -94,46 | ||||
| 2025-11-06 | 13F | Meixler Investment Management, Ltd. | Call | 0 | -100,00 | 0 | -100,00 | |||
| 2026-02-12 | 13F | Brinker Capital Investments, LLC | 37.860 | 59,43 | 641 | 58,81 | ||||
| 2026-04-24 | 13F | Keybank National Association/oh | 43.244 | 1.147 | ||||||
| 2026-04-24 | 13F | Greenfield Seitz Capital Management, LLC | 1.304.498 | -1,35 | 34.608 | 54,69 | ||||
| 2026-02-12 | 13F | Steward Partners Investment Advisory, Llc | 534 | 0,00 | 9 | 0,00 | ||||
| 2026-02-17 | 13F | DZ BANK AG Deutsche Zentral Genossenschafts Bank, Frankfurt am Main | 0 | -100,00 | 0 | |||||
| 2026-02-12 | 13F | Renaissance Technologies Llc | 5.272.694 | -4,08 | 89.214 | -4,48 | ||||
| 2026-02-13 | 13F | Kilter Group LLC | 140 | 258,97 | 2 | |||||
| 2026-02-02 | 13F | Souders Financial Advisors | 10.724 | 181 | ||||||
| 2026-02-17 | 13F | Incision Capital Management LP | 1.100.000 | 18.612 | ||||||
| 2026-04-13 | 13F | IFP Advisors, Inc | 9.801 | 102,54 | 260 | 220,99 | ||||
| 2026-01-23 | 13F | Assetmark, Inc | 178.594 | 9,13 | 3.022 | 8,67 | ||||
| 2026-02-11 | 13F | Tacita Capital Inc | 960 | 0,00 | 16 | 0,00 | ||||
| 2025-11-13 | 13F | Macquarie Group Ltd | 0 | -100,00 | 0 | -100,00 | ||||
| 2026-04-21 | 13F | PDS Planning, Inc | 8.003 | 212 | ||||||
| 2026-02-06 | 13F | Leonteq Securities AG | 3.614 | -7,57 | 61 | -7,58 | ||||
| 2025-11-14 | 13F | Point72 Asia (Singapore) Pte. Ltd. | 16.741 | 284 | ||||||
| 2026-02-13 | 13F | Great West Life Assurance Co /can/ | 211.477 | 4,86 | 4 | 0,00 | ||||
| 2026-02-05 | 13F | Allworth Financial LP | 3.459 | 14,35 | 59 | 13,73 | ||||
| 2026-02-24 | 13F/A | Pacer Advisors, Inc. | 658.116 | -19,25 | 11.134 | -19,55 | ||||
| 2025-10-31 | 13F | Whittier Trust Co Of Nevada Inc | 0 | -100,00 | 0 | -100,00 | ||||
| 2025-11-14 | 13F | Manchester Capital Management LLC | 2.000 | 0,00 | 34 | 22,22 | ||||
| 2026-04-22 | 13F | Louisbourg Investments Inc. | 225.180 | 24,69 | 5.964 | 94,97 | ||||
| 2026-02-06 | 13F | EverSource Wealth Advisors, LLC | 6.264 | 5,58 | 106 | 5,00 | ||||
| 2026-02-17 | 13F | Russell Investments Group, Ltd. | 1.204.420 | 73,37 | 20.402 | 72,91 | ||||
| 2026-02-10 | 13F | Rothschild Investment Llc | 14.500 | 245 | ||||||
| 2026-02-11 | 13F | LPL Financial LLC | 333.651 | 19,12 | 5.645 | 18,64 | ||||
| 2025-11-14 | 13F | Wetherby Asset Management Inc | 81.785 | 2,52 | 1.390 | 28,14 | ||||
| 2026-04-21 | 13F | Vise Technologies, Inc. | 37.074 | 0,00 | 627 | 0,00 | ||||
| 2026-02-11 | 13F | Capital World Investors | 112.504.009 | -27,89 | 1.903.344 | -28,16 | ||||
| 2026-02-10 | 13F | State of Wyoming | 23.850 | 96,33 | 404 | 96,12 | ||||
| 2026-02-10 | 13F | Intech Investment Management Llc | 150.545 | 16,21 | 2.550 | 15,91 | ||||
| 2026-03-09 | 13F/A | CI Private Wealth, LLC | 45.142 | 33,01 | 764 | 32,47 | ||||
| 2026-02-13 | 13F | Quarry LP | 170 | 3 | ||||||
| 2026-02-17 | 13F | Lazard Asset Management Llc | 14.851 | 251 | ||||||
| 2025-11-14 | 13F | Wolverine Trading, Llc | 49.467 | -49,82 | 854 | -36,51 | ||||
| 2025-11-06 | 13F | Meixler Investment Management, Ltd. | 0 | -100,00 | 0 | -100,00 | ||||
| 2025-11-14 | 13F | Wolverine Trading, Llc | Call | 167.400 | -11,76 | 2.891 | 11,63 | |||
| 2025-11-14 | 13F | Wolverine Trading, Llc | Put | 164.000 | -14,49 | 2.832 | 8,17 |