Grundlæggende statistik
| Institutionelle ejere | 1200 total, 1171 long only, 1 short only, 28 long/short - change of -3,22% MRQ |
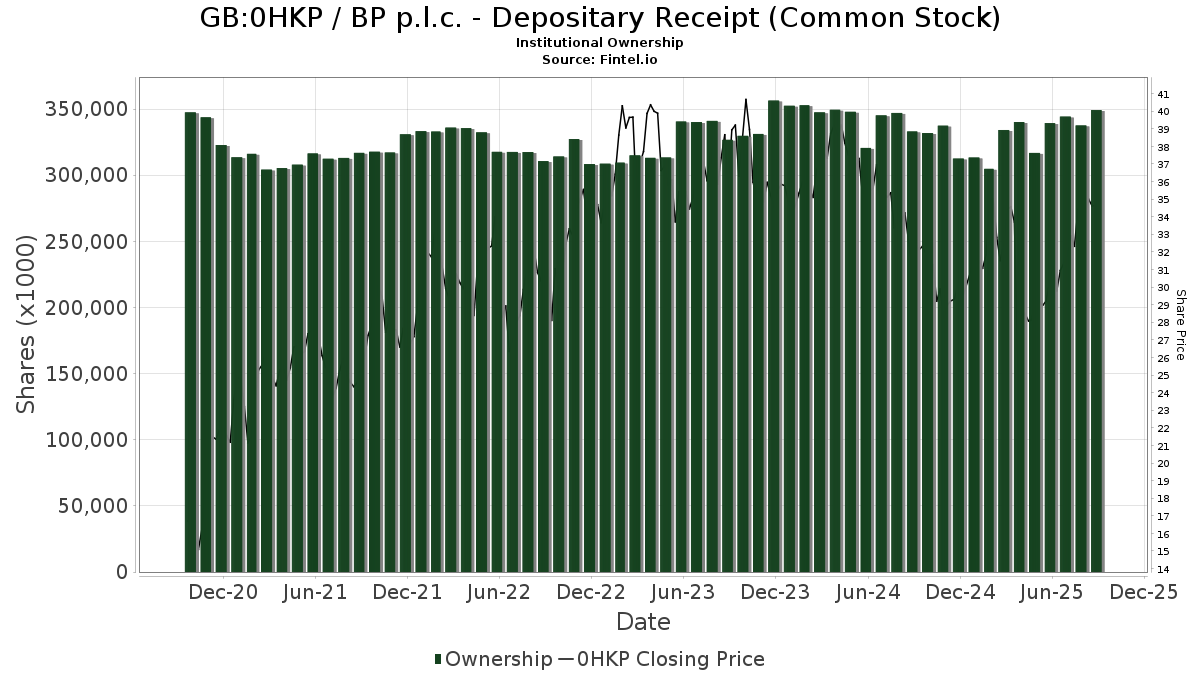
| Del pris | 39,34 |
| Gennemsnitlig porteføljeallokering | 0.1523 % - change of -41,90% MRQ |
| Institutionelle aktier (lange) | 340.649.838 (ex 13D/G) - change of 4,33MM shares 1,29% MRQ |
| Institutionel værdi (lang) | $ 11.250.017 USD ($1000) |
Institutionelt ejerskab og aktionærer
BP p.l.c. - Depositary Receipt (Common Stock) (GB:0HKP) har 1200 institutionelle ejere og aktionærer, der har indsendt 13D/G- eller 13F-formularer til Securities Exchange Commission (SEC). Disse institutioner har i alt 340,649,838 aktier. Største aktionærer omfatter Fisher Asset Management, LLC, State Street Corp, Dimensional Fund Advisors Lp, BlackRock, Inc., Caxton Associates Llp, Acadian Asset Management Llc, Goldman Sachs Group Inc, Morgan Stanley, Royal Bank Of Canada, and Norges Bank .
BP p.l.c. - Depositary Receipt (Common Stock) (LSE:0HKP) institutionel ejerskabsstruktur viser aktuelle positioner i virksomheden efter institutioner og fonde, samt seneste ændringer i positionsstørrelse. Større aktionærer kan omfatte individuelle investorer, investeringsforeninger, hedgefonde eller institutioner. Skema 13D angiver, at investoren besidder (eller besidder) mere end 5 % af virksomheden og har til hensigt (eller har til hensigt at) aktivt at forfølge en ændring i forretningsstrategi. Skema 13G indikerer en passiv investering på over 5%.
The share price as of March 5, 2026 is 39,34 / share. Previously, on March 10, 2025, the share price was 32,40 / share. This represents an increase of 21,45% over that period.
Fondens stemningsscore
Fund Sentiment Score (fka Ownership Accumulation Score) finder de aktier, der bliver mest købt af fonde. Det er resultatet af en sofistikeret, multi-faktor kvantitativ model, der identificerer virksomheder med de højeste niveauer af institutionel akkumulering. Scoringsmodellen bruger en kombination af den samlede stigning i oplyste ejere, ændringerne i porteføljeallokeringer i disse ejere og andre målinger. Tallet går fra 0 til 100, hvor højere tal indikerer et højere niveau af akkumulering for sine jævnaldrende, og 50 er gennemsnittet.
Opdateringsfrekvens: Dagligt
Se Ownership Explorer, som giver en liste over højest rangerende virksomheder.
AI+ Ask Fintel’s AI assistant about BP p.l.c. - Depositary Receipt (Common Stock).
Select a question to share a public post with an AI-crafted answer.
Thinking of good questions…
13F og NPORT arkivering
Detaljer om 13F-arkivering er gratis. Detaljer om NP-ansøgninger kræver et premium-medlemskab. Grønne rækker angiver nye positioner. Røde rækker angiver lukkede positioner. Klik på linket ikon for at se den fulde transaktionshistorik.
Opgrader
for at låse premium-data op og eksportere til Excel ![]() .
.
Important Note
In an effort to reduce load times for our mobile users, we are testing some ways to deliver lighter pages.
In this first test, we will deliver only the most recent 750 transactions (out of 1439 for this stock). If you are interested in loading *all* the transactions for this company, click the "load all" button below. This is just a test and if you don't like it, please let us know by submitting some gentle feedback via the link at the bottom of this page.
Load All| Fil dato | Kilde | Investor | Type | Gennemsnitlig pris (Øst) |
Aktier | Δ Aktier (%) |
Rapporteret Værdi ($1000) |
Δ Værdi (%) |
Port Alloc (%) |
|
|---|---|---|---|---|---|---|---|---|---|---|
| 2026-02-11 | 13F | Buckingham Strategic Partners | 45.386 | -23,88 | 1.576 | -27,00 | ||||
| 2026-02-13 | 13F | Kestra Advisory Services, LLC | 0 | -100,00 | 0 | |||||
| 2026-02-13 | 13F | Sofos Investments, Inc. | 4.937 | 0,00 | 171 | 0,59 | ||||
| 2026-02-17 | 13F | Turim 21 Investimentos Ltda. | 1.029 | 0,00 | 8 | -41,67 | ||||
| 2026-01-23 | 13F | DHJJ Financial Advisors, Ltd. | 355 | 0,00 | 12 | 0,00 | ||||
| 2026-02-05 | 13F | Pinnacle Associates Ltd | 55.572 | -0,20 | 1.930 | 0,63 | ||||
| 2026-01-08 | 13F | Wealth Enhancement Advisory Services, Llc | 277.868 | 3,49 | 9.548 | 1,68 | ||||
| 2026-02-12 | 13F | Tripletail Wealth Management, LLC | 1.842 | 0,00 | 64 | -1,56 | ||||
| 2026-02-06 | 13F | Ignite Planners, LLC | 5.562 | 211 | ||||||
| 2026-02-17 | 13F | Bulltick Wealth Management, LLC | 6.851 | 238 | ||||||
| 2026-02-12 | 13F | Principal Securities, Inc. | 13.617 | 6,05 | 473 | 6,79 | ||||
| 2026-01-16 | 13F | Louisbourg Investments Inc. | 15.680 | -20,33 | 545 | -19,76 | ||||
| 2026-01-30 | 13F | Laurel Wealth Advisors LLC | 3.119 | 108 | ||||||
| 2026-02-17 | 13F | Capital Fund Management S.a. | Put | 153.200 | -31,02 | 5.321 | -30,48 | |||
| 2026-02-06 | 13F | Insight Inv LLC | 51.646 | 23,71 | 1.794 | 24,69 | ||||
| 2026-02-17 | 13F | Summit Global Investments | 11.038 | 0 | ||||||
| 2026-02-17 | 13F | Capital Fund Management S.a. | Call | 50.200 | -57,20 | 1.743 | -56,88 | |||
| 2026-01-07 | 13F | Aventura Private Wealth, LLC | 1.352 | -12,21 | 47 | -13,21 | ||||
| 2026-02-11 | 13F | Zions Bancorporation, National Association /ut/ | 12.944 | 8.888,89 | 450 | 11.125,00 | ||||
| 2026-02-12 | 13F | Hrt Financial Lp | 146.883 | -40,08 | 5 | -37,50 | ||||
| 2026-01-05 | 13F | GAMMA Investing LLC | 6.597 | 5,16 | 229 | 6,02 | ||||
| 2026-01-16 | 13F | First Pacific Financial | 0 | -100,00 | 0 | |||||
| 2026-01-09 | 13F | Silvia Mccoll Wealth Management, Llc | 16.670 | 0,00 | 579 | 0,70 | ||||
| 2025-09-26 | NP | BLGR - Bluemonte Large Cap Growth ETF | 6 | 0 | ||||||
| 2026-01-20 | 13F | Trust Co Of Toledo Na /oh/ | 2.760 | 25,45 | 96 | 26,67 | ||||
| 2026-02-13 | 13F | William B. Walkup & Associates, Inc. | 407 | 0,00 | 14 | 0,00 | ||||
| 2026-01-28 | 13F | Proathlete Wealth Management Llc | 299 | 10 | ||||||
| 2026-02-17 | 13F | Freestone Grove Partners LP | 2.476.418 | 70,09 | 86.006 | 71,42 | ||||
| 2026-02-06 | 13F | Vestmark Advisory Solutions, Inc. | 127.594 | 100,07 | 4.431 | 101,68 | ||||
| 2026-02-05 | 13F | Intrua Financial, LLC | 27.202 | -0,87 | 945 | -0,11 | ||||
| 2026-02-09 | 13F | Northstar Financial Companies, Inc. | 31.103 | -33,15 | 1.080 | -32,63 | ||||
| 2026-02-11 | 13F | Rise Advisors, LLC | 0 | -100,00 | 0 | |||||
| 2026-02-17 | 13F | Old Mission Capital Llc | 906.324 | 192,10 | 31.477 | 194,39 | ||||
| 2026-03-04 | 13F | SHP Wealth Management | 1.406 | 49 | ||||||
| 2026-02-11 | 13F | Fox Run Management, L.l.c. | 20.966 | -1,68 | 728 | -0,82 | ||||
| 2026-02-10 | 13F | Peapack Gladstone Financial Corp | 20.592 | -6,04 | 1 | |||||
| 2026-02-17 | 13F | Private Advisor Group, LLC | 137.535 | -1,05 | 4.777 | -0,27 | ||||
| 2026-02-02 | 13F | Oppenheimer Asset Management Inc. | 0 | -100,00 | 0 | |||||
| 2026-02-17 | 13F | Palogic Value Management, L.P. | 8.558 | 0,00 | 297 | 1,02 | ||||
| 2026-02-13 | 13F | Integrated Wealth Concepts LLC | 25.654 | -27,76 | 891 | -27,23 | ||||
| 2025-10-10 | 13F | Gibson Wealth Advisors LLC | 0 | -100,00 | 0 | |||||
| 2026-02-12 | 13F | Strive Asset Management, LLC | 0 | -100,00 | 0 | |||||
| 2026-02-11 | 13F | Total Wealth Planning & Management, Inc. | Put | 11.300 | 5,61 | 392 | 22,50 | |||
| 2026-01-26 | 13F | Provenance Wealth Advisors, LLC | 260 | 0,00 | 9 | 12,50 | ||||
| 2026-02-13 | 13F | Bridgewater Associates, LP | 497.099 | 24,71 | 17.264 | 25,69 | ||||
| 2025-11-14 | 13F | Lighthouse Investment Partners, LLC | Call | 0 | -100,00 | 0 | -100,00 | |||
| 2026-01-21 | 13F | Sound Income Strategies, LLC | 5.566 | 9,03 | 197 | 12,00 | ||||
| 2026-02-11 | 13F | Flagship Wealth Advisors, Llc | 1.052 | -8,28 | 37 | -7,69 | ||||
| 2025-10-30 | 13F | Ridgewood Investments LLC | 0 | -100,00 | 0 | |||||
| 2026-01-23 | 13F | Inlight Wealth Management, LLC | 75.579 | -3,53 | 2.625 | -2,78 | ||||
| 2026-02-17 | 13F | D. E. Shaw & Co., Inc. | Call | 391.000 | -18,69 | 13.579 | -18,06 | |||
| 2026-02-04 | 13F | Nwam Llc | 6.023 | -7,92 | 221 | 1,84 | ||||
| 2026-02-17 | 13F | D. E. Shaw & Co., Inc. | Put | 270.700 | -30,82 | 9.401 | -30,28 | |||
| 2026-02-13 | 13F | Edgestream Partners, L.P. | 0 | -100,00 | 0 | |||||
| 2026-01-26 | 13F | Chicago Capital, LLC | 26.276 | -0,01 | 913 | 0,77 | ||||
| 2026-01-27 | 13F | Bayforest Capital Ltd | 202 | 7 | ||||||
| 2026-02-13 | 13F | Causeway Capital Management Llc | 1.640.680 | 3,62 | 56.981 | 4,43 | ||||
| 2026-02-10 | 13F | Lido Advisors, LLC | 23.989 | 1,36 | 828 | 1,47 | ||||
| 2026-01-06 | 13F | Nelson, Van Denburg & Campbell Wealth Management Group, LLC | 43.919 | -1,81 | 1.525 | -1,04 | ||||
| 2025-11-14 | 13F | ICONIQ Capital, LLC | 0 | -100,00 | 0 | |||||
| 2026-01-27 | 13F | Belpointe Asset Management LLC | 9.245 | -8,62 | 321 | -7,76 | ||||
| 2026-01-15 | 13F | Highline Wealth Partners Llc | 121 | 31,52 | 4 | 33,33 | ||||
| 2026-01-26 | 13F | Mountain Hill Investment Partners Corp. | 1 | 0,00 | 0 | |||||
| 2026-02-11 | 13F | Total Wealth Planning & Management, Inc. | 11.700 | 5,41 | 406 | 22,29 | ||||
| 2026-01-14 | 13F | Jfs Wealth Advisors, Llc | 1.367 | 0,00 | 47 | 0,00 | ||||
| 2026-02-11 | 13F | SOUTH STATE Corp | 93.621 | -0,48 | 3.251 | 0,31 | ||||
| 2026-01-26 | 13F | Main Street Group, LTD | 0 | -100,00 | 0 | |||||
| 2026-01-29 | 13F | Cherokee Insurance Co | 19.854 | 0,00 | 690 | 0,73 | ||||
| 2025-09-22 | NP | GSBIX - Goldman Sachs Income Builder Fund Institutional | 173.020 | -0,27 | 5.563 | 16,75 | ||||
| 2026-02-11 | 13F | XML Financial, LLC | 0 | -100,00 | 0 | |||||
| 2026-02-11 | 13F | XML Financial, LLC | Call | 0 | -100,00 | 0 | ||||
| 2026-02-17 | 13F | Integrity Wealth Advisors, Inc. | 8.127 | 282 | ||||||
| 2026-02-05 | 13F | Atria Investments Llc | 24.757 | 11,02 | 860 | 11,85 | ||||
| 2025-11-13 | 13F | Twin Tree Management, LP | 0 | -100,00 | 0 | -100,00 | ||||
| 2025-11-13 | 13F | Twin Tree Management, LP | Call | 0 | -100,00 | 0 | -100,00 | |||
| 2025-09-26 | NP | FSGEX - Fidelity Series Global ex U.S. Index Fund This fund is a listed as child fund of Fmr Llc and if that institution has disclosed ownership in this security, then these positions will not be double counted when calculating total shares and total value | 202 | 0,00 | 6 | 20,00 | ||||
| 2025-11-13 | 13F | Twin Tree Management, LP | Put | 0 | -100,00 | 0 | -100,00 | |||
| 2026-01-13 | 13F | Butensky & Cohen Financial Security, Inc | 145.949 | 3,09 | 5.069 | 3,90 | ||||
| 2026-02-06 | 13F | Motco | 3.211 | 0,00 | 112 | 0,91 | ||||
| 2026-01-28 | 13F | United Asset Strategies, Inc. | 7.051 | 0,00 | 245 | 0,83 | ||||
| 2025-11-12 | 13F | K.J. Harrison & Partners Inc | 0 | -100,00 | 0 | -100,00 | ||||
| 2026-02-17 | 13F | Integrated Advisors Network LLC | 11.183 | -24,59 | 388 | -24,07 | ||||
| 2026-02-10 | 13F | Argent Trust Co | 8.131 | -10,33 | 282 | -9,62 | ||||
| 2026-01-23 | 13F | Altfest L J & Co Inc | 5.830 | 0,28 | 202 | 1,00 | ||||
| 2026-01-09 | 13F | Silverlake Wealth Management Llc | 10.070 | -0,08 | 350 | 0,58 | ||||
| 2026-02-05 | 13F | Bessemer Group Inc | 17.011 | 0,78 | 1 | |||||
| 2026-01-16 | 13F | CRA Financial Services, LLC | 7.634 | 2,00 | 265 | 3,11 | ||||
| 2026-01-26 | 13F | JNBA Financial Advisors | 84 | 3 | ||||||
| 2026-02-17 | 13F | Balyasny Asset Management Llc | 1.264.158 | -37,20 | 43.904 | -36,71 | ||||
| 2026-02-10 | 13F | Core Wealth Advisors, Llc | 12 | 0 | ||||||
| 2026-02-13 | 13F | Dockside LLC | 85.594 | 2.973 | ||||||
| 2026-02-17 | 13F | Clear Street Markets Llc | 28.800 | -65,74 | 1.000 | -65,47 | ||||
| 2026-02-12 | 13F | CIBC Private Wealth Group, LLC | 65.087 | 10,16 | 2.260 | 11,00 | ||||
| 2026-02-17 | 13F | Balyasny Asset Management Llc | Call | 178.200 | 6.189 | |||||
| 2026-02-17 | 13F | Balyasny Asset Management Llc | Put | 439.600 | 1.716,53 | 15.267 | 1.732,77 | |||
| 2026-01-14 | 13F | Mitchell & Pahl Private Wealth, Llc | 24.879 | -0,26 | 864 | 0,58 | ||||
| 2026-01-08 | 13F | Ulland Investment Advisors, LLC | 739 | 0,00 | 0 | |||||
| 2026-01-06 | 13F | Ransom Advisory, Ltd | 3.872 | 0,00 | 134 | 0,75 | ||||
| 2025-09-25 | NP | Dfa Investment Dimensions Group Inc - Va International Value Portfolio This fund is a listed as child fund of Dimensional Fund Advisors Lp and if that institution has disclosed ownership in this security, then these positions will not be double counted when calculating total shares and total value | 76.714 | 39,39 | 2.466 | 63,20 | ||||
| 2026-01-20 | 13F | AdvisorNet Financial, Inc | 8.828 | -1,36 | 307 | -0,65 | ||||
| 2026-02-05 | 13F | Bank Julius Baer & Co. Ltd, Zurich | 17.766 | -10,45 | 617 | -9,66 | ||||
| 2026-02-17 | 13F | Quantinno Capital Management LP | 227.001 | 39,56 | 7.884 | 40,64 | ||||
| 2026-02-17 | 13F | Qube Research & Technologies Ltd | Put | 198.000 | -31,11 | 6.877 | -30,57 | |||
| 2025-09-26 | NP | SUNAMERICA SERIES TRUST - SA Goldman Sachs Multi-Asset Insights Portfolio Class 1 | 280 | -88,09 | 9 | -85,94 | ||||
| 2026-02-13 | 13F | Headlands Technologies LLC | 21.039 | 17,22 | 731 | 18,12 | ||||
| 2026-02-17 | 13F | Qube Research & Technologies Ltd | Call | 361.400 | -18,25 | 12.551 | -17,61 | |||
| 2025-09-26 | NP | IENAX - INVESCO Energy Fund Class A | 511.486 | 0,00 | 16.444 | 17,08 | ||||
| 2026-02-17 | 13F | Qube Research & Technologies Ltd | 2.384.771 | 693,40 | 82.823 | 699,68 | ||||
| 2025-11-04 | 13F | Flaharty Asset Management, LLC | 0 | -100,00 | 0 | |||||
| 2025-11-12 | 13F | NewSquare Capital LLC | 0 | -100,00 | 0 | -100,00 | ||||
| 2026-01-12 | 13F | Optivise Advisory Services LLC | 6.120 | 0,02 | 213 | 0,95 | ||||
| 2026-02-17 | 13F | Perritt Capital Management Inc | 0 | -100,00 | 0 | |||||
| 2026-02-17 | 13F | DZ BANK AG Deutsche Zentral Genossenschafts Bank, Frankfurt am Main | 0 | -100,00 | 0 | |||||
| 2026-02-13 | 13F | AlTi Global, Inc. | 12.787 | 0,00 | 444 | 0,91 | ||||
| 2026-01-20 | 13F | Partners Wealth Management, Llc | 19.776 | -2,47 | 687 | -1,72 | ||||
| 2026-01-28 | 13F | Cranbrook Wealth Management, LLC | 82 | 0,00 | 3 | 0,00 | ||||
| 2026-02-17 | 13F | Creative Planning | 319.621 | 19,04 | 11.100 | 19,97 | ||||
| 2026-01-08 | 13F | True Wealth Design, LLC | 311 | 0,97 | 11 | 0,00 | ||||
| 2026-02-17 | 13F | SummitTX Capital, L.P. | 69.280 | 2.406 | ||||||
| 2026-01-14 | 13F | Nova Wealth Management, Inc. | 80 | 0,00 | 3 | 0,00 | ||||
| 2026-02-13 | 13F | NLB Skladi, upravljanje premozenja, d.o.o. | 6.900 | 240 | ||||||
| 2026-02-09 | 13F | Key FInancial Inc | 3.079 | 1,65 | 107 | 1,92 | ||||
| 2026-02-17 | 13F | IHT Wealth Management, LLC | 12.409 | -1,71 | 431 | -1,15 | ||||
| 2026-02-13 | 13F | Level Four Advisory Services, Llc | 8.387 | 21,08 | 291 | 22,27 | ||||
| 2026-02-04 | 13F | HighPoint Advisor Group LLC | 78.035 | -1,65 | 2.710 | -0,88 | ||||
| 2026-02-17 | 13F | Tannin Capital LLC | 11.845 | 411 | ||||||
| 2026-01-13 | 13F | Parsons Capital Management Inc/ri | 17.865 | -23,33 | 620 | -22,69 | ||||
| 2026-01-20 | 13F | Red Door Wealth Management, LLC | 16.271 | -6,33 | 565 | -5,52 | ||||
| 2026-01-22 | 13F | Richardson Financial Services Inc. | 100 | 0,00 | 25 | 733,33 | ||||
| 2026-01-20 | 13F | Stratos Wealth Partners, LTD. | 34.316 | -14,06 | 1.192 | -13,44 | ||||
| 2026-02-13 | 13F | Transamerica Financial Advisors, Inc. | 580 | 20 | ||||||
| 2026-02-03 | 13F | Asset Planning,Inc | 200 | 0,00 | 7 | 0,00 | ||||
| 2026-02-04 | 13F | BCJ Capital Management, LLC | 119.394 | 4.147 | ||||||
| 2026-02-17 | 13F | XTX Topco Ltd | 90.240 | 441,85 | 3.134 | 446,95 | ||||
| 2026-02-10 | 13F | Holderness Investments Co | 8.885 | -27,57 | 309 | -27,01 | ||||
| 2025-11-14 | 13F | Strategic Wealth Partners, Ltd. | 193 | -13,06 | 7 | 0,00 | ||||
| 2026-02-13 | 13F | Morgan Stanley | 9.187.111 | -3,82 | 319.068 | -3,07 | ||||
| 2026-02-10 | 13F | Grandfield & Dodd, Llc | 12.605 | -25,71 | 438 | -25,17 | ||||
| 2026-02-13 | 13F | Williams Jones Wealth Management, LLC. | 10.970 | -12,03 | 381 | -11,42 | ||||
| 2025-10-23 | 13F | Venturi Wealth Management, LLC | 0 | -100,00 | 0 | |||||
| 2026-01-09 | 13F | Keb Asset Management, Llc | 9.612 | -5,71 | 334 | -5,13 | ||||
| 2026-01-22 | 13F | City Holding Co | 4.283 | -0,93 | 149 | 0,00 | ||||
| 2026-01-29 | 13F | Dupree Financial Group, LLC | 391.352 | 0,28 | 13.592 | 1,06 | ||||
| 2026-02-10 | 13F | Bank of New York Mellon Corp | 358.403 | -12,65 | 12.447 | -11,97 | ||||
| 2026-01-28 | 13F | Retirement Planning Co of New England, Inc. | 8.609 | 0,54 | 299 | 1,02 | ||||
| 2026-02-12 | 13F | Dimensional Fund Advisors Lp | 16.484.085 | 7,83 | 572.493 | 8,67 | ||||
| 2026-02-04 | 13F | Liberty Wealth Management Llc | 7.187 | 0,03 | 250 | 1,22 | ||||
| 2025-11-12 | 13F | Park Square Financial Group, LLC | 0 | -100,00 | 0 | |||||
| 2026-02-05 | 13F | AlphaCore Capital LLC | 14.101 | 490 | ||||||
| 2026-01-12 | 13F | Daymark Wealth Partners, Llc | 14.684 | 10,37 | 510 | 11,14 | ||||
| 2026-02-11 | 13F | Tradition Wealth Management, LLC | 6.550 | 0,06 | 227 | 0,89 | ||||
| 2025-10-22 | 13F | Kiley Juergens Wealth Management, Llc | 0 | -100,00 | 0 | |||||
| 2026-01-21 | 13F | Clayton Financial Group LLC | 206 | 0,00 | 7 | 0,00 | ||||
| 2026-02-03 | 13F | Wesbanco Bank Inc | 22.683 | -4,57 | 788 | -3,91 | ||||
| 2025-10-15 | 13F | Mb, Levis & Associates, Llc | 0 | -100,00 | 0 | -100,00 | ||||
| 2026-01-15 | 13F | Allspring Global Investments Holdings, LLC | 20.147 | 36,91 | 717 | 43,40 | ||||
| 2026-02-05 | 13F | CMG Global Holdings, LLC | 5.120 | 201 | ||||||
| 2026-02-17 | 13F | Trexquant Investment LP | 86.238 | -70,34 | 2.995 | -70,10 | ||||
| 2026-01-21 | 13F | Sowell Financial Services LLC | 14.691 | -1,57 | 510 | -0,78 | ||||
| 2026-02-03 | 13F | McIlrath & Eck, LLC | 2.640 | 1,15 | 92 | 2,25 | ||||
| 2026-02-10 | 13F | Savant Capital, LLC | 33.749 | -4,26 | 1.172 | -3,46 | ||||
| 2026-01-23 | 13F | Monarch Capital Management Inc/ | 17.305 | 0,00 | 601 | 0,84 | ||||
| 2026-02-03 | 13F | Manske Wealth Management | 29.031 | -2,38 | 1.008 | -1,56 | ||||
| 2026-02-11 | 13F | Tiaa Trust, National Association | 21.603 | 0,92 | 750 | 1,76 | ||||
| 2026-02-17 | 13F | Blair William & Co/il | 228.648 | -2,70 | 7.941 | -1,95 | ||||
| 2026-01-21 | 13F | Portside Wealth Group, LLC | 6.341 | 220 | ||||||
| 2026-02-10 | 13F | New Republic Capital, LLC | 7.228 | 251 | ||||||
| 2026-02-10 | 13F | Foundations Investment Advisors, LLC | 12.757 | -17,15 | 443 | -16,42 | ||||
| 2026-01-22 | 13F | Willis Johnson & Associates, Inc. | 321.246 | -4,13 | 11.157 | -3,39 | ||||
| 2026-01-20 | 13F | Sanibel Captiva Trust Company, Inc. | 51.810 | -3,49 | 1.799 | -2,76 | ||||
| 2026-02-13 | 13F | Pinney & Scofield, Inc. | 3.010 | 0,00 | 105 | 0,97 | ||||
| 2026-02-12 | 13F | Great Valley Advisor Group, Inc. | 27.754 | 26,25 | 964 | 27,21 | ||||
| 2026-02-17 | 13F | LaSalle St. Investment Advisors, LLC | 7.815 | 27,09 | 0 | |||||
| 2026-01-28 | 13F | Chicago Partners Investment Group LLC | 11.950 | 2,59 | 437 | 8,73 | ||||
| 2026-02-17 | 13F | Laird Norton Trust Company, Llc | 41.328 | 1.435 | ||||||
| 2026-02-02 | 13F | Robertson Stephens Wealth Management, LLC | 6.422 | 8,44 | 223 | 9,31 | ||||
| 2026-02-11 | 13F | Vise Technologies, Inc. | 54.846 | 18,09 | 1.905 | 19,00 | ||||
| 2026-01-26 | 13F | Private Trust Co Na | 4.273 | -17,86 | 148 | -17,32 | ||||
| 2026-02-12 | 13F | Advocate Investing Services LLC | 11.310 | 393 | ||||||
| 2026-02-12 | 13F | McMillan Office, Inc. | 176 | 6 | ||||||
| 2026-02-17 | 13F | WFA of San Diego, LLC | 0 | -100,00 | 0 | |||||
| 2025-09-25 | NP | DFIV - Dimensional International Value ETF | 2.831.396 | 34,99 | 91.029 | 58,04 | ||||
| 2026-01-16 | 13F | Ronald Blue Trust, Inc. | 18.667 | -4,62 | 648 | -3,86 | ||||
| 2026-02-09 | 13F | King Wealth | 21.600 | -0,88 | 1 | |||||
| 2026-02-10 | 13F | Natixis Advisors, L.p. | 1.846.770 | -1,72 | 64 | 0,00 | ||||
| 2026-02-12 | 13F | Benson Wealth Management INC | 206 | 7 | ||||||
| 2026-02-13 | 13F | Victory Capital Management Inc | 59.077 | 0,00 | 2.052 | 0,79 | ||||
| 2026-01-08 | 13F | Adirondack Trust Co | 842 | -19,35 | 29 | -17,14 | ||||
| 2026-01-09 | 13F | Community Trust & Investment Co | 99.396 | -1,00 | 3.452 | -0,20 | ||||
| 2026-02-03 | 13F | Patten & Patten Inc/tn | 0 | -100,00 | 0 | |||||
| 2026-01-28 | 13F | DekaBank Deutsche Girozentrale | 29.626 | 0,00 | 1 | 0,00 | ||||
| 2026-01-09 | 13F | Dynamic Advisor Solutions LLC | 16.545 | -10,90 | 575 | -10,17 | ||||
| 2026-02-12 | 13F | StoneX Group Inc. | 8.275 | -67,00 | 287 | -66,78 | ||||
| 2026-02-05 | 13F | Roberts Glore & Co Inc /il/ | 10.352 | 0,00 | 360 | 0,84 | ||||
| 2026-02-13 | 13F | Pitti Group Wealth Management, LLC | 0 | -100,00 | 0 | |||||
| 2026-02-17 | 13F | Limestone Investment Advisors LP | Call | 9.300 | 57,63 | 323 | 58,62 | |||
| 2026-02-17 | 13F | Limestone Investment Advisors LP | Put | 5.100 | -75,36 | 177 | -75,18 | |||
| 2026-01-27 | 13F | Forum Financial Management, LP | 26.362 | 0,24 | 916 | 0,99 | ||||
| 2026-02-03 | 13F | Farmers & Merchants Investments Inc | 664 | 0,00 | 23 | 4,55 | ||||
| 2026-01-15 | 13F | Nilsine Partners, LLC | 20.151 | -2,22 | 700 | -1,55 | ||||
| 2026-02-09 | 13F | First National Trust Co | 33.970 | 0,00 | 1.180 | 0,77 | ||||
| 2026-01-16 | 13F | Sentry LLC | 12.920 | 0,00 | 449 | 0,67 | ||||
| 2026-01-13 | 13F | Stephens Consulting, LLC | 226 | 8 | ||||||
| 2026-01-26 | 13F | Valmark Advisers, Inc. | 0 | -100,00 | 0 | |||||
| 2026-01-29 | 13F | Schnieders Capital Management, Llc. | 7.712 | 0,00 | 268 | 0,75 | ||||
| 2026-02-17 | 13F | Summit Trail Advisors, Llc | 0 | -100,00 | 0 | |||||
| 2026-01-12 | 13F | Brucke Financial, Inc. | 14.070 | -10,06 | 489 | -11,11 | ||||
| 2025-11-10 | 13F | Raiffeisen Bank International AG | 0 | -100,00 | 0 | -100,00 | ||||
| 2026-02-13 | 13F | Umb Bank N A/mo | 39.821 | 1,86 | 1.383 | 2,60 | ||||
| 2025-09-25 | NP | HFCVX - Hennessy Cornerstone Value Fund Investor Class | 172.700 | 0,00 | 5.552 | 17,08 | ||||
| 2026-02-09 | 13F | Hartland & Co., LLC | 11.717 | 0,09 | 407 | 0,74 | ||||
| 2026-02-17 | 13F | Ancora Advisors, LLC | 4.102 | 5,75 | 142 | 6,77 | ||||
| 2026-01-23 | 13F | Northland Securities, Inc. | 6.858 | 238 | ||||||
| 2025-10-30 | 13F | Traub Capital Management LLC | 0 | -100,00 | 0 | |||||
| 2026-01-23 | 13F | RFG - Bristol Wealth Advisors, LLC | 51.466 | 0,00 | 1.787 | 0,79 | ||||
| 2026-01-27 | 13F | Hedges Asset Management LLC | 75.067 | 0,28 | 2.607 | 1,09 | ||||
| 2026-02-03 | 13F | Sigma Investment Counselors Inc | 8.229 | 0,00 | 286 | 0,71 | ||||
| 2026-02-04 | 13F | Meridian Wealth Management, LLC | 26.851 | 0,13 | 933 | 0,87 | ||||
| 2026-02-02 | 13F | Avidian Wealth Solutions, LLC | 27.549 | -3,82 | 957 | -3,14 | ||||
| 2026-02-03 | 13F | RFG Advisory, LLC | 6.469 | -2,93 | 225 | -2,18 | ||||
| 2026-01-28 | 13F | Salomon & Ludwin, LLC | 3.090 | -1,65 | 112 | 3,74 | ||||
| 2026-01-12 | 13F | Abound Wealth Management | 218 | 808,33 | 8 | |||||
| 2026-02-11 | 13F | Coastwise Capital Group, LLC | 15.747 | 0,41 | 547 | 1,11 | ||||
| 2026-02-13 | 13F | Cornerstone Financial Management LLC | 121 | 4 | ||||||
| 2026-02-17 | 13F | American Trust Investment Advisors, LLC | 11.560 | -2,41 | 401 | -1,72 | ||||
| 2026-01-29 | 13F | Courier Capital Llc | 16.374 | -0,15 | 569 | 0,53 | ||||
| 2026-02-14 | 13F | Rockefeller Capital Management L.P. | 637.200 | -29,21 | 22.130 | -28,66 | ||||
| 2026-01-09 | 13F | Hardin Capital Partners, LLC | 43.932 | 0,06 | 1.526 | 0,86 | ||||
| 2026-02-17 | 13F | Cape Investment Advisory, Inc. | 5.016 | 241,22 | 174 | 248,00 | ||||
| 2026-02-06 | 13F | Tanglewood Legacy Advisors, LLC | 100 | 0,00 | 3 | 0,00 | ||||
| 2026-02-05 | 13F | Cambridge Investment Research Advisors, Inc. | 510.335 | 0,99 | 18 | 0,00 | ||||
| 2026-02-09 | 13F | Smithfield Trust Co | 1.835 | 8,20 | 0 | |||||
| 2026-02-13 | 13F | American Century Companies Inc | 1.714.281 | 13,99 | 59.537 | 14,88 | ||||
| 2026-01-16 | 13F | PFS Partners, LLC | 500 | 0,00 | 17 | 0,00 | ||||
| 2026-02-13 | 13F | Wilkerson Advisory Group LLC | 149 | 5 | ||||||
| 2026-02-17 | 13F | Point72 Asset Management, L.P. | Put | 154.000 | 5.400,00 | 5.348 | 5.470,83 | |||
| 2026-02-10 | 13F | Envestnet Asset Management Inc | 967.036 | -10,53 | 33.585 | -9,83 | ||||
| 2026-02-11 | 13F | Group One Trading, L.p. | 2.370 | -82,48 | 82 | -82,40 | ||||
| 2026-02-12 | 13F | Insigneo Advisory Services, Llc | 20.513 | -1,20 | 712 | -0,42 | ||||
| 2026-02-17 | 13F | Jain Global LLC | 12.922 | 449 | ||||||
| 2025-11-14 | 13F | Point72 Hong Kong Ltd | 20.723 | 714 | ||||||
| 2026-02-17 | 13F | Point72 Asset Management, L.P. | Call | 52.200 | 357,89 | 1.813 | 362,24 | |||
| 2026-03-05 | 13F | Gunpowder Capital Management, LLC dba Oliver Wealth Management | 113 | 4 | ||||||
| 2026-02-17 | 13F | Point72 Asset Management, L.P. | 1.529.195 | -67,69 | 53.109 | -67,44 | ||||
| 2026-02-19 | 13F | CI Private Wealth, LLC | 185.266 | 5,37 | 5.448 | -10,09 | ||||
| 2026-02-05 | 13F | Beese Fulmer Investment Management, Inc. | 16.043 | 15,40 | 557 | 16,28 | ||||
| 2026-01-20 | 13F | Analyst IMS Investment Management Services Ltd. | 16.167 | 0,00 | 1 | |||||
| 2026-02-10 | 13F | Easterly Investment Partners Llc | 0 | -100,00 | 0 | |||||
| 2026-02-04 | 13F | Ameritas Advisory Services, LLC | 19.001 | 240,46 | 660 | 243,23 | ||||
| 2026-02-17 | 13F | Citadel Advisors Llc | 2.562.882 | -63,43 | 89.009 | -63,14 | ||||
| 2026-02-17 | 13F | Css Llc/il | 19.223 | -51,92 | 668 | -51,56 | ||||
| 2026-02-13 | 13F | Alyeska Investment Group, L.P. | 1.228.021 | -5,80 | 42.649 | -5,07 | ||||
| 2026-02-17 | 13F | Citadel Advisors Llc | Call | 2.281.300 | -14,46 | 79.230 | -13,78 | |||
| 2026-02-13 | 13F | Motiv8 Investments LLC | 278 | 0 | ||||||
| 2026-02-17 | 13F | Citadel Advisors Llc | Put | 2.342.300 | 6,29 | 81.348 | 7,13 | |||
| 2026-02-02 | 13F | New England Capital Financial Advisors LLC | 2.002 | 0,00 | 70 | 0,00 | ||||
| 2026-02-13 | 13F | Baird Financial Group, Inc. | 241.260 | 2,20 | 8.379 | 2,99 | ||||
| 2026-02-17 | 13F | Quadrature Capital Ltd | 116.316 | 4.040 | ||||||
| 2026-02-12 | 13F | Ankerstar Wealth, LLC | 748 | 26 | ||||||
| 2025-11-06 | 13F | MidWestOne Financial Group, Inc. | 0 | -100,00 | 0 | -100,00 | ||||
| 2026-01-12 | 13F | Kozak & Associates, Inc. | 557 | 0,91 | 19 | -5,00 | ||||
| 2026-01-16 | 13F | Crewe Advisors LLC | 8.489 | -10,08 | 295 | -9,54 | ||||
| 2026-02-17 | 13F | Schonfeld Strategic Advisors LLC | Put | 400.000 | 13.892 | |||||
| 2026-02-17 | 13F | Schonfeld Strategic Advisors LLC | 45.500 | -54,86 | 1.580 | -54,51 | ||||
| 2026-02-13 | 13F | First Trust Advisors Lp | 148.527 | 12,11 | 5.158 | 12,99 | ||||
| 2026-02-17 | 13F | Schonfeld Strategic Advisors LLC | Call | 212.200 | 7.370 | |||||
| 2026-01-20 | 13F | Ntv Asset Management Llc | 10.499 | 365 | ||||||
| 2026-02-02 | 13F | Mutual Advisors, LLC | 52.805 | -8,32 | 1.834 | -9,03 | ||||
| 2026-02-06 | 13F | Americana Partners, LLC | 262.644 | -0,33 | 9.122 | 0,44 | ||||
| 2026-01-26 | 13F | Keystone Wealth Services, LLC | 0 | -100,00 | 0 | |||||
| 2026-02-05 | 13F | Avantax Planning Partners, Inc. | 6.401 | 4,15 | 222 | 5,21 | ||||
| 2026-02-13 | 13F | Y-Intercept (Hong Kong) Ltd | 372.202 | 228,83 | 12.927 | 231,44 | ||||
| 2026-02-11 | 13F | Sunrise Financial Services, LLC | 107 | 4 | ||||||
| 2026-02-04 | 13F | Pensionmark Financial Group, Llc | 26.191 | 53,67 | 606 | 3,07 | ||||
| 2026-02-10 | 13F | Operose Advisors LLC | 0 | -100,00 | 0 | |||||
| 2026-02-17 | 13F | Two Sigma Advisers, Lp | 168.826 | 585,56 | 5.863 | 591,39 | ||||
| 2026-02-06 | 13F | Hudson Valley Investment Advisors Inc /adv | 0 | -100,00 | 0 | |||||
| 2026-01-21 | 13F | Newbridge Financial Services Group, Inc. | 9.255 | 0,10 | 321 | 0,94 | ||||
| 2026-02-13 | 13F | Van Eck Associates Corp | 287.228 | 445,29 | 10 | 800,00 | ||||
| 2026-02-13 | 13F | Jacobi Capital Management LLC | 8.326 | -1,64 | 289 | -0,69 | ||||
| 2026-01-26 | 13F | Yoffe Investment Management, LLC | 6.363 | 0,00 | 221 | 0,46 | ||||
| 2026-02-05 | 13F | Western Wealth Management, LLC | 20.067 | 7,67 | 697 | 8,41 | ||||
| 2025-11-10 | 13F | Avalon Trust Co | 0 | -100,00 | 0 | |||||
| 2026-02-17 | 13F | Advisor Group Holdings, Inc. | 351.859 | 3,22 | 12.220 | 2,59 | ||||
| 2026-02-20 | 13F | Sunbelt Securities, Inc. | 7.133 | -13,89 | 248 | -13,33 | ||||
| 2025-11-12 | 13F | Transce3nd, LLC | 0 | -100,00 | 0 | |||||
| 2026-01-21 | 13F | Baker Ellis Asset Management LLC | 108.799 | 2,03 | 3.779 | 2,83 | ||||
| 2026-02-06 | 13F | Creative Financial Designs Inc /adv | 7.233 | 0,00 | 251 | 0,80 | ||||
| 2026-02-13 | 13F | Healthcare Of Ontario Pension Plan Trust Fund | 5.750.000 | 0,00 | 199.698 | 0,78 | ||||
| 2026-01-12 | 13F | Asset Allocation & Management Company, LLC | 8.400 | 0,00 | 0 | |||||
| 2025-11-13 | 13F | Wells Fargo & Company/mn | Call | 0 | -100,00 | 0 | -100,00 | |||
| 2026-02-02 | 13F | Oppenheimer & Co Inc | 0 | -100,00 | 0 | |||||
| 2026-01-12 | 13F | CVA Family Office, LLC | 54 | 0,00 | 2 | 0,00 | ||||
| 2026-01-20 | 13F | Independence Bank of Kentucky | 14.874 | -16,37 | 517 | -15,69 | ||||
| 2026-01-15 | 13F | Acima Private Wealth, Llc | 1.058 | 0,00 | 37 | 0,00 | ||||
| 2026-02-13 | 13F | Ausdal Financial Partners, Inc. | 36.974 | 0,21 | 1.284 | 1,02 | ||||
| 2026-02-17 | 13F | Farringdon Capital, Ltd. | 0 | -100,00 | 0 | |||||
| 2026-02-17 | 13F | Titan Wealth (CI) Ltd | 12.000 | 417 | ||||||
| 2026-01-26 | 13F | AE Wealth Management LLC | 28.650 | 26,69 | 995 | 27,73 | ||||
| 2026-02-12 | 13F | Triumph Capital Management | 1.470 | 17,13 | 51 | 18,60 | ||||
| 2026-01-05 | 13F | Roxbury Financial LLC | 76 | -87,56 | 3 | -90,48 | ||||
| 2026-01-14 | 13F | Woodstock Corp | 0 | -100,00 | 0 | |||||
| 2026-02-23 | 13F | Mv Capital Management, Inc. | 176 | 20,55 | 6 | 50,00 | ||||
| 2026-02-10 | 13F | Sound Shore Management Inc /ct/ | 1.954.785 | 67.890 | ||||||
| 2026-01-27 | 13F | GHP Investment Advisors, Inc. | 569 | 0,35 | 20 | 0,00 | ||||
| 2026-01-23 | 13F | BSW Wealth Partners | 10.113 | 0,00 | 351 | 0,86 | ||||
| 2026-01-27 | 13F | Davidson Trust Co | 9.820 | 0,00 | 341 | 0,89 | ||||
| 2026-01-13 | 13F | Team Financial Group, LLC | 11 | 0,00 | 0 | |||||
| 2026-02-13 | 13F | Alerus Financial Na | 144 | -62,40 | 5 | -61,54 | ||||
| 2026-01-22 | 13F | Financial Consulate, Inc | 259 | -56,83 | 9 | -60,00 | ||||
| 2026-02-13 | 13F | Pathstone Holdings, LLC | 322.167 | 3,54 | 11.189 | 4,36 | ||||
| 2025-11-13 | 13F | Wells Fargo & Company/mn | Put | 0 | -100,00 | 0 | -100,00 | |||
| 2026-02-09 | 13F | Frazier Financial Advisors, LLC | 153 | 0,00 | 5 | 0,00 | ||||
| 2025-11-12 | 13F | Creekmur Asset Management LLC | 3.102 | 62,75 | 107 | 85,96 | ||||
| 2026-02-17 | 13F | Jones Financial Companies Lllp | 152.310 | 19,19 | 5.290 | 16,17 | ||||
| 2026-01-21 | 13F | Flagship Harbor Advisors, Llc | 640 | 22 | ||||||
| 2026-02-04 | 13F | Tsfg, Llc | 4.347 | 3,85 | 0 | |||||
| 2026-01-22 | 13F | tru Independence LLC | 113.240 | -0,45 | 3.933 | 0,33 | ||||
| 2026-02-03 | 13F | Costello Asset Management, INC | 0 | -100,00 | 0 | |||||
| 2026-02-23 | 13F | Wealth Preservation Advisors, LLC | 201 | 0,00 | 7 | 0,00 | ||||
| 2026-02-04 | 13F | Paradigm Asset Management Co Llc | 2.600 | 0,00 | 90 | 1,12 | ||||
| 2026-01-22 | 13F | Personal Cfo Solutions, Llc | 16.493 | -4,47 | 573 | -3,70 | ||||
| 2026-02-05 | 13F | Hills Bank & Trust Co | 4.988 | 0,00 | 173 | 1,17 | ||||
| 2026-02-12 | 13F | SWAN Capital LLC | 106 | 0,00 | 4 | 0,00 | ||||
| 2025-10-14 | 13F | Fiduciary Advisors, Inc. | 0 | -100,00 | 0 | |||||
| 2026-02-04 | 13F | Clark Wealth Partners | 12 | 0,00 | 0 | |||||
| 2026-01-28 | 13F | WP Advisors, LLC | 8.350 | 1,31 | 290 | 2,11 | ||||
| 2026-02-11 | 13F | West Family Investments, Inc. | 15.115 | 1,41 | 525 | 2,14 | ||||
| 2025-09-23 | NP | GCIIX - Goldman Sachs International Equity Insights Fund Institutional | 146.574 | -44,33 | 4.712 | -34,83 | ||||
| 2025-09-26 | NP | BVAL - Bluemonte Large Cap Value ETF | 4 | 0 | ||||||
| 2026-02-12 | 13F | JPL Wealth Management, LLC | 0 | -100,00 | 0 | |||||
| 2026-02-17 | 13F | Cresset Asset Management, LLC | 51.881 | 50,97 | 1.802 | 52,11 | ||||
| 2026-02-13 | 13F | Aviso Financial Inc. | 0 | -100,00 | 0 | |||||
| 2026-02-10 | 13F | Godfrey Financial Associates, Inc. | 13 | 0 | ||||||
| 2026-02-24 | 13F | SG Trading Solutions, LLC | 10.250 | 0 | ||||||
| 2025-09-26 | NP | RFDI - First Trust RiverFront Dynamic Developed International ETF This fund is a listed as child fund of First Trust Advisors Lp and if that institution has disclosed ownership in this security, then these positions will not be double counted when calculating total shares and total value | 30.818 | 3,12 | 991 | 20,73 | ||||
| 2025-10-31 | 13F | Ping Capital Management, Inc. | 0 | -100,00 | 0 | |||||
| 2026-01-14 | 13F | Goelzer Investment Management, Inc. | 7.074 | 6,23 | 246 | 6,99 | ||||
| 2026-02-02 | 13F | CX Institutional | 2.652 | -29,19 | 0 | |||||
| 2026-02-17 | 13F | Equitable Holdings, Inc. | 20.634 | 12,46 | 717 | 13,29 | ||||
| 2026-02-09 | 13F | Wellington Shields Capital Management, LLC | 5.551 | -20,13 | 193 | -19,67 | ||||
| 2026-02-05 | 13F | High Note Wealth, LLC | 268 | 0,00 | 9 | 0,00 | ||||
| 2026-02-13 | 13F | Citigroup Inc | 126.737 | 4,46 | 4.402 | 5,26 | ||||
| 2025-11-18 | 13F | Pictet Asset Management Holding SA | 0 | -100,00 | 0 | |||||
| 2025-11-12 | 13F | Maseco Llp | 0 | -100,00 | 0 | |||||
| 2026-02-13 | 13F | Citigroup Inc | Call | 94.100 | -5,14 | 3.268 | -4,39 | |||
| 2026-02-13 | 13F | Citigroup Inc | Put | 275.000 | 266,67 | 9.551 | 269,58 | |||
| 2026-02-10 | 13F | Sarver Vrooman Wealth Advisors | 261 | 9 | ||||||
| 2026-02-04 | 13F | Boston Private Wealth Llc | 15.947 | -1,54 | 554 | -0,90 | ||||
| 2026-01-12 | 13F | Moody National Bank Trust Division | 26.537 | 3,59 | 922 | 4,42 | ||||
| 2026-01-13 | 13F | Kathmere Capital Management, LLC | 11.228 | 12,88 | 390 | 13,74 | ||||
| 2026-01-26 | 13F | BCS Private Wealth Management, Inc. | 14.411 | -7,62 | 500 | -6,89 | ||||
| 2026-02-04 | 13F | Fourth Dimension Wealth, LLC | 430 | 0,00 | 15 | 0,00 | ||||
| 2026-02-09 | 13F | Huntington National Bank | 79.439 | 0,49 | 2.759 | 1,25 | ||||
| 2026-01-28 | 13F | Emprise Bank | 6.052 | 0,00 | 210 | 0,96 | ||||
| 2026-01-30 | 13F | Exencial Wealth Advisors, Llc | 9.123 | -0,91 | 317 | -0,32 | ||||
| 2025-10-22 | 13F | Compass Planning Associates Inc | 0 | -100,00 | 0 | |||||
| 2025-10-31 | 13F | White Wing Wealth Management | 0 | -100,00 | 0 | |||||
| 2025-09-25 | NP | DFA INVESTMENT DIMENSIONS GROUP INC - International Vector Equity Portfolio Shares | 4.950 | 0,00 | 159 | 17,78 | ||||
| 2026-02-09 | 13F | Fidelis Capital Partners, LLC | 10.107 | 69,61 | 351 | 71,22 | ||||
| 2026-02-06 | 13F | Prospect Financial Services LLC | 12.502 | -7,02 | 434 | -6,26 | ||||
| 2026-02-09 | 13F | Kingsview Wealth Management, LLC | 38.900 | 1,15 | 1.351 | 1,89 | ||||
| 2026-02-13 | 13F | Financial Freedom, LLC | 55 | 1,85 | 2 | 0,00 | ||||
| 2026-02-11 | 13F | Nemes Rush Group LLC | 3.506 | 2,69 | 122 | 3,42 | ||||
| 2026-01-23 | 13F | Westside Investment Management, Inc. | 1.580 | 0,00 | 57 | 3,70 | ||||
| 2026-02-17 | 13F | Prosperity Consulting Group, LLC | 38.265 | -3,54 | 1.329 | -2,78 | ||||
| 2025-09-25 | NP | RODM - Hartford Multifactor Developed Markets (ex-US) ETF | 19.644 | 44,59 | 632 | 37,47 | ||||
| 2026-01-13 | 13F | Capital Investment Advisors, LLC | 12.005 | -2,64 | 417 | -1,89 | ||||
| 2026-01-26 | 13F | Peoples Financial Services Corp. | 5.069 | 0,00 | 176 | 0,57 | ||||
| 2026-02-05 | 13F | John G Ullman & Associates Inc | 21.700 | -1,14 | 754 | -0,40 | ||||
| 2026-01-08 | 13F | Grove Bank & Trust | 1.798 | -12,93 | 62 | -12,68 | ||||
| 2026-02-05 | 13F | Lockheed Martin Investment Management Co | 35.900 | 1.247 | ||||||
| 2025-10-24 | 13F | Opal Wealth Advisors, LLC | 0 | -100,00 | 0 | |||||
| 2025-11-14 | 13F | Virtu Financial LLC | 0 | -100,00 | 0 | -100,00 | ||||
| 2026-01-20 | 13F | Savvy Advisors, Inc. | 10.240 | 45,56 | 356 | 46,69 | ||||
| 2026-01-27 | 13F | Meritage Portfolio Management | 145.044 | -2,01 | 5.037 | -1,24 | ||||
| 2026-01-30 | 13F/A | M&t Bank Corp | 301.468 | 0,46 | 10.470 | 1,25 | ||||
| 2026-02-17 | 13F | Fmr Llc | 1.922.029 | 3,82 | 66.752 | 4,64 | ||||
| 2026-01-28 | 13F | North Point Portfolio Managers Corp/oh | 6.957 | 0,00 | 242 | 0,84 | ||||
| 2026-02-05 | 13F | Aspire Growth Partners LLC | 7.582 | -0,85 | 263 | 0,00 | ||||
| 2026-02-05 | 13F | 1st Source Bank | 26.981 | -5,10 | 937 | -4,29 | ||||
| 2026-01-26 | 13F | Merit Financial Group, LLC | 52.814 | 3,31 | 1.834 | 4,15 | ||||
| 2026-02-11 | 13F | Strategic Advocates LLC | 242 | -67,07 | 8 | -68,00 | ||||
| 2025-09-26 | NP | John Hancock Tax-advantaged Dividend Income Fund | 765.450 | 0,00 | 24.609 | 17,08 | ||||
| 2026-02-05 | 13F | Rossmore Private Capital | 30.300 | 31,92 | 1.052 | 33,00 | ||||
| 2026-02-12 | 13F | Brinker Capital Investments, LLC | 60.938 | 10,46 | 2.116 | 11,31 | ||||
| 2026-02-23 | 13F | Beaird Harris Wealth Management, LLC | 248 | 0,00 | 9 | 0,00 | ||||
| 2026-02-10 | 13F/A | Northwestern Mutual Wealth Management Co | 129.285 | 10,80 | 4.490 | 11,69 | ||||
| 2026-02-12 | 13F | Investment Research Partners LLC | 7.261 | -1,48 | 252 | -2,70 | ||||
| 2026-01-29 | 13F | Wealth Alliance Advisory Group, LLC | 25.657 | 0,00 | 891 | 0,79 | ||||
| 2026-02-13 | 13F | Brown Advisory Inc | 196.096 | -7,40 | 6.810 | -6,67 | ||||
| 2026-01-27 | 13F | Godsey & Gibb Associates | 500 | 0,00 | 17 | 0,00 | ||||
| 2026-02-09 | 13F | Cary Street Partners Financial Llc | 80.667 | 8,06 | 2.802 | 8,90 | ||||
| 2026-02-13 | 13F | National Bank Of Canada /fi/ | 5.328.988 | 2,61 | 185.074 | 3,42 | ||||
| 2026-01-16 | 13F | Trust Co Of Vermont | 2.039 | -5,78 | 71 | -5,41 | ||||
| 2026-02-09 | 13F | Harbour Investments, Inc. | 65.305 | 1,44 | 2.268 | 2,25 | ||||
| 2026-02-12 | 13F | Campbell & CO Investment Adviser LLC | 0 | -100,00 | 0 | |||||
| 2026-01-22 | 13F | Comprehensive Money Management Services LLC | 8.560 | 2,03 | 297 | 2,77 | ||||
| 2026-02-06 | 13F | EverSource Wealth Advisors, LLC | 14.177 | -3,06 | 492 | -2,19 | ||||
| 2026-02-02 | 13F | Sachetta, LLC | 159 | 59,00 | 6 | 66,67 | ||||
| 2026-02-11 | 13F | Jpmorgan Chase & Co | 1.039.546 | -8,62 | 36.103 | -7,91 | ||||
| 2026-02-13 | 13F | Arete Wealth Advisors, LLC | 8.196 | -10,09 | 0 | |||||
| 2026-01-12 | 13F | Legacy Wealth Asset Management, LLC | 15.058 | 3,97 | 523 | 4,61 | ||||
| 2026-02-12 | 13F | Renaissance Technologies Llc | 2.663.167 | 51,47 | 92.492 | 52,66 | ||||
| 2026-02-13 | 13F | Resources Investment Advisors, LLC. | 8.656 | 20,81 | 301 | 21,95 | ||||
| 2025-09-25 | NP | DIHP - Dimensional International High Profitability ETF | 1.118.639 | 9,58 | 35.964 | 28,30 | ||||
| 2026-02-03 | 13F | Morse Asset Management, Inc | 253 | 0,00 | 9 | 0,00 | ||||
| 2026-01-29 | 13F | Financial Life Planners | 0 | -100,00 | 0 | |||||
| 2026-03-06 | 13F | Hsbc Holdings Plc | 30.920 | 160,49 | 1.074 | 162,35 | ||||
| 2026-01-22 | 13F | Bartlett & Co. Wealth Management Llc | 1.704 | 0,00 | 59 | 1,72 | ||||
| 2026-01-27 | 13F | Hoertkorn Richard Charles | 100 | 0,00 | 3 | 0,00 | ||||
| 2026-02-11 | 13F | TCTC Holdings, LLC | 4.700 | 0,00 | 163 | 1,24 | ||||
| 2026-02-13 | 13F | PCM Encore, LLC | 13.264 | 461 | ||||||
| 2026-02-26 | 13F | TD Capital Management LLC | 1.021 | 0,00 | 35 | 0,00 | ||||
| 2026-01-21 | 13F | Signature Resources Capital Management, LLC | 1.355 | 0,00 | 47 | 2,17 | ||||
| 2026-02-06 | 13F | Csenge Advisory Group | 18.380 | -12,02 | 638 | -11,27 | ||||
| 2026-02-17 | 13F | Engineers Gate Manager LP | 91.227 | 33,90 | 3.168 | 34,98 | ||||
| 2026-02-13 | 13F | Essex Investment Management Co Llc | 662 | 0,00 | 23 | 0,00 | ||||
| 2026-02-13 | 13F | Wealth Dimensions Group, Ltd. | 7.730 | -1,73 | 268 | -1,11 | ||||
| 2026-01-26 | 13F | Cordatus Wealth Management LLC | 11.032 | -6,03 | 383 | -5,20 | ||||
| 2026-01-29 | 13F | Calamos Advisors LLC | 475.000 | 0,00 | 16.497 | 0,78 | ||||
| 2026-01-21 | 13F | Aaron Wealth Advisors LLC | 21.075 | 33,37 | 732 | 34,38 | ||||
| 2026-02-17 | 13F | Moore Capital Management, Lp | 200.000 | 6.946 | ||||||
| 2026-02-17 | 13F | Df Dent & Co Inc | 0 | -100,00 | 0 | |||||
| 2025-09-25 | NP | DIHRX - International High Relative Profitability Portfolio Institutional Class This fund is a listed as child fund of Dimensional Fund Advisors Lp and if that institution has disclosed ownership in this security, then these positions will not be double counted when calculating total shares and total value | 473.050 | 0,00 | 15.209 | 17,08 | ||||
| 2026-02-19 | 13F | Mcguire Capital Advisors Inc | 46 | 2 | ||||||
| 2026-01-20 | 13F | SS&H Financial Advisors, Inc. | 6.480 | -7,16 | 0 | -100,00 | ||||
| 2026-02-11 | 13F | Dorsey & Whitney Trust CO LLC | 8.834 | -43,54 | 307 | -43,23 | ||||
| 2026-02-17 | 13F | Boreal Capital Management LLC | 100 | 0,00 | 3 | 0,00 | ||||
| 2026-02-13 | 13F | Mariner, LLC | 380.422 | 8,87 | 13.212 | 9,69 | ||||
| 2026-02-10 | 13F | ESL Trust Services, LLC | 200 | 0,00 | 7 | 0,00 | ||||
| 2026-02-17 | 13F | Blackstone Group Inc | 121.896 | 214,30 | 4.233 | 216,84 | ||||
| 2026-01-15 | 13F | Lodestone Wealth Management LLC | 196 | 7 | ||||||
| 2026-02-02 | 13F | Farmers & Merchants Trust Co of Chambersburg PA | 213 | 0,00 | 0 | |||||
| 2026-02-17 | 13F | Lighthouse Investment Partners, LLC | 0 | -100,00 | 0 | -100,00 | ||||
| 2025-10-20 | 13F | LVW Advisors, LLC | 0 | -100,00 | 0 | |||||
| 2026-01-16 | 13F | Balboa Wealth Partners | 13.431 | 0,00 | 466 | 0,87 | ||||
| 2026-01-22 | 13F | Greenup Street Wealth Management Llc | 6.670 | 0,00 | 230 | 0,00 | ||||
| 2026-01-28 | 13F | Barrett & Company, Inc. | 1.613 | 0,19 | 56 | 1,82 | ||||
| 2026-02-12 | 13F | Integrated Quantitative Investments LLC | 30.976 | 1.076 | ||||||
| 2026-02-13 | 13F | Financial Sense Advisors, Inc. | 577.812 | 0,55 | 20.067 | 1,34 | ||||
| 2026-02-13 | 13F | Kayne Anderson Rudnick Investment Management Llc | 10.362 | -6,82 | 360 | -6,27 | ||||
| 2026-02-10 | 13F | Ark & Tlk Investments, Llc | 14.114 | 1,77 | 490 | 2,73 | ||||
| 2026-01-27 | 13F | Osborne Partners Capital Management, Llc | 0 | -100,00 | 0 | |||||
| 2026-02-12 | 13F | New York State Common Retirement Fund | 511.596 | 17.768 | ||||||
| 2026-02-10 | 13F | Connor, Clark & Lunn Investment Management Ltd. | 2.454.406 | 89,44 | 85.242 | 90,92 | ||||
| 2026-01-30 | 13F | Oakworth Capital, Inc. | 4.393 | -7,81 | 153 | -7,32 | ||||
| 2026-01-26 | 13F | Baxter Bros Inc | 14.472 | 0,00 | 503 | 0,80 | ||||
| 2026-02-17 | 13F | Russell Investments Group, Ltd. | 599.094 | -1,92 | 20.807 | -1,15 | ||||
| 2026-02-11 | 13F | TT Capital Management LLC | 28.366 | -5,36 | 985 | -4,55 | ||||
| 2025-11-03 | 13F | Patton Albertson Miller Group, Llc | 0 | -100,00 | 0 | -100,00 | ||||
| 2026-02-14 | 13F | Whipplewood Advisors, LLC | 1.163 | 1,13 | 40 | 2,56 | ||||
| 2026-02-10 | 13F | Elgethun Capital Management | 12.694 | 0,72 | 441 | 0,69 | ||||
| 2026-02-17 | 13F | Cantor Fitzgerald, L. P. | 0 | -100,00 | 0 | |||||
| 2025-09-25 | NP | DFA INVESTMENT DIMENSIONS GROUP INC - World ex U.S. Core Equity Portfolio Institutional Class Shares | 242.656 | -24,39 | 7.801 | -11,48 | ||||
| 2026-02-11 | 13F | Vestor Capital, Llc | 66.553 | 3.119,79 | 0 | |||||
| 2026-01-21 | 13F | Naviter Wealth, LLC | 50.040 | -9,67 | 1.738 | -9,01 | ||||
| 2026-02-11 | 13F | GW&K Investment Management, LLC | 390 | 0 | ||||||
| 2026-02-13 | 13F | Missouri Trust & Investment Co | 1.000 | 0,00 | 35 | 0,00 | ||||
| 2026-01-21 | 13F | Yousif Capital Management, Llc | 26.596 | -7,56 | 935 | -5,75 | ||||
| 2026-02-05 | 13F | Mission Wealth Management, Lp | 25.388 | -1,88 | 882 | -1,12 | ||||
| 2026-01-30 | 13F | Kohmann Bosshard Financial Services, LLC | 503 | 17 | ||||||
| 2026-01-23 | 13F | Capital Investment Counsel, Inc | 12.840 | 0,00 | 446 | 0,68 | ||||
| 2026-02-12 | 13F | Chilton Capital Management Llc | 1.025 | 0,00 | 36 | 0,00 | ||||
| 2025-10-29 | 13F | Formidable Asset Management, LLC | 0 | -100,00 | 0 | |||||
| 2025-09-26 | NP | EPIVX - EuroPac International Value Fund Class A | 85.000 | 0,00 | 2.733 | 17,05 | ||||
| 2026-02-06 | 13F | Lloyd Advisory Services, LLC. | 347 | 12 | ||||||
| 2026-02-17 | 13F | Greenland Capital Management LP | 0 | -100,00 | 0 | |||||
| 2026-02-11 | 13F | LPL Financial LLC | 1.408.533 | 2,50 | 48.918 | 3,31 | ||||
| 2026-01-22 | 13F | Networth Advisors, LLC | 121 | 4 | ||||||
| 2026-02-13 | 13F | Bridgefront Capital, LLC | 0 | -100,00 | 0 | |||||
| 2026-02-13 | 13F | Kcm Investment Advisors Llc | 5.957 | 0,00 | 207 | 0,49 | ||||
| 2026-02-09 | 13F | Ar Asset Management Inc | 11.642 | 0,00 | 0 | |||||
| 2026-01-05 | 13F | Catherine Avery Investment Management LLC | 113 | 0,89 | 4 | 0,00 | ||||
| 2025-11-13 | 13F | Wealth Watch Advisors, INC | 0 | -100,00 | 0 | |||||
| 2026-02-17 | 13F | SIH Partners, LLLP | 63.400 | 169,79 | 2.202 | 172,06 | ||||
| 2026-01-23 | 13F | Rsm Us Wealth Management Llc | 46.267 | -5,59 | 1.608 | -4,80 | ||||
| 2026-02-13 | 13F | Sterling Capital Management LLC | 25.008 | 0,10 | 869 | 0,93 | ||||
| 2026-02-27 | 13F | Strategic Investment Solutions, Inc. /IL | 1.899 | 1,12 | 66 | 1,56 | ||||
| 2026-01-15 | 13F | Capital Advisors Inc/ok | 20.878 | 1,41 | 725 | 2,26 | ||||
| 2026-02-13 | 13F | Verition Fund Management LLC | 675.156 | -3,59 | 23.448 | -2,83 | ||||
| 2026-01-12 | 13F | Focus Financial Network, Inc. | 8.542 | 0,06 | 297 | 0,68 | ||||
| 2026-01-20 | 13F | American National Bank | 281 | 230,59 | 10 | 350,00 | ||||
| 2026-02-13 | 13F | Corient IA LLC | 5.960 | -40,40 | 207 | -40,12 | ||||
| 2026-02-13 | 13F | Centiva Capital, LP | Call | 65.000 | -45,33 | 2.257 | -44,91 | |||
| 2026-02-18 | 13F | EP Wealth Advisors, Inc. | 21.507 | -2,31 | 747 | 13,37 | ||||
| 2026-02-13 | 13F | Centiva Capital, LP | 71.522 | 2.484 | ||||||
| 2026-01-30 | 13F | Ares Financial Consulting, LLC | 573 | 20 | ||||||
| 2026-02-11 | 13F | Capital Analysts, Inc. | 11.386 | 0,76 | 0 | |||||
| 2026-02-17 | 13F | SageView Advisory Group, LLC | 1.774 | 62 | ||||||
| 2026-02-20 | 13F | Kovitz Investment Group Partners, LLC | 10.510 | -83,10 | 365 | -82,97 | ||||
| 2026-02-06 | 13F | Pnc Financial Services Group, Inc. | 707.358 | -7,32 | 24.567 | -6,59 | ||||
| 2026-02-02 | 13F | Cornerstone Planning Group LLC | 1.303 | 6,02 | 49 | 16,67 | ||||
| 2026-02-13 | 13F | Centiva Capital, LP | Put | 383.300 | 0,00 | 13.312 | 0,79 | |||
| 2026-02-12 | 13F | Douglass Winthrop Advisors, LLC | 30.319 | -6,10 | 1.053 | -5,40 | ||||
| 2025-09-26 | NP | RSEAX - U.S. Strategic Equity Fund Class A | 131.854 | 0,00 | 4.239 | 17,10 | ||||
| 2026-02-10 | 13F | Rothschild Investment Llc | 73.650 | -4,20 | 2.558 | -3,47 | ||||
| 2026-01-06 | 13F | Neville Rodie & Shaw Inc | 120.636 | -1,15 | 4 | 0,00 | ||||
| 2026-02-10 | 13F | DT Investment Partners, LLC | 506 | 0,00 | 18 | 0,00 | ||||
| 2026-02-12 | 13F | Logan Capital Management Inc | 234.846 | 10,00 | 8.156 | 10,88 | ||||
| 2026-01-27 | 13F | Proffitt & Goodson Inc | 0 | -100,00 | 0 | |||||
| 2026-02-12 | 13F | Wedbush Securities Inc | 27.094 | 10,12 | 1 | |||||
| 2025-09-26 | NP | BLUC - Bluemonte Large Cap Core ETF | 13 | 0 | ||||||
| 2026-01-26 | 13F | Greenwood Capital Associates Llc | 28.422 | 987 | ||||||
| 2026-01-28 | 13F | Kanawha Capital Management Llc | 10.431 | -4,37 | 362 | -3,47 | ||||
| 2026-02-09 | 13F | Hantz Financial Services, Inc. | 82.111 | 18,21 | 3 | 0,00 | ||||
| 2026-02-05 | 13F | Center for Financial Planning, Inc. | 1.210 | -3,97 | 42 | -2,33 | ||||
| 2026-02-17 | 13F | North Capital, Inc. | 0 | -100,00 | 0 | |||||
| 2026-01-12 | 13F | Roble, Belko & Company, Inc | 101 | 10.000,00 | 0 | |||||
| 2026-01-27 | 13F | Lodestar Private Asset Management Llc | 7.090 | 0,00 | 246 | 0,82 | ||||
| 2026-02-10 | 13F | Dynasty Wealth Management, Llc | 26.159 | 5,16 | 908 | 5,95 | ||||
| 2025-09-25 | NP | DFALX - Large Cap International Portfolio - Institutional Class This fund is a listed as child fund of Dimensional Fund Advisors Lp and if that institution has disclosed ownership in this security, then these positions will not be double counted when calculating total shares and total value | 748.670 | 0,00 | 24.070 | 17,08 | ||||
| 2026-01-29 | 13F | UBS Group AG | Put | 735.100 | 15,76 | 25.530 | 16,67 | |||
| 2026-02-02 | 13F | Millstone Evans Group, LLC | 2.786 | 1,83 | 97 | 2,13 | ||||
| 2026-02-17 | 13F | Westwood Holdings Group Inc | 22.667 | 0,00 | 787 | 0,77 | ||||
| 2026-01-29 | 13F | UBS Group AG | Call | 970.060 | 17,69 | 33.690 | 18,61 | |||
| 2026-01-13 | 13F | Mather Group, Llc. | 21.454 | 1,32 | 745 | 2,19 | ||||
| 2026-01-29 | 13F | UBS Group AG | 2.388.521 | -47,38 | 82.953 | -46,97 | ||||
| 2026-01-13 | 13F | CPA Asset Management LLC | 7.796 | 271 | ||||||
| 2026-02-06 | 13F | Associated Banc-corp | 22.029 | -17,36 | 765 | -16,67 | ||||
| 2026-02-12 | 13F | Federation des caisses Desjardins du Quebec | 9.097 | -5,95 | 316 | -5,41 | ||||
| 2026-01-07 | 13F | Retirement Wealth Solutions LLC | 76 | 1.166,67 | 3 | |||||
| 2026-01-29 | 13F | St. Johns Investment Management Company, LLC | 0 | -100,00 | 0 | |||||
| 2026-02-13 | 13F | Bollard Group LLC | 357.211 | 0,17 | 12 | 0,00 | ||||
| 2026-02-13 | 13F | Peak6 Llc | 116.400 | -52,13 | 4.043 | -51,75 | ||||
| 2026-02-13 | 13F | Peak6 Llc | Call | 88.100 | 103,94 | 3.060 | 105,58 | |||
| 2026-02-13 | 13F | Peak6 Llc | Put | 301.700 | -4,83 | 10.478 | -4,07 | |||
| 2025-10-14 | 13F | Bridge Creek Capital Management LLC | 10.825 | 0,00 | 373 | 15,48 | ||||
| 2025-09-26 | NP | EPDPX - EuroPac International Dividend Income Fund Class A | 75.000 | 0,00 | 2.411 | 17,10 | ||||
| 2026-02-17 | 13F | Greenline Partners, LLC | 9.089 | 0,00 | 316 | 0,64 | ||||
| 2026-01-23 | 13F | Smallwood Wealth Investment Management, LLC | 31 | 3,33 | 1 | 0,00 | ||||
| 2026-02-10 | 13F | Sittner & Nelson, Llc | 2.880 | -0,03 | 112 | 13,13 | ||||
| 2026-02-17 | 13F | Pinnacle Financial Partners, Inc. | 19.417 | 675 | ||||||
| 2026-02-13 | 13F | Tradewinds, LLC. | 7.022 | 0,00 | 244 | 0,83 | ||||
| 2026-02-12 | 13F | Pettinga Financial Advisors, LLC | 7.201 | 2,35 | 250 | 3,31 | ||||
| 2026-01-30 | 13F | BancorpSouth Bank | 7.100 | 247 | ||||||
| 2026-01-23 | 13F | Gilliland Jeter Wealth Management LLC | 56.450 | -1,26 | 1.961 | -0,51 | ||||
| 2026-02-05 | 13F | PCG Wealth Advisors, LLC | 6.878 | 0,00 | 239 | 0,42 | ||||
| 2026-01-23 | 13F | Avion Wealth | 2.787 | 0,25 | 0 | |||||
| 2026-02-05 | 13F | Navalign, LLC | 341 | 12 | ||||||
| 2026-02-13 | 13F | Walleye Trading LLC | 171.948 | 61,63 | 5.972 | 62,88 | ||||
| 2026-02-13 | 13F | Ubs Asset Management Americas Inc | 8.850 | 307 | ||||||
| 2026-02-11 | 13F | Winton Capital Group Ltd | 9.200 | 320 | ||||||
| 2026-02-17 | 13F | Merewether Investment Management, LP | 3.008.100 | 104.471 | ||||||
| 2026-02-12 | 13F | Birmingham Capital Management Co Inc/al | 7.150 | -2,72 | 248 | -1,98 | ||||
| 2026-02-17 | 13F | Abel Hall, LLC | 21.573 | 37,06 | 749 | 38,19 | ||||
| 2026-02-13 | 13F | Walleye Trading LLC | Put | 1.032.400 | -28,86 | 35.855 | -28,31 | |||
| 2026-02-02 | 13F | Altrius Capital Management Inc | 275.594 | -0,97 | 9.571 | -0,20 | ||||
| 2026-02-13 | 13F | Walleye Trading LLC | Call | 588.300 | -30,37 | 20.432 | -29,83 | |||
| 2026-01-27 | 13F | Krilogy Financial LLC | 7.982 | -23,48 | 293 | -21,24 | ||||
| 2026-01-28 | 13F | Arbor Capital Management Inc /adv | 10.681 | 9,88 | 362 | 9,70 | ||||
| 2025-09-24 | NP | SNTKX - Steward International Enhanced Index Fund Class A | 115.998 | 0,00 | 3.729 | 17,08 | ||||
| 2026-02-17 | 13F | Aventail Capital Group, LP | Call | 0 | -100,00 | 0 | ||||
| 2025-09-26 | NP | PMYRX - Victory Pioneer Equity Premium Income Fund Class Y | 59.077 | 0,00 | 1.899 | 17,08 | ||||
| 2026-01-21 | 13F | Stock Yards Bank & Trust Co | 24.635 | -5,67 | 856 | -4,89 | ||||
| 2026-02-13 | 13F | Arrowstreet Capital, Limited Partnership | 5.774.962 | 19,90 | 200.564 | 20,83 | ||||
| 2026-02-05 | 13F | Gabelli Funds Llc | 392.400 | 5,97 | 13.628 | 6,80 | ||||
| 2026-02-12 | 13F | BlackRock, Inc. | 10.782.744 | 0,40 | 374.485 | 1,19 | ||||
| 2026-02-04 | 13F | LRI Investments, LLC | 1.276 | 76,24 | 44 | 83,33 | ||||
| 2026-02-12 | 13F | Azimuth Capital Investment Management LLC | 62.126 | -0,40 | 2.158 | 0,37 | ||||
| 2026-01-30 | 13F | United Community Bank | 29.456 | 1,27 | 1.023 | 2,10 | ||||
| 2026-01-13 | 13F | CoreCap Advisors, LLC | 5.101 | 0,14 | 177 | 1,14 | ||||
| 2026-01-27 | 13F | Zurcher Kantonalbank (Zurich Cantonalbank) | 12.090 | 420 | ||||||
| 2026-02-13 | 13F | Smartleaf Asset Management LLC | 25.564 | 22,13 | 888 | 22,15 | ||||
| 2026-01-21 | 13F | Prime Capital Investment Advisors, LLC | 8.491 | -6,29 | 295 | -5,77 | ||||
| 2026-02-10 | 13F | Iat Reinsurance Co Ltd. | 0 | -100,00 | 0 | |||||
| 2026-01-29 | 13F | Concurrent Investment Advisors, LLC | 44.912 | 31,43 | 1.560 | 32,46 | ||||
| 2025-09-19 | NP | PRPFX - Permanent Portfolio Class I | 300.000 | 0,00 | 9.645 | 17,08 | ||||
| 2026-02-09 | 13F | Keating Financial Advisory Services, Inc. | 10.776 | 374 | ||||||
| 2026-02-17 | 13F | Auxier Asset Management | 177.312 | -1,52 | 6.158 | -0,74 | ||||
| 2026-02-06 | 13F | Larson Financial Group LLC | 122.614 | 4,93 | 4.258 | 5,76 | ||||
| 2026-02-12 | 13F | Pitcairn Co | 0 | -100,00 | 0 | |||||
| 2026-01-23 | 13F | Nbt Bank N A /ny | 4.818 | -29,33 | 167 | -28,63 | ||||
| 2026-02-06 | 13F | BOK Financial Private Wealth, Inc. | 2.738 | 0,00 | 95 | 1,06 | ||||
| 2025-09-25 | NP | DFIC - Dimensional International Core Equity 2 ETF | 1.083.342 | 0,56 | 34.829 | 17,74 | ||||
| 2026-02-12 | 13F | Colonial Trust Advisors | 1.143 | -33,66 | 40 | -33,90 | ||||
| 2025-10-31 | 13F | National Wealth Management Group, LLC | 0 | -100,00 | 0 | |||||
| 2026-01-13 | 13F | Trust Point Inc. | 14.939 | 24,08 | 519 | 25,12 | ||||
| 2026-02-17 | 13F | Optiver Holding B.V. | 364.643 | 12.664 | ||||||
| 2026-01-22 | 13F | Apollon Wealth Management, LLC | 35.410 | -0,39 | 1.230 | 0,33 | ||||
| 2025-10-31 | 13F | Whittier Trust Co Of Nevada Inc | 0 | -100,00 | 0 | |||||
| 2026-02-17 | 13F | Mairs & Power Inc | 6.500 | 0,00 | 226 | 0,90 | ||||
| 2025-11-14 | 13F | Wolverine Trading, Llc | 122.968 | 4.273 | ||||||
| 2025-11-14 | 13F | Wolverine Trading, Llc | Call | 527.200 | 18.320 | |||||
| 2026-02-17 | 13F | Susquehanna International Group, Llp | Call | 1.600.800 | -56,29 | 55.596 | -55,95 | |||
| 2025-11-14 | 13F | Wolverine Trading, Llc | Put | 317.000 | 11.016 | |||||
| 2026-01-30 | 13F | Bogart Wealth, LLC | 1.115 | -15,59 | 39 | -15,56 | ||||
| 2025-09-26 | NP | John Hancock Premium Dividend Fund | 590.950 | 0,00 | 18.999 | 17,08 | ||||
| 2026-02-17 | 13F | Hurlow Wealth Management Group, Inc. | 6.264 | 0,00 | 218 | 0,93 | ||||
| 2025-11-12 | 13F | CIBC Bancorp USA Inc. | 74.324 | 2.561 | ||||||
| 2026-02-03 | 13F | Legacy Wealth Managment, LLC/ID | 5.006 | 0,68 | 174 | 1,17 | ||||
| 2026-02-09 | 13F | Jefferies Financial Group Inc. | Call | 30.000 | 1.042 | |||||
| 2025-09-25 | NP | Dfa Investment Trust Co - The Dfa International Value Series This fund is a listed as child fund of Dimensional Fund Advisors Lp and if that institution has disclosed ownership in this security, then these positions will not be double counted when calculating total shares and total value | 2.810.520 | 33,19 | 90.358 | 55,94 | ||||
| 2026-02-13 | 13F | Gen-Wealth Partners Inc | 1.340 | 0,00 | 47 | 0,00 | ||||
| 2026-02-17 | 13F | Fairscale Capital, LLC | 1.719 | 0,00 | 60 | 0,00 | ||||
| 2026-01-09 | 13F | Aull & Monroe Investment Management Corp | 12.475 | 0,00 | 433 | 0,93 | ||||
| 2025-11-04 | 13F | Sollinda Capital Management LLC | 0 | -100,00 | 0 | |||||
| 2025-11-06 | 13F | Abich Financial Wealth Management LLC | 97 | -92,73 | 3 | -92,68 | ||||
| 2026-02-10 | 13F | Smith Group Asset Management, LLC | 49.880 | 62,48 | 1.732 | 63,86 | ||||
| 2026-02-11 | 13F | Deutsche Bank Ag\ | 1.627.168 | 4.132,35 | 56.512 | 4.168,20 | ||||
| 2025-11-05 | 13F | SPC Financial, Inc. | 9.127 | 0,00 | 315 | 15,02 | ||||
| 2026-01-08 | 13F | Armstrong Advisory Group, Inc | 3.421 | 19,78 | 119 | 20,41 | ||||
| 2026-02-05 | 13F | Cardinal Point Capital Management, ULC | 0 | -100,00 | 0 | |||||
| 2026-02-13 | 13F | Venture Visionary Partners LLC | 30.945 | -7,41 | 1.075 | -6,69 | ||||
| 2026-02-11 | 13F | Empowered Funds, LLC | 10.088 | -37,29 | 350 | -36,82 | ||||
| 2026-01-15 | 13F | SILVER OAK SECURITIES, Inc | 8.744 | -4,49 | 304 | -3,81 | ||||
| 2026-02-13 | 13F | First National Bank Of Omaha | 8.139 | 283 | ||||||
| 2026-02-10 | 13F | Ritter Daniher Financial Advisory LLC / DE | 3.342 | -23,03 | 116 | -22,15 | ||||
| 2026-01-29 | 13F | Atlas Legacy Advisors, LLC | 10.621 | 2,25 | 369 | 3,08 | ||||
| 2026-02-11 | 13F | Comprehensive Financial Planning, Inc./PA | 172 | 6 | ||||||
| 2026-01-28 | 13F | Ruffer LLP | 2.235.750 | -2,57 | 77.769 | -1,66 | ||||
| 2026-02-03 | 13F | Gallacher Capital Management LLC | 19.203 | -1,27 | 667 | -0,60 | ||||
| 2026-01-22 | 13F | HHM Wealth Advisors, LLC | 306 | 0,00 | 11 | 0,00 | ||||
| 2026-02-17 | 13F | Susquehanna International Group, Llp | 410.811 | 154,99 | 14.267 | 157,02 | ||||
| 2026-02-09 | 13F | Annis Gardner Whiting Capital Advisors, LLC | 5.451 | 9,02 | 189 | 9,88 | ||||
| 2026-02-17 | 13F | Susquehanna International Group, Llp | Put | 1.888.000 | -23,58 | 65.570 | -22,99 | |||
| 2026-02-17 | 13F | Game Creek Capital, LP | 9.500 | 0,00 | 330 | 0,61 | ||||
| 2026-02-10 | 13F | Tidemark, LLC | 363 | 1,40 | 13 | 0,00 | ||||
| 2026-02-11 | 13F | Franklin Resources Inc | 2.324.851 | -43,10 | 80.742 | -42,74 | ||||
| 2026-01-28 | 13F | Confluence Wealth Services, Inc. | 6.600 | -18,40 | 229 | -17,63 | ||||
| 2026-02-13 | 13F | Wealth Alliance | 7.419 | -0,28 | 258 | 0,39 | ||||
| 2026-02-17 | 13F | Quantitative Investment Management, LLC | 0 | -100,00 | 0 | |||||
| 2026-02-24 | 13F | Chelsea Counsel Co | 1.000 | 0,00 | 35 | 0,00 | ||||
| 2026-02-13 | 13F | Stifel Financial Corp | 916.968 | 3,98 | 31.846 | 4,80 | ||||
| 2025-11-05 | 13F | Signature Estate & Investment Advisors Llc | 0 | -100,00 | 0 | |||||
| 2026-01-23 | 13F | Valley National Advisers Inc | 1.873 | 0,00 | 0 | |||||
| 2026-02-12 | 13F | Callan Family Office, LLC | 77.407 | 258,81 | 2.688 | 261,78 | ||||
| 2026-02-17 | 13F | Prelude Capital Management, Llc | 19.987 | 694 | ||||||
| 2025-11-05 | 13F | Moloney Securities Asset Management, LLC | 9.815 | -2,90 | 338 | 11,92 | ||||
| 2026-02-04 | 13F | Long Road Investment Counsel, LLC | 5.900 | 0,00 | 205 | 0,49 | ||||
| 2026-01-26 | 13F | Dakota Community Bank & Trust NA | 4.000 | 0,00 | 139 | 0,73 | ||||
| 2026-02-03 | 13F | Winch Advisory Services, LLC | 13.119 | -0,54 | 456 | 0,22 | ||||
| 2026-02-11 | 13F | Ameritas Investment Partners, Inc. | 180 | 6 | ||||||
| 2026-02-13 | 13F | SPX Equities Gestao de Recursos Ltda | 523.230 | -25,60 | 18.172 | -25,02 | ||||
| 2026-02-09 | 13F | Bleakley Financial Group, LLC | 99.176 | 22,34 | 3.444 | 23,31 | ||||
| 2026-02-17 | 13F | Raymond James Financial Inc | 2.852.979 | 2,81 | 99.084 | 3,61 | ||||
| 2026-02-02 | 13F | Pines Wealth Management, LLC | 6.055 | 0,00 | 210 | 0,96 | ||||
| 2026-02-11 | 13F | Hilton Head Capital Partners, LLC | 2.714 | 94 | ||||||
| 2026-01-23 | 13F | Steigerwald, Gordon & Koch Inc. | 0 | -100,00 | 0 | |||||
| 2026-02-10 | 13F | MidAtlantic Capital Management, Inc. | 272 | 9 | ||||||
| 2026-02-05 | 13F | Left Brain Wealth Management, LLC | 16.753 | 0,00 | 582 | 0,69 | ||||
| 2026-01-22 | 13F | Powers Advisory Group, LLC | 7.751 | 0,90 | 269 | 1,89 | ||||
| 2026-02-10 | 13F | Fort Sheridan Advisors Llc | 7.266 | 0,00 | 252 | 0,80 | ||||
| 2026-01-29 | 13F | Dunhill Financial, LLC | 0 | -100,00 | 0 | |||||
| 2026-01-29 | 13F | First Interstate Bank | 0 | -100,00 | 0 | |||||
| 2026-03-06 | 13F | Hsbc Holdings Plc | Call | 0 | -100,00 | 0 | ||||
| 2026-03-06 | 13F | Hsbc Holdings Plc | Put | 0 | -100,00 | 0 | ||||
| 2026-01-26 | 13F | PDS Planning, Inc | 9.017 | 3,69 | 313 | 4,68 | ||||
| 2026-02-09 | 13F | Jefferies Financial Group Inc. | 13.854 | -73,37 | 481 | -73,16 | ||||
| 2026-02-10 | 13F | Bnp Paribas Arbitrage, Sa | Put | 2.651 | -13,68 | 9.207 | -13,00 | |||
| 2026-02-17 | 13F | National Asset Management, Inc. | Call | 600 | -99,00 | 21 | 0,00 | |||
| 2026-01-29 | 13F | Kestra Private Wealth Services, Llc | 111.174 | -0,59 | 3.861 | 0,21 | ||||
| 2026-02-04 | 13F | Midwest Trust Co | 33.456 | 4,49 | 1.162 | 5,26 | ||||
| 2026-02-10 | 13F | Bnp Paribas Arbitrage, Sa | Call | 2.371 | -54,60 | 8.234 | -54,25 | |||
| 2026-02-10 | 13F | Financially Speaking Inc | 330 | 0,00 | 11 | 0,00 | ||||
| 2026-02-13 | 13F | MAI Capital Management | 31.940 | 131,79 | 1.109 | 133,97 | ||||
| 2026-02-10 | 13F | Excalibur Management Corp | 5.990 | 0,50 | 208 | 1,46 | ||||
| 2026-01-29 | 13F | Nbc Securities, Inc. | 5.548 | -19,09 | 193 | -18,64 | ||||
| 2026-02-17 | 13F | National Asset Management, Inc. | 89.510 | 87,05 | 3.109 | 88,48 | ||||
| 2026-01-15 | 13F | Foster & Motley Inc | 10.887 | -38,59 | 0 | |||||
| 2026-02-13 | 13F | Evelyn Partners Investment Management LLP | 2.382 | 0,00 | 83 | 0,00 | ||||
| 2026-02-17 | 13F | Vertex Planning Partners, LLC | 21.079 | -0,42 | 732 | 0,41 | ||||
| 2026-02-05 | 13F | May Hill Capital, LLC | 15.056 | 120,63 | 523 | 122,13 | ||||
| 2026-02-11 | 13F | J.w. Cole Advisors, Inc. | 109.486 | 1,61 | 3.704 | -0,27 | ||||
| 2026-01-30 | 13F | Chapin Davis, Inc. | 6.625 | -1,66 | 230 | -0,86 | ||||
| 2026-02-09 | 13F | Weinberger Asset Management, Inc | 9.102 | 0,00 | 316 | 0,96 | ||||
| 2026-02-10 | 13F | Bnp Paribas Arbitrage, Sa | 3.278.814 | -59,47 | 113.873 | -59,15 | ||||
| 2026-01-26 | 13F | Reyes Financial Architecture, Inc. | 344 | 12 | ||||||
| 2026-02-02 | 13F | Holistic Planning, LLC | 7.892 | 0,01 | 274 | 1,11 | ||||
| 2026-02-04 | 13F | Western Pacific Wealth Management, LP | 56 | 1,82 | 2 | 0,00 | ||||
| 2026-02-12 | 13F | Mount Yale Investment Advisors, LLC | 0 | -100,00 | 0 | |||||
| 2025-09-26 | NP | REAYX - Equity Income Fund Class Y | 15.882 | -4,57 | 511 | 11,60 | ||||
| 2026-02-13 | 13F | Quinn Opportunity Partners LLC | 60.000 | 0,00 | 2.084 | 0,77 | ||||
| 2026-01-29 | 13F | IMC-Chicago, LLC | 23.648 | 821 | ||||||
| 2026-02-09 | 13F | Koesten, Hirschmann & Crabtree, INC. | 0 | -100,00 | 0 | |||||
| 2026-01-26 | 13F | Xcel Wealth Management, LLC | 9.531 | -0,55 | 331 | 0,30 | ||||
| 2026-01-29 | 13F | Lee Danner & Bass Inc | 78.698 | 0,06 | 2.733 | 0,85 | ||||
| 2026-02-06 | 13F/A | Rathbone Brothers plc | 8.037 | 0,00 | 279 | 1,09 | ||||
| 2026-02-11 | 13F | Sharpepoint Llc | 61.957 | 2.152 | ||||||
| 2026-01-23 | 13F | Brown, Lisle/cummings, Inc. | 2.858 | 0,95 | 99 | 2,06 | ||||
| 2026-02-17 | 13F | Aventail Capital Group, LP | 48.284 | -52,12 | 1.677 | -51,77 | ||||
| 2026-02-10 | 13F | Private Wealth Asset Management, LLC | 1.709 | 0,00 | 59 | 1,72 | ||||
| 2026-02-05 | 13F | WealthPlan Investment Management, LLC | 5.769 | 200 | ||||||
| 2025-11-07 | 13F | Gsa Capital Partners Llp | 0 | -100,00 | 0 | |||||
| 2026-01-20 | 13F | Accel Wealth Management | 8.161 | -15,34 | 283 | -14,76 | ||||
| 2026-01-22 | 13F | Bfsg, Llc | 96.958 | 390,08 | 3.367 | 394,42 | ||||
| 2026-02-17 | 13F | Caption Management, LLC | 85.491 | -13,12 | 2.969 | -12,42 | ||||
| 2025-10-27 | 13F | Kiker Wealth Management, LLC | 0 | -100,00 | 0 | |||||
| 2026-01-07 | 13F | Harbour Capital Advisors, LLC | 20.215 | -3,94 | 724 | -1,50 | ||||
| 2025-11-14 | 13F | Beacon Pointe Advisors, LLC | Call | 0 | -100,00 | 0 | -100,00 | |||
| 2026-02-13 | 13F | Visionary Wealth Advisors | 8.331 | -23,09 | 289 | -22,52 | ||||
| 2026-01-30 | 13F | Burrus Financial Services, Inc. | 18.763 | 17,26 | 912 | 65,34 | ||||
| 2026-02-03 | 13F | Koshinski Asset Management, Inc. | 8.098 | 0,00 | 281 | 0,72 | ||||
| 2025-11-07 | 13F | Murphy & Mullick Capital Management Corp | 0 | -100,00 | 0 | |||||
| 2026-02-10 | 13F | CIBC World Markets Inc. | 398.046 | 4,47 | 13.824 | 5,29 | ||||
| 2026-02-17 | 13F | Insight Wealth Partners, LLC | 0 | -100,00 | 0 | |||||
| 2025-10-30 | 13F | Twin Peaks Wealth Advisors, LLC | 0 | -100,00 | 0 | |||||
| 2026-02-10 | 13F | Texas Yale Capital Corp. | 18.441 | 0,00 | 640 | 0,79 | ||||
| 2026-02-13 | 13F | Pin Oak Investment Advisors Inc | 5.736 | 0,00 | 0 | -100,00 | ||||
| 2026-01-06 | 13F | Investors Research Corp | 11.890 | -3,84 | 413 | -3,29 | ||||
| 2025-11-25 | 13F | Briaud Financial Planning, Inc | 0 | -100,00 | 0 | |||||
| 2026-01-15 | 13F | Trust Co | 2 | 0 | ||||||
| 2026-02-17 | 13F | Ameriflex Group, Inc. | 1.808 | 39,08 | 63 | 40,91 | ||||
| 2026-02-13 | 13F | Walleye Capital LLC | Put | 150.300 | 22,20 | 5.220 | 23,15 | |||
| 2026-01-27 | 13F | Evergreen Capital Management Llc | 78.326 | 15,65 | 2.720 | 16,59 | ||||
| 2026-02-13 | 13F | Walleye Capital LLC | 277.970 | 1.155,57 | 9.654 | 1.166,80 | ||||
| 2026-02-13 | 13F | Baltimore-Washington Financial Advisors, Inc. | 6.835 | 237 | ||||||
| 2026-02-13 | 13F | Walleye Capital LLC | Call | 264.100 | 155,42 | 9.172 | 157,42 | |||
| 2026-01-21 | 13F | Modera Wealth Management, LLC | 9.270 | 2,78 | 322 | 3,55 | ||||
| 2026-02-03 | 13F | CGC Financial Services, LLC | 296 | 0,00 | 10 | 0,00 | ||||
| 2026-01-28 | 13F | Columbia Asset Management | 125.904 | 4,03 | 4.373 | 4,84 | ||||
| 2026-01-14 | 13F | Aegis Wealth Management LLC | 11.582 | -1,79 | 402 | -0,99 | ||||
| 2026-01-12 | 13F | AllSquare Wealth Management LLC | 164 | 0,00 | 6 | 25,00 | ||||
| 2026-02-13 | 13F | Rhumbline Advisers | 48.142 | 35,31 | 1.672 | 36,30 | ||||
| 2025-11-07 | 13F | Beacon Capital Management, LLC | 0 | -100,00 | 0 | |||||
| 2026-02-13 | 13F | Change Path, LLC | 13.628 | 13,27 | 473 | 14,25 | ||||
| 2026-02-13 | 13F | Solstein Capital, LLC | 22.040 | -49,53 | 765 | -49,14 | ||||
| 2026-02-12 | 13F | Empire Financial Management Company, LLC | 7.937 | 0,00 | 276 | 0,73 | ||||
| 2026-02-17 | 13F | Edmond De Rothschild Holding S.a. | 1.600 | 0,00 | 56 | 0,00 | ||||
| 2026-01-20 | 13F | Meridian Investment Counsel Inc. | 51.202 | -3,98 | 1.778 | -3,21 | ||||
| 2026-02-09 | 13F | Leavell Investment Management, Inc. | 6.350 | -0,97 | 221 | 0,00 | ||||
| 2026-02-10 | 13F | David R. Rahn & Associates Inc. | 0 | -100,00 | 0 | |||||
| 2026-02-17 | 13F | Northern Trust Corp | 3.055.062 | -1,04 | 106.102 | -0,27 | ||||
| 2026-02-17 | 13F | Second Line Capital, LLC | 11.817 | 0,03 | 410 | 0,74 | ||||
| 2026-01-27 | 13F | Checchi Capital Advisers, LLC | 18.020 | -0,60 | 626 | 0,16 | ||||
| 2026-02-11 | 13F | Clifford Swan Investment Counsel Llc | 167.550 | -2,09 | 5.819 | -1,32 | ||||
| 2026-01-05 | 13F | Rosenberg Matthew Hamilton | 9.266 | -2,95 | 322 | -2,43 | ||||
| 2026-02-05 | 13F | Security National Bank | 200 | 0,00 | 7 | 0,00 | ||||
| 2026-02-05 | 13F | Noesis Capital Mangement Corp | 6.027 | 0,00 | 209 | 0,97 | ||||
| 2025-11-12 | 13F | Armis Advisers, LLC | 10.447 | 16,74 | 364 | 24,66 | ||||
| 2026-02-09 | 13F | Valtinson Bruner Financial Planning LLC | 5.965 | 0,00 | 207 | 0,98 | ||||
| 2026-01-29 | 13F | Argyle Capital Management Inc. | 25.407 | 0,00 | 882 | 0,80 | ||||
| 2026-02-02 | 13F | Horizon Investments, LLC | 0 | -100,00 | 0 | |||||
| 2026-01-21 | 13F | Carolina Wealth Advisors, LLC | 1.728 | 1,71 | 60 | 3,45 | ||||
| 2026-01-22 | 13F | Cliftonlarsonallen Wealth Advisors, Llc | 11.518 | 400 | ||||||
| 2026-02-09 | 13F | Malaga Cove Capital, LLC | 32.617 | 40,40 | 1.133 | 41,50 | ||||
| 2026-01-20 | 13F | Sovran Advisors, LLC | 11.788 | 1,48 | 414 | 2,73 | ||||
| 2026-01-28 | 13F | HB Wealth Management, LLC | 37.180 | 1,08 | 1.291 | 1,89 | ||||
| 2026-01-28 | 13F | CAPROCK Group, Inc. | 59.823 | 8,48 | 2.078 | 5,43 | ||||
| 2026-02-13 | 13F | Nicolet Advisory Services, Llc | 14.580 | 0,96 | 502 | -0,79 | ||||
| 2026-02-17 | 13F | Altrinsic Global Advisors Llc | 4.104.851 | -4,04 | 142.561 | -3,29 | ||||
| 2026-02-17 | 13F | Aquatic Capital Management LLC | 304.193 | -32,74 | 10.565 | -32,21 | ||||
| 2026-02-03 | 13F | Garner Asset Management Corp | 2.375 | -82,39 | 82 | -82,33 | ||||
| 2025-11-07 | 13F | Wealthcare Advisory Partners LLC | 0 | -100,00 | 0 | |||||
| 2026-01-09 | 13F | 180 Wealth Advisors, Llc | 8.538 | -1,26 | 297 | -0,34 | ||||
| 2026-02-04 | 13F | Patrick M Sweeney & Associates, Inc | 8.116 | 3,90 | 282 | 4,46 | ||||
| 2026-02-05 | 13F | ARS Investment Partners, LLC | 16.600 | 151,52 | 577 | 153,74 | ||||
| 2026-02-13 | 13F | Golden State Wealth Management, LLC | 1.594 | -1,18 | 55 | 0,00 | ||||
| 2026-02-17 | 13F | United Capital Financial Advisers, Llc | 34.788 | 12,91 | 1.208 | 13,85 | ||||
| 2026-02-03 | 13F | Ethic Inc. | 22.251 | 4,54 | 773 | 5,32 |