Grundlæggende statistik
| Institutionelle ejere | 444 total, 402 long only, 2 short only, 40 long/short - change of -28,87% MRQ |
| Del pris | 24,90 |
| Gennemsnitlig porteføljeallokering | 0.2557 % - change of -36,98% MRQ |
| Institutionelle aktier (lange) | 168.200.237 (ex 13D/G) - change of -83,90MM shares -33,28% MRQ |
| Institutionel værdi (lang) | $ 4.676.329 USD ($1000) |
Institutionelt ejerskab og aktionærer
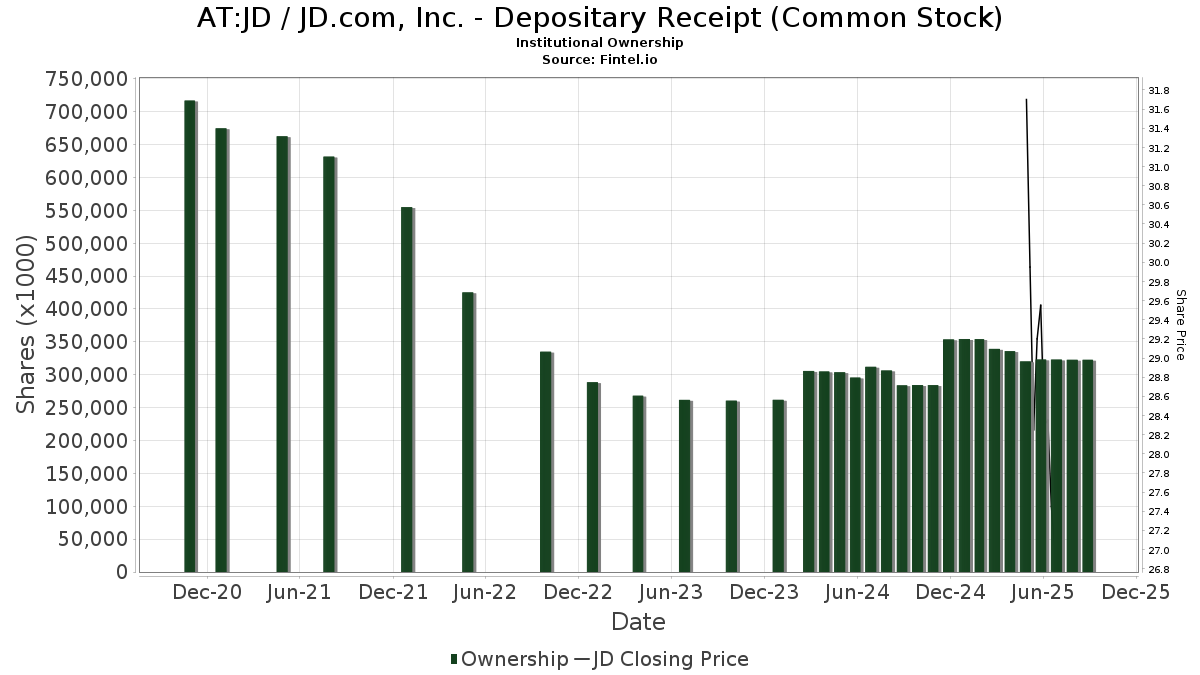
JD.com, Inc. - Depositary Receipt (Common Stock) (AT:JD) har 444 institutionelle ejere og aktionærer, der har indsendt 13D/G- eller 13F-formularer til Securities Exchange Commission (SEC). Disse institutioner har i alt 168,200,237 aktier. Største aktionærer omfatter Susquehanna International Group, Llp, Susquehanna International Group, Llp, Dodge & Cox, Invesco Ltd., FIL Ltd, Discerene Group LP, CoreView Capital Management Ltd, Morgan Stanley, Citadel Advisors Llc, and IMC-Chicago, LLC .
JD.com, Inc. - Depositary Receipt (Common Stock) (WBAG:JD) institutionel ejerskabsstruktur viser aktuelle positioner i virksomheden efter institutioner og fonde, samt seneste ændringer i positionsstørrelse. Større aktionærer kan omfatte individuelle investorer, investeringsforeninger, hedgefonde eller institutioner. Skema 13D angiver, at investoren besidder (eller besidder) mere end 5 % af virksomheden og har til hensigt (eller har til hensigt at) aktivt at forfølge en ændring i forretningsstrategi. Skema 13G indikerer en passiv investering på over 5%.
The share price as of April 1, 2026 is 24,90 / share. Previously, on May 9, 2025, the share price was 30,20 / share. This represents a decline of 17,55% over that period.
Fondens stemningsscore
Fund Sentiment Score (fka Ownership Accumulation Score) finder de aktier, der bliver mest købt af fonde. Det er resultatet af en sofistikeret, multi-faktor kvantitativ model, der identificerer virksomheder med de højeste niveauer af institutionel akkumulering. Scoringsmodellen bruger en kombination af den samlede stigning i oplyste ejere, ændringerne i porteføljeallokeringer i disse ejere og andre målinger. Tallet går fra 0 til 100, hvor højere tal indikerer et højere niveau af akkumulering for sine jævnaldrende, og 50 er gennemsnittet.
Opdateringsfrekvens: Dagligt
Se Ownership Explorer, som giver en liste over højest rangerende virksomheder.
AI+ Ask Fintel’s AI assistant about JD.com, Inc. - Depositary Receipt (Common Stock).
Select a question to share a public post with an AI-crafted answer.
Thinking of good questions…
13F og NPORT arkivering
Detaljer om 13F-arkivering er gratis. Detaljer om NP-ansøgninger kræver et premium-medlemskab. Grønne rækker angiver nye positioner. Røde rækker angiver lukkede positioner. Klik på linket ikon for at se den fulde transaktionshistorik.
Opgrader
for at låse premium-data op og eksportere til Excel ![]() .
.
| Fil dato | Kilde | Investor | Type | Gennemsnitlig pris (Øst) |
Aktier | Δ Aktier (%) |
Rapporteret Værdi ($1000) |
Δ Værdi (%) |
Port Alloc (%) |
|
|---|---|---|---|---|---|---|---|---|---|---|
| 2026-02-12 | 13F | Dimensional Fund Advisors Lp | 165.861 | -25,05 | 4.760 | -38,50 | ||||
| 2026-01-15 | 13F | Capital Advisors Inc/ok | 0 | -100,00 | 0 | |||||
| 2026-02-09 | 13F | Coldstream Capital Management Inc | 0 | -100,00 | 0 | -100,00 | ||||
| 2026-01-13 | 13F | Parsons Capital Management Inc/ri | 17.030 | 0,18 | 489 | -17,85 | ||||
| 2026-02-12 | 13F | Advisors Asset Management, Inc. | 36.320 | 13,47 | 1.042 | -6,88 | ||||
| 2026-02-10 | 13F | Crake Asset Management LLP | 236.400 | -75,02 | 6.785 | -79,51 | ||||
| 2026-03-20 | 13F/A | Hsbc Holdings Plc | Call | 44.900 | 1.286 | |||||
| 2026-02-17 | 13F | Banco Bilbao Vizcaya Argentaria, S.a. | 0 | -100,00 | 0 | |||||
| 2026-03-20 | 13F/A | Hsbc Holdings Plc | Put | 200 | 6 | |||||
| 2026-02-03 | 13F | Redwood Wealth Management Group, LLC | 10.084 | -3,42 | 289 | -20,82 | ||||
| 2026-01-29 | 13F | IMC-Chicago, LLC | 218.543 | -93,78 | 6.272 | -94,90 | ||||
| 2026-01-29 | 13F | IMC-Chicago, LLC | Put | 2.517.700 | -30,35 | 72.258 | -42,85 | |||
| 2026-01-29 | 13F | IMC-Chicago, LLC | Call | 5.271.500 | 34,56 | 151.292 | 10,40 | |||
| 2026-01-15 | 13F | Highline Wealth Partners Llc | 563 | 34,69 | 16 | 14,29 | ||||
| 2026-02-05 | 13F | Bank Julius Baer & Co. Ltd, Zurich | 0 | -100,00 | 0 | |||||
| 2026-02-06 | 13F | Global Retirement Partners, LLC | 1.899 | -6,87 | 55 | -23,94 | ||||
| 2026-02-13 | 13F | Morgan Stanley | 5.492.904 | -37,49 | 157.646 | -48,71 | ||||
| 2026-01-23 | 13F | Robeco Institutional Asset Management B.V. | 4.441.095 | 11,64 | 127.459 | -8,40 | ||||
| 2026-02-10 | 13F | State of Wyoming | 0 | -100,00 | 0 | |||||
| 2026-02-03 | 13F | Sequoia Financial Advisors, LLC | 31.818 | 105,96 | 913 | 69,07 | ||||
| 2026-02-03 | 13F | Credit Industriel Et Commercial | Put | 37.500 | 0,00 | 1.076 | -17,93 | |||
| 2026-01-07 | 13F | Aventura Private Wealth, LLC | 6 | 0,00 | 0 | |||||
| 2026-02-11 | 13F | Deutsche Bank Ag\ | 47.499 | -12,24 | 1.363 | -28,00 | ||||
| 2026-02-17 | 13F | Lonestar Capital Management LLC | 0 | -100,00 | 0 | |||||
| 2026-02-17 | 13F | Sender Co & Partners, Inc. | Call | 0 | -100,00 | 0 | ||||
| 2026-02-06 | 13F | Leonteq Securities AG | 93.672 | 17,93 | 2.688 | -3,24 | ||||
| 2026-02-06 | 13F | Leonteq Securities AG | Put | 100.000 | 941,67 | 2.870 | 756,72 | |||
| 2026-02-17 | 13F | Sender Co & Partners, Inc. | 0 | -100,00 | 0 | |||||
| 2025-11-14 | 13F | Financial Sense Advisors, Inc. | 0 | -100,00 | 0 | |||||
| 2026-02-12 | 13F | Aviva Plc | 99.664 | -6,21 | 2.860 | -23,06 | ||||
| 2026-02-17 | 13F | Sig Brokerage, Lp | Call | 14.800 | 425 | |||||
| 2026-02-13 | 13F | Brooklands Fund Management Ltd | Call | 0 | -100,00 | 0 | ||||
| 2026-01-23 | 13F | Bridgewater Advisors Inc. | 0 | -100,00 | 0 | |||||
| 2026-02-13 | 13F | Ubs Asset Management Americas Inc | 801 | 23 | ||||||
| 2026-02-02 | 13F | Ping Capital Management, Inc. | 42.000 | 1.205 | ||||||
| 2026-02-13 | 13F | NLB Skladi, upravljanje premozenja, d.o.o. | 34.965 | 1.003 | ||||||
| 2026-02-17 | 13F | Royal Bank Of Canada | 181.387 | 72,94 | 5.207 | 41,88 | ||||
| 2025-11-14 | 13F | Cubist Systematic Strategies, LLC | Call | 109.200 | 13,75 | 3.820 | 21,90 | |||
| 2026-02-13 | 13F | Bank Of Nova Scotia | 15.136 | -62,30 | 434 | -69,09 | ||||
| 2025-11-14 | 13F | Cubist Systematic Strategies, LLC | 42.456 | -87,72 | 1.485 | -86,84 | ||||
| 2026-02-03 | 13F | Manning & Napier Advisors Llc | 103.457 | -5,60 | 2.970 | -23,96 | ||||
| 2025-11-14 | 13F | Cubist Systematic Strategies, LLC | Put | 77.500 | 1.213,56 | 2.711 | 1.311,46 | |||
| 2025-11-14 | 13F | Wetherby Asset Management Inc | 24.617 | -3,71 | 861 | 3,24 | ||||
| 2026-02-12 | 13F | Principal Securities, Inc. | 0 | -100,00 | 0 | -100,00 | ||||
| 2026-02-17 | 13F | Qube Research & Technologies Ltd | 0 | -100,00 | 0 | |||||
| 2026-02-02 | 13F | Truist Financial Corp | 13.435 | -38,64 | 386 | -49,67 | ||||
| 2026-02-12 | 13F | Sit Investment Associates Inc | 0 | -100,00 | 0 | |||||
| 2026-02-12 | 13F | Federation des caisses Desjardins du Quebec | 8.200 | 1,33 | 235 | -16,96 | ||||
| 2026-01-13 | 13F | CoreCap Advisors, LLC | 24 | 0,00 | 1 | |||||
| 2026-02-17 | 13F | Parallax Volatility Advisers, L.P. | Put | 615.400 | -6,26 | 17.662 | -23,09 | |||
| 2026-02-06 | 13F | Gsa Capital Partners Llp | 16.156 | -4,29 | 0 | |||||
| 2026-02-17 | 13F | Parallax Volatility Advisers, L.P. | Call | 1.352.000 | 21,50 | 38.802 | -0,32 | |||
| 2025-11-13 | 13F | Total Investment Management Inc | 0 | -100,00 | 0 | |||||
| 2025-11-13 | 13F | Boston Partners | 0 | -100,00 | 0 | |||||
| 2026-02-03 | 13F | RD Finance Ltd | 40.750 | -50,00 | 1 | -50,00 | ||||
| 2026-02-17 | 13F | Parallax Volatility Advisers, L.P. | 12.030 | -92,23 | 345 | -93,63 | ||||
| 2026-01-23 | 13F | Rsm Us Wealth Management Llc | 39.237 | -0,62 | 1.126 | -18,46 | ||||
| 2026-02-12 | 13F | Skopos Labs, Inc. | 36.370 | 81,47 | 1.065 | 51,78 | ||||
| 2025-10-20 | 13F | CenterStar Asset Management, LLC | Call | 0 | -100,00 | 0 | ||||
| 2026-02-09 | 13F | Integrity Alliance, Llc. | 16.376 | 470 | ||||||
| 2026-02-17 | 13F | MIRAE ASSET GLOBAL ETFS HOLDINGS Ltd. | 66.942 | -13,55 | 1.921 | -29,11 | ||||
| 2026-01-20 | 13F | AdvisorNet Financial, Inc | 0 | -100,00 | 0 | |||||
| 2026-03-09 | 13F | Flax Pond Capital, Llc | 83.942 | 2.409 | ||||||
| 2026-02-13 | 13F | Allianz Se | 5.601 | 0,00 | 161 | -17,95 | ||||
| 2026-02-17 | 13F | XTX Topco Ltd | 23.816 | -49,59 | 684 | -58,66 | ||||
| 2026-02-03 | 13F | NewEdge Wealth, LLC | 154.827 | 4.444 | ||||||
| 2026-02-17 | 13F | Russell Investments Group, Ltd. | 598.188 | -39,72 | 17.168 | -50,91 | ||||
| 2026-02-12 | 13F | Quadrant Capital Group Llc | 20.643 | 333,86 | 592 | 256,63 | ||||
| 2026-02-12 | 13F | Intesa Sanpaolo Wealth Management | 0 | 0 | ||||||
| 2026-02-17 | 13F | EFG International AG | 1.270 | 36 | ||||||
| 2026-02-11 | 13F | LPL Financial LLC | Call | 54.000 | 480,65 | 1.550 | 376,62 | |||
| 2026-02-12 | 13F | Federated Hermes, Inc. | 2.619.476 | 15,89 | 75.179 | -4,92 | ||||
| 2026-02-12 | 13F | Scotia Capital Inc. | 0 | -100,00 | 0 | |||||
| 2025-11-07 | 13F | Sierra Ocean, Llc | 0 | -100,00 | 0 | |||||
| 2025-11-14 | 13F | Binnacle Investments Inc | 750 | 365,84 | 26 | 420,00 | ||||
| 2026-02-13 | 13F | Wexford Capital Lp | 1.367 | 12,14 | 39 | -7,14 | ||||
| 2026-02-03 | 13F | Harel Insurance Investments & Financial Services Ltd. | 292 | 0,00 | 0 | |||||
| 2026-02-17 | 13F | Steamboat Capital Partners, LLC | 44.250 | -0,06 | 1.270 | -18,02 | ||||
| 2026-02-24 | 13F | Bell Investment Advisors, Inc | 436 | 34,15 | 13 | 9,09 | ||||
| 2026-02-13 | 13F | Mariner, LLC | 24.398 | -9,91 | 700 | -26,08 | ||||
| 2026-02-13 | 13F | Centerpoint Advisors, LLC | 25 | 0,00 | 0 | |||||
| 2026-01-22 | 13F | Triad Wealth Partners, LLC | 9.205 | 0,12 | 264 | -17,76 | ||||
| 2026-02-09 | 13F | Fisher Asset Management, LLC | 3.331.848 | -1,24 | 95.624 | -18,97 | ||||
| 2026-02-02 | 13F | Cornerstone Planning Group LLC | 550 | 22,22 | 16 | 6,67 | ||||
| 2026-02-13 | 13F | Pathstone Holdings, LLC | 16.391 | -15,81 | 470 | -30,98 | ||||
| 2025-11-13 | 13F | Clear Street Markets Llc | 0 | -100,00 | 0 | |||||
| 2026-02-05 | 13F | Cambridge Investment Research Advisors, Inc. | 17.994 | 68,53 | 1 | |||||
| 2026-02-05 | 13F | Td Private Client Wealth Llc | 1 | 0,00 | 0 | |||||
| 2025-11-03 | 13F | Hallmark Capital Management Inc | 0 | -100,00 | 0 | -100,00 | ||||
| 2026-02-06 | 13F | IFP Advisors, Inc | 1.418 | -66,35 | 41 | -72,79 | ||||
| 2026-02-03 | 13F | Ballentine Partners, LLC | 11.554 | -16,30 | 332 | -31,33 | ||||
| 2026-02-17 | 13F | Grantham, Mayo, Van Otterloo & Co. LLC | 0 | -100,00 | 0 | |||||
| 2025-11-13 | 13F | Causeway Capital Management Llc | 0 | -100,00 | 0 | -100,00 | ||||
| 2026-01-26 | 13F | Main Street Group, LTD | 0 | -100,00 | 0 | -100,00 | ||||
| 2026-02-13 | 13F | Macquarie Group Ltd | 0 | -100,00 | 0 | |||||
| 2026-02-17 | 13F | Raymond James Financial Inc | Call | 100 | 0,00 | 5 | 0,00 | |||
| 2026-02-17 | 13F | Raymond James Financial Inc | 107.266 | 21,81 | 3.079 | -0,06 | ||||
| 2025-11-06 | 13F | BridgePort Financial Solutions, LLC | 0 | -100,00 | 0 | |||||
| 2026-02-18 | 13F | Warther Private Wealth, LLC | 0 | -100,00 | 0 | |||||
| 2026-01-16 | 13F | Tempus Wealth Planning, LLC | 30.984 | 16,57 | 889 | -4,31 | ||||
| 2026-02-17 | 13F | Citadel Advisors Llc | Put | 5.145.200 | -17,41 | 147.667 | -32,24 | |||
| 2026-02-17 | 13F | Citadel Advisors Llc | 2.787.360 | -9,42 | 79.997 | -25,68 | ||||
| 2026-01-26 | 13F | Patriot Financial Group Insurance Agency, LLC | 10.329 | -0,27 | 296 | -18,23 | ||||
| 2026-02-11 | 13F | Franklin Resources Inc | 9.559 | -42,06 | 274 | -52,51 | ||||
| 2026-02-17 | 13F | Bayesian Capital Management, LP | 0 | -100,00 | 0 | |||||
| 2025-11-12 | 13F | Anfield Capital Management, LLC | 0 | -100,00 | 0 | |||||
| 2026-02-10 | 13F | Monaco Asset Management SAM | 160.000 | 60,00 | 4.592 | 31,28 | ||||
| 2025-11-14 | 13F | XY Capital Ltd | 0 | -100,00 | 0 | |||||
| 2026-02-17 | 13F | Citadel Advisors Llc | Call | 5.350.800 | -37,74 | 153.568 | -48,92 | |||
| 2026-02-10 | 13F | Nomura Asset Management Co Ltd | 14.850 | 0,00 | 426 | -17,92 | ||||
| 2026-02-12 | 13F | BlackRock, Inc. | 4.455.661 | 23,56 | 127.877 | 1,37 | ||||
| 2026-02-13 | 13F | Brooklands Fund Management Ltd | 68 | 19 | ||||||
| 2026-02-17 | 13F | Balyasny Asset Management Llc | 163.614 | 4.696 | ||||||
| 2026-02-17 | 13F | Balyasny Asset Management Llc | Call | 816.200 | -27,31 | 23.425 | -40,37 | |||
| 2026-02-17 | 13F | Balyasny Asset Management Llc | Put | 863.800 | 85,80 | 24.791 | 52,45 | |||
| 2026-02-05 | 13F | Atria Investments Llc | 8.047 | -31,16 | 231 | -43,63 | ||||
| 2026-02-11 | 13F | Jessup Wealth Management, Inc | 1.050 | 30 | ||||||
| 2026-02-10 | 13F/A | Guinness Atkinson Asset Management Inc | 32.438 | 0,00 | 949 | -17,91 | ||||
| 2026-02-03 | 13F | SBI Securities Co., Ltd. | 12.224 | 36,11 | 351 | 11,46 | ||||
| 2026-02-17 | 13F | ExodusPoint Capital Management, LP | Call | 0 | -100,00 | 0 | -100,00 | |||
| 2026-02-17 | 13F | Newlands Management Operations LLC | 0 | -100,00 | 0 | |||||
| 2025-11-03 | 13F | Scion Asset Management, LLC | Call | 0 | -100,00 | 0 | -100,00 | |||
| 2026-02-17 | 13F | Capstone Investment Advisors, Llc | Call | 0 | -100,00 | 0 | -100,00 | |||
| 2026-02-17 | 13F | Capstone Investment Advisors, Llc | Put | 0 | -100,00 | 0 | -100,00 | |||
| 2026-02-13 | 13F | L1 Capital Pty Ltd | 730.264 | 20.959 | ||||||
| 2026-01-23 | 13F | Assetmark, Inc | 1.158 | 11,03 | 33 | -8,33 | ||||
| 2026-02-13 | 13F | Caxton Associates Llp | 0 | -100,00 | 0 | |||||
| 2025-11-14 | 13F | Wolverine Trading, Llc | Put | 625.200 | 46,07 | 22.282 | 57,44 | |||
| 2026-01-23 | 13F | Ritholtz Wealth Management | 84.748 | -3,35 | 2.432 | -20,70 | ||||
| 2026-02-11 | 13F | LPL Financial LLC | 250.687 | 1,19 | 7.195 | -16,99 | ||||
| 2026-01-12 | 13F | Byrne Asset Management LLC | 500 | 42,86 | 14 | 16,67 | ||||
| 2026-02-17 | 13F | Jones Financial Companies Lllp | 32.302 | 8,68 | 927 | -9,56 | ||||
| 2026-02-10 | 13F | Natixis Advisors, L.p. | 72.244 | -4,34 | 2 | 0,00 | ||||
| 2026-02-17 | 13F | Equitable Holdings, Inc. | 19.723 | -21,43 | 566 | -35,54 | ||||
| 2026-01-30 | 13F | Us Bancorp \de\ | 25.749 | -37,47 | 739 | -48,75 | ||||
| 2026-02-10 | 13F | Baker Avenue Asset Management, LP | 110.752 | 6,74 | 3.179 | -12,43 | ||||
| 2025-11-14 | 13F | Wolverine Trading, Llc | 351.661 | 1.059,07 | 12.533 | 1.149,55 | ||||
| 2026-01-22 | 13F | Glass Jacobson Investment Advisors llc | 25 | 0,00 | 1 | |||||
| 2026-02-13 | 13F | Discerene Group LP | 6.210.851 | 0,00 | 178.251 | -17,95 | ||||
| 2026-02-17 | 13F | Massar Capital Management, LP | 110.200 | 0,00 | 3.163 | -17,96 | ||||
| 2025-11-14 | 13F | Wolverine Trading, Llc | Call | 942.300 | 66,16 | 33.584 | 79,08 | |||
| 2026-02-02 | 13F | Davis Selected Advisers | 329.221 | -3,66 | 9.449 | -20,96 | ||||
| 2026-01-30 | 13F | Mitsubishi UFJ Trust & Banking Corp | 296.208 | -11,10 | 8.501 | -27,06 | ||||
| 2026-02-17 | 13F | Delaware Management Holdings, Inc. | 1.751.720 | 50.274 | ||||||
| 2026-02-10 | 13F | Bnp Paribas Arbitrage, Sa | Put | 0 | -100,00 | 0 | -100,00 | |||
| 2026-02-17 | 13F | TB Capital Gestao de Recursos Ltda. | 0 | -100,00 | 0 | |||||
| 2026-02-17 | 13F | Advisor Group Holdings, Inc. | 72.853 | -33,12 | 2.091 | -41,37 | ||||
| 2025-11-07 | 13F | Beacon Capital Management, LLC | 0 | -100,00 | 0 | |||||
| 2026-02-13 | 13F | Charles Schwab Investment Management Inc | 4.250.324 | 15,27 | 121.984 | -5,43 | ||||
| 2026-02-17 | 13F | CoreView Capital Management Ltd | 6.197.455 | 0,00 | 177.867 | -17,95 | ||||
| 2026-01-13 | 13F | Syquant Capital Sas | 1.230.769 | 35 | ||||||
| 2026-02-17 | 13F | Synergy Financial Group, LTD | 8.763 | 4,51 | 251 | -14,33 | ||||
| 2026-02-17 | 13F | Caption Management, LLC | Put | 0 | -100,00 | 0 | -100,00 | |||
| 2026-02-09 | 13F | Legal & General Group Plc | 1.545.460 | 4,75 | 44.346 | -14,07 | ||||
| 2026-02-12 | 13F | North of South Capital LLP | 4.253.012 | 4,42 | 122.061 | -14,33 | ||||
| 2026-01-27 | 13F | WealthCollab, LLC | 484 | 0,00 | 14 | -18,75 | ||||
| 2026-02-13 | 13F | Dodge & Cox | 12.194.648 | -35,11 | 349.986 | -46,76 | ||||
| 2025-10-30 | 13F | Ridgewood Investments LLC | 18.759 | 316,87 | 656 | 349,32 | ||||
| 2026-01-08 | 13F | True Wealth Design, LLC | 26 | -67,09 | 1 | -100,00 | ||||
| 2026-02-17 | 13F | Bellevue Group AG | 11.000 | 316 | ||||||
| 2025-11-12 | 13F | Orland Properties Ltd | 0 | -100,00 | 0 | |||||
| 2026-01-27 | 13F | Evergreen Capital Management Llc | 0 | -100,00 | 0 | |||||
| 2026-01-16 | 13F | Compagnie Lombard Odier SCmA | 900 | -81,05 | 26 | -84,94 | ||||
| 2026-02-11 | 13F | Mirae Asset Securities (usa) Inc. | Put | 100.245 | 2.870 | |||||
| 2026-02-05 | 13F | Abacus Wealth Partners, LLC | 12.368 | 355 | ||||||
| 2026-02-10 | 13F | Parametrica Management Ltd | 0 | -100,00 | 0 | |||||
| 2026-02-02 | 13F | Qrg Capital Management, Inc. | 24.369 | -25,03 | 699 | -38,47 | ||||
| 2026-02-02 | 13F | Wolverine Asset Management Llc | Call | 12.800 | 367 | |||||
| 2026-02-10 | 13F | Measured Wealth Private Client Group, LLC | 1 | 0 | ||||||
| 2026-02-06 | 13F | Banque Cantonale Vaudoise | 72.051 | 51,29 | 2.068 | 206.700,00 | ||||
| 2026-02-17 | 13F/A | Kovack Advisors, Inc. | 7.134 | 205 | ||||||
| 2026-01-21 | 13F | Greenleaf Trust | 8.005 | -5,89 | 230 | -22,90 | ||||
| 2026-02-12 | 13F | Hollencrest Capital Management | 168 | 0,00 | 5 | -20,00 | ||||
| 2026-02-17 | 13F | Nomura Holdings Inc | 60.110 | -52,10 | 1.725 | -60,70 | ||||
| 2025-10-22 | 13F | Geneos Wealth Management Inc. | 0 | -100,00 | 0 | |||||
| 2026-02-17 | 13F | Nomura Holdings Inc | Call | 138.600 | 0,00 | 3.978 | -17,97 | |||
| 2026-02-10 | 13F | Texas Yale Capital Corp. | 14.008 | 2,94 | 402 | -15,55 | ||||
| 2026-02-12 | 13F | Triumph Capital Management | 653 | 21.666,67 | 19 | |||||
| 2026-02-17 | 13F | Owl Creek Asset Management, L.P. | 0 | -100,00 | 0 | |||||
| 2026-01-26 | 13F | PDS Planning, Inc | 7.693 | -6,57 | 221 | -23,61 | ||||
| 2026-02-04 | 13F | Drive Wealth Management, Llc | 0 | -100,00 | 0 | |||||
| 2026-02-13 | 13F | Citigroup Inc | Put | 620.000 | 90,77 | 17.794 | 56,53 | |||
| 2026-02-13 | 13F | Marathon Trading Investment Management LLC | 605.197 | 34,56 | 17.369 | 10,41 | ||||
| 2026-02-05 | 13F | Bessemer Group Inc | 0 | 0 | ||||||
| 2026-02-11 | 13F | J.w. Cole Advisors, Inc. | 0 | -100,00 | 0 | |||||
| 2026-02-03 | 13F | Gateway Investment Advisers Llc | 7.862 | 0,18 | 226 | -17,88 | ||||
| 2026-02-12 | 13F | BRYN MAWR TRUST Co | 0 | -100,00 | 0 | -100,00 | ||||
| 2026-02-13 | 13F | Marathon Trading Investment Management LLC | Call | 79.300 | -70,26 | 2.276 | -75,60 | |||
| 2026-02-13 | 13F | Marathon Trading Investment Management LLC | Put | 884.800 | 30,04 | 25.394 | 6,69 | |||
| 2025-11-12 | 13F | West Family Investments, Inc. | 0 | -100,00 | 0 | |||||
| 2026-01-14 | 13F | Generali Investments CEE, investicni spolecnost, a.s. | 27.526 | -25,25 | 790 | -38,74 | ||||
| 2026-01-22 | 13F | Maseco Llp | 70 | 0,00 | 2 | 0,00 | ||||
| 2026-02-17 | 13F | Tower Research Capital LLC (TRC) | 81 | 97,56 | 2 | 100,00 | ||||
| 2025-11-03 | 13F | Eos Management, L.P. | 0 | -100,00 | 0 | |||||
| 2025-11-12 | 13F | Headlands Technologies LLC | 0 | -100,00 | 0 | |||||
| 2026-02-11 | 13F | First Command Advisory Services, Inc. | 300 | 0,00 | 9 | -20,00 | ||||
| 2026-01-20 | 13F | Polunin Capital Partners Ltd | 1.947.668 | -1,23 | 56 | -18,84 | ||||
| 2026-01-14 | 13F | TrueMark Investments, LLC | 70.611 | 14,94 | 2.027 | -5,68 | ||||
| 2026-03-31 | 13F | Sankala Group LLC | 46 | 0,00 | 1 | 0,00 | ||||
| 2026-01-29 | 13F | Coronation Fund Managers Ltd. | 8.741 | -31,59 | 251 | -43,95 | ||||
| 2026-02-17 | 13F | Cetera Investment Advisers | 96.480 | -11,54 | 2.769 | -27,44 | ||||
| 2026-02-17 | 13F | Millennium Management Llc | Call | 1.840.900 | -25,02 | 52.834 | -38,48 | |||
| 2026-02-17 | 13F | Millennium Management Llc | Put | 793.400 | -58,99 | 22.771 | -66,35 | |||
| 2026-02-20 | 13F/A | CMT Capital Markets Trading GmbH | Put | 96.000 | -43,36 | 3 | -60,00 | |||
| 2026-02-17 | 13F | Millennium Management Llc | 408.989 | -58,47 | 11.738 | -65,93 | ||||
| 2026-02-20 | 13F/A | CMT Capital Markets Trading GmbH | Call | 511.800 | 88,44 | 15 | 55,56 | |||
| 2026-02-03 | 13F | Strengthening Families & Communities, LLC | 1.700 | 49 | ||||||
| 2025-11-13 | 13F | AI-Squared Management Ltd | 0 | -100,00 | 0 | |||||
| 2026-02-17 | 13F | Guggenheim Capital Llc | 41.960 | -10,73 | 1.204 | -26,76 | ||||
| 2026-02-13 | 13F | Peak6 Llc | Put | 696.000 | 16,86 | 19.975 | -4,12 | |||
| 2025-11-13 | 13F | Arrowstreet Capital, Limited Partnership | 0 | -100,00 | 0 | |||||
| 2026-02-13 | 13F | Peak6 Llc | 142.275 | -71,32 | 4.083 | -76,47 | ||||
| 2026-02-13 | 13F | Peak6 Llc | Call | 17.200 | -94,41 | 494 | -95,42 | |||
| 2026-02-19 | 13F | CI Private Wealth, LLC | 81.127 | 158,43 | 738 | -32,79 | ||||
| 2026-02-17 | 13F | Ardmore Road Asset Management LP | 0 | -100,00 | 0 | |||||
| 2025-11-14 | 13F | Lombard Odier Asset Management (Europe) Ltd | 18.482 | |||||||
| 2026-02-13 | 13F | Van Eck Associates Corp | 201.811 | -32,28 | 6 | -50,00 | ||||
| 2026-02-06 | 13F | Fairtree Asset Management (Pty) Ltd | 178.173 | 8,26 | 5.114 | -11,17 | ||||
| 2026-02-12 | 13F | Campbell & CO Investment Adviser LLC | 0 | -100,00 | 0 | |||||
| 2026-02-09 | 13F | Todd Asset Management Llc | 887.059 | -20,56 | 25.459 | -34,82 | ||||
| 2026-02-17 | 13F | J. Goldman & Co LP | Call | 0 | -100,00 | 0 | ||||
| 2026-02-09 | 13F | Huntington National Bank | 1.432 | -27,09 | 41 | -39,71 | ||||
| 2026-02-12 | 13F | CIBC Private Wealth Group, LLC | 496 | -27,70 | 14 | -39,13 | ||||
| 2026-01-21 | 13F | Future Financial Wealth Managment LLC | 0 | -100,00 | 0 | |||||
| 2026-01-27 | 13F | Institute for Wealth Management, LLC. | 9.969 | -11,92 | 286 | -27,59 | ||||
| 2026-02-09 | 13F | Guinness Asset Management LTD | 5.443 | 10,86 | 159 | -8,62 | ||||
| 2026-02-12 | 13F | Alps Advisors Inc | 16.837 | 0,89 | 483 | -17,15 | ||||
| 2026-02-09 | 13F | Hantz Financial Services, Inc. | 27.160 | 59,31 | 1 | |||||
| 2026-02-03 | 13F | Costello Asset Management, INC | 200 | 6 | ||||||
| 2026-01-21 | 13F | Prime Capital Investment Advisors, LLC | 22.034 | -13,32 | 632 | -28,91 | ||||
| 2026-02-11 | 13F | Vise Technologies, Inc. | 51.216 | 5,62 | 1.470 | -13,38 | ||||
| 2026-02-17 | 13F | Amundi | 159.005 | -47,01 | 4.563 | -57,65 | ||||
| 2026-01-09 | 13F | SG Americas Securities, LLC | Put | 156.800 | -91,20 | 1 | ||||
| 2026-02-17 | 13F | Farringdon Capital, Ltd. | 0 | -100,00 | 0 | |||||
| 2025-11-05 | 13F | Renaissance Group Llc | 0 | -100,00 | 0 | -100,00 | ||||
| 2026-01-30 | 13F | Harbor Advisors LLC | 14.000 | 0,00 | 402 | -18,00 | ||||
| 2026-02-05 | 13F | High Note Wealth, LLC | 0 | -100,00 | 0 | |||||
| 2026-01-09 | 13F | SG Americas Securities, LLC | Call | 279.800 | 94,58 | 0 | ||||
| 2026-02-18 | 13F | Mackenzie Financial Corp | 290.637 | 0,75 | 8.328 | -17,47 | ||||
| 2025-11-13 | 13F | Riggs Asset Managment Co. Inc. | 0 | -100,00 | 0 | |||||
| 2026-01-29 | 13F | Anchyra Partners Llc | 7.009 | 201 | ||||||
| 2025-11-13 | 13F | Capital International Investors | 0 | -100,00 | 0 | |||||
| 2026-02-17 | 13F | Marathon Asset Management Lp | 75.000 | 50,00 | 2.136 | 22,13 | ||||
| 2026-01-09 | 13F | 180 Wealth Advisors, Llc | 18.895 | 4,63 | 542 | -14,10 | ||||
| 2026-01-22 | 13F | Trilogy Capital Inc. | Call | 118.500 | 13,40 | 53 | -81,56 | |||
| 2026-01-22 | 13F | Trilogy Capital Inc. | 215.903 | 26,81 | 6.196 | 4,05 | ||||
| 2025-10-30 | 13F | Twin Peaks Wealth Advisors, LLC | 0 | -100,00 | 0 | |||||
| 2025-11-13 | 13F | Eisler Capital Management Ltd. | Put | 705.300 | 476,23 | 24.643 | 516,85 | |||
| 2026-02-11 | 13F | Modus Advisors, LLC | 1.833 | 53 | ||||||
| 2026-02-17 | 13F | Summit Trail Advisors, Llc | 0 | -100,00 | 0 | |||||
| 2025-11-06 | 13F | CENTRAL TRUST Co | 0 | -100,00 | 0 | |||||
| 2025-11-13 | 13F | Eisler Capital Management Ltd. | 3.317 | -93,21 | 116 | -92,79 | ||||
| 2025-11-13 | 13F | Eisler Capital Management Ltd. | Call | 180.300 | 555,64 | 6.300 | 602,23 | |||
| 2026-02-03 | 13F | Maxi Investments CY Ltd | 19.000 | 0,00 | 1 | |||||
| 2026-02-06 | 13F | GPS Wealth Strategies Group, LLC | 0 | -100,00 | 0 | |||||
| 2026-02-13 | 13F | Boreal Capital Management LLC | 0 | -100,00 | 0 | |||||
| 2026-01-08 | 13F | Aurora Investment Managers, LLC. | 273.077 | 1,33 | 8 | -22,22 | ||||
| 2026-03-10 | 13F | PeakShares LLC | 3.500 | 100 | ||||||
| 2026-01-27 | 13F | Bayforest Capital Ltd | 2.789 | -78,12 | 80 | -82,02 | ||||
| 2026-02-06 | 13F | Fortis Group Advisors, LLC | 8.802 | -88,22 | 251 | -89,87 | ||||
| 2026-02-10 | 13F | CIBC World Markets Inc. | 259.519 | 15,22 | 7.448 | -5,47 | ||||
| 2026-02-11 | 13F | IMA Wealth, Inc. | 61 | 2 | ||||||
| 2026-01-09 | 13F | Assenagon Asset Management S.A. | 1.135.700 | 8,10 | 32.595 | -11,30 | ||||
| 2026-01-15 | 13F | Range Financial Group LLC | 62.366 | 1.790 | ||||||
| 2025-11-03 | 13F | Wealthspan Partners, Llc | Call | 665 | ||||||
| 2026-01-14 | 13F | Exchange Traded Concepts, Llc | 211.139 | 21,59 | 6.060 | -0,25 | ||||
| 2025-10-29 | 13F | Arkadios Wealth Advisors | 0 | -100,00 | 0 | |||||
| 2026-01-28 | 13F | B. Metzler seel. Sohn & Co. AG | 0 | -100,00 | 0 | |||||
| 2025-11-14 | 13F | Caption Management, LLC | Call | 0 | -100,00 | 0 | -100,00 | |||
| 2026-02-14 | 13F | Militia Capital Partners, LP | 57.500 | 0,00 | 1.650 | -17,95 | ||||
| 2025-10-15 | 13F | Norden Group Llc | 0 | -100,00 | 0 | |||||
| 2026-02-23 | 13F | Leonteq Securities AG | Call | 0 | -100,00 | 0 | -100,00 | |||
| 2026-02-13 | 13F | Walleye Trading LLC | Call | 1.229.400 | 54,49 | 35.284 | 26,75 | |||
| 2026-02-13 | 13F | Parkside Financial Bank & Trust | 24 | 0,00 | 1 | |||||
| 2026-02-13 | 13F | Walleye Trading LLC | 1.365.657 | -57,39 | 39.194 | -65,04 | ||||
| 2026-02-13 | 13F | Walleye Trading LLC | Put | 5.255.600 | 45,73 | 150.836 | 19,56 | |||
| 2026-01-30 | 13F | Archer Investment Corp | 61 | 0,00 | 2 | -50,00 | ||||
| 2025-11-14 | 13F | Infusive Asset Management Inc. | 0 | -100,00 | 0 | |||||
| 2026-01-14 | 13F | Congress Park Capital LLC | 7.325 | 210 | ||||||
| 2025-11-14 | 13F | Silvercrest Asset Management Group Llc | 0 | -100,00 | 0 | -100,00 | ||||
| 2026-02-13 | 13F | Sei Investments Co | 97.797 | 88,08 | 2.807 | 54,35 | ||||
| 2026-02-13 | 13F | Mml Investors Services, Llc | 15.268 | -6,31 | 438 | -23,16 | ||||
| 2025-11-12 | 13F | Transce3nd, LLC | 0 | -100,00 | 0 | |||||
| 2026-02-06 | 13F | Larson Financial Group LLC | 845 | -41,96 | 24 | -52,00 | ||||
| 2026-02-13 | 13F | Smartleaf Asset Management LLC | 207 | -17,20 | 6 | -37,50 | ||||
| 2026-02-13 | 13F | Atlas Capital Advisors Llc | 14.589 | -11,82 | 419 | -22,45 | ||||
| 2026-02-17 | 13F | Lazard Asset Management Llc | 426.292 | 10,37 | 12.235 | -9,44 | ||||
| 2026-02-17 | 13F | Dark Forest Capital Management Lp | 0 | -100,00 | 0 | |||||
| 2026-02-17 | 13F | Mercer Global Advisors Inc /adv | 13.680 | -15,08 | 393 | -30,37 | ||||
| 2026-02-12 | 13F | Steward Partners Investment Advisory, Llc | 1.325 | -67,88 | 38 | -73,61 | ||||
| 2026-02-13 | 13F | Capula Management Ltd | Call | 0 | -100,00 | 0 | -100,00 | |||
| 2026-01-26 | 13F | Quadrant Private Wealth Management, LLC | 32.818 | 4,05 | 942 | -14,69 | ||||
| 2026-02-11 | 13F | O'shaughnessy Asset Management, Llc | 230.285 | -18,90 | 6.609 | -33,46 | ||||
| 2026-02-13 | 13F | Pinpoint Asset Management (Singapore) Pte. Ltd. | 7.245 | 208 | ||||||
| 2026-02-17 | 13F | Elequin Capital Lp | 442 | 13 | ||||||
| 2025-11-06 | 13F | Blume Capital Management, Inc. | 0 | -100,00 | 0 | |||||
| 2026-01-23 | 13F | Brown, Lisle/cummings, Inc. | 85 | 0,00 | 2 | 0,00 | ||||
| 2026-02-09 | 13F | Frazier Financial Advisors, LLC | 0 | -100,00 | 0 | |||||
| 2025-11-14 | 13F | Jain Global LLC | 0 | -100,00 | 0 | |||||
| 2025-11-04 | 13F | Veritas Asset Management LLP | 0 | -100,00 | 0 | -100,00 | ||||
| 2026-02-10 | 13F | Greenwich Wealth Management LLC | 0 | -100,00 | 0 | |||||
| 2026-02-13 | 13F | JustInvest LLC | 28.851 | 0,32 | 828 | -17,69 | ||||
| 2026-01-15 | 13F | Royal Fund Management, LLC | Call | 0 | -100,00 | 0 | ||||
| 2026-01-15 | 13F | Royal Fund Management, LLC | 0 | -100,00 | 0 | |||||
| 2026-02-20 | 13F | Sunbelt Securities, Inc. | 7.520 | 0,00 | 216 | -18,25 | ||||
| 2026-02-12 | 13F | SWAN Capital LLC | 35 | 0,00 | 1 | 0,00 | ||||
| 2026-02-17 | 13F | Appaloosa Lp | 4.157.046 | -33,22 | 119.307 | -45,21 | ||||
| 2026-01-21 | 13F | Lakeshore Capital Group, Inc. | 16.401 | 3,24 | 471 | -15,32 | ||||
| 2026-01-14 | 13F | Spire Wealth Management | 264 | 0,00 | 8 | -22,22 | ||||
| 2026-02-09 | 13F | Rooted Wealth Advisors, Inc. | 0 | -100,00 | 0 | |||||
| 2026-02-17 | 13F | Private Advisor Group, LLC | 74.024 | -7,31 | 2.124 | -23,95 | ||||
| 2026-02-13 | 13F | Bridgefront Capital, LLC | 11.695 | 336 | ||||||
| 2026-02-17 | 13F | Ancora Advisors, LLC | 86 | -76,31 | 2 | -83,33 | ||||
| 2026-02-17 | 13F | Long Focus Capital Management, Llc | 896.183 | 36,74 | 25.720 | 12,19 | ||||
| 2026-02-13 | 13F | Fifth Lane Capital, Lp | 0 | -100,00 | 0 | |||||
| 2026-02-13 | 13F | American Century Companies Inc | 565.977 | 163,62 | 16.244 | 116,28 | ||||
| 2025-11-14 | 13F | Axa S.a. | 0 | -100,00 | 0 | |||||
| 2026-02-17 | 13F | Quantinno Capital Management LP | 65.835 | 5,79 | 1.889 | -13,19 | ||||
| 2026-02-17 | 13F | HighVista Strategies LLC | 17.463 | -25,32 | 501 | -38,68 | ||||
| 2025-11-13 | 13F | Rehmann Capital Advisory Group | 0 | -100,00 | 0 | |||||
| 2026-02-06 | 13F | Handelsbanken Fonder AB | 357.000 | -48,03 | 10 | -58,33 | ||||
| 2026-02-20 | 13F/A | CMT Capital Markets Trading GmbH | 20.350 | -69,85 | 1 | -100,00 | ||||
| 2025-11-13 | 13F | Norges Bank | 0 | -100,00 | 0 | |||||
| 2026-01-16 | 13F | FNY Investment Advisers, LLC | 27.200 | -34,51 | 1 | -100,00 | ||||
| 2026-02-13 | 13F | Gts Securities Llc | 14.985 | -65,13 | 430 | -71,39 | ||||
| 2026-02-17 | 13F | Engineers Gate Manager LP | 113.955 | 3.271 | ||||||
| 2026-02-11 | 13F | Vermillion Wealth Management, Inc. | 121 | 0,00 | 3 | -25,00 | ||||
| 2026-02-13 | 13F | First Trust Advisors Lp | 165.394 | 10,72 | 4.747 | -9,17 | ||||
| 2025-10-31 | 13F | Whittier Trust Co | 0 | -100,00 | 0 | |||||
| 2026-02-13 | 13F | Polymer Capital Management (HK) LTD | 120.000 | 1.900,00 | 3.444 | 1.547,85 | ||||
| 2026-02-12 | 13F | Groupe la Francaise | 0 | -100,00 | 0 | |||||
| 2026-01-20 | 13F | Perpetual Ltd | 577.410 | 1,60 | 16.572 | -16,64 | ||||
| 2026-01-29 | 13F | Vanguard Group Inc | 0 | -100,00 | 0 | -100,00 | ||||
| 2026-02-10 | 13F | Clear Harbor Asset Management, LLC | 27.349 | -9,24 | 785 | -25,62 | ||||
| 2026-02-03 | 13F | Ethic Inc. | 36.685 | -2,11 | 1.053 | -19,69 | ||||
| 2026-02-02 | 13F | Wolverine Asset Management Llc | Put | 181.400 | 70,49 | 5.206 | 39,91 | |||
| 2026-02-05 | 13F | Park Square Financial Group, LLC | 379 | 13 | ||||||
| 2026-02-05 | 13F | Rahlfs Capital, Llc | 7.550 | 0,00 | 217 | -18,18 | ||||
| 2026-02-13 | 13F | Nfj Investment Group, Llc | 699.518 | 61,79 | 20.076 | 32,75 | ||||
| 2026-01-23 | 13F | Sumitomo Mitsui Trust Holdings, Inc. | 8.875 | 0,00 | 255 | -18,06 | ||||
| 2026-02-17 | 13F | ADAR1 Capital Management, LLC | 10.000 | 0,00 | 287 | -17,77 | ||||
| 2026-02-17 | 13F | Rexford Capital Inc | 300 | 0,00 | 9 | -20,00 | ||||
| 2026-02-11 | 13F | Parallel Advisors, LLC | 4.996 | -1,60 | 143 | -19,21 | ||||
| 2026-02-18 | 13F | Galaxy Group Investments LLC | 0 | -100,00 | 0 | |||||
| 2026-02-04 | 13F | HighPoint Advisor Group LLC | 32.327 | -37,53 | 928 | -48,78 | ||||
| 2026-01-27 | 13F | TD Waterhouse Canada Inc. | 3.490 | 149,29 | 100 | 100,00 | ||||
| 2026-02-17 | 13F | DZ BANK AG Deutsche Zentral Genossenschafts Bank, Frankfurt am Main | 42.897 | 8,35 | 1.240 | -10,27 | ||||
| 2026-02-13 | 13F/A | Alberta Investment Management Corp | 0 | -100,00 | 0 | |||||
| 2026-01-26 | 13F | KBC Group NV | 256.828 | -8,61 | 7 | -22,22 | ||||
| 2026-02-17 | 13F | Prelude Capital Management, Llc | 24.328 | -39,79 | 698 | -50,60 | ||||
| 2025-11-14 | 13F | ExodusPoint Capital Management, LP | 0 | -100,00 | 0 | -100,00 | ||||
| 2026-02-17 | 13F | Toronto Dominion Bank | 24 | -99,92 | 1 | -100,00 | ||||
| 2026-02-12 | 13F | Elevated Private Wealth, LLC | 31.738 | 911 | ||||||
| 2025-10-15 | 13F | BSW Wealth Partners | 0 | -100,00 | 0 | |||||
| 2026-02-13 | 13F | Walleye Capital LLC | 382.586 | 234,66 | 10.980 | 174,64 | ||||
| 2026-02-11 | 13F | Group One Trading, L.p. | Put | 826.000 | 98,37 | 23.706 | 62,76 | |||
| 2026-02-11 | 13F | Group One Trading, L.p. | Call | 5.227.300 | 134,68 | 150.024 | 92,55 | |||
| 2026-02-13 | 13F | Stifel Financial Corp | 24.575 | -51,82 | 705 | -60,48 | ||||
| 2026-02-13 | 13F | Platinum Investment Management Ltd | 30.853 | -16,77 | 885 | -31,71 | ||||
| 2026-02-11 | 13F | Group One Trading, L.p. | 462.670 | 0,23 | 13.279 | -17,76 | ||||
| 2026-02-14 | 13F | Rockefeller Capital Management L.P. | 99.858 | 132,07 | 2.866 | 90,37 | ||||
| 2026-02-17 | 13F | Yiheng Capital Management, L.P. | 687.413 | -12,70 | 19.729 | -28,37 | ||||
| 2026-02-17 | 13F | Equitec Proprietary Markets, Llc | 125 | 0,00 | 4 | -25,00 | ||||
| 2026-01-27 | 13F | Revisor Wealth Management LLC | 7.894 | 232 | ||||||
| 2026-02-13 | 13F | Fairman Group, LLC | 150 | 0,00 | 4 | -20,00 | ||||
| 2026-02-02 | 13F | Mutual Advisors, LLC | 10.324 | 296 | ||||||
| 2026-02-12 | 13F | Brown Brothers Harriman & Co | 3.857 | 15,72 | 111 | -5,17 | ||||
| 2026-02-13 | 13F | Rhumbline Advisers | 5.424 | -7,79 | 156 | -24,39 | ||||
| 2026-02-13 | 13F | William B. Walkup & Associates, Inc. | 10 | 0,00 | 0 | |||||
| 2026-02-17 | 13F | Brevan Howard Capital Management LP | Call | 135.300 | 0,00 | 3.883 | -17,94 | |||
| 2026-02-13 | 13F | Walleye Capital LLC | Call | 149.200 | 414,48 | 4.282 | 322,29 | |||
| 2026-02-12 | 13F | Callan Family Office, LLC | 7.076 | -24,33 | 203 | -37,92 | ||||
| 2026-02-13 | 13F | Walleye Capital LLC | Put | 889.700 | 2.895,62 | 25.534 | 2.359,92 | |||
| 2026-01-30 | 13F | Pekin Hardy Strauss, Inc. | 152.051 | 4.364 | ||||||
| 2026-03-31 | 13F | Hamrick Investment Counsel, llc | 260 | 7 | ||||||
| 2026-02-06 | 13F | Pnc Financial Services Group, Inc. | 59.537 | -6,90 | 1.709 | -23,65 | ||||
| 2026-02-10 | 13F | Envestnet Asset Management Inc | 40.840 | 16,97 | 1.172 | -4,01 | ||||
| 2026-02-13 | 13F | Patient Capital Management, LLC | 0 | -100,00 | 0 | |||||
| 2026-02-17 | 13F | Two Sigma Advisers, Lp | 0 | -100,00 | 0 | -100,00 | ||||
| 2026-01-16 | 13F | Formidable Asset Management, LLC | 59.437 | -13,37 | 2.079 | -7,15 | ||||
| 2026-02-18 | 13F | Ctc Llc | Put | 271 | -57,66 | 778 | -65,28 | |||
| 2026-01-26 | 13F | Provenance Wealth Advisors, LLC | 429 | 0,00 | 12 | -20,00 | ||||
| 2026-02-18 | 13F | Ctc Llc | 19.391 | -48,00 | 557 | -57,36 | ||||
| 2025-11-12 | 13F | Brinker Capital Investments, LLC | 0 | -100,00 | 0 | -100,00 | ||||
| 2026-01-20 | 13F | Thurston, Springer, Miller, Herd & Titak, Inc. | 1.806 | 5.211,76 | 52 | 5.000,00 | ||||
| 2026-02-03 | 13F | Crossmark Global Holdings, Inc. | 100.716 | -9,24 | 2.891 | -25,53 | ||||
| 2026-02-18 | 13F | Ctc Llc | Call | 81 | -57,59 | 232 | -65,27 | |||
| 2026-02-02 | 13F | Danske Bank A/s | 16 | 0,00 | 0 | |||||
| 2026-02-17 | 13F | Yiheng Capital Management, L.P. | Call | 0 | -100,00 | 0 | ||||
| 2026-01-29 | 13F | Teachers Retirement System Of The State Of Kentucky | 618.560 | -17,23 | 18 | -34,62 | ||||
| 2026-02-13 | 13F | Pine Valley Investments Ltd Liability Co | Call | 6.492 | 2.722,17 | |||||
| 2026-02-12 | 13F | DRW Securities, LLC | 9.569 | 275 | ||||||
| 2026-02-13 | 13F | Pine Valley Investments Ltd Liability Co | 327.437 | 36.001,10 | 9.397 | 30.212,90 | ||||
| 2026-02-17 | 13F | Schonfeld Strategic Advisors LLC | Call | 0 | -100,00 | 0 | ||||
| 2026-02-17 | 13F | DV Trading LLC | 12 | 0 | ||||||
| 2026-01-21 | 13F | Yousif Capital Management, Llc | 22.310 | 0,00 | 633 | -18,85 | ||||
| 2026-01-13 | 13F | Avaii Wealth Management, Llc | 0 | -100,00 | 0 | |||||
| 2026-02-17 | 13F | Credit Agricole S A | 140.961 | 152,60 | 4.046 | 107,33 | ||||
| 2026-01-29 | 13F | UMA Financial Services, Inc. | 112 | -44,00 | 3 | -50,00 | ||||
| 2026-01-08 | 13F | Adirondack Trust Co | 70 | 0,00 | 2 | 0,00 | ||||
| 2026-02-10 | 13F | Foundations Investment Advisors, LLC | 0 | -100,00 | 0 | |||||
| 2026-02-18 | 13F | Wahed Invest LLC | 27.638 | 6,87 | 793 | -12,28 | ||||
| 2026-02-11 | 13F | Janney Montgomery Scott LLC | 27.061 | 25,82 | 1 | |||||
| 2026-02-17 | 13F | Opal Capital Llc | 70.623 | 2.027 | ||||||
| 2026-01-29 | 13F | Nbc Securities, Inc. | 157 | 0,00 | 5 | -20,00 | ||||
| 2025-11-12 | 13F | Bellwether Advisors, LLC | 0 | -100,00 | 0 | |||||
| 2026-02-12 | 13F | Raiffeisen Bank International AG | Call | 446 | -20,64 | 11 | -42,11 | |||
| 2026-02-09 | 13F | Delta Asset Management Llc/tn | 35.000 | 0,00 | 1.004 | -17,97 | ||||
| 2026-01-13 | 13F | Mather Group, Llc. | 0 | -100,00 | 0 | |||||
| 2026-01-16 | 13F | First Pacific Financial | 13.815 | -4,51 | 396 | -21,74 | ||||
| 2026-01-16 | 13F | Matauro, Llc | 104.307 | -27,30 | 2.994 | -40,35 | ||||
| 2026-02-17 | 13F | D. E. Shaw & Co., Inc. | Call | 2.100.600 | 234,44 | 60.287 | 174,41 | |||
| 2026-02-17 | 13F | D. E. Shaw & Co., Inc. | Put | 4.284.400 | 14,76 | 122.962 | -5,84 | |||
| 2026-02-17 | 13F | D. E. Shaw & Co., Inc. | 915.784 | -26,60 | 26.283 | -39,78 | ||||
| 2026-02-17 | 13F | Jump Financial, LLC | 0 | -100,00 | 0 | |||||
| 2026-01-26 | 13F | Mirae Asset Global Investments Co., Ltd. | 56.912 | 0,63 | 1.633 | -17,44 | ||||
| 2025-10-21 | 13F | Steel Peak Wealth Management LLC | 0 | -100,00 | 0 | -100,00 | ||||
| 2026-02-17 | 13F | Shay Capital LLC | 0 | -100,00 | 0 | |||||
| 2025-12-16 | 13F | Garde Capital, Inc. | 0 | -100,00 | 0 | -100,00 | ||||
| 2026-02-17 | 13F | Shay Capital LLC | Call | 0 | -100,00 | 0 | ||||
| 2026-02-17 | 13F | Lakewood Capital Management, Lp | 639.050 | 43,98 | 18.341 | 18,13 | ||||
| 2025-10-29 | 13F | Meitav Dash Investments Ltd | 0 | -100,00 | 0 | |||||
| 2025-11-20 | 13F | Maven Securities LTD | Call | 0 | -100,00 | 0 | ||||
| 2026-02-06 | 13F | Abn Amro Investment Solutions | 0 | -100,00 | 0 | |||||
| 2026-02-17 | 13F | TCG Advisory Services, LLC | Call | 0 | -100,00 | 0 | ||||
| 2026-02-12 | 13F | Renaissance Technologies Llc | 0 | -100,00 | 0 | |||||
| 2026-02-11 | 13F | Barrow Hanley Mewhinney & Strauss Llc | 3.565.777 | -7,16 | 102.338 | -23,82 | ||||
| 2026-02-12 | 13F | Douglass Winthrop Advisors, LLC | 10.280 | 0,00 | 295 | -17,83 | ||||
| 2025-11-10 | 13F | Transatlantique Private Wealth Llc | 0 | -100,00 | 0 | |||||
| 2025-11-12 | 13F | Victory Capital Management Inc | 0 | -100,00 | 0 | |||||
| 2026-01-16 | 13F | Ronald Blue Trust, Inc. | 347 | -46,62 | 10 | -59,09 | ||||
| 2026-02-13 | 13F | National Bank Of Canada /fi/ | 10.126 | -49,48 | 290 | -58,57 | ||||
| 2026-02-10 | 13F | Murphy & Mullick Capital Management Corp | 100 | 0,00 | 3 | -33,33 | ||||
| 2026-02-13 | 13F | Integrated Wealth Concepts LLC | 0 | -100,00 | 0 | |||||
| 2026-02-02 | 13F | Highland Capital Management, Llc | 17.000 | -9,33 | 488 | -25,65 | ||||
| 2026-02-13 | 13F | Venture Visionary Partners LLC | Call | 0 | -100,00 | 0 | ||||
| 2026-02-12 | 13F | New York State Common Retirement Fund | 102.100 | -9,24 | 2.930 | -25,54 | ||||
| 2026-02-13 | 13F | Colony Group, LLC | 13.604 | -12,14 | 403 | -25,51 | ||||
| 2026-01-30 | 13F | Jackson Hole Capital Partners, LLC | 12.100 | 0,00 | 347 | -17,97 | ||||
| 2026-02-09 | 13F | Eaton Financial Holdings Company, LLC | 14.096 | 405 | ||||||
| 2026-02-10 | 13F | NINE MASTS CAPITAL Ltd | 273.890 | 7.861 | ||||||
| 2026-02-17 | 13F | Tiger Global Management Llc | 344.309 | 0,00 | 9.882 | -17,95 | ||||
| 2025-11-05 | 13F | BI Asset Management Fondsmaeglerselskab A/S | 0 | -100,00 | 0 | |||||
| 2025-11-04 | 13F | Principal Financial Group Inc | 0 | -100,00 | 0 | |||||
| 2026-02-13 | 13F | Oasis Management Co Ltd. | 165.160 | 0,00 | 4.740 | -17,95 | ||||
| 2026-02-12 | 13F | Insigneo Advisory Services, Llc | 8.072 | -28,66 | 232 | -41,52 | ||||
| 2026-01-28 | 13F | CAPROCK Group, Inc. | 12.304 | -19,49 | 353 | -25,53 | ||||
| 2026-01-23 | 13F | Wallace Advisory Group, LLC | 20.925 | -0,95 | 601 | -12,92 | ||||
| 2026-02-11 | 13F | Gwn Securities Inc. | 17.228 | 65,81 | 494 | 36,09 | ||||
| 2026-02-11 | 13F | Greykasell Wealth Strategies, Inc. | 2.633 | 0,00 | 76 | -18,48 | ||||
| 2026-02-17 | 13F | SageView Advisory Group, LLC | 1.009 | 29 | ||||||
| 2026-02-05 | 13F | Allworth Financial LP | 2.275 | 24,32 | 65 | 1,56 | ||||
| 2026-02-13 | 13F | Schroder Investment Management Group | 81.600 | -87,57 | 2.342 | -89,80 | ||||
| 2026-02-17 | 13F | Alden Global Capital LLC | 113.219 | 3.249 | ||||||
| 2026-01-28 | 13F | Financial Perspectives, Inc | 3.068 | 0,00 | 88 | -17,76 | ||||
| 2026-02-11 | 13F | Contrarius Group Holdings Ltd | 781.692 | 22.435 | ||||||
| 2025-11-14 | 13F | Mangrove Partners | 0 | -100,00 | 0 | |||||
| 2026-02-17 | 13F | Creative Planning | 320.340 | -6,66 | 9.194 | -23,42 | ||||
| 2025-11-12 | 13F | NewSquare Capital LLC | 0 | -100,00 | 0 | -100,00 | ||||
| 2026-02-18 | 13F | Vident Advisory, LLC | 23.860 | -16,72 | 685 | -31,74 | ||||
| 2026-02-13 | 13F | MAI Capital Management | 1.278 | -11,19 | 37 | -28,00 | ||||
| 2026-02-17 | 13F | SIH Partners, LLLP | 4.991.448 | 74,15 | 143.255 | 42,88 | ||||
| 2026-01-28 | 13F | Migdal Insurance & Financial Holdings Ltd. | 13.024 | -13,31 | 0 | |||||
| 2026-01-23 | 13F | Capital Investment Counsel, Inc | 0 | -100,00 | 0 | |||||
| 2026-02-19 | 13F | Invesco Ltd. | 9.926.442 | -24,02 | 284.889 | -37,66 | ||||
| 2026-02-13 | 13F | Venture Visionary Partners LLC | 0 | -100,00 | 0 | |||||
| 2026-02-10 | 13F | Root Financial Partners, LLC | 1.120 | 1.020,00 | 32 | 966,67 | ||||
| 2026-02-17 | 13F | Limestone Investment Advisors LP | 74.080 | 0,00 | 2.126 | -17,95 | ||||
| 2026-02-17 | 13F | Limestone Investment Advisors LP | Call | 300 | 9 | |||||
| 2026-02-13 | 13F | Hurley Capital, LLC | Call | 47 | -32,86 | 2 | -50,00 | |||
| 2026-02-17 | 13F | Susquehanna International Group, Llp | 3.308.813 | 36,56 | 94.963 | 12,04 | ||||
| 2026-01-28 | 13F | N.E.W. Advisory Services LLC | 770 | 0,00 | 22 | -15,38 | ||||
| 2025-10-30 | 13F | Ridgewood Investments LLC | Call | 0 | -100,00 | 0 | -100,00 | |||
| 2026-02-04 | 13F | Knuff & Co LLC | 0 | -100,00 | 0 | |||||
| 2026-01-29 | 13F | Sanctuary Advisors, LLC | 0 | -100,00 | 0 | -100,00 | ||||
| 2026-02-10 | 13F | Channing Global Advisors, Llc | 17.355 | 0,37 | 498 | -17,55 | ||||
| 2026-02-17 | 13F | Susquehanna International Group, Llp | Put | 12.425.200 | 14,07 | 356.603 | -6,41 | |||
| 2026-02-17 | 13F | Susquehanna International Group, Llp | Call | 16.255.700 | -26,56 | 466.539 | -39,75 | |||
| 2026-01-30 | 13F | Mizuho Securities Co. Ltd. | 9.100 | 0,00 | 261 | -17,92 | ||||
| 2026-02-06 | 13F | EverSource Wealth Advisors, LLC | 1.124 | -5,15 | 32 | -21,95 | ||||
| 2026-02-17 | 13F | Summit Global Investments | 0 | -100,00 | 0 | |||||
| 2026-02-13 | 13F | Hurley Capital, LLC | 140 | 0,00 | 4 | 0,00 | ||||
| 2026-02-17 | 13F | Private Advisor Group, LLC | Call | 0 | -100,00 | 0 | ||||
| 2026-02-18 | 13F | GWM Advisors LLC | 0 | -100,00 | 0 | |||||
| 2026-01-28 | 13F | City State Bank | 1.840 | 0,00 | 53 | -18,75 | ||||
| 2026-02-13 | 13F | Wells Fargo & Company/mn | 297.919 | 58,83 | 8.550 | 30,32 | ||||
| 2026-02-09 | 13F | Prospera Financial Services Inc | 20.713 | 15,52 | 594 | -5,26 | ||||
| 2026-02-13 | 13F | Healthcare Of Ontario Pension Plan Trust Fund | 0 | -100,00 | 0 | |||||
| 2026-02-10 | 13F | Bank of New York Mellon Corp | 61.196 | -1,11 | 1.756 | -18,85 | ||||
| 2026-02-13 | 13F | Alkeon Capital Management Llc | 1.471.173 | -41,71 | 42.223 | -52,17 | ||||
| 2026-03-05 | 13F | Bayban | 30 | 1 | ||||||
| 2025-11-10 | 13F | Raiffeisen Bank International AG | 0 | -100,00 | 0 | -100,00 | ||||
| 2026-02-13 | 13F | Kestra Advisory Services, LLC | 0 | -100,00 | 0 | |||||
| 2026-02-17 | 13F | Garden State Investment Advisory Services LLC | 0 | -100,00 | 0 | |||||
| 2026-02-12 | 13F | Barometer Capital Management Inc. | 39.332 | 82,09 | 938 | 24,24 | ||||
| 2026-02-13 | 13F | Toroso Investments, LLC | 18.481 | 22,81 | 530 | 0,76 | ||||
| 2026-02-09 | 13F | Smithfield Trust Co | 0 | -100,00 | 0 | |||||
| 2026-01-05 | 13F | GK Wealth Management LLC | 22.407 | -3,33 | 643 | -20,62 | ||||
| 2026-02-17 | 13F | Eddie Patel Inc | 9.852 | 283 | ||||||
| 2026-01-30 | 13F | FengHe Fund Management Pte. Ltd. | 0 | -100,00 | 0 | |||||
| 2026-01-21 | 13F | Stone House Investment Management, LLC | 0 | -100,00 | 0 | |||||
| 2026-01-29 | 13F | UBS Group AG | Put | 1.771.600 | -0,86 | 50.845 | -18,66 | |||
| 2026-01-29 | 13F | UBS Group AG | Call | 954.428 | -11,65 | 27.392 | -27,51 | |||
| 2026-01-29 | 13F | UBS Group AG | 4.446.624 | -16,89 | 127.618 | -31,81 | ||||
| 2026-02-17 | 13F | Quadrature Capital Ltd | 0 | -100,00 | 0 | |||||
| 2026-02-03 | 13F | Orion Capital Management LLC | 0 | -100,00 | 0 | |||||
| 2026-01-08 | 13F | Gradient Investments LLC | 53.529 | 61,14 | 1.536 | 32,30 | ||||
| 2026-01-28 | 13F | Quaker Wealth Management, LLC | 3.047 | 87 | ||||||
| 2026-02-09 | 13F | Accent Capital Management, LLC | 275 | 0,00 | 8 | -22,22 | ||||
| 2025-10-31 | 13F | Scalar Gauge Management, Llc | 0 | -100,00 | 0 | -100,00 | ||||
| 2026-01-30 | 13F | Bogart Wealth, LLC | 150 | -56,52 | 4 | -66,67 | ||||
| 2026-02-19 | 13F | Atomi Financial Group, Inc. | Call | 0 | -100,00 | 0 | ||||
| 2026-02-06 | 13F | Saranac Partners Ltd | 0 | -100,00 | 0 | -100,00 | ||||
| 2026-01-26 | 13F | Abbington Investment Group | 0 | -100,00 | 0 | |||||
| 2026-02-17 | 13F | Man Group plc | Put | 20.000 | 574 | |||||
| 2026-02-17 | 13F | Ameriprise Financial Inc | 157.397 | -69,96 | 4.544 | -75,22 | ||||
| 2026-02-17 | 13F | Toronto Dominion Bank | Call | 149.900 | -50,00 | 4.315 | -58,86 | |||
| 2025-11-17 | 13F | FSA Wealth Management LLC | 21 | 0,00 | 1 | |||||
| 2026-02-09 | 13F | Harbour Investments, Inc. | 595 | -17,93 | 17 | -32,00 | ||||
| 2026-01-20 | 13F | Quintet Private Bank (Europe) S.A. | 8.313 | 0,00 | 239 | -17,93 | ||||
| 2026-02-09 | 13F | Geode Capital Management, Llc | 399.029 | -1,83 | 11.452 | -19,45 | ||||
| 2026-02-03 | 13F | Washington Trust Advisors, Inc. | 25 | 0,00 | 1 | |||||
| 2026-02-06 | 13F | ProShare Advisors LLC | 53.045 | 6,91 | 1.522 | -12,28 | ||||
| 2026-02-09 | 13F | Hartland & Co., LLC | 15 | 0 | ||||||
| 2026-03-06 | 13F | Hsbc Holdings Plc | 250.115 | -15,37 | 7.171 | -30,56 | ||||
| 2026-02-13 | 13F | Kilter Group LLC | 48 | 0,00 | 1 | 0,00 | ||||
| 2026-02-17 | 13F | CastleKnight Management LP | 0 | -100,00 | 0 | |||||
| 2025-10-27 | 13F | Concurrent Investment Advisors, LLC | 0 | -100,00 | 0 | -100,00 | ||||
| 2026-02-05 | 13F | High Note Wealth, LLC | Call | 0 | -100,00 | 0 | ||||
| 2026-02-17 | 13F | LMR Partners LLP | 5.494 | -98,16 | 158 | -98,50 | ||||
| 2026-02-23 | 13F | Virtu Financial LLC | 0 | -100,00 | 0 | |||||
| 2026-02-17 | 13F | LMR Partners LLP | Call | 125.200 | 18,67 | 3.593 | -2,63 | |||
| 2026-02-13 | 13F | Altrafin AG | 0 | -100,00 | 0 | |||||
| 2026-02-17 | 13F | Qube Research & Technologies Ltd | Put | 357.700 | 85,24 | 10.266 | 51,98 | |||
| 2026-02-12 | 13F | Glaxis Capital Management, LLC | 0 | -100,00 | 0 | |||||
| 2026-02-17 | 13F | Qube Research & Technologies Ltd | Call | 1.727.200 | 146,11 | 49.571 | 101,93 | |||
| 2026-02-13 | 13F | Oakum Bay Capital LLC | 5.700 | 164 | ||||||
| 2026-03-05 | 13F | Gunpowder Capital Management, LLC dba Oliver Wealth Management | 6.156 | 177 | ||||||
| 2026-02-09 | 13F | Jefferies Financial Group Inc. | Call | 265.000 | 1.666,67 | 7.606 | 1.351,34 | |||
| 2026-02-11 | 13F | Cerity Partners LLC | 11.533 | -38,59 | 331 | -49,70 | ||||
| 2026-02-10 | 13F/A | Northwestern Mutual Wealth Management Co | 109.774 | 13,12 | 3.151 | -7,19 | ||||
| 2026-02-11 | 13F | Jpmorgan Chase & Co | Put | 25.000 | -41,18 | 718 | -51,75 | |||
| 2025-11-14 | 13F | Wood Tarver Financial Group, LLC | 0 | -100,00 | 0 | |||||
| 2026-02-13 | 13F | Hudson Bay Capital Management LP | 0 | -100,00 | 0 | |||||
| 2026-02-11 | 13F | Jpmorgan Chase & Co | 674.577 | 3,32 | 19.360 | -15,23 | ||||
| 2026-02-17 | 13F | Man Group plc | Call | 20.000 | 574 | |||||
| 2025-11-13 | 13F | Kayne Anderson Rudnick Investment Management Llc | 0 | -100,00 | 0 | |||||
| 2026-02-06 | 13F | HighTower Advisors, LLC | 1.384.810 | 69,70 | 39.744 | 39,24 | ||||
| 2026-02-11 | 13F | Jpmorgan Chase & Co | Call | 338.300 | -17,97 | 9.709 | -32,69 | |||
| 2026-02-17 | 13F | Man Group plc | 364.822 | -75,07 | 10.470 | -79,55 | ||||
| 2026-02-09 | 13F | Jefferies Financial Group Inc. | 10.050 | 117,72 | 288 | 78,88 | ||||
| 2026-02-17 | 13F | Armistice Capital, Llc | 0 | -100,00 | 0 | |||||
| 2025-11-05 | 13F | SOUTH STATE Corp | 0 | -100,00 | 0 | |||||
| 2025-10-21 | 13F | Jarislowsky, Fraser Ltd | 66.790 | -11,19 | 2.336 | -4,81 | ||||
| 2026-01-15 | 13F | Frank, Rimerman Advisors LLC | 11.252 | 323 | ||||||
| 2026-01-22 | 13F | Harwood Advisory Group, LLC | 18 | 0,00 | 1 | |||||
| 2026-01-13 | 13F | Kathmere Capital Management, LLC | 8.793 | 0,16 | 252 | -17,92 | ||||
| 2025-11-07 | 13F | CenterBook Partners LP | 50.269 | 127,37 | 1.758 | 143,83 | ||||
| 2026-01-23 | 13F | Farther Finance Advisors, LLC | 17.685 | -34,87 | 508 | -46,58 | ||||
| 2026-02-13 | 13F | BNP Paribas Asset Management Holding S.A. | 212.132 | 11 | ||||||
| 2025-10-24 | 13F | ORG Partners LLC | 0 | -100,00 | 0 | |||||
| 2026-02-12 | 13F | Commonwealth Equity Services, Llc | 45.094 | 11,44 | 1.294 | 129.300,00 | ||||
| 2026-02-12 | 13F | Qtron Investments LLC | 0 | -100,00 | 0 | |||||
| 2026-02-17 | 13F | CWM Advisors, LLC | 1.311 | 38 | ||||||
| 2026-02-17 | 13F | Cresset Asset Management, LLC | 7.190 | 206 | ||||||
| 2026-02-11 | 13F | Nemes Rush Group LLC | Call | 300 | 0,00 | 0 | -100,00 | |||
| 2026-02-13 | 13F | Cornerstone Financial Management LLC | 73 | 2 | ||||||
| 2026-02-04 | 13F | NAN FUNG TRINITY (HK) Ltd | 649.700 | 35,16 | 18.646 | 10,90 | ||||
| 2026-02-26 | 13F/A | Banque Transatlantique SA | 3.877 | 0,00 | 111 | -17,78 | ||||
| 2025-11-04 | 13F | Guerra Advisors Inc | 16 | 1 | ||||||
| 2026-02-17 | 13F | Schonfeld Strategic Advisors LLC | 17.200 | -96,70 | 494 | -97,30 | ||||
| 2026-02-18 | 13F/A | Empowered Funds, LLC | 13.023 | 374 | ||||||
| 2026-01-28 | 13F | DekaBank Deutsche Girozentrale | 232.800 | 0,00 | 8 | -12,50 | ||||
| 2026-02-13 | 13F | Citigroup Inc | 839.349 | 640,16 | 24.089 | 507,39 | ||||
| 2026-02-13 | 13F | Citigroup Inc | Call | 535.000 | 12,63 | 15.354 | -7,59 | |||
| 2026-02-13 | 13F | 1832 Asset Management L.P. | 56.864 | 1.632 | ||||||
| 2025-10-31 | 13F | Cheviot Value Management, LLC | 0 | -100,00 | 0 | |||||
| 2026-02-06 | 13F | Lsv Asset Management | 5.100 | 155,00 | 0 | |||||
| 2026-02-06 | 13F | Profund Advisors Llc | 86.267 | -18,91 | 2.476 | -33,49 | ||||
| 2026-02-13 | 13F | Granville Capital, Inc. | 8.705 | 250 | ||||||
| 2026-02-17 | 13F | Susquehanna Advisors Group, Inc. | Put | 2.670.000 | -39,70 | 76.629 | -50,52 | |||
| 2026-02-24 | 13F | DGS Capital Management, LLC | 0 | -100,00 | 0 | -100,00 | ||||
| 2026-02-17 | 13F | Susquehanna Advisors Group, Inc. | 2.670.000 | -39,70 | 76.629 | -50,52 | ||||
| 2026-02-17 | 13F | Ionic Capital Management LLC | Call | 0 | -100,00 | 0 | ||||
| 2026-01-12 | 13F | Arkfeld Wealth Strategies, L.L.C. | 12.742 | -0,02 | 370 | -18,18 | ||||
| 2026-01-28 | 13F | Oversea-Chinese Banking CORP Ltd | 54.792 | 1.604 | ||||||
| 2026-02-13 | 13F | Centiva Capital, LP | 1.090.821 | 31.307 | ||||||
| 2026-02-13 | 13F | Pinnacle Wealth Planning Services, Inc. | 431 | 12 | ||||||
| 2026-01-12 | 13F | Abound Wealth Management | 301 | -38,70 | 9 | -52,94 | ||||
| 2026-02-10 | 13F | Main Management ETF Advisors, LLC | 46.980 | 1,03 | 1 | 0,00 | ||||
| 2026-02-13 | 13F | Centiva Capital, LP | Put | 4.005.400 | 142,74 | 114.955 | 99,16 | |||
| 2025-11-06 | 13F | Roman Butler Fullerton & Co | 0 | -100,00 | 0 | |||||
| 2026-02-05 | 13F | Pacitti Group Inc. | 0 | -100,00 | 0 | |||||
| 2026-02-13 | 13F | Centiva Capital, LP | Call | 302.000 | -71,64 | 8.667 | -76,73 | |||
| 2026-01-05 | 13F | Rosenberg Matthew Hamilton | 0 | -100,00 | 0 | |||||
| 2026-02-11 | 13F | Simplex Trading, Llc | Call | 5.032.400 | 0,92 | 144.430 | 82.905,17 | |||
| 2026-02-17 | 13F | PharVision Advisers, LLC | 0 | -100,00 | 0 | -100,00 | ||||
| 2026-02-13 | 13F | Prudential Financial Inc | 111.200 | -7,49 | 3.191 | -24,10 | ||||
| 2026-02-13 | 13F | Solstein Capital, LLC | 13.439 | 74,44 | 386 | 43,12 | ||||
| 2025-11-14 | 13F | Hillhouse Capital Advisors, Ltd. | 0 | -100,00 | 0 | |||||
| 2026-02-11 | 13F | Simplex Trading, Llc | Put | 1.714.400 | -38,84 | 49.203 | 50.107,14 | |||
| 2026-02-11 | 13F | Simplex Trading, Llc | 288.008 | -59,49 | 8.266 | 34.337,50 | ||||
| 2026-02-17 | 13F | Wealth Watch Advisors, INC | 3 | 0 | ||||||
| 2026-01-16 | 13F | Empirical Financial Services, LLC d.b.a. Empirical Wealth Management | 0 | -100,00 | 0 | |||||
| 2026-02-11 | 13F | Fox Run Management, L.l.c. | 0 | -100,00 | 0 | |||||
| 2026-02-03 | 13F/A | Mount Yale Investment Advisors, LLC | 0 | -100,00 | 0 | -100,00 | ||||
| 2026-02-19 | 13F | Atomi Financial Group, Inc. | 22.612 | 2,57 | 649 | -15,95 | ||||
| 2026-02-17 | 13F | Strive Financial Group ,LLC | 59 | 2 | ||||||
| 2026-02-13 | 13F | Capula Management Ltd | Put | 1.330.000 | 38.171 | |||||
| 2026-02-17 | 13F | Advisory Services Network, LLC | 7.497 | -29,25 | 215 | -41,89 | ||||
| 2026-02-13 | 13F | Capula Management Ltd | 1.330.000 | 38.171 | ||||||
| 2026-02-17 | 13F | Public Employees Retirement System Of Ohio | 210.206 | 0,00 | 6.033 | -17,97 | ||||
| 2026-02-13 | 13F | State Street Corp | 134.113 | 26,84 | 3.849 | 4,08 | ||||
| 2026-01-07 | 13F | Harbour Capital Advisors, LLC | 21.450 | 0,54 | 633 | -14,92 | ||||
| 2026-02-12 | 13F | Hrt Financial Lp | 107.600 | -4,61 | 3 | -25,00 | ||||
| 2026-02-10 | 13F | Bnp Paribas Arbitrage, Sa | 905.513 | -34,21 | 25.988 | -46,02 | ||||
| 2025-10-07 | 13F | Proathlete Wealth Management Llc | 0 | -100,00 | 0 | |||||
| 2026-01-20 | 13F | Signaturefd, Llc | 13.726 | -4,28 | 394 | -21,56 | ||||
| 2026-02-10 | 13F | Bnp Paribas Arbitrage, Sa | Call | 1.068 | -84,66 | 3.065 | -87,41 | |||
| 2026-01-14 | 13F | Jfs Wealth Advisors, Llc | 43 | 0,00 | 1 | 0,00 | ||||
| 2025-11-06 | 13F | Midwest Trust Co | 0 | -100,00 | 0 | |||||
| 2026-02-09 | 13F | Keating Financial Advisory Services, Inc. | 4 | 0 | ||||||
| 2025-11-25 | 13F/A | BlueCrest Capital Management Ltd | 0 | -100,00 | 0 | -100,00 | ||||
| 2026-02-09 | 13F | Morningstar Investment Management LLC | 95.863 | -43,87 | 3 | -60,00 | ||||
| 2026-02-12 | 13F | Marex Group plc | 247.859 | -7,14 | 7.114 | -23,82 | ||||
| 2026-02-13 | 13F | Panagora Asset Management Inc | 21.848 | -24,77 | 627 | -38,23 | ||||
| 2026-01-16 | 13F | Standard Life Aberdeen plc | 36.681 | -3,76 | 1.053 | -21,08 | ||||
| 2026-02-13 | 13F | Ieq Capital, Llc | 114.180 | -13,20 | 3.277 | -28,80 | ||||
| 2025-10-22 | 13F | Park Place Capital Corp | 0 | -100,00 | 0 | -100,00 | ||||
| 2025-11-14 | 13F | Victory Financial Group, Llc | 0 | -100,00 | 0 | |||||
| 2025-10-22 | 13F | SeaBridge Investment Advisors LLC | 0 | -100,00 | 0 | |||||
| 2026-02-09 | 13F | Advent Capital Management /de/ | Call | 0 | -100,00 | 0 | ||||
| 2026-02-10 | 13F | Goldman Sachs Group Inc | Put | 1.055.200 | -15,14 | 30.284 | -30,37 | |||
| 2026-02-11 | 13F | Mirae Asset Securities (usa) Inc. | 100.245 | 2.877 | ||||||
| 2026-02-13 | 13F | Golden State Wealth Management, LLC | 2.642 | 129,34 | 76 | 87,50 | ||||
| 2026-03-03 | 13F/A | Caitong International Asset Management Co., Ltd | 42 | -90,14 | 1 | -92,86 | ||||
| 2026-02-04 | 13F | Muhlenkamp & Co Inc | 0 | -100,00 | 0 | -100,00 | ||||
| 2026-01-26 | 13F | Cwm, Llc | 2.686 | 2,01 | 0 | |||||
| 2026-02-17 | 13F | Fmr Llc | 1.654.527 | -30,97 | 47.485 | -43,36 | ||||
| 2026-02-11 | 13F | Clearbridge Investments, LLC | 996.855 | -5,78 | 28.610 | -22,70 | ||||
| 2026-02-12 | 13F | Jane Street Group, Llc | Put | 5.011.400 | -0,78 | 143.827 | -18,59 | |||
| 2026-02-17 | 13F | Northern Trust Corp | 1.164.920 | -0,47 | 33.433 | -18,34 | ||||
| 2026-02-17 | 13F | Optiver Holding B.V. | 1.328.878 | 38.152 | ||||||
| 2026-02-12 | 13F | Jane Street Group, Llc | Call | 2.918.800 | -16,26 | 83.770 | -31,29 | |||
| 2026-01-21 | 13F | Aaron Wealth Advisors LLC | 9.012 | 35,93 | 259 | 11,69 | ||||
| 2026-02-12 | 13F | Jane Street Group, Llc | 3.680.127 | -20,99 | 105.620 | -35,18 | ||||
| 2025-10-27 | 13F | First Horizon Corp | 0 | -100,00 | 0 | |||||
| 2026-02-10 | 13F | Goldman Sachs Group Inc | 3.256.879 | -18,93 | 93.472 | -33,48 | ||||
| 2026-02-10 | 13F | Goldman Sachs Group Inc | Call | 1.693.600 | -35,67 | 48.606 | -47,22 | |||
| 2026-01-06 | 13F | Tucker Asset Management Llc | 0 | -100,00 | 0 | -100,00 | ||||
| 2026-02-12 | 13F | Wealthspire Advisors, LLC | 0 | -100,00 | 0 | |||||
| 2026-01-05 | 13F | Catherine Avery Investment Management LLC | 0 | -100,00 | 0 | |||||
| 2026-02-04 | 13F | Dogwood Wealth Management LLC | 51 | 0,00 | 1 | 0,00 | ||||
| 2026-02-17 | 13F | Cape Investment Advisory, Inc. | 200 | 6 | ||||||
| 2026-02-13 | 13F | Squarepoint Ops LLC | Call | 284.100 | 59,07 | 8.154 | 30,51 | |||
| 2026-02-13 | 13F | Squarepoint Ops LLC | Put | 1.504.500 | -47,23 | 43.179 | -56,70 | |||
| 2026-03-19 | 13F | Painted Porch Advisors LLC | 0 | -100,00 | 0 | |||||
| 2026-02-13 | 13F | SRS Capital Advisors, Inc. | 5.702 | 202,81 | 164 | 150,77 | ||||
| 2026-02-13 | 13F | Squarepoint Ops LLC | 1.237.039 | 17,30 | 35.503 | -3,76 | ||||
| 2026-02-02 | 13F | Fifth Third Bancorp | 10.703 | -6,87 | 307 | -23,44 | ||||
| 2026-02-12 | 13F | Banco BTG Pactual S.A. | 0 | -100,00 | 0 | |||||
| 2026-02-10 | 13F | Gw Henssler & Associates Ltd | 7.455 | 0,68 | 214 | -17,76 | ||||
| 2026-02-17 | 13F/A | RBF Capital, LLC | 50.000 | -16,67 | 1.435 | -31,60 | ||||
| 2025-11-14 | 13F | AXA Investment Managers S.A. | 867.324 | 93.204 | ||||||
| 2026-02-17 | 13F | Quantitative Investment Management, LLC | 0 | -100,00 | 0 | -100,00 | ||||
| 2025-11-12 | 13F | HAP Trading, LLC | Call | 207.700 | 419 | |||||
| 2026-02-13 | 13F | Natixis | 36.428 | 755,52 | 1.045 | 606,08 | ||||
| 2025-11-12 | 13F | HAP Trading, LLC | Put | 182.200 | 230 | |||||
| 2026-02-10 | 13F | Bnp Paribas | 13.304 | -83,74 | 382 | -86,72 | ||||
| 2025-11-12 | 13F | HAP Trading, LLC | 30.602 | 1.070 | ||||||
| 2026-01-30 | 13F | North Star Investment Management Corp. | 3.689 | 3,16 | 106 | -16,00 | ||||
| 2025-11-14 | 13F | Two Sigma Securities, Llc | 0 | -100,00 | 0 | -100,00 | ||||
| 2026-01-21 | 13F | Sound Income Strategies, LLC | 54 | 0,00 | 2 | 0,00 | ||||
| 2026-02-17 | 13F | Laird Norton Trust Company, Llc | 32.241 | 925 | ||||||
| 2025-10-23 | 13F | Park Avenue Securities Llc | 0 | -100,00 | 0 | |||||
| 2026-01-15 | 13F | Allspring Global Investments Holdings, LLC | 8.394 | 19,03 | 248 | -3,14 | ||||
| 2025-11-14 | 13F | Daiwa Securities Group Inc. | 0 | -100,00 | 0 | |||||
| 2026-01-27 | 13F | Zurcher Kantonalbank (Zurich Cantonalbank) | 45.621 | 78,68 | 1.309 | 46,58 | ||||
| 2026-01-05 | 13F | Union Bancaire Privee, UBP SA | 1.180 | 0,00 | 29 | -17,65 | ||||
| 2026-02-04 | 13F | Ameritas Advisory Services, LLC | 0 | -100,00 | 0 | |||||
| 2026-01-20 | 13F | Wall Street Access Asset Management, LLC | 150 | 0,00 | 4 | -20,00 | ||||
| 2026-02-05 | 13F | Baader Bank INC | 0 | -100,00 | 0 | |||||
| 2025-11-14 | 13F | Aspen Grove Capital, LLC | 0 | -100,00 | 0 | |||||
| 2026-01-29 | 13F | Matthews International Capital Management Llc | 0 | -100,00 | 0 | |||||
| 2026-02-17 | 13F | Maple Rock Capital Partners Inc. | 1.920.162 | -14,43 | 55.109 | -29,80 | ||||
| 2025-11-14 | 13F | Temasek Holdings (Private) Ltd | 0 | -100,00 | 0 | -100,00 | ||||
| 2026-02-13 | 13F | Barclays Plc | Call | 1.031.200 | 152,62 | 29.595 | 81,25 | |||
| 2026-02-13 | 13F | Barclays Plc | Put | 410.000 | -0,61 | 11.767 | -28,68 | |||
| 2026-02-13 | 13F | Barclays Plc | 1.060.572 | 36,35 | 30.438 | -2,17 | ||||
| 2026-02-13 | 13F | Sculptor Capital LP | Put | 8.500 | 0,00 | 244 | -18,18 | |||
| 2026-02-13 | 13F | Flow Traders U.s. Llc | 13.852 | 93,57 | 0 | |||||
| 2025-10-15 | 13F | Milestone Asset Management, Llc | 0 | -100,00 | 0 | -100,00 | ||||
| 2026-02-03 | 13F | Sequoia Financial Advisors, LLC | Call | 0 | -100,00 | 0 | -100,00 | |||
| 2026-02-20 | 13F/A | Capital Markets Trading UK LLP | Put | 471.600 | 19,67 | 14 | 0,00 | |||
| 2026-02-17 | 13F | Tudor Investment Corp Et Al | 59.676 | 1.713 | ||||||
| 2026-02-20 | 13F/A | Capital Markets Trading UK LLP | Call | 1.116.100 | -13,48 | 32 | -28,89 | |||
| 2025-11-13 | 13F | Limestone Investment Advisors LP | Put | 0 | -100,00 | 0 | -100,00 | |||
| 2026-02-13 | 13F | PCM Encore, LLC | 16.476 | 473 | ||||||
| 2026-02-17 | 13F | Tudor Investment Corp Et Al | Put | 257.100 | 2.471,00 | 7.379 | 2.014,04 | |||
| 2026-02-17 | 13F | Tudor Investment Corp Et Al | Call | 316.600 | 420,72 | 9.086 | 327,38 | |||
| 2026-02-13 | 13F | ICONIQ Capital, LLC | 7.462 | -34,55 | 214 | -46,23 | ||||
| 2026-01-09 | 13F | SG Americas Securities, LLC | 1.798.771 | 307,75 | 52 | 240,00 | ||||
| 2026-01-15 | 13F | Nisa Investment Advisors, Llc | 625 | 7,20 | 18 | -15,00 | ||||
| 2026-02-13 | 13F | Marshall Wace, Llp | Put | 0 | -100,00 | 0 | ||||
| 2026-02-10 | 13F | Acadian Asset Management Llc | 50.561 | -65,96 | 1 | -80,00 | ||||
| 2026-02-13 | 13F | Marshall Wace, Llp | Call | 0 | -100,00 | 0 | ||||
| 2026-02-13 | 13F | Marshall Wace, Llp | 0 | -100,00 | 0 | |||||
| 2026-02-13 | 13F | Verition Fund Management LLC | 139.386 | -34,07 | 4.000 | -45,91 | ||||
| 2026-02-13 | 13F | Verition Fund Management LLC | Put | 497.100 | 52,91 | 14.267 | 25,46 | |||
| 2026-03-04 | 13F | SHP Wealth Management | 56 | 2 | ||||||
| 2026-02-10 | 13F | SCS Capital Management LLC | 0 | -100,00 | 0 | |||||
| 2026-02-13 | 13F | Verition Fund Management LLC | Call | 175.200 | 8,96 | 5.028 | -10,60 | |||
| 2026-02-17 | 13F | Cantor Fitzgerald, L. P. | 0 | -100,00 | 0 | -100,00 | ||||
| 2026-02-17 | 13F | TCG Advisory Services, LLC | 0 | -100,00 | 0 | |||||
| 2026-02-09 | 13F | Arista Wealth Management, LLC | 0 | -100,00 | 0 | |||||
| 2025-11-12 | 13F | Quantbot Technologies LP | 0 | -100,00 | 0 | -100,00 | ||||
| 2026-01-22 | 13F | Financial Consulate, Inc | 33 | 725,00 | 1 | |||||
| 2026-02-17 | 13F | FIL Ltd | 8.539.000 | -7,59 | 245.069 | -24,18 | ||||
| 2026-01-23 | 13F | U.S. Capital Wealth Advisors, LLC | 83.093 | 381,31 | 2.385 | 295,36 | ||||
| 2026-02-17 | 13F | Point72 Asset Management, L.P. | Put | 591.100 | 5.752,48 | 16.965 | 4.705,67 | |||
| 2026-02-17 | 13F | Point72 Asset Management, L.P. | Call | 224.800 | -37,21 | 6.452 | -48,48 | |||
| 2026-02-11 | 13F | Allianz Asset Management GmbH | 160.000 | 0,00 | 4.592 | -17,94 | ||||
| 2026-02-17 | 13F | Dv Equities, Llc | 108.488 | 3.114 | ||||||
| 2026-02-17 | 13F | Point72 Asset Management, L.P. | 1.268.925 | -76,04 | 36.418 | -80,34 | ||||
| 2026-02-06 | 13F | HighTower Advisors, LLC | Put | 0 | -100,00 | 0 | -100,00 | |||
| 2026-02-11 | 13F | Nemes Rush Group LLC | 1.750 | 0,00 | 50 | -18,03 | ||||
| 2026-02-18 | 13F | VGI Partners Ltd | 0 | -100,00 | 0 | |||||
| 2025-11-13 | 13F | Canada Pension Plan Investment Board | 0 | -100,00 | 0 | |||||
| 2026-02-02 | 13F | JDM Financial Group LLC | 207 | 0,00 | 6 | -28,57 | ||||
| 2026-02-12 | 13F | Rossby Financial, LCC | 24 | 0,00 | 1 | |||||
| 2026-01-14 | 13F | Fluent Financial, LLC | 0 | -100,00 | 0 | |||||
| 2026-02-13 | 13F | DeepCurrents Investment Group LLC | Call | 0 | -100,00 | 0 | ||||
| 2026-01-20 | 13F | Ntv Asset Management Llc | 0 | -100,00 | 0 | |||||
| 2026-01-29 | 13F | Rakuten Securities, Inc. | 5.002 | -45,35 | 144 | -55,31 | ||||
| 2026-01-28 | 13F | Cortland Associates Inc/mo | 155.104 | -70,64 | 4.451 | -75,92 | ||||
| 2026-02-04 | 13F | Valeo Financial Advisors, LLC | 0 | -100,00 | 0 | |||||
| 2026-03-11 | 13F | Larry Mathis Financial Planning, LLC | 7.127 | 205 | ||||||
| 2026-02-13 | 13F | Vontobel Holding Ltd. | 141.601 | -44,90 | 4.064 | -54,81 | ||||
| 2026-02-17 | 13F | Bank Of America Corp /de/ | 2.985.391 | -54,05 | 85.681 | -62,30 | ||||
| 2026-01-27 | 13F | Financial Management Professionals, Inc. | 68 | -18,07 | 2 | -50,00 | ||||
| 2026-02-02 | 13F | AlphaStar Capital Management, LLC | 244.810 | 7.026 | ||||||
| 2026-02-13 | 13F | Vontobel Holding Ltd. | Call | 176.000 | 17,33 | 5.051 | -3,74 | |||
| 2026-02-13 | 13F | Y-Intercept (Hong Kong) Ltd | 0 | -100,00 | 0 | |||||
| 2026-02-04 | 13F | Clark Wealth Partners | 0 | -100,00 | 0 | |||||
| 2026-01-08 | 13F | Nordea Investment Management Ab | 643.383 | 3,62 | 18.391 | -15,05 | ||||
| 2026-02-04 | 13F | Valeo Financial Advisors, LLC | Call | 0 | -100,00 | 0 | ||||
| 2026-02-13 | 13F | Neuberger Berman Group LLC | 0 | -100,00 | 0 | |||||
| 2026-01-08 | 13F | Wealth Enhancement Advisory Services, Llc | 14.678 | -6,37 | 434 | -20,51 |