Grundlæggende statistik
| Institutionelle aktier (lange) | 805.980.755 - 67,91% (ex 13D/G) - change of -128,15MM shares -13,72% MRQ |
| Institutionel værdi (lang) | $ 34.904.389 USD ($1000) |
Institutionelt ejerskab og aktionærer
Suncor Energy Inc. (US:SU) har 705 institutionelle ejere og aktionærer, der har indsendt 13D/G- eller 13F-formularer til Securities Exchange Commission (SEC). Disse institutioner har i alt 805,980,755 aktier. Største aktionærer omfatter Royal Bank Of Canada, Vanguard Group Inc, Elliott Investment Management L.P., Bank Of Montreal /can/, Artisan Partners Limited Partnership, Dodge & Cox, CIBC World Markets Inc., Td Asset Management Inc, FIL Ltd, and Principal Financial Group Inc .
Suncor Energy Inc. (NYSE:SU) institutionel ejerskabsstruktur viser aktuelle positioner i virksomheden efter institutioner og fonde, samt seneste ændringer i positionsstørrelse. Større aktionærer kan omfatte individuelle investorer, investeringsforeninger, hedgefonde eller institutioner. Skema 13D angiver, at investoren besidder (eller besidder) mere end 5 % af virksomheden og har til hensigt (eller har til hensigt at) aktivt at forfølge en ændring i forretningsstrategi. Skema 13G indikerer en passiv investering på over 5%.
The share price as of April 10, 2026 is 64,43 / share. Previously, on April 11, 2025, the share price was 33,45 / share. This represents an increase of 92,62% over that period.

Fondens stemningsscore
Fund Sentiment Score (fka Ownership Accumulation Score) finder de aktier, der bliver mest købt af fonde. Det er resultatet af en sofistikeret, multi-faktor kvantitativ model, der identificerer virksomheder med de højeste niveauer af institutionel akkumulering. Scoringsmodellen bruger en kombination af den samlede stigning i oplyste ejere, ændringerne i porteføljeallokeringer i disse ejere og andre målinger. Tallet går fra 0 til 100, hvor højere tal indikerer et højere niveau af akkumulering for sine jævnaldrende, og 50 er gennemsnittet.
Opdateringsfrekvens: Dagligt
Se Ownership Explorer, som giver en liste over højest rangerende virksomheder.
AI+ Ask Fintel’s AI assistant about Suncor Energy Inc..
Select a question to share a public post with an AI-crafted answer.
Thinking of good questions…
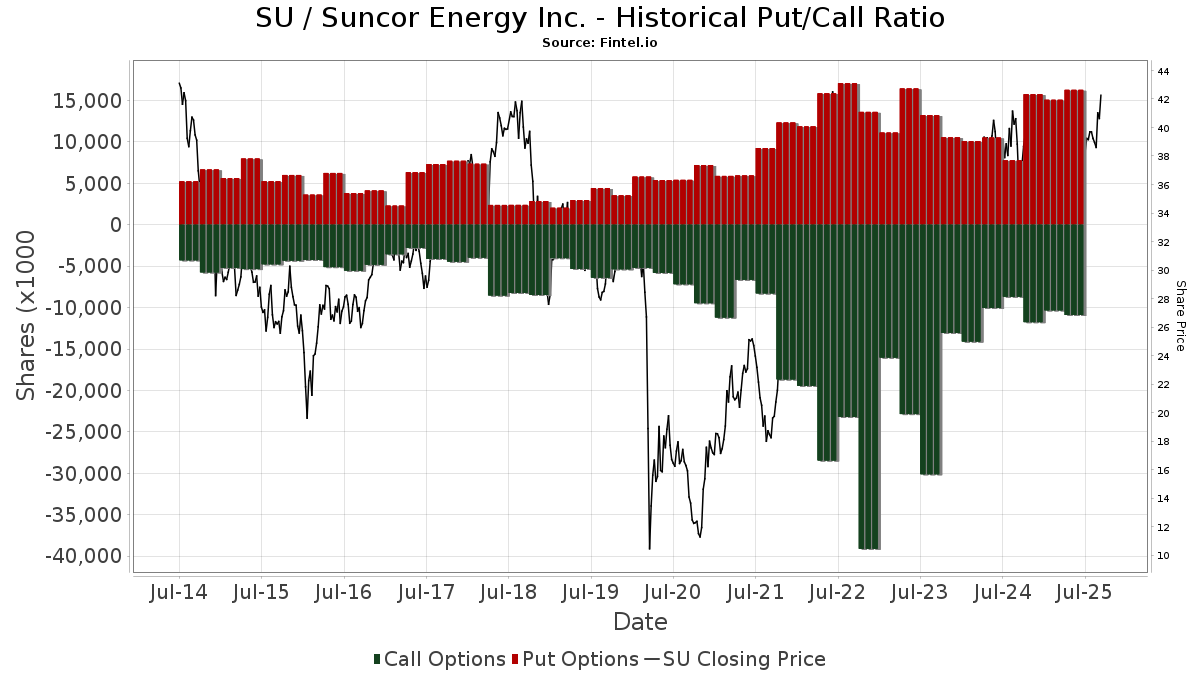
Institutionel Put/Call-forhold
Ud over at indberette standardaktie- og gældsudstedelser skal institutter med mere end 100 mill. aktiver under forvaltning også oplyse deres put- og call-optionsbeholdninger. Da salgsoptioner generelt indikerer negativ stemning, og købsoptioner indikerer positiv stemning, kan vi få en fornemmelse af den overordnede institutionelle stemning ved at plotte forholdet mellem put og kald. Diagrammet til højre viser det historiske put/call-forhold for dette instrument.
Brug af Put/Call Ratio som en indikator for investorernes stemning overvinder en af de vigtigste mangler ved at bruge totalt institutionelt ejerskab, som er, at en betydelig mængde af aktiver under forvaltning investeres passivt for at spore indekser. Passivt forvaltede fonde køber typisk ikke optioner, så indikatoren for put/call-forholdet følger mere nøje følelsen af aktivt forvaltede fonde.
13D/G-arkivering
Vi præsenterer 13D/G ansøgninger separat fra 13F ansøgninger på grund af den forskellige behandling af SEC. 13D/G-ansøgninger kan indgives af grupper af investorer (med én ledende), hvorimod 13F-ansøgninger ikke kan. Dette resulterer i situationer, hvor en investor kan indsende en 13D/G, der rapporterer én værdi for de samlede aktier (der repræsenterer alle de aktier, der ejes af investorgruppen), men derefter indsender en 13F, der rapporterer en anden værdi for de samlede aktier (der udelukkende repræsenterer deres egne) ejendomsret). Det betyder, at aktieejerskab af 13D/G-arkiver og 13F-arkiveringer ofte ikke er direkte sammenlignelige, så vi præsenterer dem separat.
Bemærk: Fra den 16. maj 2021 viser vi ikke længere ejere, der ikke har indsendt en 13D/G inden for det seneste år. Tidligere viste vi den fulde historie af 13D/G-arkiver. Generelt skal enheder, der er forpligtet til at indgive 13D/G-ansøgninger, indgive mindst årligt, før de indsender en afsluttende ansøgning. Dog forlader fonde nogle gange positioner uden at indsende en afsluttende ansøgning (dvs. de afvikler), så visning af den fulde historie resulterede nogle gange i forvirring om det nuværende ejerskab. For at undgå forvirring viser vi nu kun 'aktuelle' ejere - det vil sige - ejere, der har anmeldt inden for det seneste år.
Upgrade to unlock premium data.
| Fil dato | Form | Investor | Forrige Aktier |
Seneste Aktier |
Δ Aktier (Procent) |
Ejendomsret (Procent) |
Δ Ejerskab (Procent) |
|
|---|---|---|---|---|---|---|---|---|
| 2025-07-22 | BlackRock, Inc. | 61,072,732 | 63,591,210 | 4.12 | 5.20 | 6.12 |
13F og NPORT arkivering
Detaljer om 13F-arkivering er gratis. Detaljer om NP-ansøgninger kræver et premium-medlemskab. Grønne rækker angiver nye positioner. Røde rækker angiver lukkede positioner. Klik på linket ikon for at se den fulde transaktionshistorik.
Opgrader
for at låse premium-data op og eksportere til Excel ![]() .
.
Important Note
In an effort to reduce load times for our mobile users, we are testing some ways to deliver lighter pages.
In this first test, we will deliver only the most recent 750 transactions (out of 884 for this stock). If you are interested in loading *all* the transactions for this company, click the "load all" button below. This is just a test and if you don't like it, please let us know by submitting some gentle feedback via the link at the bottom of this page.
Load All| Fil dato | Kilde | Investor | Type | Gennemsnitlig pris (Øst) |
Aktier | Δ Aktier (%) |
Rapporteret Værdi ($1000) |
Δ Værdi (%) |
Port Alloc (%) |
|
|---|---|---|---|---|---|---|---|---|---|---|
| 2026-02-12 | 13F | Federation des caisses Desjardins du Quebec | 7.672.525 | -0,28 | 340.252 | 5,72 | ||||
| 2026-01-29 | 13F | Montrusco Bolton Investments Inc. | 494.481 | -14,95 | 21.976 | -9,70 | ||||
| 2026-02-12 | 13F | Brinker Capital Investments, LLC | 13.985 | -49,96 | 620 | -46,92 | ||||
| 2025-11-13 | 13F | Glenmede Investment Management, LP | 12.275 | -5,43 | 513 | 5,56 | ||||
| 2026-02-13 | 13F | Dockside LLC | 35.038 | 1.554 | ||||||
| 2026-01-07 | 13F | New England Research & Management, Inc. | 13.730 | 609 | ||||||
| 2026-01-26 | 13F | Ckw Financial Group | 50 | 0,00 | 0 | |||||
| 2026-02-04 | 13F | Asahi Life Asset Management Co., Ltd. | 6.306 | 280 | ||||||
| 2026-02-04 | 13F | Heronetta Management, L.P. | 132.000 | 0,00 | 8.041 | 4,61 | ||||
| 2026-01-12 | 13F | Salem Investment Counselors Inc | 0 | -100,00 | 0 | |||||
| 2026-02-10 | 13F | Winthrop Capital Management, LLC | 13.394 | -2,98 | 1 | |||||
| 2026-02-13 | 13F | Arrowstreet Capital, Limited Partnership | 11.781.229 | -11,65 | 522.765 | -6,26 | ||||
| 2026-02-12 | 13F | SWAN Capital LLC | 400 | 0,00 | 18 | 6,25 | ||||
| 2026-02-03 | 13F | Gateway Investment Advisers Llc | 16.046 | 0,79 | 712 | 6,92 | ||||
| 2026-03-26 | 13F | Merited Wealth, LLC | 42 | 2 | ||||||
| 2026-01-30 | 13F | Mitsubishi UFJ Trust & Banking Corp | 368.005 | -46,28 | 16.139 | -43,70 | ||||
| 2026-02-13 | 13F | Fairbanks Capital Management, Inc. | 118.646 | -5,63 | 5.263 | 0,13 | ||||
| 2026-02-09 | 13F | Syverson Strege & Co | 5.468 | -0,16 | 243 | 6,14 | ||||
| 2026-02-13 | 13F | Natixis | 10.222 | -2,55 | 453 | 3,42 | ||||
| 2026-02-04 | 13F | Atlantic Union Bankshares Corp | 1.555 | 0,00 | 69 | 4,62 | ||||
| 2026-02-18 | 13F | Vident Advisory, LLC | 748.342 | 4,43 | 33.197 | 10,80 | ||||
| 2026-02-04 | 13F | HighPoint Advisor Group LLC | 0 | -100,00 | 0 | -100,00 | ||||
| 2026-02-12 | 13F | Mcintyre Freedman & Flynn Investment Advisers Inc | 63.640 | -19,59 | 2.823 | -14,66 | ||||
| 2025-11-14 | 13F | Gluskin Sheff & Assoc Inc | 0 | -100,00 | 0 | -100,00 | ||||
| 2026-01-21 | 13F | Sound Income Strategies, LLC | 98 | 0,00 | 5 | 33,33 | ||||
| 2026-02-11 | 13F | CLARET ASSET MANAGEMENT Corp | 8.720 | -4,22 | 0 | |||||
| 2026-02-17 | 13F | Atom Investors LP | 79.965 | -5,19 | 3.547 | 0,60 | ||||
| 2026-02-04 | 13F | Wsfs Capital Management, Llc | 5.742 | 3,53 | 255 | 9,96 | ||||
| 2026-02-17 | 13F | United Capital Financial Advisers, Llc | 5.904 | 11,65 | 262 | 18,10 | ||||
| 2026-01-26 | 13F | Merit Financial Group, LLC | 13.451 | 2,86 | 597 | 9,16 | ||||
| 2026-02-13 | 13F | First Trust Advisors Lp | 238.876 | 23,64 | 10.605 | 31,19 | ||||
| 2026-02-13 | 13F | Mml Investors Services, Llc | 45.590 | 52,67 | 2.022 | 62,02 | ||||
| 2026-02-17 | 13F | Balyasny Asset Management Llc | Put | 140.500 | 290,28 | 6.233 | 314,09 | |||
| 2026-02-17 | 13F | Balyasny Asset Management Llc | 551.974 | -16,78 | 24.501 | -11,64 | ||||
| 2026-02-13 | 13F | Y-Intercept (Hong Kong) Ltd | 0 | -100,00 | 0 | |||||
| 2026-02-17 | 13F/A | Northwest & Ethical Investments L.P. | 270.565 | 10,11 | 12.011 | 16,70 | ||||
| 2026-04-10 | 13F | Abound Wealth Management | 113 | -26,14 | 7 | 16,67 | ||||
| 2026-02-05 | 13F | HFM Investment Advisors, LLC | 79 | 4 | ||||||
| 2026-01-22 | 13F | Vision Financial Markets Llc | 1 | 0,00 | 0 | |||||
| 2026-04-09 | 13F | Tompkins Financial Corp | 0 | -100,00 | 0 | |||||
| 2026-02-06 | 13F | Larson Financial Group LLC | 348 | 6,42 | 15 | 15,38 | ||||
| 2026-02-17 | 13F | Osterweis Capital Management Inc | 437 | 19 | ||||||
| 2026-01-14 | 13F | Mitchell & Pahl Private Wealth, Llc | 24.088 | -0,99 | 1.069 | 5,01 | ||||
| 2026-02-04 | 13F | D'Orazio & Associates, Inc. | 7.549 | 3,43 | 335 | 9,51 | ||||
| 2026-02-17 | 13F | Ancora Advisors, LLC | 112 | 5 | ||||||
| 2026-02-17 | 13F | State Of Wisconsin Investment Board | 531.447 | 23.619 | ||||||
| 2026-01-23 | 13F | Burney Co/ | 20.208 | 1,31 | 896 | 7,56 | ||||
| 2026-02-13 | 13F | Korea Investment CORP | 1.146.050 | 4,06 | 50.934 | 10,49 | ||||
| 2026-02-10 | 13F | Sivia Capital Partners, LLC | 8.363 | 371 | ||||||
| 2026-02-12 | 13F | Wealthspire Advisors, LLC | 11.338 | 127,81 | 503 | 141,35 | ||||
| 2026-01-30 | 13F | Joel Isaacson & Co., LLC | 4.918 | 0,00 | 218 | 6,34 | ||||
| 2026-02-17 | 13F | XTX Topco Ltd | 36.141 | -59,24 | 1.603 | -56,76 | ||||
| 2025-11-10 | 13F | Resources Investment Advisors, LLC. | 0 | -100,00 | 0 | -100,00 | ||||
| 2026-01-30 | 13F | R Squared Ltd | 5.050 | 224 | ||||||
| 2026-01-28 | 13F | HB Wealth Management, LLC | 17.050 | 4,93 | 756 | 11,34 | ||||
| 2026-02-13 | 13F | Edgestream Partners, L.P. | 0 | -100,00 | 0 | -100,00 | ||||
| 2026-02-12 | 13F | Commonwealth Equity Services, Llc | 49.724 | -10,19 | 2.206 | 110.150,00 | ||||
| 2026-02-17 | 13F | Guardian Partners Inc. | 293.698 | 10,05 | 15.408 | 39,56 | ||||
| 2026-02-13 | 13F | Brandywine Trust Co | 13.000 | 0,00 | 577 | 6,08 | ||||
| 2026-02-12 | 13F | Greenfield Seitz Capital Management, LLC | 201.755 | -4,23 | 8.950 | 1,60 | ||||
| 2026-02-09 | 13F | Key FInancial Inc | 0 | -100,00 | 0 | |||||
| 2026-01-29 | 13F | Kestra Private Wealth Services, Llc | 16.982 | 2,64 | 753 | 8,97 | ||||
| 2026-01-23 | 13F | First PREMIER Bank | 0 | -100,00 | 0 | |||||
| 2026-02-13 | 13F | OpenArc Corporate Advisory, LLC | 5.129 | 228 | ||||||
| 2026-02-17 | 13F | Private Advisor Group, LLC | 35.470 | 3,07 | 1.573 | 9,39 | ||||
| 2026-01-23 | 13F | Assetmark, Inc | 18.462 | 59,91 | 819 | 69,71 | ||||
| 2025-10-29 | 13F | JCIC Asset Management Inc. | 0 | -100,00 | 0 | -100,00 | ||||
| 2026-02-12 | 13F | Leigh Baldwin & Co., Llc | 9.001 | 3,64 | 399 | 9,92 | ||||
| 2026-02-09 | 13F | Mediolanum International Funds Ltd | 386.108 | -8,77 | 17.205 | -3,20 | ||||
| 2026-02-11 | 13F | Manchester Capital Management LLC | 424 | 19 | ||||||
| 2026-01-26 | 13F | Riverview Trust Co | 2.539 | 0,00 | 113 | 5,66 | ||||
| 2026-02-17 | 13F/A | Beverly Hills Private Wealth, LLC | 68.745 | -8,96 | 3.050 | -3,39 | ||||
| 2026-01-26 | 13F | AE Wealth Management LLC | 5.071 | 3,77 | 225 | 9,80 | ||||
| 2026-02-17 | 13F | Virtus Investment Advisers, Inc. | 0 | -100,00 | 0 | |||||
| 2026-01-30 | 13F | Caldwell Trust Co | 327 | 4,81 | 15 | 7,69 | ||||
| 2026-01-20 | 13F | Cromwell Holdings LLC | 1.718 | 0,00 | 76 | 7,04 | ||||
| 2026-01-29 | 13F | Concord Wealth Partners | 200 | 0,00 | 9 | 0,00 | ||||
| 2026-02-17 | 13F | Artisan Partners Limited Partnership | 32.818.241 | -3,10 | 1.456.652 | 2,80 | ||||
| 2026-01-29 | 13F | Sanctuary Advisors, LLC | 28.051 | -9,13 | 1.244 | -3,57 | ||||
| 2026-02-17 | 13F | Perritt Capital Management Inc | 0 | -100,00 | 0 | |||||
| 2026-01-20 | 13F | AdvisorNet Financial, Inc | 2.283 | 1,87 | 101 | 8,60 | ||||
| 2026-02-11 | 13F | Vise Technologies, Inc. | 105.215 | 5,80 | 4.667 | 12,27 | ||||
| 2026-02-17 | 13F | Aqr Capital Management Llc | 6.016.483 | 7.636,85 | 267.042 | 8.114,12 | ||||
| 2025-12-10 | 13F | Mainstay Capital Management Llc /adv | 0 | -100,00 | 0 | -100,00 | ||||
| 2026-02-17 | 13F | Silvercrest Asset Management Group Llc | 110.350 | -0,85 | 4.902 | 5,24 | ||||
| 2026-02-17 | 13F | Hancock Whitney Corp | 57.596 | 1,51 | 2.555 | 7,67 | ||||
| 2026-02-12 | 13F | Scotia Capital Inc. | 4.413.804 | 0,22 | 195.610 | 6,24 | ||||
| 2026-02-17 | 13F | Engineers Gate Manager LP | 38.895 | -17,97 | 1.725 | -12,97 | ||||
| 2026-02-02 | 13F | Principal Financial Group Inc | 19.371.704 | 2,74 | 860.933 | 9,09 | ||||
| 2026-02-17 | 13F | Gladstone Institutional Advisory LLC | 5.286 | 3,20 | 234 | 9,35 | ||||
| 2026-02-13 | 13F | Mosaic Financial Group, Llc | 25.142 | 0,00 | 1 | 0,00 | ||||
| 2025-11-14 | 13F | Strategic Wealth Partners, Ltd. | 253 | 90,23 | 11 | 150,00 | ||||
| 2026-02-13 | 13F | Umb Bank N A/mo | 2.346 | 31,13 | 104 | 40,54 | ||||
| 2026-02-20 | 13F | Ruggaard & Associates LLC | 12.526 | 8,50 | 556 | 15,15 | ||||
| 2026-01-26 | 13F | Cwm, Llc | 8.231 | 11,14 | 0 | |||||
| 2026-02-11 | 13F | Locust Wood Capital Advisers, Llc | 1.784.089 | 79.142 | ||||||
| 2026-02-17 | 13F | Amundi | 4.513.763 | -0,22 | 200.231 | 6,58 | ||||
| 2026-02-10 | 13F | Intech Investment Management Llc | 125.124 | -27,24 | 5.561 | -22,75 | ||||
| 2026-01-22 | 13F | Richardson Financial Services Inc. | 615 | -12,64 | 10 | -65,52 | ||||
| 2026-04-09 | 13F | Pacifica Partners Inc. | 101.907 | -2,08 | 6.727 | 41,96 | ||||
| 2026-01-28 | 13F | CAPROCK Group, Inc. | 33.464 | 18,53 | 1.484 | 27,38 | ||||
| 2026-01-23 | 13F | Avion Wealth | 24 | 0,00 | 0 | |||||
| 2026-01-22 | 13F | Addenda Capital Inc. | 760.866 | -3,24 | 46.352 | 1,21 | ||||
| 2026-02-12 | 13F | August Group Capital Ltd | 6.938 | 308 | ||||||
| 2026-02-17 | 13F | LMR Partners LLP | Call | 50.600 | 0,00 | 2.245 | 6,10 | |||
| 2026-02-17 | 13F | LMR Partners LLP | Put | 38.300 | 0,00 | 1.699 | 6,06 | |||
| 2026-02-24 | 13F | DGS Capital Management, LLC | 6.149 | 3,24 | 273 | 9,24 | ||||
| 2026-01-29 | 13F | Vanguard Group Inc | 55.720.921 | 2,14 | 2.473.173 | 8,33 | ||||
| 2025-11-14 | 13F | Wetherby Asset Management Inc | 19.488 | -7,39 | 815 | 3,30 | ||||
| 2026-02-13 | 13F | Golden State Wealth Management, LLC | 1.061 | 0,28 | 47 | 6,82 | ||||
| 2025-11-14 | 13F | Bayesian Capital Management, LP | 0 | -100,00 | 0 | -100,00 | ||||
| 2026-01-22 | 13F | City Holding Co | 86 | 0,00 | 4 | 0,00 | ||||
| 2026-01-12 | 13F | CVA Family Office, LLC | 92 | 0,00 | 4 | 33,33 | ||||
| 2026-01-28 | 13F | WPG Advisers, LLC | 41 | -58,16 | 2 | -75,00 | ||||
| 2026-02-05 | 13F | Beese Fulmer Investment Management, Inc. | 6.195 | 0,00 | 275 | 5,79 | ||||
| 2026-01-30 | 13F | Pekin Hardy Strauss, Inc. | 101.224 | -10,81 | 4.490 | -5,35 | ||||
| 2026-02-10 | 13F | Acadian Asset Management Llc | 9.968.771 | -22,43 | 443 | -17,50 | ||||
| 2026-04-08 | 13F | Dynamic Advisor Solutions LLC | 3.923 | 259 | ||||||
| 2026-02-17 | 13F | Summit Global Investments | 5.055 | 0 | ||||||
| 2026-01-20 | 13F | Hanson & Doremus Investment Management | 789 | 0,00 | 0 | |||||
| 2026-01-27 | 13F | Regions Financial Corp | 12.703 | -42,74 | 564 | -39,27 | ||||
| 2025-11-10 | 13F | Jupiter Asset Management Ltd | 0 | -100,00 | 0 | -100,00 | ||||
| 2026-02-12 | 13F | Principal Securities, Inc. | 28.845 | 55,05 | 1.280 | 64,61 | ||||
| 2026-04-07 | 13F | Signaturefd, Llc | 37.324 | 3,71 | 2.467 | 54,57 | ||||
| 2026-02-13 | 13F | FORA Capital, LLC | 0 | -100,00 | 0 | |||||
| 2026-02-12 | 13F | CIBC Private Wealth Group, LLC | 10.787 | 5,54 | 479 | 11,94 | ||||
| 2026-02-12 | 13F | McMillan Office, Inc. | 1.918 | 50 | ||||||
| 2026-02-09 | 13F | Fisher Asset Management, LLC | 16.820.924 | 8,31 | 746.176 | 14,91 | ||||
| 2026-01-29 | 13F | Nbc Securities, Inc. | 265 | -36,30 | 12 | -35,29 | ||||
| 2026-02-13 | 13F | National Bank Of Canada /fi/ | Put | 3.605 | -5,38 | 15.999 | 0,34 | |||
| 2026-02-12 | 13F | Summit Financial, LLC | 54.669 | -1,09 | 2.425 | 4,98 | ||||
| 2026-02-03 | 13F | NewEdge Wealth, LLC | 1.000.612 | 1,46 | 44.387 | 9,19 | ||||
| 2026-02-05 | 13F | AustralianSuper Pty Ltd | 1.369.647 | 0,00 | 60.792 | 6,09 | ||||
| 2026-03-12 | 13F/A | Peak6 Llc | Call | 241.700 | -46,47 | 10.722 | -43,21 | |||
| 2026-02-18 | 13F | Guardian Capital Lp | 1.989.193 | 6,50 | 88.331 | 12,98 | ||||
| 2025-10-17 | 13F | Carderock Capital Management Inc | 0 | -100,00 | 0 | -100,00 | ||||
| 2026-02-17 | 13F | Advisory Services Network, LLC | 6.140 | -12,15 | 272 | -6,85 | ||||
| 2026-03-12 | 13F/A | Peak6 Llc | Put | 17.200 | -10,88 | 763 | -5,46 | |||
| 2026-02-11 | 13F | Twin Tree Management, LP | Put | 62.400 | -86,21 | 2.768 | -85,37 | |||
| 2026-02-11 | 13F | Twin Tree Management, LP | 1.292 | 57 | ||||||
| 2025-11-12 | 13F | Sciencast Management LP | 0 | -100,00 | 0 | -100,00 | ||||
| 2026-01-30 | 13F | Exencial Wealth Advisors, Llc | 81.355 | 0,04 | 3.609 | 6,12 | ||||
| 2026-02-13 | 13F | Cornerstone Financial Management LLC | 60 | 3 | ||||||
| 2026-01-14 | 13F | Tradewinds Capital Management, LLC | 268 | 0,00 | 12 | 0,00 | ||||
| 2026-02-12 | 13F | Barings Llc | 87.175 | -75,36 | 3.869 | -73,85 | ||||
| 2026-02-13 | 13F | BNP Paribas Asset Management Holding S.A. | 105.248 | 6 | ||||||
| 2026-01-14 | 13F | Baron Wealth Management LLC | 11.342 | 4,22 | 503 | 10,55 | ||||
| 2025-11-07 | 13F | Synovus Financial Corp | 97.841 | 3,57 | 4.091 | 15,63 | ||||
| 2026-02-13 | 13F | OMERS ADMINISTRATION Corp | 0 | -100,00 | 0 | |||||
| 2026-02-12 | 13F | South Dakota Investment Council | 39.996 | -23,23 | 2 | -50,00 | ||||
| 2026-02-13 | 13F | Candriam Luxembourg S.C.A. | 13.528 | 101,01 | 601 | 113,88 | ||||
| 2026-02-17 | 13F | EFG International AG | 2.365 | 105 | ||||||
| 2026-02-17 | 13F | Old West Investment Management, LLC | 132.973 | 96,66 | 5.899 | 108,70 | ||||
| 2026-02-13 | 13F | State Street Corp | 119.495 | 178,49 | 5.301 | 195,59 | ||||
| 2026-01-26 | 13F | Provenance Wealth Advisors, LLC | 3.360 | 0,00 | 149 | 6,43 | ||||
| 2026-02-18 | 13F | First Citizens Bank & Trust Co | 5.294 | 235 | ||||||
| 2026-01-07 | 13F | Sagespring Wealth Partners, Llc | 6.584 | 3,82 | 292 | 10,19 | ||||
| 2026-01-16 | 13F | Louisbourg Investments Inc. | 96.579 | 51,07 | 4.293 | 60,51 | ||||
| 2026-01-15 | 13F | Royal Fund Management, LLC | 59.287 | -35,09 | 2.630 | -31,16 | ||||
| 2026-02-13 | 13F | Sumitomo Life Insurance Co | 33.323 | 0,87 | 1.478 | 7,02 | ||||
| 2026-04-09 | 13F | Moody National Bank Trust Division | 5.891 | 7,76 | 389 | 60,74 | ||||
| 2026-02-17 | 13F | SageView Advisory Group, LLC | 20 | 1 | ||||||
| 2026-01-27 | 13F | WealthCollab, LLC | 1.719 | 0,00 | 76 | 7,04 | ||||
| 2026-02-10 | 13F | Clear Harbor Asset Management, LLC | 22.840 | 1,11 | 1.013 | 7,31 | ||||
| 2026-02-12 | 13F | Bank Of Montreal /can/ | Call | 37.100 | -19,52 | 1.647 | -14,63 | |||
| 2026-02-12 | 13F | Bank Of Montreal /can/ | Put | 250.000 | 0,00 | 11.096 | 6,09 | |||
| 2026-02-12 | 13F | Bank Of Montreal /can/ | 36.513.628 | 12,15 | 1.620.674 | 18,97 | ||||
| 2026-01-07 | 13F | CWA Asset Management Group, LLC | 103.831 | -11,84 | 4.606 | -6,48 | ||||
| 2025-11-14 | 13F | Cubist Systematic Strategies, LLC | 305.495 | -68,44 | 12.781 | -64,75 | ||||
| 2026-04-06 | 13F | Rosenberg Matthew Hamilton | 757 | 0,00 | 50 | 51,52 | ||||
| 2026-04-08 | 13F | Wealth Enhancement Advisory Services, Llc | 91.096 | -63,01 | 6.003 | -46,11 | ||||
| 2026-04-07 | 13F | CoreCap Advisors, LLC | 1.609 | 0,00 | 106 | 49,30 | ||||
| 2026-02-09 | 13F | MTM Investment Management, LLC | 1.178 | 0,00 | 52 | 6,12 | ||||
| 2026-02-24 | 13F | SG Trading Solutions, LLC | 5.065 | 0 | ||||||
| 2026-01-20 | 13F | Ascent Group, LLC | 6.680 | -11,25 | 296 | -5,73 | ||||
| 2026-03-18 | 13F | Employees Provident Fund Board | 0 | -100,00 | 0 | -100,00 | ||||
| 2026-02-11 | 13F | Capital World Investors | 48.740 | -7,53 | 2.163 | -1,90 | ||||
| 2026-02-17 | 13F | Lighthouse Investment Partners, LLC | 475.000 | 691,67 | 21.076 | 740,31 | ||||
| 2026-02-24 | 13F | MidFirst Bank | 137 | 6 | ||||||
| 2026-04-09 | 13F | PFS Partners, LLC | 570 | 0,71 | 38 | 48,00 | ||||
| 2026-01-20 | 13F | Princeton Global Asset Management LLC | 5 | 0,00 | 0 | |||||
| 2026-01-30 | 13F | Oakworth Capital, Inc. | 172 | 8 | ||||||
| 2026-02-12 | 13F | Nuveen, LLC | 1.285.637 | -0,84 | 57.137 | 5,28 | ||||
| 2026-02-04 | 13F | First Foundation Advisors | 249.971 | -31,65 | 11.089 | -27,48 | ||||
| 2025-11-06 | 13F | Check Capital Management Inc/ca | 0 | -100,00 | 0 | |||||
| 2026-01-30 | 13F | Camden Capital, LLC | 13.806 | -10,00 | 612 | -4,52 | ||||
| 2026-02-13 | 13F | National Bank Of Canada /fi/ | Call | 5.744 | -10,89 | 25.492 | -5,51 | |||
| 2026-01-26 | 13F | Cypress Capital Advisors, LLC | 4.630 | 205 | ||||||
| 2026-01-30 | 13F | North Star Investment Management Corp. | 13 | 1 | ||||||
| 2026-03-16 | 13F/A | Rockefeller Capital Management L.P. | 217.454 | 1,61 | 9.646 | 7,81 | ||||
| 2025-11-12 | 13F | Cresset Asset Management, LLC | 9.289 | -8,76 | 388 | 1,84 | ||||
| 2026-02-17 | 13F | Ninepoint Partners LP | 200.098 | 42,04 | 8.876 | 50,72 | ||||
| 2026-02-17 | 13F | Alphadyne Asset Management, LLC | 2.490 | 110 | ||||||
| 2026-02-02 | 13F | Qrg Capital Management, Inc. | 5.086 | 226 | ||||||
| 2026-02-17 | 13F | Voloridge Investment Management, Llc | 595.974 | -43,53 | 26.437 | -40,08 | ||||
| 2026-02-17 | 13F | Alphadyne Asset Management, LLC | Call | 9.200 | 408 | |||||
| 2026-02-17 | 13F | Alphadyne Asset Management, LLC | Put | 15.100 | 670 | |||||
| 2026-02-19 | 13F | Atomi Financial Group, Inc. | 16.200 | 5,15 | 719 | 11,49 | ||||
| 2026-02-13 | 13F | American Century Companies Inc | 1.048.646 | 16,96 | 46.544 | 24,05 | ||||
| 2026-02-17 | 13F | Advisor Group Holdings, Inc. | 93.565 | -43,49 | 4.149 | -39,92 | ||||
| 2026-02-12 | 13F | Dimensional Fund Advisors Lp | 12.198.534 | 1,86 | 541.138 | 8,07 | ||||
| 2026-02-13 | 13F | Public Sector Pension Investment Board | 0 | -100,00 | 0 | |||||
| 2026-01-21 | 13F | Yousif Capital Management, Llc | 14.290 | 0,00 | 705 | 18,09 | ||||
| 2026-02-05 | 13F | Park Square Financial Group, LLC | 175 | -13,79 | 6 | -25,00 | ||||
| 2026-02-13 | 13F | Squarepoint Ops LLC | Call | 8.500 | -82,47 | 377 | -81,40 | |||
| 2026-02-11 | 13F | Commonwealth Retirement Investments LLC | 300 | 13 | ||||||
| 2026-02-17 | 13F | Farringdon Capital, Ltd. | 0 | -100,00 | 0 | -100,00 | ||||
| 2026-02-09 | 13F | Hartland & Co., LLC | 571 | 0,71 | 25 | 8,70 | ||||
| 2026-02-17 | 13F | Quantinno Capital Management LP | 110.066 | 52,67 | 4.883 | 61,98 | ||||
| 2026-02-11 | 13F | Gilpin Wealth Management, Llc | 269 | 12 | ||||||
| 2026-02-09 | 13F | Legal & General Group Plc | 4.631.639 | -11,13 | 205.842 | -5,64 | ||||
| 2026-01-05 | 13F | Roxbury Financial LLC | 7.546 | -1,02 | 335 | 5,03 | ||||
| 2026-02-09 | 13F | Putnam Fl Investment Management Co | 8.302 | -32,37 | 368 | -28,27 | ||||
| 2025-11-04 | 13F/A | Lingohr & Partner Asset Management GmbH | 10.170 | -28,85 | 0 | |||||
| 2026-02-17 | 13F | Public Employees Retirement System Of Ohio | 795.609 | 5,49 | 35.354 | 11,99 | ||||
| 2026-02-17 | 13F | Alliancebernstein L.p. | 286.802 | -23,88 | 12.723 | -19,24 | ||||
| 2026-02-17 | 13F | Northern Trust Corp | 1.375.693 | -0,29 | 61.026 | 5,80 | ||||
| 2026-02-10 | 13F | B&l Asset Management Llc | 12.500 | 0,00 | 554 | 6,13 | ||||
| 2026-02-13 | 13F | NLB Skladi, upravljanje premozenja, d.o.o. | 4.836 | 215 | ||||||
| 2026-01-21 | 13F | Greenleaf Trust | 6.791 | -1,49 | 301 | 4,51 | ||||
| 2026-02-17 | 13F | D. E. Shaw & Co., Inc. | Put | 1.745.000 | -7,92 | 77.459 | -2,30 | |||
| 2026-02-13 | 13F | Macquarie Group Ltd | 0 | -100,00 | 0 | |||||
| 2026-02-17 | 13F | D. E. Shaw & Co., Inc. | Call | 95.000 | 0,00 | 4.217 | 6,09 | |||
| 2026-01-26 | 13F | Private Trust Co Na | 4.492 | -5,01 | 199 | 1,02 | ||||
| 2026-01-29 | 13F | Pictet Asset Management Holding SA | 431.007 | 3,69 | 19.155 | 10,10 | ||||
| 2026-02-17 | 13F | D. E. Shaw & Co., Inc. | 1.062.693 | -6,86 | 47.169 | -1,17 | ||||
| 2026-02-13 | 13F | Acumen Wealth Advisors, LLC | 49 | 2 | ||||||
| 2026-01-30 | 13F | Us Bancorp \de\ | 73.325 | 9,58 | 3.253 | 16,27 | ||||
| 2026-01-28 | 13F | Geneos Wealth Management Inc. | 248 | 24,00 | 11 | 37,50 | ||||
| 2026-02-03 | 13F | SBI Securities Co., Ltd. | 639 | 3,40 | 28 | 12,00 | ||||
| 2026-02-10 | 13F | Arcadia Investment Management Corp/mi | 229.438 | -6,94 | 10.178 | -1,27 | ||||
| 2025-11-14 | 13F | Cubist Systematic Strategies, LLC | Put | 82.600 | 141,52 | 3.454 | 169,77 | |||
| 2026-03-20 | 13F | Purpose Unlimited Inc. | 202.706 | 8.997 | ||||||
| 2026-02-09 | 13F | Hantz Financial Services, Inc. | 23.835 | -8,05 | 1 | 0,00 | ||||
| 2025-11-14 | 13F | Cubist Systematic Strategies, LLC | Call | 171.200 | 48,10 | 7.158 | 65,33 | |||
| 2026-02-24 | 13F | Bell Investment Advisors, Inc | 206 | 190,14 | 9 | 350,00 | ||||
| 2025-11-14 | 13F | Virtu Financial LLC | 0 | -100,00 | 0 | -100,00 | ||||
| 2026-02-17 | 13F | Susquehanna Fundamental Investments, Llc | 210.000 | 40,19 | 9.316 | 48,73 | ||||
| 2026-02-11 | 13F | Tacita Capital Inc | 2.540 | 0,00 | 113 | 5,66 | ||||
| 2026-02-10 | 13F | AXS Investments LLC | 7.871 | -3,22 | 349 | 2,65 | ||||
| 2026-01-21 | 13F | Newbridge Financial Services Group, Inc. | 100 | 0,00 | 4 | 0,00 | ||||
| 2026-02-03 | 13F | Crossmark Global Holdings, Inc. | 309.127 | -6,24 | 13.713 | -0,52 | ||||
| 2026-02-04 | 13F | Versor Investments LP | 0 | -100,00 | 0 | |||||
| 2026-02-12 | 13F | Qtron Investments LLC | 31.661 | 205,31 | 1.407 | 224,19 | ||||
| 2026-02-17 | 13F | Wiley Bros.-aintree Capital, Llc | 18.819 | 23,70 | 835 | 31,96 | ||||
| 2026-02-04 | 13F | Oxbow Advisors, LLC | 108.612 | 0,95 | 4.818 | 7,11 | ||||
| 2026-02-17 | 13F | Gotham Asset Management, LLC | 56.356 | 161,56 | 2.500 | 177,67 | ||||
| 2026-01-27 | 13F | Fractal Investments LLC | 6.400 | 0,00 | 284 | 5,99 | ||||
| 2026-02-13 | 13F | Prudential Financial Inc | 26.300 | -30,97 | 1.169 | -26,73 | ||||
| 2026-04-10 | 13F | Country Trust Bank | 0 | -100,00 | 0 | |||||
| 2026-01-27 | 13F | Zurcher Kantonalbank (Zurich Cantonalbank) | 956.383 | 1,57 | 42.504 | 7,84 | ||||
| 2026-02-17 | 13F | BTG Pactual Asset Management US LLC | 0 | -100,00 | 0 | -100,00 | ||||
| 2026-01-23 | 13F | Optima Capital Llc | 77 | 3 | ||||||
| 2026-01-16 | 13F | Trust Co Of Vermont | 0 | -100,00 | 0 | |||||
| 2026-02-06 | 13F | Leonteq Securities AG | 64 | -81,82 | 3 | -85,71 | ||||
| 2026-02-06 | 13F | Hardy Reed LLC | 7.618 | 5,44 | 338 | 11,59 | ||||
| 2026-02-17 | 13F | Susquehanna Portfolio Strategies, LLC | 708.400 | -22,95 | 31.425 | -18,25 | ||||
| 2026-01-23 | 13F | Ritholtz Wealth Management | 82.532 | -0,75 | 3.661 | 5,32 | ||||
| 2026-02-17 | 13F | Parallax Volatility Advisers, L.P. | 8.886 | 394 | ||||||
| 2026-02-13 | 13F | Wells Fargo & Company/mn | 5.111.917 | -5,65 | 226.765 | 0,11 | ||||
| 2026-01-09 | 13F | Assenagon Asset Management S.A. | 38.274 | -96,49 | 1.700 | -96,28 | ||||
| 2025-11-14 | 13F | Mount Yale Investment Advisors, LLC | 0 | -100,00 | 0 | -100,00 | ||||
| 2026-02-17 | 13F | Nomura Holdings Inc | Call | 30.000 | 1.331 | |||||
| 2026-02-05 | 13F | Leuthold Group, Llc | 9.692 | 0,40 | 430 | 6,45 | ||||
| 2026-02-17 | 13F | Nomura Holdings Inc | Put | 30.000 | 1.331 | |||||
| 2025-11-07 | 13F | CenterBook Partners LP | 0 | -100,00 | 0 | |||||
| 2026-02-11 | 13F | Picton Mahoney Asset Management | 954.786 | 52,20 | 42.438 | 163.119,23 | ||||
| 2026-02-13 | 13F | Dixon Mitchell Investment Counsel Inc. | 5.184 | 1.301,08 | 230 | 1.433,33 | ||||
| 2025-11-04 | 13F | High Note Wealth, LLC | 0 | -100,00 | 0 | |||||
| 2026-02-10 | 13F | Nomura Asset Management Co Ltd | 0 | 0 | ||||||
| 2026-02-17 | 13F | Qube Research & Technologies Ltd | Put | 200 | 0,00 | 9 | 0,00 | |||
| 2026-02-17 | 13F | Qube Research & Technologies Ltd | Call | 100 | -98,04 | 4 | -98,12 | |||
| 2026-02-17 | 13F | Qube Research & Technologies Ltd | 385.716 | -55,40 | 17.114 | -52,67 | ||||
| 2026-02-17 | 13F | Toronto Dominion Bank | 18.607.305 | 14,82 | 825.898 | 21,81 | ||||
| 2026-02-17 | 13F | Toronto Dominion Bank | Put | 2.381.200 | -0,23 | 105.691 | 5,84 | |||
| 2026-02-17 | 13F | Toronto Dominion Bank | Call | 654.700 | -43,61 | 29.059 | -40,18 | |||
| 2026-02-13 | 13F | Corient IA LLC | 5.960 | -40,40 | 264 | -36,84 | ||||
| 2026-02-04 | 13F | Swiss Life Asset Management Ltd | 230.164 | 127,45 | 10.218 | 140,97 | ||||
| 2026-04-08 | 13F | Sapient Capital Llc | 4.073 | 269 | ||||||
| 2026-04-03 | 13F | Investors Research Corp | 80 | -99,53 | 5 | -99,33 | ||||
| 2026-02-05 | 13F | Financial Security Advisor, Inc. | 5.007 | 0,00 | 222 | 6,22 | ||||
| 2026-02-12 | 13F | Hm Payson & Co | 818 | 4,20 | 36 | 12,50 | ||||
| 2025-11-14 | 13F | Point72 (DIFC) Ltd | 0 | -100,00 | 0 | -100,00 | ||||
| 2026-02-06 | 13F | Envestnet Portfolio Solutions, Inc. | 45.513 | -0,82 | 2.019 | 5,21 | ||||
| 2026-01-27 | 13F | CenterStar Asset Management, LLC | Put | 0 | -100,00 | 0 | ||||
| 2026-02-13 | 13F | Van Eck Associates Corp | 467.229 | -73,08 | 21 | -72,22 | ||||
| 2026-02-05 | 13F | Cardinal Point Capital Management, ULC | 395.317 | 2,33 | 17.571 | 8,71 | ||||
| 2026-01-23 | 13F | Valley National Advisers Inc | 500 | 0,00 | 0 | |||||
| 2026-02-05 | 13F | Td Private Client Wealth Llc | 316 | -48,28 | 14 | -44,00 | ||||
| 2026-02-06 | 13F | EverSource Wealth Advisors, LLC | 3.086 | 4,72 | 137 | 10,57 | ||||
| 2026-02-13 | 13F | Prospector Partners Llc | 0 | -100,00 | 0 | |||||
| 2026-02-11 | 13F | Heartland Advisors Inc | 46.504 | -1,56 | 2.063 | 4,41 | ||||
| 2026-02-10 | 13F | Bearing Point Capital, Llc | 179.844 | 8,65 | 7.978 | 15,27 | ||||
| 2026-02-17 | 13F | Wellington Management Group Llp | 382.664 | 8,53 | 17.006 | 15,23 | ||||
| 2025-11-12 | 13F | Cambria Investment Management, L.P. | 98.690 | 0,00 | 3.697 | 0,00 | ||||
| 2026-02-11 | 13F | Metis Global Partners, LLC | 93.566 | -10,03 | 4.153 | -4,57 | ||||
| 2026-02-17 | 13F | Magnetar Financial LLC | 18.400 | -18,39 | 817 | -13,47 | ||||
| 2026-01-29 | 13F | Courier Capital Llc | 15.515 | -6,11 | 688 | -0,29 | ||||
| 2025-11-07 | 13F | Sierra Ocean, Llc | 0 | -100,00 | 0 | -100,00 | ||||
| 2026-02-02 | 13F | Benjamin Edwards Inc | 23.888 | -2,45 | 1.060 | 3,52 | ||||
| 2026-02-18 | 13F | Caitlin John, LLC | 24 | 0,00 | 1 | 0,00 | ||||
| 2026-03-16 | 13F | Bank of New Hampshire | 350 | 0,00 | 16 | 7,14 | ||||
| 2026-04-09 | 13F | Nelson, Van Denburg & Campbell Wealth Management Group, LLC | 4.985 | -11,61 | 330 | 31,60 | ||||
| 2026-04-09 | 13F | FCG Investment Co | 0 | -100,00 | 0 | |||||
| 2026-02-06 | 13F | Motco | 300 | 0,00 | 13 | 8,33 | ||||
| 2026-01-27 | 13F | Bayforest Capital Ltd | 541 | 24 | ||||||
| 2026-04-03 | 13F | Adirondack Trust Co | 837 | 0,00 | 55 | 48,65 | ||||
| 2026-02-17 | 13F | Warren Averett Asset Management, LLC | 11.477 | 6,83 | 509 | 13,36 | ||||
| 2026-02-05 | 13F | Tucker Asset Management Llc | 49 | 2 | ||||||
| 2026-01-21 | 13F | Cidel Asset Management Inc | 7.855 | -19,86 | 349 | -14,88 | ||||
| 2026-03-09 | 13F/A | CI Private Wealth, LLC | 482.627 | -33,04 | 21.468 | -28,76 | ||||
| 2026-02-10 | 13F | Rothschild Investment Llc | 1.167 | 0,00 | 52 | 6,25 | ||||
| 2026-02-06 | 13F | IFP Advisors, Inc | 1.047 | 22,60 | 46 | 31,43 | ||||
| 2026-02-09 | 13F | Guinness Asset Management LTD | 185.323 | -18,00 | 8.109 | -14,66 | ||||
| 2026-02-13 | 13F | Manufacturers Life Insurance Company, The | 16.681.623 | -26,19 | 741.829 | -21,58 | ||||
| 2026-02-11 | 13F | Fiera Capital Corp | 1.373.156 | -11,79 | 60.967 | -6,38 | ||||
| 2026-02-13 | 13F | Meixler Investment Management, Ltd. | Call | 0 | -100,00 | 0 | -100,00 | |||
| 2026-02-17 | 13F | Fmr Llc | 14.095.423 | 44,73 | 625.578 | 53,49 | ||||
| 2026-01-23 | 13F | Legacy Bridge, LLC | 1.199 | 0,00 | 53 | 6,00 | ||||
| 2026-02-17 | 13F | Raymond James Financial Inc | 188.364 | -50,18 | 8.356 | -47,15 | ||||
| 2026-02-05 | 13F | Hills Bank & Trust Co | 9.417 | 0,00 | 418 | 6,11 | ||||
| 2025-11-14 | 13F | Sagard Holdings Management Inc. | 3.004 | 0,00 | 126 | 11,61 | ||||
| 2026-01-21 | 13F | Inlet Private Wealth, LLC | 106.670 | 0,00 | 4.732 | 6,10 | ||||
| 2026-02-12 | 13F | Steward Partners Investment Advisory, Llc | 15.626 | 11,04 | 693 | 17,86 | ||||
| 2026-01-09 | 13F | SG Americas Securities, LLC | 0 | -100,00 | 0 | |||||
| 2026-02-13 | 13F | Brown Advisory Inc | 3.252.060 | -1,79 | 144.261 | 4,20 | ||||
| 2026-02-13 | 13F | Beutel, Goodman & Co Ltd. | 4.454.906 | -23,04 | 198 | -18,60 | ||||
| 2026-02-17 | 13F | Delaware Management Holdings, Inc. | 9.341 | 414 | ||||||
| 2026-01-16 | 13F | Montgomery Investment Management Inc | 56.200 | -0,18 | 2.493 | 5,95 | ||||
| 2026-01-12 | 13F | Perkins Coie Trust Co | 0 | -100,00 | 0 | |||||
| 2026-04-08 | 13F | Heritage Family Offices, LLP | 8.204 | -49,67 | 542 | -25,03 | ||||
| 2026-02-11 | 13F | Prudential Plc | 68.901 | 0,05 | 3.058 | 6,14 | ||||
| 2026-02-13 | 13F | Meixler Investment Management, Ltd. | 177.948 | -28,06 | 7.894 | -23,67 | ||||
| 2026-02-06 | 13F | HighTower Advisors, LLC | 20.078 | 4,40 | 891 | 10,70 | ||||
| 2026-02-17 | 13F | TCG Advisory Services, LLC | 6.307 | -0,44 | 280 | 5,68 | ||||
| 2026-02-17 | 13F | SummitTX Capital, L.P. | 8.253 | 366 | ||||||
| 2026-02-13 | 13F | Caitong International Asset Management Co., Ltd | 1.228 | 10.133,33 | 54 | |||||
| 2026-02-13 | 13F | Ieq Capital, Llc | 17.537 | 7,44 | 778 | 13,93 | ||||
| 2026-01-23 | 13F | Smallwood Wealth Investment Management, LLC | 50 | 0,00 | 2 | 0,00 | ||||
| 2026-02-11 | 13F | First Command Advisory Services, Inc. | 18 | 1 | ||||||
| 2026-01-21 | 13F | Signature Resources Capital Management, LLC | 280 | 0,00 | 12 | 9,09 | ||||
| 2026-02-02 | 13F | Core Alternative Capital | 206 | -27,21 | 9 | -18,18 | ||||
| 2026-02-06 | 13F | Cumberland Partners Ltd | 6.620 | 294 | ||||||
| 2026-02-18 | 13F | EP Wealth Advisors, Inc. | 6.809 | 302 | ||||||
| 2026-02-02 | 13F | CENTRAL TRUST Co | 1.904 | 2,70 | 84 | 9,09 | ||||
| 2026-02-17 | 13F | Captrust Financial Advisors | 35.148 | -14,51 | 1.559 | -9,31 | ||||
| 2026-01-13 | 13F | Stonehage Fleming Financial Services Holdings Ltd | 29.801 | 0,00 | 1.322 | 6,10 | ||||
| 2025-10-27 | 13F | Kiker Wealth Management, LLC | 0 | -100,00 | 0 | |||||
| 2026-02-17 | 13F | Lazard Asset Management Llc | 2.939.170 | -3,19 | 130.437 | 2,71 | ||||
| 2026-02-12 | 13F | Ensign Peak Advisors, Inc | 54.792 | 0,00 | 2.435 | 6,19 | ||||
| 2026-02-12 | 13F | Keel Point, LLC | 5.683 | 1,21 | 252 | 7,69 | ||||
| 2026-02-10 | 13F | SCP Investment, LP | 32.600 | -28,82 | 1.446 | -24,45 | ||||
| 2026-01-13 | 13F | Mather Group, Llc. | 17.523 | 0,74 | 777 | 6,88 | ||||
| 2026-02-10 | 13F | Murphy & Mullick Capital Management Corp | 190 | 0,00 | 8 | 14,29 | ||||
| 2026-02-10 | 13F | Bank of New York Mellon Corp | 2.827.979 | -7,76 | 125.449 | -2,13 | ||||
| 2026-02-13 | 13F | Kestra Advisory Services, LLC | 49.267 | 12,08 | 2.185 | 18,94 | ||||
| 2025-11-13 | 13F | Sanders Capital, LLC | 0 | -100,00 | 0 | -100,00 | ||||
| 2026-01-15 | 13F | Archford Capital Strategies, LLC | 24.786 | 4,95 | 1.100 | 11,35 | ||||
| 2026-02-18 | 13F | State of Tennessee, Treasury Department | 777.195 | 5,67 | 41.306 | 34,18 | ||||
| 2026-02-13 | 13F | Great West Life Assurance Co /can/ | 215.049 | -2,68 | 10 | 0,00 | ||||
| 2026-04-10 | 13F | First Bank & Trust | 13.914 | 20,29 | 920 | 79,14 | ||||
| 2026-02-18 | 13F/A | Alberta Investment Management Corp | 2.116.900 | 0,59 | 93.960 | 6,71 | ||||
| 2026-02-06 | 13F | Gables Capital Management Inc. | 300 | 0,00 | 13 | 8,33 | ||||
| 2026-01-08 | 13F | Value Partners Investments Inc. | 9.485 | 10,69 | 422 | 17,60 | ||||
| 2026-02-02 | 13F | Robertson Stephens Wealth Management, LLC | 17.774 | -1,21 | 788 | 4,79 | ||||
| 2026-02-10 | 13F | State of Wyoming | 22.328 | 133,17 | 992 | 148,00 | ||||
| 2026-02-10 | 13F | Hillsdale Investment Management Inc. | 826.617 | 217,41 | 36.754 | 237,35 | ||||
| 2026-01-29 | 13F | IMC-Chicago, LLC | 0 | -100,00 | 0 | -100,00 | ||||
| 2026-01-26 | 13F | Peoples Financial Services Corp. | 913 | 0,00 | 40 | 5,26 | ||||
| 2026-02-11 | 13F | Simplex Trading, Llc | Put | 133.100 | -18,14 | 5.904 | 98.300,00 | |||
| 2026-02-13 | 13F | Gen-Wealth Partners Inc | 400 | 0,00 | 18 | 6,25 | ||||
| 2026-02-11 | 13F | Simplex Trading, Llc | 48.290 | 2.142 | ||||||
| 2026-02-11 | 13F | Simplex Trading, Llc | Call | 109.300 | -67,79 | 4.849 | 40.300,00 | |||
| 2026-02-04 | 13F | Sentry Investment Management Llc | 1.081 | 0,00 | 0 | |||||
| 2026-02-13 | 13F | Chevy Chase Trust Holdings, Inc. | 4.697 | 208 | ||||||
| 2026-02-17 | 13F | Ameriprise Financial Inc | 376.421 | -20,31 | 21.646 | -9,07 | ||||
| 2026-02-17 | 13F | Cantor Fitzgerald, L. P. | 0 | -100,00 | 0 | -100,00 | ||||
| 2025-11-14 | 13F | Squarepoint Ops LLC | 0 | -100,00 | 0 | -100,00 | ||||
| 2026-02-17 | 13F | Aventail Capital Group, LP | 235.572 | 10.450 | ||||||
| 2026-02-17 | 13F | Glenmede Trust Co Na | 11.604 | -18,06 | 515 | -6,20 | ||||
| 2026-02-18 | 13F | GWM Advisors LLC | 111.867 | 1,23 | 4.962 | 7,40 | ||||
| 2026-02-12 | 13F | Renaissance Technologies Llc | 298.377 | -56,35 | 13.236 | -53,69 | ||||
| 2026-02-13 | 13F | Morgan Stanley | 12.877.899 | 17,50 | 571.264 | 24,66 | ||||
| 2026-02-11 | 13F | Parallel Advisors, LLC | 8.622 | 1,39 | 382 | 7,61 | ||||
| 2026-04-10 | 13F | Pure Financial Advisors, Inc. | 6.468 | 4,83 | 428 | 56,41 | ||||
| 2026-03-06 | 13F | Hsbc Holdings Plc | 0 | -100,00 | 0 | -100,00 | ||||
| 2026-03-06 | 13F | Hsbc Holdings Plc | Put | 0 | -100,00 | 0 | -100,00 | |||
| 2026-02-10 | 13F | Bnp Paribas Arbitrage, Sa | 1.019.823 | 47,09 | 45.239 | 56,07 | ||||
| 2026-02-10 | 13F | Bnp Paribas Arbitrage, Sa | Put | 5.763 | -15,15 | 25.565 | -9,98 | |||
| 2026-02-10 | 13F | Bnp Paribas Arbitrage, Sa | Call | 1.132 | 7,40 | 5.022 | 13,96 | |||
| 2026-02-12 | 13F | UniSuper Management Pty Ltd | 24.000 | 12,15 | 1.462 | 17,34 | ||||
| 2026-02-17 | 13F | Maryland State Retirement & Pension System | 333.390 | 0,11 | 14.804 | 6,26 | ||||
| 2026-02-13 | 13F | Alyeska Investment Group, L.P. | 2.907.613 | 12,23 | 128.982 | 19,07 | ||||
| 2025-11-14 | 13F | Woodline Partners LP | 0 | -100,00 | 0 | -100,00 | ||||
| 2026-02-13 | 13F | Sei Investments Co | 31.799 | -48,47 | 1.411 | -45,35 | ||||
| 2026-02-13 | 13F | Citigroup Inc | Put | 212.100 | 0,00 | 9.426 | 6,18 | |||
| 2026-02-13 | 13F | Citigroup Inc | 559.007 | -54,10 | 24.844 | -51,27 | ||||
| 2026-02-13 | 13F | Citigroup Inc | Call | 162.100 | 0,00 | 7.204 | 6,18 | |||
| 2026-02-02 | 13F | Avidian Wealth Solutions, LLC | 5.104 | 226 | ||||||
| 2026-02-09 | 13F | Genus Capital Management Inc. | 0 | -100,00 | 0 | |||||
| 2026-02-12 | 13F | BlackRock, Inc. | 2.083.499 | 5,75 | 92.424 | 12,20 | ||||
| 2026-02-12 | 13F | Voya Investment Management Llc | 135.532 | -2,52 | 6.023 | 3,51 | ||||
| 2026-01-27 | 13F | TD Waterhouse Canada Inc. | 4.335.563 | -3,32 | 192.155 | 5,09 | ||||
| 2026-02-17 | 13F | Elliott Investment Management L.P. | 52.670.800 | 0,00 | 2.336.477 | 6,10 | ||||
| 2026-03-11 | 13F | Larry Mathis Financial Planning, LLC | 5.800 | 257 | ||||||
| 2026-02-10 | 13F | 3Chopt Investment Partners, LLC | 9.135 | 405 | ||||||
| 2026-04-07 | 13F | Farther Finance Advisors, LLC | 6.699 | 7,86 | 435 | 58,18 | ||||
| 2026-02-12 | 13F | Bank Of Nova Scotia Trust Co | 375.512 | -27,77 | 16.658 | -23,37 | ||||
| 2026-01-20 | 13F | Independence Bank of Kentucky | 8.270 | -0,30 | 367 | 5,78 | ||||
| 2026-01-26 | 13F | Keystone Wealth Services, LLC | 8.139 | 0,00 | 361 | 6,18 | ||||
| 2026-02-13 | 13F | 10Elms LLP | 2.650 | 0,00 | 118 | 6,36 | ||||
| 2026-02-12 | 13F | Quadrant Capital Group Llc | 28.748 | 0,74 | 1.275 | 6,87 | ||||
| 2026-01-20 | 13F | Trust Co Of Toledo Na /oh/ | 24.622 | 0,00 | 1.092 | 6,12 | ||||
| 2026-01-30 | 13F | Archer Investment Corp | 30 | 1 | ||||||
| 2026-02-12 | 13F | BRYN MAWR TRUST Co | 260 | 400,00 | 12 | 450,00 | ||||
| 2025-10-31 | 13F | Whittier Trust Co Of Nevada Inc | 0 | -100,00 | 0 | -100,00 | ||||
| 2025-11-12 | 13F | NewSquare Capital LLC | 0 | -100,00 | 0 | -100,00 | ||||
| 2026-02-13 | 13F | Strategic Global Advisors, LLC | 23.044 | 117,93 | 1.022 | 131,22 | ||||
| 2026-02-13 | 13F | Mufg Securities (canada), Ltd. | 1.829.078 | -8,89 | 81.201 | -3,34 | ||||
| 2026-02-03 | 13F | Strengthening Families & Communities, LLC | 0 | -100,00 | 0 | -100,00 | ||||
| 2026-01-27 | 13F | Northern Financial Advisors Inc | 5.308 | -27,37 | 235 | -22,95 | ||||
| 2026-02-09 | 13F | Morningstar Investment Management LLC | 11.911 | 1 | ||||||
| 2026-02-17 | 13F | Cetera Investment Advisers | 114.471 | 10,04 | 5.078 | 16,74 | ||||
| 2026-02-03 | 13F | Sequoia Financial Advisors, LLC | 53.120 | 2,20 | 2.356 | 8,42 | ||||
| 2026-01-27 | 13F | CenterStar Asset Management, LLC | Call | 0 | -100,00 | 0 | ||||
| 2026-02-13 | 13F | Goehring & Rozencwajg Associates, LLC | 727.381 | 0 | ||||||
| 2026-02-10 | 13F | Evolution Wealth Management Inc. | 30 | 1 | ||||||
| 2026-02-11 | 13F | LPL Financial LLC | 232.674 | -4,44 | 10.321 | 1,40 | ||||
| 2026-02-03 | 13F | K.J. Harrison & Partners Inc | 73.172 | -12,02 | 3.252 | -4,88 | ||||
| 2026-02-17 | 13F | Clear Street Markets Llc | 1.000 | 44 | ||||||
| 2026-01-20 | 13F | Stratos Wealth Partners, LTD. | 6.651 | 2,02 | 295 | 8,46 | ||||
| 2026-01-14 | 13F | ORG Wealth Partners, LLC | 1.120 | 0,00 | 50 | 6,52 | ||||
| 2026-02-13 | 13F | Palisade Asset Management, LLC | 0 | -100,00 | 0 | -100,00 | ||||
| 2025-11-14 | 13F | Maverick Capital Ltd | 0 | -100,00 | 0 | -100,00 | ||||
| 2026-02-10 | 13F | Easterly Investment Partners Llc | 108.477 | -31,29 | 4.812 | -27,09 | ||||
| 2026-01-14 | 13F | Canoe Financial LP | 0 | -100,00 | 0 | |||||
| 2025-11-14 | 13F | AXA Investment Managers S.A. | 63.347 | 2.649 | ||||||
| 2026-02-05 | 13F | Allworth Financial LP | 3.596 | 71,40 | 159 | 82,76 | ||||
| 2026-03-06 | 13F | Hsbc Holdings Plc | Call | 0 | -100,00 | 0 | -100,00 | |||
| 2026-02-17 | 13F | Laird Norton Trust Company, Llc | 32.675 | 1.449 | ||||||
| 2026-02-09 | 13F | Smithfield Trust Co | 2.500 | 0 | ||||||
| 2026-01-22 | 13F | Maseco Llp | 882 | 39 | ||||||
| 2026-01-16 | 13F | Crowley Wealth Management, Inc. | 0 | -100,00 | 0 | |||||
| 2026-01-26 | 13F | PDS Planning, Inc | 6.635 | 1,11 | 294 | 7,30 | ||||
| 2026-02-17 | 13F | SIG North Trading, ULC | Put | 3.330.700 | -1,42 | 147.750 | 4,59 | |||
| 2026-02-17 | 13F | CWM Advisors, LLC | 5.824 | 3,15 | 258 | 9,32 | ||||
| 2026-02-17 | 13F | SIG North Trading, ULC | Call | 424.900 | -21,15 | 18.849 | -16,35 | |||
| 2026-02-06 | 13F/A | Rathbone Brothers plc | 10.450 | 0,00 | 464 | 6,18 | ||||
| 2026-02-17 | 13F | SIG North Trading, ULC | 218.043 | -36,80 | 9.672 | -32,95 | ||||
| 2026-04-06 | 13F | GAMMA Investing LLC | 987 | 232,32 | 65 | 400,00 | ||||
| 2026-02-17 | 13F | Murchinson Ltd. | Put | 0 | -100,00 | 0 | -100,00 | |||
| 2026-01-21 | 13F | Sowell Financial Services LLC | 7.092 | 13,85 | 315 | 20,77 | ||||
| 2026-02-13 | 13F | 1832 Asset Management L.P. | 17.791.677 | -4,02 | 789.239 | 1,83 | ||||
| 2026-02-17 | 13F | Murchinson Ltd. | Call | 0 | -100,00 | 0 | -100,00 | |||
| 2025-10-20 | 13F | CenterStar Asset Management, LLC | 0 | -100,00 | 0 | -100,00 | ||||
| 2026-02-11 | 13F | Capital Analysts, Inc. | 223 | -29,21 | 0 | |||||
| 2026-02-17 | 13F | Canada Pension Plan Investment Board | 7.856.625 | -27,08 | 348.720 | -22,64 | ||||
| 2026-02-17 | 13F | Fairscale Capital, LLC | 870 | 0,00 | 39 | 5,56 | ||||
| 2025-11-14 | 13F | Point72 Europe (London) LLP | 607.085 | 18,06 | 25.407 | 31,97 | ||||
| 2026-02-03 | 13F | Manning & Napier Advisors Llc | 86.881 | -2,41 | 3.866 | 3,48 | ||||
| 2026-02-11 | 13F | X-Square Capital, LLC | 82.940 | -3,05 | 4 | 0,00 | ||||
| 2025-11-13 | 13F | Mark Sheptoff Financial Planning, Llc | 0 | -100,00 | 0 | -100,00 | ||||
| 2026-02-11 | 13F | Erste Asset Management GmbH | 4.800 | 213 | ||||||
| 2026-01-14 | 13F | TrueMark Investments, LLC | 42.841 | 14,91 | 1.900 | 21,95 | ||||
| 2026-02-11 | 13F | O'shaughnessy Asset Management, Llc | 449.145 | 0,52 | 19.928 | 6,65 | ||||
| 2026-01-27 | 13F | Meritage Portfolio Management | 0 | -100,00 | 0 | |||||
| 2026-02-13 | 13F | Recurrent Investment Advisors LLC | 1.760.388 | -1,53 | 79.174 | 4,43 | ||||
| 2026-02-02 | 13F | PKO Investment Management Joint-Stock Co | 32.500 | -17,09 | 1.445 | -11,94 | ||||
| 2026-02-13 | 13F | Charles Schwab Investment Management Inc | 4.878.399 | 2,53 | 216.810 | 8,86 | ||||
| 2026-01-27 | 13F | First Horizon Corp | 0 | -100,00 | 0 | |||||
| 2026-01-22 | 13F | Pinnacle Bancorp, Inc. | 380 | 0,00 | 17 | 6,67 | ||||
| 2026-02-05 | 13F | LGT Group Foundation | 0 | -100,00 | 0 | |||||
| 2026-02-05 | 13F | Cambridge Investment Research Advisors, Inc. | 36.923 | 24,98 | 2 | 0,00 | ||||
| 2025-10-31 | 13F | Whittier Trust Co | 0 | -100,00 | 0 | |||||
| 2026-04-07 | 13F | Cardinal Capital Management, Inc. | 3.510.340 | 0,28 | 231.450 | 8,54 | ||||
| 2026-02-17 | 13F | Quadrature Capital Ltd | 1.469.349 | 65.302 | ||||||
| 2026-02-17 | 13F | Spears Abacus Advisors LLC | 31.800 | 0,00 | 1.411 | 6,09 | ||||
| 2026-02-06 | 13F | Harvest Portfolios Group Inc. | 360.668 | 9,14 | 16.008 | 15,76 | ||||
| 2025-11-14 | 13F | ExodusPoint Capital Management, LP | 0 | -100,00 | 0 | -100,00 | ||||
| 2026-02-05 | 13F | Sequent Planning LLC | 5.996 | -75,99 | 266 | -74,62 | ||||
| 2026-02-12 | 13F | CoreCommodity Management, LLC | 76.739 | -15,31 | 3.408 | -10,01 | ||||
| 2026-02-17 | 13F | Utah Retirement Systems | 136.887 | 0,00 | 6.084 | 6,18 | ||||
| 2026-01-14 | 13F | Spire Wealth Management | 8.938 | 0,39 | 396 | 6,45 | ||||
| 2026-02-17 | 13F | FIL Ltd | 21.050.387 | 14,05 | 934.312 | 20,96 | ||||
| 2026-01-30 | 13F | Delta Investment Management, LLC | 17.194 | 0,00 | 763 | 6,13 | ||||
| 2026-02-10 | 13F | Savant Capital, LLC | 17.313 | 26,97 | 768 | 34,74 | ||||
| 2026-01-27 | 13F | Forum Financial Management, LP | 9.688 | 0,73 | 430 | 6,72 | ||||
| 2026-02-17 | 13F | Credit Agricole S A | 19.830 | 10,79 | 880 | 17,51 | ||||
| 2026-02-13 | 13F | 1 North Wealth Services Llc | 731 | 32 | ||||||
| 2026-02-13 | 13F | Dodge & Cox | 27.257.754 | -0,78 | 1.209.154 | 5,27 | ||||
| 2026-02-13 | 13F | Royal London Asset Management Ltd | 1.484.747 | -16,13 | 65.863 | -11,02 | ||||
| 2026-02-23 | 13F | Mv Capital Management, Inc. | 13 | 1 | ||||||
| 2026-02-13 | 13F | Evelyn Partners Investment Management LLP | 5.200 | 0,00 | 231 | 5,99 | ||||
| 2026-02-11 | 13F | Everett Harris & Co /ca/ | 20.675 | 0,00 | 917 | 6,13 | ||||
| 2026-02-12 | 13F | Logan Capital Management Inc | 0 | -100,00 | 0 | -100,00 | ||||
| 2026-02-17 | 13F | Citadel Advisors Llc | Put | 975.600 | 30,41 | 43.278 | 38,36 | |||
| 2026-02-12 | 13F | Chilton Capital Management Llc | 3.000 | 0,00 | 133 | 6,40 | ||||
| 2026-02-17 | 13F | Citadel Advisors Llc | Call | 245.900 | -46,83 | 10.908 | -43,59 | |||
| 2026-02-13 | 13F | Inspire Advisors, LLC | 14.563 | -5,56 | 646 | 0,31 | ||||
| 2026-02-17 | 13F | Citadel Advisors Llc | 1.836.287 | -28,36 | 81.458 | -23,99 | ||||
| 2026-02-05 | 13F | Pinnacle Associates Ltd | 37.989 | -8,94 | 1.685 | -3,38 | ||||
| 2026-02-04 | 13F | Independent Advisor Alliance | 5.081 | 225 | ||||||
| 2026-02-09 | 13F | Texas Capital Bank Wealth Management Services Inc | 7.009 | 311 | ||||||
| 2026-02-09 | 13F | Geode Capital Management, Llc | 11.969.856 | 5,80 | 544.035 | 12,61 | ||||
| 2026-02-09 | 13F | Life Cycle Investment Partners Ltd | 649.444 | 28.862 | ||||||
| 2026-02-03 | 13F | McIlrath & Eck, LLC | 31 | 0,00 | 1 | 0,00 | ||||
| 2026-02-13 | 13F | Solstein Capital, LLC | 70 | 0,00 | 3 | 50,00 | ||||
| 2026-01-29 | 13F | Viewpoint Investment Partners Corp | 4.900 | 299 | ||||||
| 2026-02-11 | 13F | Twin Tree Management, LP | Call | 0 | -100,00 | 0 | -100,00 | |||
| 2026-02-13 | 13F | Entropy Technologies, LP | 48.812 | -50,64 | 2.165 | -47,63 | ||||
| 2026-02-17 | 13F | Trexquant Investment LP | 219.773 | 9.749 | ||||||
| 2025-11-14 | 13F | Eqis Capital Management, Inc. | 0 | -100,00 | 0 | |||||
| 2026-01-13 | 13F | Kathmere Capital Management, LLC | 11.144 | 8,08 | 494 | 14,62 | ||||
| 2026-02-17 | 13F | Css Llc/il | 5.010 | 0,00 | 222 | 6,22 | ||||
| 2026-02-17 | 13F | Greenline Partners, LLC | 21.224 | 0,00 | 941 | 6,09 | ||||
| 2026-02-17 | 13F | Mercer Global Advisors Inc /adv | 14.746 | 9,59 | 654 | 16,37 | ||||
| 2026-02-17 | 13F | Evolve Private Wealth, Llc | 22.065 | 979 | ||||||
| 2026-02-11 | 13F | Franklin Resources Inc | 4.751.721 | -5,66 | 210.880 | 0,09 | ||||
| 2026-02-04 | 13F | Fourth Dimension Wealth, LLC | 45 | 2 | ||||||
| 2026-02-10 | 13F/A | Guinness Atkinson Asset Management Inc | 8.373 | -20,17 | 366 | -16,82 | ||||
| 2026-01-14 | 13F | Clarius Group, LLC | 6.528 | 0,00 | 290 | 6,25 | ||||
| 2026-01-16 | 13F | Crewe Advisors LLC | 11.905 | 0,00 | 528 | 6,24 | ||||
| 2026-01-23 | 13F | Creative Capital Management Investments LLC | 257 | 0,00 | 11 | 10,00 | ||||
| 2026-01-28 | 13F | Eagle Global Advisors Llc | 108.570 | -0,16 | 4.811 | 5,90 | ||||
| 2026-02-17 | 13F | Tower Research Capital LLC (TRC) | 7.193 | -52,29 | 319 | -49,37 | ||||
| 2026-02-02 | 13F | Triasima Portfolio Management inc. | 61.062 | 1.087,51 | 2.714 | 1.161,86 | ||||
| 2026-01-23 | 13F | Sumitomo Mitsui Trust Holdings, Inc. | 34.177 | -1,63 | 1.516 | 4,41 | ||||
| 2026-02-04 | 13F | Ameritas Advisory Services, LLC | 0 | -100,00 | 0 | -100,00 | ||||
| 2026-02-10 | 13F | Moors & Cabot, Inc. | 4.782 | 212 | ||||||
| 2026-02-13 | 13F | Marshall Wace, Llp | 0 | -100,00 | 0 | -100,00 | ||||
| 2026-02-13 | 13F | Bridgewater Associates, LP | 467.473 | -8,09 | 20.776 | -2,41 | ||||
| 2026-02-17 | 13F | Parallax Volatility Advisers, L.P. | Call | 0 | -100,00 | 0 | ||||
| 2026-02-17 | 13F | Guggenheim Capital Llc | 8.982 | -14,36 | 398 | -9,13 | ||||
| 2026-02-17 | 13F | Mirabella Financial Services Llp | 0 | -100,00 | 0 | -100,00 | ||||
| 2026-01-23 | 13F | Bridgewater Advisors Inc. | 4.832 | 244 | ||||||
| 2026-04-07 | 13F | First Financial Corp /in/ | 11.062 | -20,03 | 731 | 19,25 | ||||
| 2026-01-20 | 13F | Cigna Investments Inc /new | 21.852 | -2,60 | 1 | |||||
| 2026-02-17 | 13F | Merewether Investment Management, LP | 3.277.504 | -10,97 | 145.481 | -5,54 | ||||
| 2026-02-06 | 13F | Global Retirement Partners, LLC | 6.026 | 63,39 | 267 | 73,38 | ||||
| 2026-02-11 | 13F | TCTC Holdings, LLC | 850 | 0,00 | 38 | 5,71 | ||||
| 2025-11-12 | 13F | Headlands Technologies LLC | 0 | -100,00 | 0 | |||||
| 2026-01-28 | 13F | Ruffer LLP | 999.168 | 6,86 | 44.471 | 13,64 | ||||
| 2026-02-12 | 13F | Penserra Capital Management LLC | 75 | -3,85 | 0 | |||||
| 2026-02-13 | 13F | JustInvest LLC | 81.046 | 10,20 | 3.595 | 16,91 | ||||
| 2026-01-23 | 13F | Sage Investment Counsel LLC | 8.400 | 0,00 | 373 | 5,98 | ||||
| 2026-02-17 | 13F | Van Den Berg Management I, Inc | 9.168 | -0,60 | 407 | 5,45 | ||||
| 2026-02-05 | 13F | Center for Financial Planning, Inc. | 150 | 0,00 | 7 | 0,00 | ||||
| 2026-02-17 | 13F | Boreal Capital Management LLC | 80 | 0,00 | 4 | 0,00 | ||||
| 2026-02-17 | 13F | Bank Of America Corp /de/ | 8.683.863 | -8,78 | 385.216 | -3,22 | ||||
| 2026-02-10 | 13F | Quantbot Technologies LP | 114.237 | 126,42 | 5.068 | 140,26 | ||||
| 2026-02-17 | 13F | Price T Rowe Associates Inc /md/ | 5.007.854 | -10,71 | 222 | -5,13 | ||||
| 2026-02-17 | 13F | Armistice Capital, Llc | 0 | -100,00 | 0 | -100,00 | ||||
| 2026-01-23 | 13F | Intelligence Driven Advisers, LLC | 5.396 | -1,15 | 239 | 4,82 | ||||
| 2026-01-27 | 13F | GHP Investment Advisors, Inc. | 2.002 | 0,00 | 89 | 6,02 | ||||
| 2025-11-07 | 13F | Shell Asset Management Co | 23.657 | -77,05 | 1 | -100,00 | ||||
| 2026-02-11 | 13F | Janney Montgomery Scott LLC | 32.800 | -8,15 | 1 | 0,00 | ||||
| 2026-01-20 | 13F | Global Trust Asset Management, LLC | 97 | 4 | ||||||
| 2026-02-10 | 13F | Td Asset Management Inc | 23.040.499 | -0,57 | 1.023.985 | 5,57 | ||||
| 2026-02-11 | 13F | Cerity Partners LLC | 63.852 | -3,80 | 2.834 | 2,16 | ||||
| 2026-01-29 | 13F | RMG Wealth Management LLC | 588 | 0,00 | 29 | 31,82 | ||||
| 2026-01-14 | 13F | Jfs Wealth Advisors, Llc | 7.309 | 0,00 | 324 | 6,23 | ||||
| 2026-02-13 | 13F | Colony Group, LLC | 739.082 | -4,62 | 32.747 | 1,07 | ||||
| 2026-02-13 | 13F | Transamerica Financial Advisors, Inc. | 4.209 | 82,05 | 187 | 93,75 | ||||
| 2026-01-08 | 13F | Gradient Investments LLC | 57.323 | 31,41 | 2.543 | 39,44 | ||||
| 2026-02-09 | 13F | Gs Investments, Inc. | 21.400 | -30,58 | 949 | -26,32 | ||||
| 2026-02-09 | 13F | Harbour Investments, Inc. | 1.160 | 0,00 | 51 | 6,25 | ||||
| 2026-02-10 | 13F | Envestnet Asset Management Inc | 585.967 | 10,69 | 25.993 | 17,45 | ||||
| 2026-02-17 | 13F | Sagefield Capital LP | 208.308 | 97,25 | 9.241 | 109,29 | ||||
| 2026-02-20 | 13F | Sunbelt Securities, Inc. | 290 | -12,91 | 13 | -7,69 | ||||
| 2026-04-06 | 13F | Versant Capital Management, Inc | 95 | 6 | ||||||
| 2026-02-09 | 13F | Employees Retirement System of Texas | 53.681 | 0,00 | 2 | 0,00 | ||||
| 2026-01-30 | 13F | Valued Wealth Advisors LLC | 39 | 0,00 | 2 | 0,00 | ||||
| 2026-02-05 | 13F | Blume Capital Management, Inc. | 2.000 | 0,00 | 89 | 6,02 | ||||
| 2026-02-10 | 13F | Thoroughbred Financial Services, Llc | 13.820 | -29,11 | 1 | |||||
| 2026-04-07 | 13F | Eastern Bank | 675 | 0,00 | 45 | 51,72 | ||||
| 2026-02-11 | 13F | Letko, Brosseau & Associates Inc | 1.661.252 | -19,64 | 73.831 | -14,68 | ||||
| 2025-11-14 | 13F | Wolverine Trading, Llc | 20.977 | 22,78 | 880 | 37,07 | ||||
| 2025-11-14 | 13F | Wolverine Trading, Llc | Call | 139.200 | -44,59 | 5.842 | -38,13 | |||
| 2026-01-16 | 13F | Ronald Blue Trust, Inc. | 2.897 | -23,94 | 129 | -19,50 | ||||
| 2026-02-13 | 13F | HITE Hedge Asset Management LLC | 698.673 | 78,72 | 30.993 | 89,62 | ||||
| 2026-01-28 | 13F | DekaBank Deutsche Girozentrale | 691.631 | 0,00 | 30 | 3,57 | ||||
| 2026-02-11 | 13F | Capital Research Global Investors | 4.973.331 | 0,26 | 220.739 | 6,34 | ||||
| 2026-04-09 | 13F | Cullen Investment Group, Ltd. | 29.189 | -6,87 | 1.930 | 31,85 | ||||
| 2026-02-13 | 13F | SRS Capital Advisors, Inc. | 10.184 | -36,56 | 452 | -32,79 | ||||
| 2025-11-06 | 13F | Whipplewood Advisors, LLC | 0 | -100,00 | 0 | -100,00 | ||||
| 2025-11-14 | 13F | Point72 Asia (Singapore) Pte. Ltd. | 22.197 | 929 | ||||||
| 2026-01-15 | 13F | Foster & Motley Inc | 37.709 | -0,82 | 2 | 0,00 | ||||
| 2026-02-17 | 13F | Ewing Morris & Co. Investment Partners Ltd. | 6.985 | 1,26 | 314 | 9,03 | ||||
| 2026-02-06 | 13F | Burling Wealth Partners, Llc | 60.834 | 23,33 | 2.699 | 30,84 | ||||
| 2025-12-16 | 13F | Garde Capital, Inc. | 0 | -100,00 | 0 | |||||
| 2026-04-09 | 13F | DHJJ Financial Advisors, Ltd. | 50 | 0,00 | 3 | 50,00 | ||||
| 2026-02-13 | 13F | Smartleaf Asset Management LLC | 1.664 | 109,84 | 74 | 124,24 | ||||
| 2026-01-16 | 13F | Formidable Asset Management, LLC | 15.833 | 16,97 | 662 | 30,63 | ||||
| 2026-01-21 | 13F | SJS Investment Consulting Inc. | 309 | 14 | ||||||
| 2026-02-02 | 13F | Kornitzer Capital Management Inc /ks | 177.293 | -4,27 | 7.865 | 1,56 | ||||
| 2025-10-27 | 13F | WealthPlan Investment Management, LLC | 0 | -100,00 | 0 | -100,00 | ||||
| 2026-02-17 | 13F | Agf Management Ltd | 2.558.476 | 2,75 | 139.627 | 7,24 | ||||
| 2026-04-08 | 13F | Ervin Investment Management, LLC | 3.759 | 249 | ||||||
| 2026-02-13 | 13F | Dynamic Technology Lab Private Ltd | 0 | -100,00 | 0 | |||||
| 2026-02-10 | 13F | Bruce G. Allen Investments, LLC | 409 | -9,11 | 18 | 0,00 | ||||
| 2026-02-12 | 13F | Brown Brothers Harriman & Co | 2.065 | 40,29 | 92 | 49,18 | ||||
| 2026-02-12 | 13F | Great Lakes Advisors, Llc | 701.991 | 1,13 | 31.140 | 7,30 | ||||
| 2026-02-17 | 13F | Jones Financial Companies Lllp | 111.432 | 5,29 | 4.943 | 9,63 | ||||
| 2026-02-17 | 13F | Hilltop Holdings Inc. | 4.944 | 219 | ||||||
| 2026-02-17 | 13F | Susquehanna International Group, Llp | 41.363 | -51,08 | 1.835 | -48,10 | ||||
| 2026-02-17 | 13F | Susquehanna International Group, Llp | Put | 580.600 | -8,07 | 25.755 | -2,47 | |||
| 2026-02-11 | 13F | Fox Run Management, L.l.c. | 0 | -100,00 | 0 | -100,00 | ||||
| 2026-02-12 | 13F | Wasatch Advisors Inc | 77.142 | 1,03 | 3.424 | 7,17 | ||||
| 2026-01-29 | 13F | IMC-Chicago, LLC | Put | 319.300 | 51,90 | 14.164 | 61,17 | |||
| 2026-02-11 | 13F | Group One Trading, L.p. | Call | 65.300 | -58,96 | 2.897 | -56,46 | |||
| 2026-01-29 | 13F | IMC-Chicago, LLC | Call | 206.600 | -12,57 | 9.165 | -7,24 | |||
| 2026-01-29 | 13F | UMA Financial Services, Inc. | 113 | -9,60 | 5 | 0,00 | ||||
| 2026-02-11 | 13F | Group One Trading, L.p. | Put | 189.200 | 0,32 | 8.393 | 6,43 | |||
| 2026-02-13 | 13F | Parkside Financial Bank & Trust | 592 | 0,00 | 26 | 8,33 | ||||
| 2026-02-11 | 13F | Group One Trading, L.p. | 11.207 | 70,22 | 497 | 80,73 | ||||
| 2026-02-12 | 13F | Fox Hill Wealth Management | 5.631 | -2,14 | 250 | 3,75 | ||||
| 2025-11-07 | 13F | Ontario Teachers Pension Plan Board | 0 | -100,00 | 0 | -100,00 | ||||
| 2026-02-17 | 13F | Susquehanna International Group, Llp | Call | 1.115.900 | 6,65 | 49.501 | 13,16 | |||
| 2026-02-09 | 13F | Avalon Trust Co | 0 | -100,00 | 0 | -100,00 | ||||
| 2026-04-01 | 13F | Neville Rodie & Shaw Inc | 5.258 | 0,00 | 0 | |||||
| 2026-02-12 | 13F | Sprott Inc. | 0 | -100,00 | 0 | -100,00 | ||||
| 2026-02-17 | 13F | Gilder Gagnon Howe & Co Llc | 150.003 | -3,63 | 6.654 | 2,24 | ||||
| 2026-02-02 | 13F | Sawyer & Company, Inc | 2.058 | -8,94 | 91 | |||||
| 2026-02-13 | 13F | Healthcare Of Ontario Pension Plan Trust Fund | 2.289.219 | 5.468,79 | 101.609 | 5.810,88 | ||||
| 2026-02-17 | 13F | Corigliano Investment Advisers, LLC | 388.000 | 17.212 | ||||||
| 2026-02-11 | 13F | Nikko Asset Management Americas, Inc. | 34.177 | 1.516 | ||||||
| 2026-01-30 | 13F | Keating Investment Counselors Inc | 176.383 | 1,00 | 7.824 | 7,16 | ||||
| 2026-04-02 | 13F | Marex Group plc | 0 | -100,00 | 0 | |||||
| 2026-02-04 | 13F | Pensionmark Financial Group, Llc | 28.830 | 2,81 | 1.222 | 4,27 | ||||
| 2026-02-12 | 13F | Jane Street Group, Llc | 350.403 | -67,94 | 15.544 | -65,99 | ||||
| 2026-02-11 | 13F | Allianz Asset Management GmbH | 2.261.106 | -3,77 | 100.489 | 2,17 | ||||
| 2026-02-12 | 13F | Jane Street Group, Llc | Put | 126.400 | -8,60 | 5.607 | -3,03 | |||
| 2026-02-10 | 13F | PCJ Investment Counsel Ltd. | 75.180 | 3,17 | 3.337 | 9,45 | ||||
| 2026-02-12 | 13F | Jane Street Group, Llc | Call | 377.800 | -6,65 | 16.759 | -0,95 | |||
| 2026-01-21 | 13F | Stock Yards Bank & Trust Co | 75.718 | -2,70 | 3.359 | 3,23 | ||||
| 2026-01-20 | 13F | American National Bank | 0 | -100,00 | 0 | |||||
| 2026-02-11 | 13F | United Financial Planning Group LLC | 41 | 2 | ||||||
| 2026-02-17 | 13F | Cape Investment Advisory, Inc. | 300 | 71,43 | 13 | 85,71 | ||||
| 2026-02-13 | 13F | Neuberger Berman Group LLC | 400.738 | -0,38 | 17.807 | 5,77 | ||||
| 2026-02-17 | 13F | Massar Capital Management, LP | 0 | -100,00 | 0 | |||||
| 2026-01-22 | 13F | Bfsg, Llc | 247 | 0,00 | 11 | 0,00 | ||||
| 2026-02-17 | 13F | Man Group plc | 275.410 | 12.237 | ||||||
| 2026-02-13 | 13F | Integrated Wealth Concepts LLC | 15.202 | -9,15 | 674 | -3,58 | ||||
| 2025-11-14 | 13F | Axa S.a. | 0 | -100,00 | 0 | -100,00 | ||||
| 2026-01-29 | 13F | Live Oak Investment Partners | 34.737 | 30,93 | 1.541 | 38,86 | ||||
| 2026-04-06 | 13F | CX Institutional | 154 | -57,34 | 0 | |||||
| 2026-02-17 | 13F | Interval Partners, LP | 183.128 | 393,75 | 8.124 | 424,06 | ||||
| 2026-01-22 | 13F | Massachusetts Financial Services Co /ma/ | 8.125.478 | -56,83 | 360.446 | -54,20 | ||||
| 2026-02-13 | 13F | Victory Capital Management Inc | 83.418 | -8,48 | 3.700 | -2,89 | ||||
| 2026-02-05 | 13F | Elyxium Wealth, LLC | 26 | 1 | ||||||
| 2026-02-12 | 13F | Hollencrest Capital Management | 2.000 | 89 | ||||||
| 2026-01-07 | 13F | Harbor Investment Advisory, Llc | 38.037 | 1,60 | 1.687 | 7,80 | ||||
| 2026-02-12 | 13F | Sustainable Insight Capital Management, LLC | 17.400 | 772 | ||||||
| 2026-04-07 | 13F | Park Avenue Securities Llc | 29.587 | -41,94 | 2 | -50,00 | ||||
| 2026-01-07 | 13F | Corsicana & Co. | 1.000 | 0,00 | 44 | 7,32 | ||||
| 2026-02-17 | 13F | Two Sigma Investments, Lp | 2.780.909 | 3,77 | 123.361 | 10,10 | ||||
| 2026-03-04 | 13F | SHP Wealth Management | 1.493 | 66 | ||||||
| 2026-02-10 | 13F | Scheer, Rowlett & Associates Investment Management Ltd. | 1.398.002 | -12,32 | 62.051 | -6,99 | ||||
| 2026-02-17 | 13F | Creative Planning | 222.483 | 21,21 | 9.869 | 28,60 | ||||
| 2026-02-11 | 13F | Zions Bancorporation, National Association /ut/ | 0 | -100,00 | 0 | |||||
| 2026-02-17 | 13F | Point72 Asset Management, L.P. | 2.036.954 | -30,92 | 90.426 | -26,69 | ||||
| 2026-02-13 | 13F | Toroso Investments, LLC | 37.886 | -22,56 | 1.681 | -17,85 | ||||
| 2026-02-11 | 13F | Syon Capital Llc | 22.199 | -1,03 | 985 | 5,02 | ||||
| 2026-02-17 | 13F | Point72 Asset Management, L.P. | Put | 193.000 | 38,75 | 8.561 | 47,22 | |||
| 2026-02-17 | 13F | Point72 Asset Management, L.P. | Call | 279.200 | 36,86 | 12.385 | 45,21 | |||
| 2026-02-13 | 13F | USS Investment Management Ltd | 127.297 | 0,00 | 5.649 | 6,12 | ||||
| 2026-02-17 | 13F | Capital Fund Management S.a. | Put | 86.400 | 0,00 | 3.833 | 6,09 | |||
| 2026-02-17 | 13F | Capital Fund Management S.a. | Call | 29.300 | -4,87 | 1.300 | 0,93 | |||
| 2026-02-13 | 13F | Kilter Group LLC | 27 | 350,00 | 1 | |||||
| 2026-02-13 | 13F | Ubs Asset Management Americas Inc | 1.491 | 66 | ||||||
| 2025-10-21 | 13F | Jarislowsky, Fraser Ltd | 118.134 | 7,12 | 4.945 | 19,94 | ||||
| 2025-11-14 | 13F/A | Skopos Labs, Inc. | 0 | -100,00 | 0 | -100,00 | ||||
| 2026-02-12 | 13F | Swiss National Bank | 3.204.592 | -9,27 | 142.525 | -3,61 | ||||
| 2025-11-17 | 13F | Parvin Asset Management, LLC | 0 | -100,00 | 0 | -100,00 | ||||
| 2026-02-10 | 13F | CIBC Asset Management Inc | 9.851.109 | 12,83 | 439.546 | 19,90 | ||||
| 2026-02-02 | 13F | Fifth Third Bancorp | 6.035 | 6,12 | 268 | 12,66 | ||||
| 2026-02-02 | 13F | Cornerstone Planning Group LLC | 271 | -94,50 | 14 | -94,64 | ||||
| 2026-02-10 | 13F | Gulf International Bank (UK) Ltd | 59.925 | 0,00 | 3 | -33,33 | ||||
| 2026-02-05 | 13F | Simmons Bank | 50.569 | 2,37 | 2.243 | 8,62 | ||||
| 2026-02-17 | 13F | BCV Asset Management Inc. | 551.389 | 40.821 | ||||||
| 2025-11-06 | 13F | Oppenheimer Asset Management Inc. | 0 | -100,00 | 0 | -100,00 | ||||
| 2026-02-13 | 13F | Atlas Capital Advisors Llc | 3.125 | 0,00 | 139 | 17,95 | ||||
| 2026-02-03 | 13F | Sumitomo Mitsui DS Asset Management Company, Ltd | 33.323 | 0,87 | 1.478 | 7,02 | ||||
| 2026-01-30 | 13F | Lincluden Management Ltd | 536.309 | -3,84 | 33 | 39,13 | ||||
| 2026-02-11 | 13F | Westerkirk Capital Inc. | 40.610 | -52,34 | 1.803 | -49,38 | ||||
| 2026-02-10 | 13F | Godfrey Financial Associates, Inc. | 241 | 11 | ||||||
| 2026-01-16 | 13F | FNY Investment Advisers, LLC | 500 | 0 | ||||||
| 2026-02-17 | 13F | Chilton Investment Co Llc | 5.500 | 0,00 | 244 | 6,11 | ||||
| 2026-02-09 | 13F | Accent Capital Management, LLC | 825 | 37,50 | 37 | 44,00 | ||||
| 2026-01-29 | 13F | Ashton Thomas Private Wealth, LLC | 60.438 | 0,30 | 2.681 | 6,43 | ||||
| 2026-01-28 | 13F | Gold Investment Management Ltd. | 148.079 | -3,41 | 6.573 | 2,43 | ||||
| 2026-02-17 | 13F | Cdkv Holdings Llc | 45 | 2 | ||||||
| 2026-02-10 | 13F | MUFG Securities EMEA plc | 450.000 | 19.978 | ||||||
| 2026-01-27 | 13F | Checchi Capital Advisers, LLC | 8.196 | -0,97 | 364 | 4,91 | ||||
| 2026-02-17 | 13F | Prelude Capital Management, Llc | 15.500 | -7,70 | 688 | -2,14 | ||||
| 2026-01-15 | 13F | Hara Capital LLC | 5.200 | 0,00 | 231 | 5,99 | ||||
| 2026-02-13 | 13F | Ambassador Advisors, LLC | 8.286 | 0,07 | 368 | 6,07 | ||||
| 2026-01-15 | 13F | Spirit Of America Management Corp/ny | 4.000 | 0,00 | 177 | 5,99 | ||||
| 2026-02-17 | 13F | Schonfeld Strategic Advisors LLC | 19.388 | -79,68 | 860 | -78,44 | ||||
| 2026-02-17 | 13F | Nitor Capital Management LLC | 52.193 | 2.315 | ||||||
| 2026-02-13 | 13F | National Bank Of Canada /fi/ | 11.476.043 | 41,24 | 508.789 | 49,78 | ||||
| 2026-04-08 | 13F | Miracle Mile Advisors, LLC | 4.915 | 325 | ||||||
| 2026-01-09 | 13F | 180 Wealth Advisors, Llc | 15.208 | 4,42 | 675 | 10,86 | ||||
| 2026-02-11 | 13F | Empowered Funds, LLC | 86.318 | 52,39 | 3.829 | 61,70 | ||||
| 2026-02-03 | 13F | Chesapeake Capital Corp /il/ | 22.741 | 0,90 | 1.009 | 7,01 | ||||
| 2026-02-06 | 13F | Aviance Capital Partners, LLC | 11.713 | -0,64 | 520 | 5,49 | ||||
| 2026-01-15 | 13F | Westend Capital Management LLC | 0 | -100,00 | 0 | |||||
| 2026-02-17 | 13F | Scientech Research LLC | 5.949 | 264 | ||||||
| 2026-01-12 | 13F | First Merchants Corp | 0 | -100,00 | 0 | |||||
| 2026-04-02 | 13F | Hilltop National Bank | 3.930 | -4,43 | 260 | 42,31 | ||||
| 2026-02-12 | 13F | Barometer Capital Management Inc. | 0 | -100,00 | 0 | -100,00 | ||||
| 2026-02-17 | 13F | Worldquant Millennium Advisors Llc | 22.865 | -46,90 | 1.015 | -43,64 | ||||
| 2026-02-17 | 13F | Pinnacle Financial Partners, Inc. | 100.507 | 4.459 | ||||||
| 2026-02-03 | 13F | Farmers & Merchants Investments Inc | 10.915 | 0,00 | 484 | 6,14 | ||||
| 2026-01-23 | 13F | Westside Investment Management, Inc. | 564 | 0,00 | 26 | 8,70 | ||||
| 2025-11-17 | 13F | FSA Wealth Management LLC | 245 | 0,00 | 10 | 11,11 | ||||
| 2026-02-13 | 13F | Mariner, LLC | 81.483 | 11,21 | 3.615 | 18,02 | ||||
| 2026-01-22 | 13F | Bear Mountain Capital, Inc. | 0 | -100,00 | 0 | |||||
| 2026-02-18 | 13F | Mackenzie Financial Corp | 12.029.032 | 1,25 | 534.400 | 7,51 | ||||
| 2026-02-12 | 13F | Callan Family Office, LLC | 8.130 | 361 | ||||||
| 2026-02-13 | 13F | Verition Fund Management LLC | 0 | -100,00 | 0 | |||||
| 2026-02-12 | 13F | Colonial Trust Co / SC | 588 | 0,00 | 26 | 8,33 | ||||
| 2026-02-11 | 13F | Nemes Rush Group LLC | 1.600 | 0,00 | 71 | 6,06 | ||||
| 2026-03-06 | 13F | Union Savings Bank | 2.475 | 0,00 | 110 | 12,37 | ||||
| 2026-02-13 | 13F | Bank Of Nova Scotia | 3.970.557 | -21,04 | 176.225 | -16,27 | ||||
| 2026-02-17 | 13F | Basso Capital Management, L.p. | 2.700 | 0,00 | 120 | 6,25 | ||||
| 2026-01-27 | 13F | Institute for Wealth Management, LLC. | 10.023 | 0,00 | 445 | 5,97 | ||||
| 2026-02-05 | 13F | Atria Investments Llc | 6.814 | 1,32 | 302 | 7,47 | ||||
| 2026-01-23 | 13F | Rsm Us Wealth Management Llc | 6.850 | -4,72 | 305 | 1,33 | ||||
| 2026-02-06 | 13F | Pnc Financial Services Group, Inc. | 136.000 | 0,14 | 6.033 | 6,23 | ||||
| 2026-02-17 | 13F | Russell Investments Group, Ltd. | 462.836 | -18,62 | 20.567 | -13,60 | ||||
| 2026-01-28 | 13F | Loring Wolcott & Coolidge Fiduciary Advisors Llp/ma | 5.000 | 0,00 | 260 | 31,31 | ||||
| 2026-02-10 | 13F | Natixis Advisors, L.p. | 489.727 | -1,47 | 22 | 5,00 | ||||
| 2025-11-04 | 13F | Guerra Advisors Inc | 331 | 14 | ||||||
| 2026-02-13 | 13F | Barclays Plc | 7.902.448 | -7,78 | 350.553 | -2,16 | ||||
| 2026-02-13 | 13F | Barclays Plc | Call | 370.000 | 0,00 | 16.413 | 6,10 | |||
| 2026-04-06 | 13F | Highline Wealth Partners Llc | 147 | 19,51 | 10 | 80,00 | ||||
| 2026-02-13 | 13F | Barclays Plc | Put | 370.000 | 0,00 | 16.413 | 6,10 | |||
| 2026-02-10 | 13F | Connor, Clark & Lunn Investment Management Ltd. | 9.795.488 | -1,70 | 434.777 | 4,28 | ||||
| 2026-02-05 | 13F | Integrated Investment Consultants, LLC | 4.710 | 209 | ||||||
| 2025-11-14 | 13F | Wolverine Trading, Llc | Put | 159.800 | 20,33 | 6.707 | 34,36 | |||
| 2026-02-12 | 13F | Triumph Capital Management | 36 | 0,00 | 2 | 0,00 | ||||
| 2026-02-17 | 13F | Family Management Corp | 6.703 | 30,03 | 297 | 38,14 | ||||
| 2026-02-17 | 13F | Clark Capital Management Group, Inc. | 1.302.198 | 60,75 | 57.766 | 70,56 | ||||
| 2026-01-29 | 13F | Verdence Capital Advisors LLC | 0 | -100,00 | 0 | -100,00 | ||||
| 2026-02-13 | 13F | Towarzystwo Funduszy Inwestycyjnych Pzu Sa | 3.844 | 18,02 | 171 | 25,00 | ||||
| 2026-01-22 | 13F | Bartlett & Co. Wealth Management Llc | 2.000 | 0,00 | 89 | 6,02 | ||||
| 2026-01-22 | 13F | Financial Consulate, Inc | 1.007 | 45 | ||||||
| 2026-02-10 | 13F | Private Wealth Asset Management, LLC | 101 | -64,44 | 4 | -63,64 | ||||
| 2026-02-17 | 13F | Two Sigma Securities, Llc | 0 | -100,00 | 0 |