Grundlæggende statistik
| Institutionelle aktier (lange) | 353.758.023 - 112,19% (ex 13D/G) - change of 10,28MM shares 2,99% MRQ |
| Institutionel værdi (lang) | $ 5.096.615 USD ($1000) |
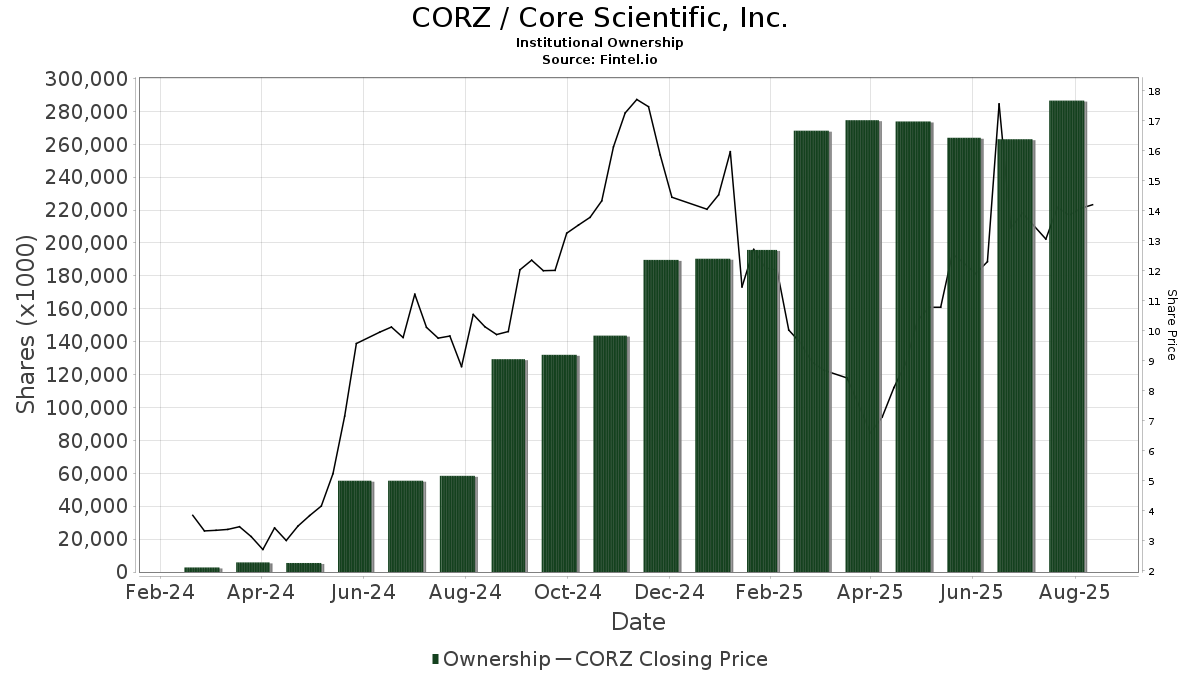
Institutionelt ejerskab og aktionærer
Core Scientific, Inc. (US:CORZ) har 393 institutionelle ejere og aktionærer, der har indsendt 13D/G- eller 13F-formularer til Securities Exchange Commission (SEC). Disse institutioner har i alt 353,758,023 aktier. Største aktionærer omfatter Vanguard Group Inc, Situational Awareness LP, Pentwater Capital Management LP, BlackRock, Inc., UBS Group AG, Two Seas Capital LP, Susquehanna International Group, Llp, Jericho Capital Asset Management L.P., Citadel Advisors Llc, and Susquehanna International Group, Llp .
Core Scientific, Inc. (NasdaqGS:CORZ) institutionel ejerskabsstruktur viser aktuelle positioner i virksomheden efter institutioner og fonde, samt seneste ændringer i positionsstørrelse. Større aktionærer kan omfatte individuelle investorer, investeringsforeninger, hedgefonde eller institutioner. Skema 13D angiver, at investoren besidder (eller besidder) mere end 5 % af virksomheden og har til hensigt (eller har til hensigt at) aktivt at forfølge en ændring i forretningsstrategi. Skema 13G indikerer en passiv investering på over 5%.
The share price as of April 10, 2026 is 18,32 / share. Previously, on April 14, 2025, the share price was 7,06 / share. This represents an increase of 159,49% over that period.
Fondens stemningsscore
Fund Sentiment Score (fka Ownership Accumulation Score) finder de aktier, der bliver mest købt af fonde. Det er resultatet af en sofistikeret, multi-faktor kvantitativ model, der identificerer virksomheder med de højeste niveauer af institutionel akkumulering. Scoringsmodellen bruger en kombination af den samlede stigning i oplyste ejere, ændringerne i porteføljeallokeringer i disse ejere og andre målinger. Tallet går fra 0 til 100, hvor højere tal indikerer et højere niveau af akkumulering for sine jævnaldrende, og 50 er gennemsnittet.
Opdateringsfrekvens: Dagligt
Se Ownership Explorer, som giver en liste over højest rangerende virksomheder.
AI+ Ask Fintel’s AI assistant about Core Scientific, Inc..
Select a question to share a public post with an AI-crafted answer.
Thinking of good questions…
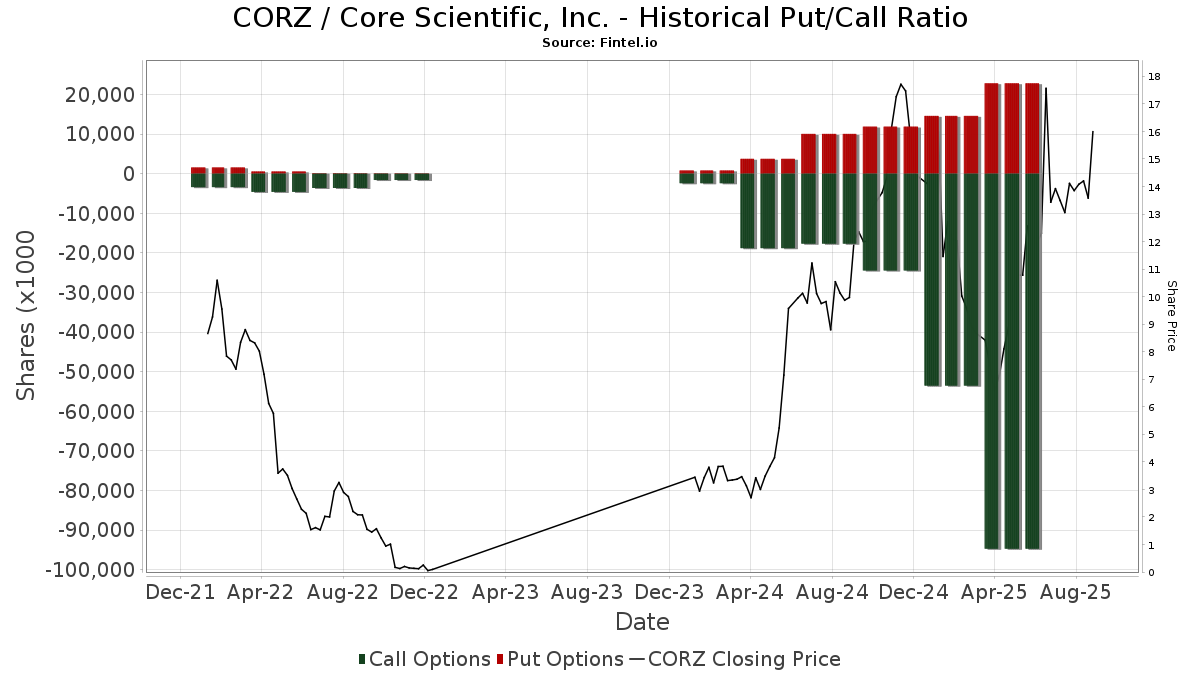
Institutionel Put/Call-forhold
Ud over at indberette standardaktie- og gældsudstedelser skal institutter med mere end 100 mill. aktiver under forvaltning også oplyse deres put- og call-optionsbeholdninger. Da salgsoptioner generelt indikerer negativ stemning, og købsoptioner indikerer positiv stemning, kan vi få en fornemmelse af den overordnede institutionelle stemning ved at plotte forholdet mellem put og kald. Diagrammet til højre viser det historiske put/call-forhold for dette instrument.
Brug af Put/Call Ratio som en indikator for investorernes stemning overvinder en af de vigtigste mangler ved at bruge totalt institutionelt ejerskab, som er, at en betydelig mængde af aktiver under forvaltning investeres passivt for at spore indekser. Passivt forvaltede fonde køber typisk ikke optioner, så indikatoren for put/call-forholdet følger mere nøje følelsen af aktivt forvaltede fonde.
13D/G-arkivering
Vi præsenterer 13D/G ansøgninger separat fra 13F ansøgninger på grund af den forskellige behandling af SEC. 13D/G-ansøgninger kan indgives af grupper af investorer (med én ledende), hvorimod 13F-ansøgninger ikke kan. Dette resulterer i situationer, hvor en investor kan indsende en 13D/G, der rapporterer én værdi for de samlede aktier (der repræsenterer alle de aktier, der ejes af investorgruppen), men derefter indsender en 13F, der rapporterer en anden værdi for de samlede aktier (der udelukkende repræsenterer deres egne) ejendomsret). Det betyder, at aktieejerskab af 13D/G-arkiver og 13F-arkiveringer ofte ikke er direkte sammenlignelige, så vi præsenterer dem separat.
Bemærk: Fra den 16. maj 2021 viser vi ikke længere ejere, der ikke har indsendt en 13D/G inden for det seneste år. Tidligere viste vi den fulde historie af 13D/G-arkiver. Generelt skal enheder, der er forpligtet til at indgive 13D/G-ansøgninger, indgive mindst årligt, før de indsender en afsluttende ansøgning. Dog forlader fonde nogle gange positioner uden at indsende en afsluttende ansøgning (dvs. de afvikler), så visning af den fulde historie resulterede nogle gange i forvirring om det nuværende ejerskab. For at undgå forvirring viser vi nu kun 'aktuelle' ejere - det vil sige - ejere, der har anmeldt inden for det seneste år.
Upgrade to unlock premium data.
| Fil dato | Form | Investor | Forrige Aktier |
Seneste Aktier |
Δ Aktier (Procent) |
Ejendomsret (Procent) |
Δ Ejerskab (Procent) |
|
|---|---|---|---|---|---|---|---|---|
| 2026-03-12 | Valiant Capital Management, L.P. | 13,120,302 | 16,212,903 | 23.57 | 5.10 | 21.43 | ||
| 2026-03-04 | Two Seas Capital LP | 20,697,679 | 18,716,679 | -9.57 | 5.90 | -11.94 | ||
| 2026-02-13 | SUSQUEHANNA SECURITIES, LLC | 15,268,201 | 17,376,097 | 13.81 | 5.60 | 14.29 | ||
| 2026-02-11 | BARCLAYS PLC | 16,203,350 | 1,302,387 | -91.96 | 0.42 | -92.03 | ||
| 2026-01-07 | VANGUARD GROUP INC | 27,249,215 | 33,960,320 | 24.63 | 10.95 | 19.80 | ||
| 2025-12-10 | Citadel Securities GP LLC | 17,185,727 | 5.50 | |||||
| 2025-11-14 | Pentwater Capital Management LP | 26,050,000 | 8.50 | |||||
| 2025-10-14 | Situational Awareness LP | 17,682,918 | 28,756,478 | 62.62 | 9.40 | 62.07 | ||
| 2025-07-16 | BlackRock, Inc. | 15,547,691 | 23,299,564 | 49.86 | 7.80 | 30.00 | ||
| 2025-05-15 | Beryl Capital Management LLC | 15,492,487 | 0 | -100.00 | 0.00 | -100.00 |
13F og NPORT arkivering
Detaljer om 13F-arkivering er gratis. Detaljer om NP-ansøgninger kræver et premium-medlemskab. Grønne rækker angiver nye positioner. Røde rækker angiver lukkede positioner. Klik på linket ikon for at se den fulde transaktionshistorik.
Opgrader
for at låse premium-data op og eksportere til Excel ![]() .
.
| Fil dato | Kilde | Investor | Type | Gennemsnitlig pris (Øst) |
Aktier | Δ Aktier (%) |
Rapporteret Værdi ($1000) |
Δ Værdi (%) |
Port Alloc (%) |
|
|---|---|---|---|---|---|---|---|---|---|---|
| 2026-02-12 | 13F | MetLife Investment Management, LLC | 163.181 | -1,86 | 2.376 | -20,38 | ||||
| 2026-02-17 | 13F | Beartown Capital Management, LLC | 800.000 | 11.648 | ||||||
| 2026-02-17 | 13F | Adage Capital Partners Gp, L.l.c. | 343.135 | -73,97 | 4.996 | -78,87 | ||||
| 2026-02-02 | 13F | Danske Bank A/s | 2.500 | 36 | ||||||
| 2025-11-13 | 13F | Cobalt Capital Management, Inc. | 0 | -100,00 | 0 | |||||
| 2025-11-14 | 13F | Discovery Capital Management, Llc / Ct | 0 | -100,00 | 0 | -100,00 | ||||
| 2026-01-29 | 13F | RMG Wealth Management LLC | 100 | 0,00 | 2 | 0,00 | ||||
| 2026-02-17 | 13F | Clear Street Markets Llc | 75.000 | 114,29 | 1.092 | 74,16 | ||||
| 2026-02-17 | 13F | Granahan Investment Management Inc/ma | 350.956 | 5.110 | ||||||
| 2026-02-13 | 13F | Bridgefront Capital, LLC | 12.367 | 180 | ||||||
| 2025-10-28 | 13F | Wolff Wiese Magana Llc | 0 | -100,00 | 0 | -100,00 | ||||
| 2026-02-09 | 13F | Quest Partners LLC | 13.190 | -76,08 | 192 | -80,59 | ||||
| 2026-02-17 | 13F | ADAR1 Capital Management, LLC | 30.000 | 437 | ||||||
| 2026-02-10 | 13F | Mutual Of America Capital Management Llc | 583.916 | -2,38 | 8.502 | -20,78 | ||||
| 2026-02-12 | 13F | Wealthspire Advisors, LLC | 0 | -100,00 | 0 | |||||
| 2026-02-17 | 13F | Beartown Capital Management, LLC | Call | 200.000 | 2.912 | |||||
| 2025-11-14 | 13F | D. E. Shaw & Co., Inc. | Call | 0 | -100,00 | 0 | -100,00 | |||
| 2025-11-24 | 13F | Greenfield Seitz Capital Management, LLC | 0 | -100,00 | 0 | -100,00 | ||||
| 2026-01-27 | 13F | Zurcher Kantonalbank (Zurich Cantonalbank) | 94.557 | 11,56 | 1.377 | -9,47 | ||||
| 2026-01-26 | 13F | Mirae Asset Global Investments Co., Ltd. | 1.073 | 20,29 | 16 | -6,25 | ||||
| 2026-01-30 | 13F | R Squared Ltd | 0 | -100,00 | 0 | |||||
| 2025-11-14 | 13F | Beacon Pointe Advisors, LLC | 0 | -100,00 | 0 | |||||
| 2026-02-11 | 13F | Jpmorgan Chase & Co | 3.689.053 | 584,18 | 53.713 | 455,28 | ||||
| 2026-02-17 | 13F | California State Teachers Retirement System | 236.676 | -12,94 | 3.446 | -29,34 | ||||
| 2026-01-27 | 13F | First Horizon Corp | 802 | 0,00 | 12 | -21,43 | ||||
| 2026-02-13 | 13F | Caxton Associates Llp | 0 | -100,00 | 0 | |||||
| 2025-10-15 | 13F | Private Trust Co Na | 0 | -100,00 | 0 | -100,00 | ||||
| 2025-11-13 | 13F | Advent Capital Management /de/ | Call | 0 | -100,00 | 0 | -100,00 | |||
| 2026-01-21 | 13F | Raleigh Capital Management Inc. | 200 | 3 | ||||||
| 2026-02-09 | 13F | Legal & General Group Plc | 258.547 | -1,20 | 3.764 | -19,81 | ||||
| 2026-02-18 | 13F | Vident Advisory, LLC | 959.564 | 9,33 | 13.971 | -11,27 | ||||
| 2026-02-13 | 13F | Greenline Wealth Management LLC | 684 | 10 | ||||||
| 2026-02-02 | 13F | Wolverine Asset Management Llc | Put | 647.700 | 0,00 | 9.431 | -18,84 | |||
| 2025-11-13 | 13F | Eisler Capital Management Ltd. | 0 | -100,00 | 0 | -100,00 | ||||
| 2026-02-17 | 13F | Raymond James Financial Inc | 103.429 | -9,95 | 1.506 | -26,94 | ||||
| 2025-11-05 | 13F | Wellington Shields Capital Management, LLC | 0 | -100,00 | 0 | |||||
| 2026-01-08 | 13F | Chesapeake Asset Management Llc | 0 | -100,00 | 0 | -100,00 | ||||
| 2026-02-13 | 13F | Wells Fargo & Company/mn | 388.554 | 49,83 | 5.657 | 21,60 | ||||
| 2025-11-13 | 13F | Lord, Abbett & Co. Llc | 0 | -100,00 | 0 | -100,00 | ||||
| 2026-02-06 | 13F | HighTower Advisors, LLC | 54.560 | -14,87 | 794 | -30,90 | ||||
| 2026-02-17 | 13F | Armistice Capital, Llc | 19.589 | 285 | ||||||
| 2025-11-13 | 13F | Qsemble Capital Management, LP | 0 | -100,00 | 0 | |||||
| 2025-11-14 | 13F | Parsifal Capital Management, LP | Put | 0 | -100,00 | 0 | ||||
| 2026-02-03 | 13F | Credit Industriel Et Commercial | 7.630 | 111 | ||||||
| 2026-02-13 | 13F | Brooklands Fund Management Ltd | Call | 0 | -100,00 | 0 | ||||
| 2026-02-03 | 13F | Credit Industriel Et Commercial | Put | 20.000 | 291 | |||||
| 2026-02-13 | 13F | Itau Unibanco Holding S.A. | 0 | -100,00 | 0 | |||||
| 2026-02-09 | 13F | Keating Financial Advisory Services, Inc. | 15 | 0 | ||||||
| 2025-11-14 | 13F | Caption Management, LLC | 0 | -100,00 | 0 | -100,00 | ||||
| 2025-11-13 | 13F | Riggs Asset Managment Co. Inc. | 0 | -100,00 | 0 | |||||
| 2026-02-17 | 13F | Vennlight Capital Management, LP | 0 | -100,00 | 0 | -100,00 | ||||
| 2026-02-13 | 13F | Walleye Capital LLC | Put | 2.700 | -91,59 | 39 | -93,22 | |||
| 2026-02-17 | 13F | VR Advisory Services Ltd | 2.033.954 | 67,85 | 29.614 | 36,23 | ||||
| 2026-02-17 | 13F | Royal Bank Of Canada | 58.321 | -95,09 | 849 | -96,02 | ||||
| 2026-02-24 | 13F | Tru Independence Asset Management 2, Llc | 0 | -100,00 | 0 | -100,00 | ||||
| 2026-02-17 | 13F | Bank Of America Corp /de/ | Put | 0 | -100,00 | 0 | ||||
| 2026-02-13 | 13F | Walleye Capital LLC | Call | 62.800 | -2,94 | 914 | -21,21 | |||
| 2026-02-13 | 13F | Rhumbline Advisers | 356.735 | -13,18 | 5.194 | -29,53 | ||||
| 2026-02-13 | 13F | Soros Fund Management Llc | 5.458 | 79 | ||||||
| 2025-10-21 | 13F | Wealth Management Partners, LLC | 0 | -100,00 | 0 | |||||
| 2026-02-17 | 13F | Taconic Capital Advisors LP | 0 | -100,00 | 0 | -100,00 | ||||
| 2026-02-06 | 13F | Cullen/frost Bankers, Inc. | 850 | 12 | ||||||
| 2026-01-08 | 13F | Sanders Morris Harris Llc | 0 | -100,00 | 0 | -100,00 | ||||
| 2026-02-05 | 13F | ACR Alpine Capital Research, LLC | 0 | -100,00 | 0 | |||||
| 2026-02-17 | 13F | LMR Partners LLP | 933.258 | 240,02 | 13.588 | 175,95 | ||||
| 2026-02-17 | 13F | LMR Partners LLP | Put | 200.000 | -0,05 | 2.912 | -18,86 | |||
| 2026-03-20 | 13F | Purpose Unlimited Inc. | 21.455 | 312 | ||||||
| 2025-11-14 | 13F | Northern Right Capital Management, L.P. | 0 | -100,00 | 0 | |||||
| 2026-02-11 | 13F | Franklin Resources Inc | 20.288 | 22,33 | 295 | -0,67 | ||||
| 2026-02-13 | 13F | Y-Intercept (Hong Kong) Ltd | 0 | -100,00 | 0 | |||||
| 2026-02-13 | 13F | Pinnacle Wealth Planning Services, Inc. | 76 | 1 | ||||||
| 2026-01-06 | 13F | Nelson, Van Denburg & Campbell Wealth Management Group, LLC | 0 | -100,00 | 0 | -100,00 | ||||
| 2025-11-21 | 13F/A | CIBC Bancorp USA Inc. | 30.320 | 544 | ||||||
| 2026-02-17 | 13F | CastleKnight Management LP | 334.060 | -18,11 | 4.864 | -33,55 | ||||
| 2026-02-05 | 13F | Td Private Client Wealth Llc | 0 | -100,00 | 0 | |||||
| 2026-02-17 | 13F | SummitTX Capital, L.P. | 147.096 | 2.142 | ||||||
| 2026-02-13 | 13F | Nicholas Investment Partners, LP | 112.077 | -42,32 | 1.632 | -53,21 | ||||
| 2026-02-17 | 13F | LMR Partners LLP | Call | 500.000 | -80,45 | 7.280 | -84,13 | |||
| 2026-01-07 | 13F | Massmutual Trust Co Fsb/adv | 149 | 0,00 | 2 | 0,00 | ||||
| 2025-11-14 | 13F | J. Goldman & Co LP | 0 | -100,00 | 0 | |||||
| 2026-01-29 | 13F | Pictet Asset Management Holding SA | 71.525 | 85,72 | 1.041 | 50,87 | ||||
| 2026-02-04 | 13F | HighPoint Advisor Group LLC | 10.736 | 0,00 | 156 | -18,75 | ||||
| 2026-02-17 | 13F | Alight Capital Management LP | Call | 400.000 | 5.824 | |||||
| 2026-02-18 | 13F | Mackenzie Financial Corp | 17.820 | 1,85 | 260 | -17,25 | ||||
| 2025-11-14 | 13F | Nishkama Capital, LLC | Call | 0 | -100,00 | 0 | ||||
| 2026-02-17 | 13F | Fmr Llc | 544.868 | -93,30 | 7.933 | -94,56 | ||||
| 2026-01-23 | 13F | Avion Wealth | 60 | 0,00 | 0 | |||||
| 2026-02-17 | 13F | Steamboat Capital Partners, LLC | 196.433 | 2.860 | ||||||
| 2026-02-05 | 13F | Amalgamated Bank | 9.123 | -3,18 | 0 | |||||
| 2026-02-13 | 13F | National Bank Of Canada /fi/ | 0 | -100,00 | 0 | |||||
| 2026-02-11 | 13F | Winton Capital Group Ltd | 244.379 | 1.304,48 | 3.558 | 1.040,38 | ||||
| 2026-02-17 | 13F | Ameriprise Financial Inc | 232.557 | 518,34 | 3.386 | 402,37 | ||||
| 2026-02-12 | 13F | Advisors Asset Management, Inc. | 2.682 | -0,89 | 39 | -18,75 | ||||
| 2026-02-12 | 13F | Bank Of Montreal /can/ | 21.592 | 4,19 | 314 | -15,36 | ||||
| 2025-11-13 | 13F | Quinn Opportunity Partners LLC | 0 | -100,00 | 0 | |||||
| 2025-11-10 | 13F | Kazazian Asset Management, LLC | 0 | -100,00 | 0 | |||||
| 2025-10-22 | 13F | Geneos Wealth Management Inc. | 0 | -100,00 | 0 | |||||
| 2026-02-13 | 13F | Maven Securities LTD | 0 | -100,00 | 0 | |||||
| 2026-02-17 | 13F | TIG Advisors, LLC | 0 | -100,00 | 0 | |||||
| 2026-04-09 | 13F | Moody National Bank Trust Division | 109.142 | 94,85 | 1.633 | 100,25 | ||||
| 2026-02-17 | 13F | TIG Advisors, LLC | Put | 0 | -100,00 | 0 | ||||
| 2026-04-07 | 13F | Farther Finance Advisors, LLC | 1.569 | -39,89 | 24 | -36,84 | ||||
| 2026-02-17 | 13F | Price T Rowe Associates Inc /md/ | 652.225 | -85,03 | 9 | -88,46 | ||||
| 2026-01-16 | 13F | FNY Investment Advisers, LLC | 86.040 | 1 | ||||||
| 2026-02-17 | 13F | Clearline Capital LP | 4.689.443 | 274,16 | 68.278 | 203,67 | ||||
| 2026-02-17 | 13F | Numerai GP LLC | 16.949 | 247 | ||||||
| 2026-02-13 | 13F | Police & Firemen's Retirement System of New Jersey | 77.714 | -1,62 | 1.132 | -20,18 | ||||
| 2026-02-11 | 13F | Deltroit Asset Management (UK) LLP | Call | 1.200.000 | 17.472 | |||||
| 2026-02-06 | 13F | Covestor Ltd | 65.621 | 225,91 | 1 | |||||
| 2026-01-29 | 13F | Concurrent Investment Advisors, LLC | 309.879 | 35,77 | 4.512 | 10,19 | ||||
| 2026-02-06 | 13F | Covestor Ltd | Call | 164 | -0,61 | 0 | ||||
| 2026-02-11 | 13F | Deltroit Asset Management (UK) LLP | 500.000 | 7.280 | ||||||
| 2026-02-13 | 13F | Toroso Investments, LLC | 2.202.801 | 280,52 | 32.073 | 208,83 | ||||
| 2026-02-17 | 13F | Sig Brokerage, Lp | Call | 300.000 | -37,64 | 4.368 | -49,39 | |||
| 2026-02-17 | 13F | DZ BANK AG Deutsche Zentral Genossenschafts Bank, Frankfurt am Main | 430.989 | -26,00 | 6.275 | -39,93 | ||||
| 2026-02-17 | 13F | Advisor Group Holdings, Inc. | 5.084 | -74,56 | 74 | -78,92 | ||||
| 2026-02-10 | 13F | Connor, Clark & Lunn Investment Management Ltd. | 0 | -100,00 | 0 | |||||
| 2025-12-15 | 13F | FNY Investment Advisers, LLC | Call | 0 | -100,00 | 0 | ||||
| 2026-02-13 | 13F | Toroso Investments, LLC | Call | 375.500 | -30,77 | 5.467 | -43,81 | |||
| 2025-12-15 | 13F | FNY Investment Advisers, LLC | Put | 0 | -100,00 | 0 | ||||
| 2026-02-13 | 13F | MYDA Advisors LLC | Call | 200.000 | 566,67 | 2.912 | 441,26 | |||
| 2026-01-30 | 13F | Pekin Hardy Strauss, Inc. | 10.000 | 146 | ||||||
| 2026-02-06 | 13F | EverSource Wealth Advisors, LLC | 92 | -49,17 | 1 | -66,67 | ||||
| 2026-02-17 | 13F | Sig Brokerage, Lp | Put | 125.000 | 34,70 | 1.820 | 9,38 | |||
| 2026-02-09 | 13F | Berkshire Capital Holdings Inc | 10 | 0,00 | 0 | |||||
| 2026-02-17 | 13F | Harvest Management Llc | 0 | -100,00 | 0 | |||||
| 2025-11-14 | 13F | Sassicaia Capital Advisers Llc | 0 | -100,00 | 0 | -100,00 | ||||
| 2026-02-06 | 13F | Pnc Financial Services Group, Inc. | 3.111 | 1,40 | 45 | -18,18 | ||||
| 2026-02-17 | 13F | Abel Hall, LLC | 18.556 | 270 | ||||||
| 2026-02-13 | 13F | MYDA Advisors LLC | 1.167.000 | 4,20 | 16.992 | -15,43 | ||||
| 2026-02-10 | 13F | Savant Capital, LLC | 0 | -100,00 | 0 | |||||
| 2026-02-05 | 13F | Allworth Financial LP | 1.458 | 3,40 | 21 | -16,00 | ||||
| 2026-02-06 | 13F | Legato Capital Management LLC | 19.353 | -23,13 | 282 | -37,69 | ||||
| 2026-03-16 | 13F | Osbon Capital Management Llc | 13.852 | 202 | ||||||
| 2026-02-10 | 13F | Impact Partnership Wealth, LLC | 30.604 | 14,89 | 446 | -6,71 | ||||
| 2026-02-13 | 13F | PSquared Asset Management AG | 0 | -100,00 | 0 | -100,00 | ||||
| 2025-11-14 | 13F | Skopos Labs, Inc. | 0 | -100,00 | 0 | -100,00 | ||||
| 2026-04-08 | 13F | Wealth Enhancement Advisory Services, Llc | 22.274 | -57,88 | 362 | -59,30 | ||||
| 2026-03-03 | 13F/A | Caitong International Asset Management Co., Ltd | 46.987 | 2.631,80 | 684 | 2.180,00 | ||||
| 2025-11-13 | 13F | Bank Of Montreal /can/ | Call | 0 | -100,00 | 0 | -100,00 | |||
| 2026-02-17 | 13F | Creative Planning | Call | 0 | -100,00 | 0 | ||||
| 2026-02-13 | 13F | Stifel Financial Corp | 71.276 | 144,94 | 1.038 | 98,66 | ||||
| 2026-01-29 | 13F | UMA Financial Services, Inc. | 106 | 43,24 | 2 | 0,00 | ||||
| 2026-02-13 | 13F | Clear Street Group Inc. | 52.165 | 760 | ||||||
| 2025-11-13 | 13F | NINE MASTS CAPITAL Ltd | 0 | -100,00 | 0 | -100,00 | ||||
| 2025-11-14 | 13F | ExodusPoint Capital Management, LP | Call | 198.400 | 296,80 | 3.563 | ||||
| 2026-01-29 | 13F | Comerica Bank | 3.997.581 | -13,67 | 58.205 | -29,93 | ||||
| 2026-02-17 | 13F | Glenmede Trust Co Na | 21.697 | -50,95 | 316 | -1,56 | ||||
| 2025-11-14 | 13F | ExodusPoint Capital Management, LP | 644.738 | 643,73 | 11.567 | 1.156.500,00 | ||||
| 2026-02-06 | 13F | Harvest Portfolios Group Inc. | 139.850 | -38,23 | 2.036 | -49,86 | ||||
| 2026-02-06 | 13F | Handelsbanken Fonder AB | 93.800 | 42,12 | 1 | 0,00 | ||||
| 2026-02-17 | 13F | Sender Co & Partners, Inc. | 0 | -100,00 | 0 | |||||
| 2025-10-27 | 13F | Belvedere Trading LLC | Put | 0 | -100,00 | 0 | -100,00 | |||
| 2025-10-27 | 13F | Belvedere Trading LLC | Call | 0 | -100,00 | 0 | -100,00 | |||
| 2026-01-30 | 13F | Activest Wealth Management | 77 | 1 | ||||||
| 2026-02-09 | 13F | Jefferies Financial Group Inc. | Put | 160.300 | 2.334 | |||||
| 2026-02-13 | 13F | Mariner, LLC | 30.368 | 15,03 | 442 | -6,55 | ||||
| 2026-02-09 | 13F | Jefferies Financial Group Inc. | Call | 700.000 | 13.900,00 | 10.192 | 11.351,69 | |||
| 2026-02-17 | 13F | Guggenheim Capital Llc | 15.483 | -44,32 | 225 | -54,82 | ||||
| 2026-02-17 | 13F | Voleon Capital Management Lp | 403.199 | 4,10 | 5.871 | -15,52 | ||||
| 2026-02-09 | 13F | Jefferies Financial Group Inc. | 406.667 | 5.669,14 | 5.921 | 4.599,21 | ||||
| 2026-02-17 | 13F | Paloma Partners Management Co | 185.000 | 2.694 | ||||||
| 2026-02-10 | 13F/A | Northwestern Mutual Wealth Management Co | 25 | 0 | ||||||
| 2026-02-09 | 13F | Harbour Investments, Inc. | 265 | 4 | ||||||
| 2026-02-02 | 13F | Wolverine Asset Management Llc | 0 | -100,00 | 0 | -100,00 | ||||
| 2026-02-12 | 13F | Cibc World Markets Corp | 19.211 | -43,55 | 280 | -51,90 | ||||
| 2026-02-11 | 13F | Parallel Advisors, LLC | 661 | 63,21 | 10 | 28,57 | ||||
| 2026-02-13 | 13F | Vontobel Holding Ltd. | Call | 0 | -100,00 | 0 | -100,00 | |||
| 2026-02-17 | 13F | Jain Global LLC | 316.368 | 266,41 | 4.606 | 197,55 | ||||
| 2026-01-20 | 13F | SOA Wealth Advisors, LLC. | 252 | 4 | ||||||
| 2026-01-23 | 13F | Patten Group, Inc. | 0 | -100,00 | 0 | |||||
| 2026-01-29 | 13F | Sanctuary Advisors, LLC | 34.285 | -0,75 | 499 | -19,39 | ||||
| 2026-02-10 | 13F | Deuterium Capital Management, LLC | 300.000 | 0,00 | 4.368 | -18,84 | ||||
| 2026-02-10 | 13F | Godfrey Financial Associates, Inc. | 16 | 0 | ||||||
| 2026-02-17 | 13F | Schonfeld Strategic Advisors LLC | 0 | -100,00 | 0 | |||||
| 2026-02-17 | 13F | Arosa Capital Management LP | Call | 1.850.000 | 26.936 | |||||
| 2026-02-17 | 13F | Silverback Asset Management Llc | 160.900 | 2.343 | ||||||
| 2026-02-17 | 13F | Schonfeld Strategic Advisors LLC | Call | 0 | -100,00 | 0 | ||||
| 2026-02-17 | 13F | Feynman Point Asset Management LLC | 208.465 | 3.035 | ||||||
| 2026-02-17 | 13F | Alliancebernstein L.p. | 297.817 | -11,66 | 4.336 | -28,31 | ||||
| 2025-11-14 | 13F | TIG Advisors, LLC | Call | 0 | -100,00 | 0 | -100,00 | |||
| 2026-02-12 | 13F | Athos Capital Ltd | 0 | -100,00 | 0 | |||||
| 2025-11-14 | 13F | Harvest Management Llc | Put | 0 | -100,00 | 0 | -100,00 | |||
| 2026-02-13 | 13F | Alyeska Investment Group, L.P. | 1.740.411 | 93,38 | 25.340 | 56,94 | ||||
| 2026-01-26 | 13F | Nations Financial Group Inc, /ia/ /adv | 204.660 | 2.980 | ||||||
| 2026-02-13 | 13F | Pathstone Holdings, LLC | 22.614 | -70,28 | 329 | -75,90 | ||||
| 2026-02-17 | 13F | Janus Henderson Group Plc | 109.747 | -12,09 | 1.597 | -28,74 | ||||
| 2026-02-06 | 13F | Creative Financial Designs Inc /adv | 53 | 0,00 | 1 | |||||
| 2026-02-11 | 13F | BIT Capital GmbH | 0 | -100,00 | 0 | -100,00 | ||||
| 2026-02-13 | 13F | P Schoenfeld Asset Management Lp | Put | 840.000 | -24,32 | 12.230 | -38,58 | |||
| 2026-02-13 | 13F | Seven Mile Advisory | 0 | -100,00 | 0 | |||||
| 2026-02-05 | 13F | Stephens Inc /ar/ | 62.972 | 0,00 | 917 | -18,87 | ||||
| 2025-11-04 | 13F | Allianz Asset Management GmbH | 0 | -100,00 | 0 | |||||
| 2026-02-13 | 13F | P Schoenfeld Asset Management Lp | 789.424 | -46,46 | 11.494 | -56,55 | ||||
| 2026-01-26 | 13F | Cwm, Llc | 8.036 | 286,72 | 0 | |||||
| 2026-02-02 | 13F | Strs Ohio | 15.900 | -22,44 | 232 | -37,06 | ||||
| 2026-02-13 | 13F | P Schoenfeld Asset Management Lp | Call | 504.000 | 404,00 | 7.338 | 309,03 | |||
| 2026-02-17 | 13F | Toms Capital Investment Management Lp | 0 | -100,00 | 0 | -100,00 | ||||
| 2026-03-23 | 13F | Galaxy Digital Capital Management GP LLC | 784.540 | -31,24 | 11.423 | 38,28 | ||||
| 2026-02-13 | 13F | Slotnik Capital, LLC | 0 | -100,00 | 0 | |||||
| 2026-01-21 | 13F | Sound Income Strategies, LLC | 333 | 6 | ||||||
| 2026-02-17 | 13F | Cape Investment Advisory, Inc. | 325 | 5 | ||||||
| 2026-02-17 | 13F | Engineers Gate Manager LP | 0 | -100,00 | 0 | |||||
| 2026-04-10 | 13F | Green Ridge Wealth Planning LLC | 12.375 | 0,00 | 185 | 2,78 | ||||
| 2026-02-13 | 13F | Segall Bryant & Hamill, Llc | 1.107.478 | 16.125 | ||||||
| 2026-02-17 | 13F | Css Llc/il | 34.926 | -60,18 | 509 | -67,71 | ||||
| 2026-02-13 | 13F | Slotnik Capital, LLC | Put | 0 | -100,00 | 0 | ||||
| 2026-04-08 | 13F | E Fund Management (Hong Kong) Co., Ltd. | 644 | 10 | ||||||
| 2026-02-17 | 13F | Capital Fund Management S.a. | Call | 69.700 | -20,16 | 1.015 | -35,25 | |||
| 2025-11-12 | 13F | Proficio Capital Partners LLC | 0 | -100,00 | 0 | |||||
| 2026-02-10 | 13F | Skaana Management L.P. | Put | 278.100 | 191,51 | 4.049 | 136,65 | |||
| 2026-02-17 | 13F | Summit Trail Advisors, Llc | 26.539 | -20,44 | 386 | -35,45 | ||||
| 2026-02-10 | 13F | Skaana Management L.P. | Call | 170.600 | -25,14 | 2.484 | -39,26 | |||
| 2026-02-12 | 13F | Boussard & Gavaudan Investment Management LLP | 0 | -100,00 | 0 | -100,00 | ||||
| 2026-01-30 | 13F | Moody Aldrich Partners Llc | 142.064 | -64,46 | 2.068 | -71,16 | ||||
| 2026-02-17 | 13F | Advisory Services Network, LLC | 0 | -100,00 | 0 | |||||
| 2026-02-13 | 13F | Quarry LP | 0 | -100,00 | 0 | |||||
| 2025-11-06 | 13F | Ameritas Advisory Services, LLC | 0 | -100,00 | 0 | |||||
| 2025-11-13 | 13F | MYDA Advisors LLC | Put | 0 | -100,00 | 0 | -100,00 | |||
| 2026-02-13 | 13F | Citigroup Inc | Put | 1.360.000 | 580,00 | 19.802 | 451,87 | |||
| 2026-02-13 | 13F | Morgan Stanley | 3.338.427 | 135,74 | 48.608 | 91,33 | ||||
| 2026-02-13 | 13F | Citigroup Inc | 2.356.663 | 66,92 | 34.313 | 35,48 | ||||
| 2026-02-17 | 13F | Angelo Gordon & Co., L.p. | Call | 0 | -100,00 | 0 | ||||
| 2026-02-13 | 13F | OMERS ADMINISTRATION Corp | 0 | -100,00 | 0 | |||||
| 2026-02-13 | 13F | Citigroup Inc | Call | 4.569.600 | -7,99 | 66.533 | -25,32 | |||
| 2026-02-17 | 13F | Driehaus Capital Management Llc | 0 | -100,00 | 0 | |||||
| 2025-10-30 | 13F | Joel Isaacson & Co., LLC | 0 | -100,00 | 0 | -100,00 | ||||
| 2026-02-17 | 13F | Millennium Management Llc | Call | 0 | -100,00 | 0 | ||||
| 2025-11-14 | 13F | Incline Global Management LLC | 0 | -100,00 | 0 | |||||
| 2026-02-10 | 13F | Bank of New York Mellon Corp | 836.147 | 3,67 | 12.174 | -15,87 | ||||
| 2026-02-12 | 13F | Xponance, Inc. | 22.896 | 2,52 | 333 | -16,75 | ||||
| 2026-02-12 | 13F | Castleark Management Llc | 0 | -100,00 | 0 | |||||
| 2026-02-17 | 13F | Millennium Management Llc | Put | 0 | -100,00 | 0 | ||||
| 2026-02-04 | 13F | Atlantic Union Bankshares Corp | 0 | -100,00 | 0 | -100,00 | ||||
| 2026-02-11 | 13F | BIT Capital GmbH | Call | 900.000 | 13.104 | |||||
| 2026-02-06 | 13F | Global Retirement Partners, LLC | 8.564 | 1.794,69 | 125 | 1.450,00 | ||||
| 2026-02-17 | 13F | Pennant Investors, Lp | 1.540.495 | -15,61 | 22.430 | -31,51 | ||||
| 2026-02-17 | 13F | Pennant Investors, Lp | Call | 500.000 | 7.280 | |||||
| 2026-02-11 | 13F | Situational Awareness LP | 28.756.478 | 42,50 | 418.694 | 15,65 | ||||
| 2026-01-09 | 13F | SG Americas Securities, LLC | 983.430 | 5.469,63 | 14 | |||||
| 2026-02-13 | 13F | Prudential Financial Inc | 18.000 | -50,11 | 262 | -59,51 | ||||
| 2026-02-11 | 13F | CenterBook Partners LP | 0 | -100,00 | 0 | -100,00 | ||||
| 2026-02-12 | 13F | Dimensional Fund Advisors Lp | 941.524 | -30,15 | 13.709 | -43,32 | ||||
| 2025-11-06 | 13F | Whipplewood Advisors, LLC | 0 | -100,00 | 0 | |||||
| 2026-02-17 | 13F | XTX Topco Ltd | 33.105 | 129,90 | 482 | 86,82 | ||||
| 2026-02-12 | 13F | Counterpoint Mutual Funds LLC | 19.560 | 285 | ||||||
| 2026-02-17 | 13F | Toms Capital Investment Management Lp | Call | 3.000.000 | 43.680 | |||||
| 2026-02-12 | 13F | BlackRock, Inc. | 24.894.726 | -5,72 | 362.467 | -23,48 | ||||
| 2026-02-17 | 13F | Polymer Capital Management (US) LLC | 100.767 | 29,35 | 1.467 | 5,01 | ||||
| 2026-01-05 | 13F | GoalVest Advisory LLC | 40.100 | 584 | ||||||
| 2026-01-21 | 13F | Heritage Oak Wealth Advisors Llc | 0 | -100,00 | 0 | |||||
| 2026-01-28 | 13F/A | Capelight Capital Asset Management LP | 45.000 | 655 | ||||||
| 2026-02-17 | 13F | Quantinno Capital Management LP | 19.417 | 283 | ||||||
| 2026-02-17 | 13F | Paloma Partners Management Co | Call | 0 | -100,00 | 0 | ||||
| 2026-04-08 | 13F | Sapient Capital Llc | 13.972 | 209 | ||||||
| 2026-02-17 | 13F | Optiver Holding B.V. | 115.472 | 6.412,80 | 1.681 | 5.322,58 | ||||
| 2026-02-13 | 13F | Carronade Capital Management, LP | 100.000 | 1.456 | ||||||
| 2026-02-17 | 13F | Element Capital Management Llc | 361.726 | 5.267 | ||||||
| 2026-02-11 | 13F | Ameritas Investment Partners, Inc. | 23.763 | 346 | ||||||
| 2026-02-13 | 13F | Barclays Plc | 944.537 | 26,56 | 13.752 | 2,71 | ||||
| 2026-02-17 | 13F | Qube Research & Technologies Ltd | 250.049 | 3.641 | ||||||
| 2026-02-09 | 13F | Geode Capital Management, Llc | 7.651.002 | 1,45 | 111.417 | -17,66 | ||||
| 2026-02-14 | 13F | Militia Capital Partners, LP | 83.500 | -1,76 | 1.216 | -20,28 | ||||
| 2026-02-12 | 13F | BRYN MAWR TRUST Co | 0 | -100,00 | 0 | -100,00 | ||||
| 2026-02-13 | 13F | Barclays Plc | Call | 645.100 | -66,62 | 9.393 | -72,91 | |||
| 2026-02-17 | 13F | Cresset Asset Management, LLC | 230.128 | -9,50 | 3.351 | -26,55 | ||||
| 2026-02-13 | 13F | Barclays Plc | Put | 225.000 | -53,98 | 3.276 | -62,65 | |||
| 2026-02-13 | 13F | Parkside Financial Bank & Trust | 80 | 0,00 | 1 | 0,00 | ||||
| 2025-11-07 | 13F | Levin Capital Strategies, L.p. | Call | 0 | -100,00 | 0 | ||||
| 2026-02-17 | 13F | MIRAE ASSET GLOBAL ETFS HOLDINGS Ltd. | 1.609.722 | 18,24 | 23.438 | -4,03 | ||||
| 2026-02-12 | 13F | Swiss National Bank | 484.900 | -13,32 | 7.060 | -29,65 | ||||
| 2026-02-12 | 13F | CIBC Private Wealth Group, LLC | 809.891 | -0,00 | 11.792 | -18,84 | ||||
| 2026-01-22 | 13F | Advantage Alpha Capital Partners LP | 0 | -100,00 | 0 | -100,00 | ||||
| 2025-11-13 | 13F | Glenmede Investment Management, LP | 47.440 | -10,84 | 851 | -6,28 | ||||
| 2026-02-13 | 13F | Walleye Trading LLC | Put | 647.800 | -1,02 | 9.432 | -19,67 | |||
| 2026-02-13 | 13F | Walleye Trading LLC | Call | 1.262.900 | -23,15 | 18.388 | -37,63 | |||
| 2026-02-17 | 13F | Balyasny Asset Management Llc | Call | 120.200 | -95,80 | 1.750 | -96,59 | |||
| 2026-02-17 | 13F | VARCOV Co. | 18.959 | 276 | ||||||
| 2026-02-17 | 13F | Balyasny Asset Management Llc | Put | 566.600 | -86,57 | 8.250 | -89,10 | |||
| 2026-02-17 | 13F | Pentwater Capital Management LP | Call | 2.325.000 | 29,17 | 33.852 | 4,83 | |||
| 2026-02-17 | 13F | Pentwater Capital Management LP | Put | 1.400.000 | 133,26 | 20.384 | 89,32 | |||
| 2026-02-17 | 13F | Tricadia Capital Management, LLC | 0 | -100,00 | 0 | |||||
| 2026-02-17 | 13F | Pentwater Capital Management LP | 25.615.000 | 5,63 | 372.954 | -14,27 | ||||
| 2026-02-17 | 13F | Citadel Advisors Llc | 10.330.766 | 105,88 | 150.416 | 67,09 | ||||
| 2026-02-17 | 13F | Citadel Advisors Llc | Put | 4.824.200 | 109,62 | 70.240 | 70,13 | |||
| 2026-02-17 | 13F | Citadel Advisors Llc | Call | 7.394.000 | 106,99 | 107.657 | 67,99 | |||
| 2025-11-14 | 13F | Philadelphia Financial Management of San Francisco, LLC | 0 | -100,00 | 0 | -100,00 | ||||
| 2026-02-13 | 13F | Bridgewater Associates, LP | 0 | -100,00 | 0 | |||||
| 2025-11-14 | 13F | Cubist Systematic Strategies, LLC | Call | 17.000 | 335,90 | 305 | 360,61 | |||
| 2025-11-14 | 13F | Cubist Systematic Strategies, LLC | 1.065.163 | 4.613,11 | 19.109 | 4.863,38 | ||||
| 2026-02-12 | 13F | Voya Investment Management Llc | 780.831 | 65,14 | 11.369 | 34,02 | ||||
| 2026-02-12 | 13F | Nuveen, LLC | 818.722 | 28,71 | 11.921 | 4,46 | ||||
| 2026-02-13 | 13F | Smartleaf Asset Management LLC | 150 | 2 | ||||||
| 2026-02-13 | 13F | Marshall Wace, Llp | 0 | -100,00 | 0 | |||||
| 2026-02-13 | 13F | SRS Capital Advisors, Inc. | 36 | -97,57 | 1 | -100,00 | ||||
| 2026-02-17 | 13F | Scientech Research LLC | 23.506 | 342 | ||||||
| 2026-02-17 | 13F | Qube Research & Technologies Ltd | Call | 0 | -100,00 | 0 | -100,00 | |||
| 2026-02-12 | 13F | IFC & Insurance Marketing, Inc. | 5.132 | 0 | ||||||
| 2026-02-17 | 13F | Birnam Oak Advisors, LP | 0 | -100,00 | 0 | |||||
| 2026-02-13 | 13F | Vontobel Holding Ltd. | 18.723 | -4,43 | 273 | -22,51 | ||||
| 2026-02-17 | 13F | Sabby Management, Llc | 0 | -100,00 | 0 | -100,00 | ||||
| 2026-01-30 | 13F | Jennison Associates Llc | 966.709 | 14.075 | ||||||
| 2025-11-10 | 13F | Bck Capital Management Lp | Call | 0 | -100,00 | 0 | ||||
| 2026-02-03 | 13F | Strengthening Families & Communities, LLC | 30 | 0 | ||||||
| 2026-02-13 | 13F | Alerus Financial Na | 48 | 1 | ||||||
| 2025-11-13 | 13F | Capital Fund Management S.a. | Put | 0 | -100,00 | 0 | -100,00 | |||
| 2026-01-12 | 13F | Connective Portfolio Management, LLC | 0 | -100,00 | 0 | -100,00 | ||||
| 2026-01-16 | 13F | Marquette Asset Management, LLC | 33 | 0 | ||||||
| 2026-03-04 | 13F | SHP Wealth Management | 2 | 0 | ||||||
| 2025-11-13 | 13F | Ardmore Road Asset Management LP | 0 | -100,00 | 0 | |||||
| 2026-02-10 | 13F | Rothschild Investment Llc | 405 | 0,00 | 6 | -28,57 | ||||
| 2026-02-17 | 13F | Bank Of America Corp /de/ | 937.828 | 5,74 | 13.655 | -14,19 | ||||
| 2026-02-17 | 13F | Atom Investors LP | 0 | -100,00 | 0 | |||||
| 2026-02-13 | 13F | Clearfield Capital Management Lp | Call | 2.599.800 | 37.853 | |||||
| 2026-02-17 | 13F | Angelo Gordon & Co., L.p. | 32.500 | 473 | ||||||
| 2026-04-10 | 13F | Perigon Wealth Management, LLC | 84.236 | 1,63 | 1.260 | 4,48 | ||||
| 2026-02-13 | 13F | Clearfield Capital Management Lp | 97.100 | 1.414 | ||||||
| 2026-02-17 | 13F | Boothbay Fund Management, Llc | 563.156 | -17,86 | 8.200 | -33,34 | ||||
| 2026-01-14 | 13F | Appian Way Asset Management LP | 0 | -100,00 | 0 | -100,00 | ||||
| 2026-02-11 | 13F | Deutsche Bank Ag\ | 293.045 | 6,60 | 4.267 | -13,49 | ||||
| 2026-04-07 | 13F | Signaturefd, Llc | 14.692 | 0,58 | 220 | 3,30 | ||||
| 2026-02-17 | 13F | Boothbay Fund Management, Llc | Put | 240.000 | 3.494 | |||||
| 2026-02-17 | 13F | HighVista Strategies LLC | 63.512 | -15,50 | 925 | -31,45 | ||||
| 2025-10-23 | 13F | Childress Capital Advisors, Llc | 0 | -100,00 | 0 | |||||
| 2026-02-13 | 13F | Marnell Management LLC | 221.872 | 3.230 | ||||||
| 2026-02-17 | 13F | United Capital Financial Advisers, Llc | 58.627 | 0,19 | 854 | -18,68 | ||||
| 2026-02-26 | 13F/A | Sculptor Capital LP | Put | 0 | -100,00 | 0 | -100,00 | |||
| 2026-02-17 | 13F | Saba Capital Management, L.P. | 300.000 | 71,43 | 4.368 | 39,15 | ||||
| 2026-01-14 | 13F | ORG Wealth Partners, LLC | 7.282.018 | -0,12 | 106.026 | -18,93 | ||||
| 2026-02-12 | 13F | Principal Securities, Inc. | 0 | -100,00 | 0 | -100,00 | ||||
| 2026-02-11 | 13F | Havemeyer Place LP | 61.733 | 899 | ||||||
| 2026-02-13 | 13F | Fifth Lane Capital, Lp | Put | 12.500 | 182 | |||||
| 2026-01-29 | 13F | UBS Group AG | Put | 515.400 | 25,13 | 7.504 | 1,56 | |||
| 2026-01-29 | 13F | UBS Group AG | Call | 3.376.400 | -16,60 | 49.160 | -32,31 | |||
| 2026-01-29 | 13F | UBS Group AG | 19.817.257 | 200,96 | 288.539 | 144,26 | ||||
| 2026-02-05 | 13F | Bessemer Group Inc | 11.250 | 1,72 | 0 | |||||
| 2026-02-05 | 13F | Phoenix Holdings Ltd. | 22.533 | -34,14 | 328 | -46,66 | ||||
| 2026-02-13 | 13F | Ubs Asset Management Americas Inc | 447.065 | -3,76 | 6.509 | -21,90 | ||||
| 2026-02-17 | 13F | D. E. Shaw & Co., Inc. | 228.544 | -95,46 | 3.328 | -96,32 | ||||
| 2026-02-03 | 13F | Costello Asset Management, INC | 200 | 0,00 | 3 | -33,33 | ||||
| 2026-02-11 | 13F | Two Seas Capital LP | 17.011.221 | 10,72 | 247.683 | -10,14 | ||||
| 2026-02-13 | 13F | Fifth Lane Capital, Lp | 43.000 | 626 | ||||||
| 2026-01-29 | 13F | IMC-Chicago, LLC | 709.707 | 81,72 | 10.333 | 47,49 | ||||
| 2026-02-11 | 13F | Two Seas Capital LP | Call | 8.477.600 | 149,34 | 123.434 | 102,36 | |||
| 2025-11-13 | 13F | KDK Private Wealth Management, LLC | 0 | -100,00 | 0 | -100,00 | ||||
| 2026-02-11 | 13F | Two Seas Capital LP | Put | 240.000 | 3.494 | |||||
| 2026-02-13 | 13F | Gen-Wealth Partners Inc | 40 | 0,00 | 1 | |||||
| 2026-02-17 | 13F | Elequin Capital Lp | 1.534 | 22 | ||||||
| 2026-01-30 | 13F | State of New Jersey Common Pension Fund D | 139.783 | -9,38 | 2.035 | -26,45 | ||||
| 2026-02-17 | 13F | Fred Alger Management, Llc | 57.328 | 835 | ||||||
| 2026-02-18 | 13F | GWM Advisors LLC | 48.263 | 15,77 | 703 | -6,02 | ||||
| 2026-02-17 | 13F | Fwl Investment Management, Llc | 80 | -99,62 | 1 | -99,74 | ||||
| 2026-02-18 | 13F | VGI Partners Ltd | 0 | -100,00 | 0 | -100,00 | ||||
| 2025-11-12 | 13F | Burren Capital Advisors Ltd | 24.577 | 441 | ||||||
| 2026-01-28 | 13F | Arizona State Retirement System | 68.104 | -20,23 | 992 | -35,27 | ||||
| 2026-04-06 | 13F | CX Institutional | 12.943 | 10,46 | 0 | |||||
| 2026-02-17 | 13F | Water Island Capital Llc | 0 | -100,00 | 0 | |||||
| 2026-01-20 | 13F | Global Trust Asset Management, LLC | 40 | 1 | ||||||
| 2026-02-03 | 13F | SBI Securities Co., Ltd. | 5.763 | -39,90 | 84 | -51,74 | ||||
| 2025-11-14 | 13F | Northwood Liquid Management Lp | Call | 0 | -100,00 | 0 | -100,00 | |||
| 2026-02-02 | 13F | Principal Financial Group Inc | 16.387 | -23,82 | 239 | -38,18 | ||||
| 2025-11-14 | 13F | Northwood Liquid Management Lp | 0 | -100,00 | 0 | -100,00 | ||||
| 2026-02-12 | 13F | Commonwealth Equity Services, Llc | 0 | -100,00 | 0 | |||||
| 2026-02-13 | 13F | Headlands Technologies LLC | 101.851 | 1.483 | ||||||
| 2025-11-10 | 13F | ANTIPODES PARTNERS Ltd | 0 | -100,00 | 0 | |||||
| 2025-11-13 | 13F | Diametric Capital, LP | 0 | -100,00 | 0 | -100,00 | ||||
| 2026-02-05 | 13F | Cambridge Investment Research Advisors, Inc. | 45.851 | 1,98 | 1 | |||||
| 2026-03-23 | 13F | Galaxy Group Investments LLC | Call | 0 | -100,00 | 0 | -100,00 | |||
| 2025-11-14 | 13F | Wolverine Trading, Llc | 309.397 | -20,46 | 5.362 | -17,22 | ||||
| 2025-11-14 | 13F | Wolverine Trading, Llc | Call | 1.156.800 | -31,77 | 20.047 | -28,98 | |||
| 2025-11-14 | 13F | Wolverine Trading, Llc | Put | 340.000 | -37,00 | 5.892 | -34,43 | |||
| 2025-11-14 | 13F | Sandler Capital Management | 0 | -100,00 | 0 | -100,00 | ||||
| 2026-02-17 | 13F | Moore Capital Management, Lp | 50.000 | 728 | ||||||
| 2026-02-09 | 13F | Catalyst Funds Management Pty Ltd | 58.768 | 0,00 | 856 | -18,88 | ||||
| 2026-02-17 | 13F | Bank Of America Corp /de/ | Call | 0 | -100,00 | 0 | ||||
| 2026-02-13 | 13F | Sculptor Capital LP | 75.000 | 1.092 | ||||||
| 2026-02-13 | 13F | Victory Capital Management Inc | 33.843 | 3,14 | 493 | -16,33 | ||||
| 2026-02-13 | 13F | Oasis Management Co Ltd. | 2.643.729 | 38.493 | ||||||
| 2026-01-26 | 13F | Covenant Partners, LLC | 16.489 | -0,18 | 240 | -18,92 | ||||
| 2026-02-17 | 13F | Cantor Fitzgerald, L. P. | Call | 0 | -100,00 | 0 | ||||
| 2026-02-17 | 13F | Jump Financial, LLC | 0 | -100,00 | 0 | |||||
| 2026-02-17 | 13F | Public Employees Retirement System Of Ohio | 34.069 | 496 | ||||||
| 2026-02-17 | 13F | Dark Forest Capital Management Lp | 110.991 | 357,83 | 1.616 | 272,35 | ||||
| 2026-02-17 | 13F | Sig Brokerage, Lp | 0 | -100,00 | 0 | |||||
| 2026-02-10 | 13F | Natixis Advisors, L.p. | 0 | -100,00 | 0 | |||||
| 2025-12-16 | 13F | Garde Capital, Inc. | 0 | -100,00 | 0 | |||||
| 2026-02-13 | 13F | Helix Partners Management LP | 5.600.000 | 6,67 | 81.536 | -13,43 | ||||
| 2026-02-17 | 13F | Parsifal Capital Management, LP | 1.197.600 | 17.437 | ||||||
| 2026-02-11 | 13F | Los Angeles Capital Management Llc | 1.454 | 30 | ||||||
| 2025-11-14 | 13F | Aventail Capital Group, LP | 0 | -100,00 | 0 | -100,00 | ||||
| 2026-02-09 | 13F | Hartland & Co., LLC | 163.767 | 0,61 | 2.384 | -18,36 | ||||
| 2026-02-17 | 13F | Hampton Road Capital Management LP | 515.042 | 7.499 | ||||||
| 2026-02-06 | 13F | Bare Financial Services, Inc | 109 | 41,56 | 2 | 0,00 | ||||
| 2026-01-29 | 13F | Vanguard Group Inc | 33.960.320 | 18,74 | 494.462 | -3,63 | ||||
| 2026-02-13 | 13F | Centiva Capital, LP | Put | 237.500 | 240,26 | 3.458 | 176,20 | |||
| 2026-02-13 | 13F | Centiva Capital, LP | Call | 150.000 | -33,33 | 2.184 | -45,89 | |||
| 2026-02-17 | 13F | Parkwood LLC | 460.000 | -34,29 | 7 | -50,00 | ||||
| 2026-02-17 | 13F | Think Investments LP | 2.799.600 | 40.762 | ||||||
| 2026-02-17 | 13F | Think Investments LP | Call | 400.000 | 5.824 | |||||
| 2026-02-19 | 13F | Invesco Ltd. | 2.902.640 | -2,15 | 42.262 | -20,59 | ||||
| 2026-02-13 | 13F | Centiva Capital, LP | 81.371 | 1.185 | ||||||
| 2026-02-12 | 13F | Jane Street Group, Llc | 3.364.773 | 48.991 | ||||||
| 2026-02-12 | 13F | Jane Street Group, Llc | Put | 5.128.900 | 18,34 | 74.677 | -3,95 | |||
| 2026-02-12 | 13F | Jane Street Group, Llc | Call | 8.749.200 | -18,29 | 127.388 | -33,68 | |||
| 2026-01-14 | 13F | ORG Partners LLC | 0 | -100,00 | 0 | |||||
| 2025-11-05 | 13F | Wellington Shields & Co., LLC | 0 | -100,00 | 0 | |||||
| 2026-02-17 | 13F | Balyasny Asset Management Llc | 0 | -100,00 | 0 | |||||
| 2026-02-17 | 13F | Capstone Investment Advisors, Llc | 250.000 | -94,36 | 3.640 | -95,43 | ||||
| 2026-02-17 | 13F | Capstone Investment Advisors, Llc | Call | 4.600.000 | 66.976 | |||||
| 2026-02-17 | 13F | Scoggin Management Lp | Call | 1.950.000 | 2,63 | 28.392 | -16,70 | |||
| 2025-11-12 | 13F | Monashee Investment Management LLC | 0 | -100,00 | 0 | |||||
| 2026-02-13 | 13F | DeepCurrents Investment Group LLC | Call | 9.002 | 350,10 | 13.107 | 265,27 | |||
| 2026-01-21 | 13F | Capital Advisors, Ltd. LLC | 271 | 0,37 | 0 | |||||
| 2026-02-13 | 13F | DeepCurrents Investment Group LLC | 144.720 | 2.107 | ||||||
| 2026-02-17 | 13F | Blackstone Group Inc | 500.000 | -50,00 | 7.280 | -59,42 | ||||
| 2026-02-17 | 13F | Two Sigma Investments, Lp | 1.396.827 | 90,08 | 20.338 | 54,27 | ||||
| 2026-02-10 | 13F | Quantbot Technologies LP | 167.815 | 135,34 | 2.443 | 91,01 | ||||
| 2026-02-17 | 13F | Toronto Dominion Bank | Put | 0 | -100,00 | 0 | ||||
| 2026-02-17 | 13F | Ionic Capital Management LLC | 25.000 | 364 | ||||||
| 2025-11-06 | 13F | Pacific Point Advisors, LLC | 0 | -100,00 | 0 | |||||
| 2025-11-19 | 13F | Sunbelt Securities, Inc. | 0 | -100,00 | 0 | -100,00 | ||||
| 2026-02-17 | 13F | Voloridge Investment Management, Llc | 879.421 | 312,12 | 12.804 | 234,48 | ||||
| 2026-02-17 | 13F | Two Sigma Investments, Lp | Put | 37.200 | 0,00 | 542 | -18,89 | |||
| 2026-02-02 | 13F | Montag A & Associates Inc | 0 | -100,00 | 0 | |||||
| 2026-02-12 | 13F | Ci Investments Inc. | 0 | -100,00 | 0 | |||||
| 2026-02-13 | 13F | First Trust Advisors Lp | 75.347 | -74,47 | 1.097 | -79,28 | ||||
| 2025-11-14 | 13F | Yaupon Capital Management LP | 0 | -100,00 | 0 | |||||
| 2026-02-17 | 13F | Sona Asset Management (us) Llc | 300.000 | 4.368 | ||||||
| 2026-02-10 | 13F | Envestnet Asset Management Inc | 24.195 | -54,57 | 352 | -63,14 | ||||
| 2026-02-17 | 13F | Sona Asset Management (us) Llc | Call | 300.000 | 0,00 | 4.368 | -18,84 | |||
| 2026-02-17 | 13F | Rangeley Capital, LLC | 10.000 | 0,00 | 146 | -18,99 | ||||
| 2026-02-10 | 13F | Ark & Tlk Investments, Llc | 14.000 | 0,00 | 204 | -19,12 | ||||
| 2026-02-13 | 13F | Ripple Effect Asset Management LP | 0 | -100,00 | 0 | |||||
| 2026-02-13 | 13F | Ripple Effect Asset Management LP | Put | 0 | -100,00 | 0 | ||||
| 2026-02-13 | 13F | Hudson Bay Capital Management LP | 25.000 | -85,33 | 364 | -88,10 | ||||
| 2026-02-13 | 13F | Healthcare Of Ontario Pension Plan Trust Fund | 0 | -100,00 | 0 | |||||
| 2026-02-13 | 13F | Van Eck Associates Corp | 1.632.439 | 64,73 | 24 | 35,29 | ||||
| 2025-10-30 | 13F | Emerald Mutual Fund Advisers Trust | 0 | -100,00 | 0 | -100,00 | ||||
| 2025-11-14 | 13F | Murchinson Ltd. | 0 | -100,00 | 0 | -100,00 | ||||
| 2025-10-23 | 13F | Kingswood Wealth Advisors, Llc | 0 | -100,00 | 0 | |||||
| 2026-02-10 | 13F | Bnp Paribas Arbitrage, Sa | 60.043 | 6,83 | 874 | -13,29 | ||||
| 2026-02-17 | 13F | Scoggin Management Lp | 1.175.000 | 56,67 | 17.108 | 27,15 | ||||
| 2026-02-12 | 13F | Brinker Capital Investments, LLC | 0 | -100,00 | 0 | |||||
| 2026-03-23 | 13F | Galaxy Digital Capital Management GP LLC | Put | 0 | -100,00 | 0 | ||||
| 2025-11-13 | 13F | K2 Principal Fund, L.p. | Put | 0 | -100,00 | 0 | -100,00 | |||
| 2026-02-03 | 13F/A | Mount Yale Investment Advisors, LLC | 0 | -100,00 | 0 | -100,00 | ||||
| 2026-02-10 | 13F | Sfmg, Llc | 0 | -100,00 | 0 | |||||
| 2026-02-13 | 13F | American Century Companies Inc | 1.279.551 | 18.630 | ||||||
| 2026-02-17 | 13F | Greenland Capital Management LP | Call | 0 | -100,00 | 0 | -100,00 | |||
| 2026-01-29 | 13F | Rakuten Securities, Inc. | 111 | 2 | ||||||
| 2026-02-13 | 13F | Alberta Investment Management Corp | 125.000 | 1.820 | ||||||
| 2026-02-17 | 13F | Banco Bilbao Vizcaya Argentaria, S.a. | 0 | -100,00 | 0 | |||||
| 2025-11-13 | 13F | Private Advisor Group, LLC | 0 | -100,00 | 0 | -100,00 | ||||
| 2026-01-22 | 13F | Fiduciary Alliance LLC | 23.792 | -8,64 | 346 | -25,91 | ||||
| 2026-02-17 | 13F | Nomura Holdings Inc | 3.495.767 | 333,69 | 50.898 | 251,99 | ||||
| 2026-02-17 | 13F | Third Point LLC | 0 | -100,00 | 0 | -100,00 | ||||
| 2025-10-29 | 13F | Arkadios Wealth Advisors | 0 | -100,00 | 0 | |||||
| 2026-02-12 | 13F | Marex Group plc | 515.307 | 7.503 | ||||||
| 2025-11-14 | 13F | Troluce Capital Advisors LLC | 0 | -100,00 | 0 | |||||
| 2026-02-17 | 13F | Sandler Capital Management | Call | 0 | -100,00 | 0 | ||||
| 2026-02-13 | 13F | K2 Principal Fund, L.p. | 0 | -100,00 | 0 | -100,00 | ||||
| 2026-02-13 | 13F | K2 Principal Fund, L.p. | Call | 0 | -100,00 | 0 | -100,00 | |||
| 2026-02-13 | 13F | Rafferty Asset Management, LLC | 14.344 | 36,30 | 209 | 10,64 | ||||
| 2025-10-22 | 13F | Compass Planning Associates Inc | 0 | -100,00 | 0 | -100,00 | ||||
| 2026-02-17 | 13F | Wellington Management Group Llp | 431.707 | 6.286 | ||||||
| 2026-01-28 | 13F | WPG Advisers, LLC | 984 | 0,00 | 14 | -17,65 | ||||
| 2026-02-02 | 13F | Artemis Investment Management LLP | 0 | -100,00 | 0 | |||||
| 2025-12-15 | 13F/A | Hudson Bay Capital Management LP | Call | 0 | -100,00 | 0 | -100,00 | |||
| 2026-02-12 | 13F | Intrinsic Edge Capital Management LLC | 446.176 | -10,08 | 6.496 | -27,02 | ||||
| 2026-02-17 | 13F | DSC Meridian Capital LP | 2.280.252 | 0,00 | 33.200 | -18,84 | ||||
| 2026-02-11 | 13F | Westfield Capital Management Co Lp | 1.392.132 | -30,14 | 20.269 | -43,30 | ||||
| 2026-02-17 | 13F | Blair William & Co/il | 292.069 | 0,12 | 4.253 | -18,75 | ||||
| 2026-02-17 | 13F | Kemnay Advisory Services Inc. | 872 | 13 | ||||||
| 2026-02-11 | 13F | Group One Trading, L.p. | 0 | -100,00 | 0 | |||||
| 2025-12-01 | 13F/A | Cantor Fitzgerald, L. P. | 0 | -100,00 | 0 | -100,00 | ||||
| 2025-11-14 | 13F | Honeycomb Asset Management LP | 0 | -100,00 | 0 | -100,00 | ||||
| 2026-02-13 | 13F | BNP Paribas Asset Management Holding S.A. | 3.351 | 21,33 | 0 | |||||
| 2026-02-17 | 13F | Mercer Global Advisors Inc /adv | 26.562 | -23,50 | 387 | -37,94 | ||||
| 2026-02-17 | 13F | Nomura Holdings Inc | Call | 5.220.600 | 2,61 | 76.012 | -16,72 | |||
| 2026-01-27 | 13F | TD Waterhouse Canada Inc. | 0 | -100,00 | 0 | -100,00 | ||||
| 2026-02-17 | 13F | Nomura Holdings Inc | Put | 581.600 | -71,98 | 8.468 | -77,26 | |||
| 2025-11-14 | 13F | Squarepoint Ops LLC | Call | 0 | -100,00 | 0 | -100,00 | |||
| 2026-02-13 | 13F | Fieldview Capital Management, LLC | 29.563 | 430 | ||||||
| 2026-02-14 | 13F | Militia Capital Partners, LP | Put | 10.000 | 4 | |||||
| 2026-02-17 | 13F | OnyxPoint Global Management LP | 168.622 | 0,00 | 2.455 | -18,84 | ||||
| 2026-01-27 | 13F | Atlantic Edge Private Wealth Management, LLC | 575 | 0,00 | 8 | -20,00 | ||||
| 2026-02-17 | 13F | Goodlander Investment Management, LLC | 800.000 | 11.648 | ||||||
| 2026-02-17 | 13F | Gullane Capital, LLC | Call | 600 | -88,00 | 21 | -95,96 | |||
| 2026-02-13 | 13F | Public Sector Pension Investment Board | Call | 0 | -100,00 | 0 | ||||
| 2026-02-17 | 13F | Gullane Capital, LLC | 2.415.108 | -26,73 | 35.164 | -40,53 | ||||
| 2026-02-06 | 13F | Larson Financial Group LLC | 1.866 | 936,67 | 27 | 800,00 | ||||
| 2026-02-13 | 13F | Manufacturers Life Insurance Company, The | 0 | -100,00 | 0 | |||||
| 2026-02-17 | 13F | Gullane Capital, LLC | Put | 1.050 | -85,00 | 45 | -94,98 | |||
| 2026-01-29 | 13F | Dunhill Financial, LLC | 3 | 0 | ||||||
| 2026-01-21 | 13F | Stone House Investment Management, LLC | 600 | 9 | ||||||
| 2026-02-06 | 13F | IFP Advisors, Inc | 3.146 | -53,07 | 46 | -62,50 | ||||
| 2026-02-17 | 13F | Two Sigma Advisers, Lp | 974.099 | 14.183 | ||||||
| 2026-03-12 | 13F | Nalls Sherbakoff Group, Llc | 0 | -100,00 | 0 | |||||
| 2026-02-06 | 13F | ProShare Advisors LLC | 54.074 | -21,27 | 787 | -36,12 | ||||
| 2026-02-14 | 13F | Rockefeller Capital Management L.P. | 814 | 237,76 | 12 | 175,00 | ||||
| 2025-11-14 | 13F | Arosa Capital Management LP | 0 | -100,00 | 0 | |||||
| 2026-02-11 | 13F | Capital Analysts, Inc. | 480 | 0,00 | 0 | |||||
| 2026-02-09 | 13F | GeoSphere Capital Management | 0 | -100,00 | 0 | |||||
| 2026-01-28 | 13F | Klp Kapitalforvaltning As | 65.700 | -26,51 | 957 | -40,36 | ||||
| 2026-02-17 | 13F | State Of Wisconsin Investment Board | 352.190 | 28,58 | 5.128 | 4,36 | ||||
| 2026-02-17 | 13F | Tower Research Capital LLC (TRC) | 16.447 | 136,27 | 239 | 92,74 | ||||
| 2025-11-14 | 13F | Hidden Lake Asset Management LP | 0 | -100,00 | 0 | |||||
| 2026-02-17 | 13F | Algert Global Llc | 17.660 | 0 | ||||||
| 2025-11-14 | 13F | Hidden Lake Asset Management LP | Call | 0 | -100,00 | 0 | ||||
| 2025-11-12 | 13F | HAP Trading, LLC | Put | 104.700 | 51 | |||||
| 2025-11-14 | 13F | Lido Advisors, LLC | 0 | -100,00 | 0 | |||||
| 2026-02-13 | 13F | Walleye Capital LLC | 0 | -100,00 | 0 | -100,00 | ||||
| 2025-11-12 | 13F | HAP Trading, LLC | Call | 280.100 | 558 | |||||
| 2026-04-09 | 13F | Red Spruce Capital, LLC | 33.141 | 0,00 | 496 | 2,70 | ||||
| 2026-02-17 | 13F | Cetera Investment Advisers | 0 | -100,00 | 0 | |||||
| 2026-02-13 | 13F | ParaFi Capital LP | 1.119.724 | 523,41 | 16.303 | 405,99 | ||||
| 2026-02-13 | 13F | Public Employees Retirement Association Of Colorado | 28.874 | 0,00 | 0 | |||||
| 2026-02-17 | 13F | Massar Capital Management, LP | Call | 1.321.600 | -32,76 | 19.242 | -45,43 | |||
| 2026-02-17 | 13F | Massar Capital Management, LP | 106.476 | 1.550 | ||||||
| 2025-11-14 | 13F | CI Private Wealth, LLC | 0 | -100,00 | 0 | -100,00 | ||||
| 2026-02-17 | 13F | Massar Capital Management, LP | Put | 1.221.600 | -37,85 | 17.786 | -49,56 | |||
| 2026-02-17 | 13F | Man Group plc | 183.386 | 2.670 | ||||||
| 2026-02-17 | 13F | Creative Planning | 70.000 | -80,32 | 1.019 | -84,03 | ||||
| 2026-02-17 | 13F | Covalis (Gibraltar) Ltd | 2.080.550 | 30.293 | ||||||
| 2026-02-17 | 13F | Covalis (Gibraltar) Ltd | Call | 2.101.700 | 30.601 | |||||
| 2026-02-10 | 13F | Main Management ETF Advisors, LLC | 147.204 | 1,03 | 2 | 0,00 | ||||
| 2026-02-13 | 13F | Charles Schwab Investment Management Inc | 3.191.541 | 5,38 | 46.469 | -14,48 | ||||
| 2026-02-17 | 13F | Prelude Capital Management, Llc | Call | 0 | -100,00 | 0 | -100,00 | |||
| 2026-02-12 | 13F | Ensign Peak Advisors, Inc | 16.000 | 233 | ||||||
| 2026-02-17 | 13F | Creek Drive Management Group LLC | 112.500 | 1.638 | ||||||
| 2026-02-17 | 13F | Union Square Park Capital Management, LLC | Call | 0 | -100,00 | 0 | ||||
| 2025-11-14 | 13F | Ripple Effect Asset Management LP | Call | 0 | -100,00 | 0 | -100,00 | |||
| 2026-01-29 | 13F | Lee Danner & Bass Inc | 27.849 | 0,00 | 405 | -18,84 | ||||
| 2025-10-15 | 13F | Harbor Capital Advisors, Inc. | 0 | -100,00 | 0 | |||||
| 2026-01-20 | 13F | Monticello Wealth Management, Llc | 0 | -100,00 | 0 | |||||
| 2026-02-03 | 13F | B. Riley Financial, Inc. | 0 | -100,00 | 0 | -100,00 | ||||
| 2025-11-14 | 13F | Strategic Wealth Partners, Ltd. | 4 | 0,00 | 0 | |||||
| 2026-02-10 | 13F | Intech Investment Management Llc | 106.819 | 15,13 | 1.555 | -6,55 | ||||
| 2026-02-10 | 13F | Norges Bank | 253.602 | 3.692 | ||||||
| 2026-02-17 | 13F | Caption Management, LLC | Call | 2.529.000 | -46,22 | 36.822 | -56,35 | |||
| 2026-02-10 | 13F | Goldman Sachs Group Inc | Put | 337.100 | 145,88 | 4.908 | 99,59 | |||
| 2026-02-17 | 13F | Caption Management, LLC | Put | 690.200 | -69,25 | 10.049 | -75,04 | |||
| 2026-02-18 | 13F | Galaxy Group Investments LLC | 784.540 | -49,55 | 11.423 | -59,06 | ||||
| 2026-02-05 | 13F | Baader Bank INC | 0 | -100,00 | 0 | |||||
| 2025-11-14 | 13F | Point72 Asia (Singapore) Pte. Ltd. | 72.162 | 1.295 | ||||||
| 2026-02-03 | 13F | Pier Capital, LLC | 0 | -100,00 | 0 | |||||
| 2026-02-11 | 13F | LPL Financial LLC | 79.040 | 9,35 | 1.151 | -11,27 | ||||
| 2026-04-06 | 13F | Versant Capital Management, Inc | 3.676 | 55 | ||||||
| 2026-01-14 | 13F | Exchange Traded Concepts, Llc | 1.057.639 | 0,17 | 15.399 | -18,70 | ||||
| 2026-02-10 | 13F | Goldman Sachs Group Inc | Call | 4.891.000 | 141,76 | 71.213 | 96,21 | |||
| 2026-02-10 | 13F | Goldman Sachs Group Inc | 2.805.539 | 0,86 | 40.849 | -18,14 | ||||
| 2026-01-30 | 13F | Oakworth Capital, Inc. | 1.000 | 0,00 | 15 | -17,65 | ||||
| 2026-02-17 | 13F | Prelude Capital Management, Llc | 351.156 | 278,12 | 5.113 | 206,84 | ||||
| 2026-02-17 | 13F | Russell Investments Group, Ltd. | 181.326 | 244,41 | 2.640 | 179,66 | ||||
| 2025-11-14 | 13F | Ardsley Advisory Partners Lp | Call | 0 | -100,00 | 0 | ||||
| 2025-11-14 | 13F | Ardsley Advisory Partners Lp | 0 | -100,00 | 0 | |||||
| 2026-01-22 | 13F | HHM Wealth Advisors, LLC | 1.926 | 0,00 | 28 | -17,65 | ||||
| 2026-01-22 | 13F | Westbourne Investments, Inc. | 49.354 | 0,00 | 719 | -32,46 | ||||
| 2026-02-12 | 13F | Renaissance Technologies Llc | 1.730.463 | 11,26 | 25.196 | -9,70 | ||||
| 2026-02-17 | 13F | Oaktree Capital Management Lp | Call | 2.000.000 | 29.120 | |||||
| 2026-02-17 | 13F | Oaktree Capital Management Lp | 8.350.708 | 30,47 | 121.586 | 5,89 | ||||
| 2026-02-12 | 13F | Hrt Financial Lp | 0 | -100,00 | 0 | |||||
| 2026-02-13 | 13F | Jacobs Levy Equity Management, Inc | 830.392 | 12.091 | ||||||
| 2026-01-28 | 13F | Teacher Retirement System Of Texas | 25.030 | -64,64 | 364 | -71,32 | ||||
| 2026-01-23 | 13F | Assetmark, Inc | 39 | 0,00 | 1 | |||||
| 2026-04-02 | 13F | Aspect Partners, LLC | 0 | -100,00 | 0 | -100,00 | ||||
| 2026-02-17 | 13F | Hartree Partners, LP | 50.000 | 728 | ||||||
| 2026-02-17 | 13F | Corsair Capital Management, L.p. | 0 | -100,00 | 0 | -100,00 | ||||
| 2026-01-15 | 13F | Nisa Investment Advisors, Llc | 32.308 | -2,67 | 470 | -21,01 | ||||
| 2026-02-06 | 13F | Leonteq Securities AG | 10.615 | 4,19 | 155 | -15,38 | ||||
| 2026-02-17 | 13F | CastleKnight Management LP | Call | 0 | -100,00 | 0 | ||||
| 2026-01-16 | 13F | Compagnie Lombard Odier SCmA | 11.200 | 163 | ||||||
| 2026-02-11 | 13F | Mercuria Capital Strategies, LLC | 186.643 | 2.718 | ||||||
| 2026-01-30 | 13F | Us Bancorp \de\ | 8.983 | -42,12 | 131 | -53,24 | ||||
| 2026-02-10 | 13F | CIBC Asset Management Inc | 12.448 | 181 | ||||||
| 2026-02-17 | 13F | Toronto Dominion Bank | 280.650 | -33,27 | 4.086 | -45,84 | ||||
| 2026-02-17 | 13F | Oxford Asset Management Llp | 11.497 | 167 | ||||||
| 2026-01-23 | 13F | State of Alaska, Department of Revenue | 12.792 | 0,00 | 0 | |||||
| 2026-02-17 | 13F | Toronto Dominion Bank | Call | 380.000 | -8,89 | 5.533 | -26,06 | |||
| 2026-02-17 | 13F | Valiant Capital Management, L.P. | 6.336.424 | -2,26 | 92.258 | -20,68 | ||||
| 2026-01-28 | 13F | Old National Bancorp /in/ | 14.240 | 0,23 | 207 | -18,50 | ||||
| 2026-02-09 | 13F | Delta Asset Management Llc/tn | 3.371 | 0,00 | 49 | -18,33 | ||||
| 2026-02-13 | 13F | Marathon Trading Investment Management LLC | 205.373 | -11,83 | 2.990 | -28,43 | ||||
| 2026-02-17 | 13F | Valiant Capital Management, L.P. | Call | 3.830.000 | 0,00 | 55.765 | -18,84 | |||
| 2025-11-06 | 13F | Abich Financial Wealth Management LLC | 21.504 | 386 | ||||||
| 2026-01-14 | 13F | Tradewinds Capital Management, LLC | 100 | 0,00 | 1 | 0,00 | ||||
| 2026-02-17 | 13F | Tudor Investment Corp Et Al | Call | 25.600 | -65,41 | 373 | -71,97 | |||
| 2026-02-17 | 13F | Covalis Capital Llp | Call | 5.299.600 | 77.162 | |||||
| 2026-02-13 | 13F | Sei Investments Co | 93.958 | -25,61 | 1.368 | -39,60 | ||||
| 2026-02-17 | 13F | Tudor Investment Corp Et Al | Put | 58.400 | 2,82 | 850 | -16,50 | |||
| 2026-02-17 | 13F | Covalis Capital Llp | 5.341.913 | 77.778 | ||||||
| 2026-01-15 | 13F | Bernard Wealth Management Corp. | 1.500 | 0,00 | 22 | -19,23 | ||||
| 2026-02-17 | 13F | Tudor Investment Corp Et Al | 196.845 | 2.866 | ||||||
| 2026-02-17 | 13F | Kintayl Capital LP | 74.664 | -86,90 | 1.087 | -89,37 | ||||
| 2025-11-10 | 13F | MAI Capital Management | 0 | -100,00 | 0 | |||||
| 2026-01-07 | 13F | CWA Asset Management Group, LLC | 239.937 | 0,32 | 3.493 | -18,58 | ||||
| 2026-02-13 | 13F | Verition Fund Management LLC | 264.147 | 650,40 | 3.846 | 509,35 | ||||
| 2026-01-26 | 13F | KBC Group NV | 8.300 | 0,00 | 0 | |||||
| 2026-02-13 | 13F | Verition Fund Management LLC | Call | 450.000 | 6.552 | |||||
| 2026-04-02 | 13F | Silverleafe Capital Partners, LLC | 72.950 | 0,00 | 1.091 | 2,73 | ||||
| 2025-11-18 | 13F | Marathon Asset Management Lp | Call | 0 | -100,00 | 0 | -100,00 | |||
| 2026-02-11 | 13F | Gilpin Wealth Management, Llc | 17.187 | 250 | ||||||
| 2026-02-17 | 13F | Lazard Asset Management Llc | Put | 40.000 | 582 | |||||
| 2026-02-17 | 13F | Lazard Asset Management Llc | 51.870 | 62,97 | 755 | 32,46 | ||||
| 2026-02-17 | 13F | Lazard Asset Management Llc | Call | 100.000 | 1.456 | |||||
| 2025-11-14 | 13F | Cruiser Capital Advisors, Llc | 0 | -100,00 | 0 | |||||
| 2025-11-04 | 13F | Villere St Denis J & Co Llc | 0 | -100,00 | 0 | |||||
| 2026-02-05 | 13F | Duncan Williams Asset Management, LLC | 18.031 | 0,00 | 291 | -9,91 | ||||
| 2025-11-14 | 13F | Shay Capital LLC | Call | 0 | -100,00 | 0 | ||||
| 2026-02-17 | 13F | Azora Capital LP | 0 | -100,00 | 0 | |||||
| 2025-11-05 | 13F | SOUTH STATE Corp | 0 | -100,00 | 0 | |||||
| 2026-01-13 | 13F | Stonehage Fleming Financial Services Holdings Ltd | 11.554 | 168 | ||||||
| 2026-02-13 | 13F | State Street Corp | 7.156.301 | 3,32 | 104.196 | -16,14 | ||||
| 2025-11-14 | 13F | Shay Capital LLC | 0 | -100,00 | 0 | |||||
| 2026-02-17 | 13F | Jericho Capital Asset Management L.P. | 13.038.619 | 11,44 | 189.842 | -9,55 | ||||
| 2026-02-06 | 13F | CFO4Life Group, LLC | 29.078 | 0,14 | 423 | -18,65 | ||||
| 2026-02-09 | 13F | Waratah Capital Advisors Ltd. | Call | 100.000 | 1.456 | |||||
| 2026-02-13 | 13F | SPX Equities Gestao de Recursos Ltda | 104.800 | 1.526 | ||||||
| 2026-01-20 | 13F | Reliant Investment Management, LLC | 44.501 | 648 | ||||||
| 2026-02-06 | 13F | Tortoise Investment Management, LLC | 0 | -100,00 | 0 | |||||
| 2026-02-04 | 13F | Swiss Life Asset Management Ltd | 11.612 | -11,20 | 169 | -27,78 | ||||
| 2025-11-14 | 13F | Lighthouse Investment Partners, LLC | Put | 0 | -100,00 | 0 | ||||
| 2026-02-05 | 13F | Alpine Associates Management Inc. | 0 | -100,00 | 0 | |||||
| 2025-11-14 | 13F | Lighthouse Investment Partners, LLC | 0 | -100,00 | 0 | |||||
| 2025-11-14 | 13F | Lighthouse Investment Partners, LLC | Call | 0 | -100,00 | 0 | ||||
| 2026-02-03 | 13F | Mitsubishi UFJ Kokusai Asset Management Co., Ltd. | 18.168 | -13,61 | 291 | -23,08 | ||||
| 2025-11-13 | 13F | Aurelius Capital Management, LP | 470.965 | 7,43 | 8.449 | 12,91 | ||||
| 2026-01-28 | 13F | Universal- Beteiligungs- und Servicegesellschaft mbH | 127.819 | -71,77 | 1.866 | -77,04 | ||||
| 2026-02-10 | 13F | State of Wyoming | 4.504 | 66 | ||||||
| 2025-11-14 | 13F | Plustick Management Llc | 0 | -100,00 | 0 | |||||
| 2026-02-02 | 13F | Fifth Third Bancorp | 0 | -100,00 | 0 | -100,00 | ||||
| 2026-02-12 | 13F | New York State Common Retirement Fund | 107.241 | -7,53 | 1.561 | -24,95 | ||||
| 2026-02-17 | 13F | Brevan Howard Capital Management LP | 288.929 | 1.551,21 | 4.205 | 1.243,45 | ||||
| 2026-02-13 | 13F | Sterling Capital Management LLC | 4.397 | 13,35 | 64 | -7,25 | ||||
| 2026-02-17 | 13F | Brevan Howard Capital Management LP | Put | 250.000 | 3.639 | |||||
| 2025-11-06 | 13F | Prospera Financial Services Inc | 0 | -100,00 | 0 | |||||
| 2026-02-17 | 13F | Brevan Howard Capital Management LP | Call | 550.000 | 8.005 | |||||
| 2025-11-14 | 13F | 59 North Capital Management, LP | 0 | -100,00 | 0 | |||||
| 2026-01-22 | 13F | Shikiar Asset Management Inc | 52.950 | 0,67 | 1 | |||||
| 2025-11-12 | 13F | Amitell Capital Pte Ltd | 0 | -100,00 | 0 | |||||
| 2026-02-23 | 13F | REX Advisers, LLC | Put | 54.400 | 34 | |||||
| 2025-11-12 | 13F | Aptus Capital Advisors, LLC | Call | 0 | -100,00 | 0 | ||||
| 2026-02-23 | 13F | REX Advisers, LLC | Call | 54.400 | 5 | |||||
| 2026-02-17 | 13F | Ionic Capital Management LLC | Call | 0 | -100,00 | 0 | ||||
| 2026-02-23 | 13F | REX Advisers, LLC | 27.200 | 396 | ||||||
| 2025-11-12 | 13F | Aptus Capital Advisors, LLC | 0 | -100,00 | 0 | |||||
| 2026-02-12 | 13F | State Board Of Administration Of Florida Retirement System | 25.500 | 0,00 | 371 | -18,82 | ||||
| 2026-02-11 | 13F | Trivest Advisors Ltd | 0 | -100,00 | 0 | |||||
| 2025-12-01 | 13F | Groupama Asset Managment | 438 | 2,34 | ||||||
| 2026-02-17 | 13F | Value Aligned Research Advisors, LLC | 8.089.697 | 117.786 | ||||||
| 2026-02-17 | 13F | Aqr Capital Management Llc | 69.023 | -4,22 | 1.005 | -22,29 | ||||
| 2026-02-02 | 13F | Sandro Wealth Management LLC | 308.614 | 4.493 | ||||||
| 2026-02-17 | 13F | Weiss Asset Management LP | 1.081 | 16 | ||||||
| 2026-02-13 | 13F | Squarepoint Ops LLC | Put | 12.600 | 183 | |||||
| 2026-02-13 | 13F | Squarepoint Ops LLC | 1.194.671 | 17.394 | ||||||
| 2026-02-17 | 13F | Tortoise Capital Advisors, L.l.c. | 1.026.045 | 14.939 | ||||||
| 2026-02-11 | 13F | Rise Advisors, LLC | 0 | -100,00 | 0 | |||||
| 2026-02-13 | 13F | DLD Asset Management, LP | Put | 351.000 | 0,29 | 5.109 | -18,71 | |||
| 2026-02-17 | 13F | London & Capital Asset Management Ltd | 37.500 | 0,00 | 546 | -18,90 | ||||
| 2026-02-17 | 13F | Soviero Asset Management, LP | 0 | -100,00 | 0 | -100,00 | ||||
| 2026-02-17 | 13F | Northern Trust Corp | 2.438.303 | -4,99 | 35.502 | -22,89 | ||||
| 2026-01-09 | 13F | Tactive Advisors, LLC | 14.267 | -26,47 | 208 | -40,52 | ||||
| 2026-02-11 | 13F | Simplex Trading, Llc | 113.217 | -51,59 | 1.648 | 41.100,00 | ||||
| 2026-02-17 | 13F | Point72 Asset Management, L.P. | Call | 361.300 | 1.258,27 | 5.261 | 1.002,73 | |||
| 2026-03-12 | 13F/A | Peak6 Llc | Call | 778.900 | -81,68 | 11.341 | -85,13 | |||
| 2026-02-17 | 13F | Point72 Asset Management, L.P. | 1.134.259 | 16.515 | ||||||
| 2026-03-12 | 13F/A | Peak6 Llc | 297.398 | 4.330 | ||||||
| 2026-02-17 | 13F | Point72 Asset Management, L.P. | Put | 68.800 | 152,01 | 1.002 | 104,70 | |||
| 2026-03-12 | 13F/A | Peak6 Llc | Put | 730.700 | -64,09 | 10.639 | -70,86 | |||
| 2026-04-06 | 13F | GAMMA Investing LLC | 2.267 | 24,90 | 34 | 26,92 | ||||
| 2026-02-17 | 13F | Parallax Volatility Advisers, L.P. | Call | 662.000 | -59,20 | 9.639 | -66,89 | |||
| 2026-02-12 | 13F | Titleist Asset Management, Llc | 50.221 | -37,68 | 731 | -49,41 | ||||
| 2026-02-17 | 13F | Parallax Volatility Advisers, L.P. | Put | 1.051.700 | 25,44 | 15.313 | 1,81 | |||
| 2026-02-17 | 13F | Parallax Volatility Advisers, L.P. | 506.803 | 7.379 | ||||||
| 2025-11-14 | 13F | Verition Fund Management LLC | Put | 0 | -100,00 | 0 | -100,00 | |||
| 2026-02-17 | 13F | Capital Fund Management S.a. | 0 | -100,00 | 0 | -100,00 | ||||
| 2025-11-14 | 13F | Woodline Partners LP | 0 | -100,00 | 0 | |||||
| 2026-02-17 | 13F | Susquehanna International Group, Llp | 1.436.750 | 299,23 | 20.919 | 224,02 | ||||
| 2026-01-23 | 13F | Westside Investment Management, Inc. | 58 | 1 | ||||||
| 2025-10-22 | 13F | Gladstone Institutional Advisory LLC | 0 | -100,00 | 0 | |||||
| 2026-02-17 | 13F | Susquehanna International Group, Llp | Put | 10.264.300 | 71,89 | 149.448 | 39,50 | |||
| 2026-02-17 | 13F | Susquehanna International Group, Llp | Call | 15.406.400 | 9,89 | 224.317 | -10,81 | |||
| 2026-02-13 | 13F | Uniting Wealth Partners, LLC | 29.379 | 0,00 | 428 | -18,98 | ||||
| 2026-02-12 | 13F | Investment Counsel Co Of Nevada | 5.400 | 79 | ||||||
| 2026-02-17 | 13F | Custos Family Office, LLC | 121.306 | 0,00 | 1.766 | -18,84 | ||||
| 2025-11-14 | 13F | Alight Capital Management LP | 0 | -100,00 | 0 |
Other Listings
| IT:1CORZ | 15,98 € |