Grundlæggende statistik
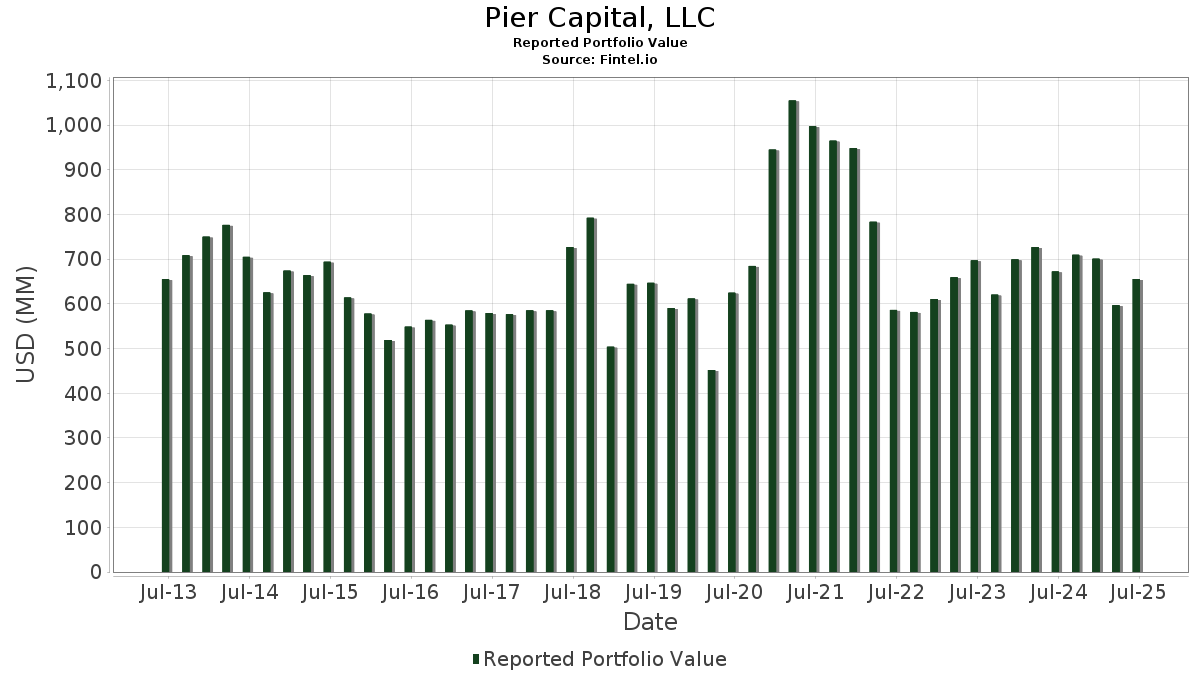
| Porteføljeværdi | $ 655.504.158 |
| Nuværende stillinger | 121 |
Seneste beholdninger, ydeevne, AUM (fra 13F, 13D)
Pier Capital, LLC har afsløret 121 samlede besiddelser i deres seneste SEC-arkivering. Den seneste porteføljeværdi er beregnet til at være $ 655.504.158 USD. Faktiske aktiver under forvaltning (AUM) er denne værdi plus kontanter (som ikke er oplyst). Pier Capital, LLCs største beholdninger er Mirion Technologies, Inc. (US:MIR) , e.l.f. Beauty, Inc. (US:ELF) , JFrog Ltd. (US:FROG) , Sterling Infrastructure, Inc. (US:STRL) , and Adaptive Biotechnologies Corporation (US:ADPT) . Pier Capital, LLCs nye stillinger omfatter Establishment Labs Holdings Inc. (US:ESTA) , Certara, Inc. (US:CERT) , Perella Weinberg Partners (US:PWP) , GRAIL, LLC (US:GRAL.V) , and Oddity Tech Ltd. (US:ODD) .
Top øger dette kvartal
Vi bruger ændringen i porteføljeallokeringen, fordi dette er den mest meningsfulde metrik. Ændringer kan skyldes handler eller ændringer i aktiekurser.
| Sikkerhed | Aktier (MM) |
Værdi (MM$) |
Portefølje % | ΔPortefølje % |
|---|---|---|---|---|
| 0,25 | 10,78 | 1,6440 | 1,6440 | |
| 0,29 | 8,10 | 1,2363 | 1,2363 | |
| 0,05 | 11,88 | 1,8125 | 1,1953 | |
| 0,67 | 7,81 | 1,1913 | 1,1913 | |
| 0,39 | 7,65 | 1,1676 | 1,1676 | |
| 0,12 | 14,58 | 2,2235 | 0,9286 | |
| 0,11 | 5,54 | 0,8448 | 0,8448 | |
| 0,10 | 5,51 | 0,8404 | 0,8404 | |
| 0,08 | 5,29 | 0,8070 | 0,8070 | |
| 0,07 | 5,20 | 0,7939 | 0,7939 |
Top falder i dette kvartal
Vi bruger ændringen i porteføljeallokeringen, fordi dette er den mest meningsfulde metrik. Ændringer kan skyldes handler eller ændringer i aktiekurser.
| Sikkerhed | Aktier (MM) |
Værdi (MM$) |
Portefølje % | ΔPortefølje % |
|---|---|---|---|---|
| 0,00 | 0,01 | 0,0009 | -0,8815 | |
| 0,03 | 5,01 | 0,7636 | -0,8753 | |
| 0,00 | 0,01 | 0,0009 | -0,7036 | |
| 0,06 | 2,02 | 0,3085 | -0,6881 | |
| 0,02 | 3,97 | 0,6061 | -0,5294 | |
| 0,06 | 8,30 | 1,2656 | -0,5189 | |
| 0,03 | 6,97 | 1,0626 | -0,5179 | |
| 0,07 | 7,57 | 1,1550 | -0,4865 | |
| 0,11 | 6,72 | 1,0257 | -0,4789 | |
| 0,25 | 8,49 | 1,2946 | -0,4636 |
13F og Fondsarkivering
Denne formular blev indsendt den 2025-08-05 for rapporteringsperioden 2025-06-30. Klik på linkikonet for at se den fulde transaktionshistorik.
Opgrader for at låse op for premium-data og eksportere til Excel ![]() .
.
| Sikkerhed | Type | Gennemsnitlig aktiekurs | Aktier (MM) |
Δ Aktier (%) |
Δ Aktier (%) |
Værdi ($MM) |
Portefølje (%) |
ΔPortefølje (%) |
|
|---|---|---|---|---|---|---|---|---|---|
| MIR / Mirion Technologies, Inc. | 0,87 | -7,48 | 18,75 | 37,37 | 2,8609 | 0,5735 | |||
| ELF / e.l.f. Beauty, Inc. | 0,12 | -4,84 | 14,58 | 88,60 | 2,2235 | 0,9286 | |||
| FROG / JFrog Ltd. | 0,29 | -16,20 | 12,66 | 14,92 | 1,9307 | 0,0854 | |||
| STRL / Sterling Infrastructure, Inc. | 0,05 | 58,26 | 11,88 | 222,59 | 1,8125 | 1,1953 | |||
| ADPT / Adaptive Biotechnologies Corporation | 1,02 | -7,34 | 11,85 | 45,30 | 1,8073 | 0,4411 | |||
| CFLT / Confluent, Inc. | 0,46 | 50,62 | 11,58 | 60,20 | 1,7672 | 0,5556 | |||
| ATGE / Adtalem Global Education Inc. | 0,09 | -7,57 | 11,57 | 16,86 | 1,7651 | 0,1061 | |||
| FN / Fabrinet | 0,04 | -5,34 | 11,07 | 41,23 | 1,6886 | 0,3753 | |||
| ESTA / Establishment Labs Holdings Inc. | 0,25 | 10,78 | 1,6440 | 1,6440 | |||||
| IBP / Installed Building Products, Inc. | 0,06 | 25,95 | 9,96 | 32,46 | 1,5197 | 0,2596 | |||
| SBCF / Seacoast Banking Corporation of Florida | 0,35 | -6,41 | 9,71 | 0,47 | 1,4817 | -0,1382 | |||
| HXL / Hexcel Corporation | 0,17 | 25,58 | 9,58 | 29,56 | 1,4611 | 0,2223 | |||
| SIBN / SI-BONE, Inc. | 0,50 | 7,17 | 9,37 | 43,76 | 1,4299 | 0,3374 | |||
| IPAR / Interparfums, Inc. | 0,07 | -4,79 | 9,36 | 9,79 | 1,4276 | -0,0006 | |||
| MC / Moelis & Company | 0,15 | -4,82 | 9,35 | 1,63 | 1,4268 | -0,1151 | |||
| QTWO / Q2 Holdings, Inc. | 0,10 | -4,74 | 9,12 | 11,44 | 1,3913 | 0,0200 | |||
| MSA / MSA Safety Incorporated | 0,05 | -7,41 | 9,08 | 5,74 | 1,3851 | -0,0536 | |||
| GBCI / Glacier Bancorp, Inc. | 0,21 | -6,80 | 9,06 | -9,20 | 1,3822 | -0,2897 | |||
| BWXT / BWX Technologies, Inc. | 0,06 | -5,65 | 9,02 | 37,79 | 1,3756 | 0,2791 | |||
| ALGM / Allegro MicroSystems, Inc. | 0,26 | -7,94 | 8,96 | 25,25 | 1,3673 | 0,1683 | |||
| SITM / SiTime Corporation | 0,04 | -4,37 | 8,92 | 33,29 | 1,3614 | 0,2396 | |||
| WSC / WillScot Holdings Corporation | 0,32 | -7,30 | 8,88 | -8,63 | 1,3550 | -0,2738 | |||
| OSW / OneSpaWorld Holdings Limited | 0,43 | -17,43 | 8,87 | 0,27 | 1,3527 | -0,1289 | |||
| STVN / Stevanato Group S.p.A. | 0,35 | -6,53 | 8,60 | 11,82 | 1,3116 | 0,0234 | |||
| FVRR / Fiverr International Ltd. | 0,29 | -23,49 | 8,49 | -5,25 | 1,2953 | -0,2060 | |||
| UTI / Universal Technical Institute, Inc. | 0,25 | -38,72 | 8,49 | -19,13 | 1,2946 | -0,4636 | |||
| BL / BlackLine, Inc. | 0,15 | -1,38 | 8,43 | 15,32 | 1,2865 | 0,0612 | |||
| GTLB / GitLab Inc. | 0,18 | 36,88 | 8,34 | 31,38 | 1,2722 | 0,2086 | |||
| GOOS / Canada Goose Holdings Inc. | 0,74 | -7,24 | 8,30 | 30,57 | 1,2669 | 0,2012 | |||
| OLLI / Ollie's Bargain Outlet Holdings, Inc. | 0,06 | -31,22 | 8,30 | -22,10 | 1,2656 | -0,5189 | |||
| VERX / Vertex, Inc. | 0,23 | -6,90 | 8,18 | -6,04 | 1,2486 | -0,2108 | |||
| NCNO / nCino, Inc. | 0,29 | 8,10 | 1,2363 | 1,2363 | |||||
| CERT / Certara, Inc. | 0,67 | 7,81 | 1,1913 | 1,1913 | |||||
| LNN / Lindsay Corporation | 0,05 | -6,73 | 7,73 | 6,34 | 1,1794 | -0,0387 | |||
| PTLO / Portillo's Inc. | 0,66 | 153,10 | 7,73 | 148,44 | 1,1792 | 0,6578 | |||
| PWP / Perella Weinberg Partners | 0,39 | 7,65 | 1,1676 | 1,1676 | |||||
| FLS / Flowserve Corporation | 0,14 | -22,49 | 7,59 | -16,93 | 1,1576 | -0,3728 | |||
| LSCC / Lattice Semiconductor Corporation | 0,15 | -7,36 | 7,58 | -13,47 | 1,1565 | -0,3114 | |||
| PNFP / Pinnacle Financial Partners, Inc. | 0,07 | -25,77 | 7,57 | -22,71 | 1,1550 | -0,4865 | |||
| ONTO / Onto Innovation Inc. | 0,07 | 40,97 | 7,46 | 17,25 | 1,1379 | 0,0720 | |||
| FRSH / Freshworks Inc. | 0,50 | -6,84 | 7,43 | -1,55 | 1,1329 | -0,1311 | |||
| FOUR / Shift4 Payments, Inc. | 0,07 | -6,98 | 7,34 | 12,84 | 1,1196 | 0,0297 | |||
| RGEN / Repligen Corporation | 0,06 | -7,37 | 7,34 | -9,44 | 1,1191 | -0,2383 | |||
| VRNS / Varonis Systems, Inc. | 0,14 | -29,94 | 7,23 | -12,11 | 1,1034 | -0,2754 | |||
| ACVA / ACV Auctions Inc. | 0,44 | -32,70 | 7,18 | -22,54 | 1,0955 | -0,4576 | |||
| PRVA / Privia Health Group, Inc. | 0,31 | -24,24 | 7,18 | -22,39 | 1,0947 | -0,4543 | |||
| RDNT / RadNet, Inc. | 0,13 | -22,87 | 7,17 | -11,72 | 1,0944 | -0,2671 | |||
| ADUS / Addus HomeCare Corporation | 0,06 | -7,29 | 7,01 | 7,99 | 1,0698 | -0,0182 | |||
| BILL / BILL Holdings, Inc. | 0,15 | -6,97 | 7,01 | -6,22 | 1,0696 | -0,1831 | |||
| AIT / Applied Industrial Technologies, Inc. | 0,03 | -28,42 | 6,97 | -26,16 | 1,0626 | -0,5179 | |||
| ANGO / AngioDynamics, Inc. | 0,69 | 40,54 | 6,89 | 48,47 | 1,0506 | 0,2734 | |||
| PCOR / Procore Technologies, Inc. | 0,10 | -7,40 | 6,85 | -4,05 | 1,0456 | -0,1512 | |||
| SKY / Champion Homes, Inc. | 0,11 | 13,32 | 6,72 | -25,13 | 1,0257 | -0,4789 | |||
| HRI / Herc Holdings Inc. | 0,05 | -7,21 | 6,46 | -8,99 | 0,9852 | -0,2039 | |||
| CWAN / Clearwater Analytics Holdings, Inc. | 0,29 | -4,81 | 6,33 | -22,12 | 0,9664 | -0,3963 | |||
| BOOT / Boot Barn Holdings, Inc. | 0,04 | -0,30 | 6,01 | 41,08 | 0,9165 | 0,2029 | |||
| ARDT / Ardent Health, Inc. | 0,43 | -6,83 | 5,94 | -7,45 | 0,9063 | -0,1692 | |||
| IMAX / IMAX Corporation | 0,21 | -7,46 | 5,81 | -1,81 | 0,8858 | -0,1050 | |||
| POWL / Powell Industries, Inc. | 0,03 | 8,11 | 5,72 | 33,58 | 0,8721 | 0,1550 | |||
| GRAL.V / GRAIL, LLC | 0,11 | 5,54 | 0,8448 | 0,8448 | |||||
| CCS / Century Communities, Inc. | 0,10 | 5,51 | 0,8404 | 0,8404 | |||||
| MMS / Maximus, Inc. | 0,08 | 5,29 | 0,8070 | 0,8070 | |||||
| AEHR / Aehr Test Systems, Inc. | 0,41 | 15,96 | 5,25 | 105,64 | 0,8007 | 0,3731 | |||
| ODD / Oddity Tech Ltd. | 0,07 | 5,20 | 0,7939 | 0,7939 | |||||
| OMCL / Omnicell, Inc. | 0,18 | 81,32 | 5,20 | 52,48 | 0,7935 | 0,2219 | |||
| ETOR / eToro Group Ltd. | 0,08 | 5,18 | 0,7898 | 0,7898 | |||||
| BE / Bloom Energy Corporation | 0,21 | -36,92 | 5,02 | -23,24 | 0,7658 | -0,3301 | |||
| HLI / Houlihan Lokey, Inc. | 0,03 | -54,07 | 5,01 | -48,82 | 0,7636 | -0,8753 | |||
| SXT / Sensient Technologies Corporation | 0,05 | 4,92 | 0,7499 | 0,7499 | |||||
| CDXS / Codexis, Inc. | 1,92 | 14,73 | 4,67 | 4,05 | 0,7129 | -0,0395 | |||
| FRPT / Freshpet, Inc. | 0,07 | 4,48 | 0,6839 | 0,6839 | |||||
| ROIV / Roivant Sciences Ltd. | 0,40 | -7,44 | 4,47 | 3,40 | 0,6814 | -0,0425 | |||
| DNLI / Denali Therapeutics Inc. | 0,31 | -6,17 | 4,40 | -3,46 | 0,6718 | -0,0924 | |||
| WNS / WNS (Holdings) Limited | 0,07 | 10,37 | 4,40 | 13,53 | 0,6710 | 0,0218 | |||
| ACLX / Arcellx, Inc. | 0,06 | -6,39 | 4,19 | -6,03 | 0,6392 | -0,1079 | |||
| GPCR / Structure Therapeutics Inc. - Depositary Receipt (Common Stock) | 0,20 | -6,61 | 4,12 | 11,91 | 0,6280 | 0,0116 | |||
| CRNX / Crinetics Pharmaceuticals, Inc. | 0,14 | 25,75 | 4,10 | 7,84 | 0,6257 | -0,0117 | |||
| SAIA / Saia, Inc. | 0,01 | 4,06 | 0,6194 | 0,6194 | |||||
| GTLS / Chart Industries, Inc. | 0,02 | -48,60 | 3,97 | -41,38 | 0,6061 | -0,5294 | |||
| AVXL / Anavex Life Sciences Corp. | 0,42 | -6,87 | 3,91 | 0,08 | 0,5966 | -0,0581 | |||
| SGRY / Surgery Partners, Inc. | 0,17 | 22.334,96 | 3,88 | 21.455,56 | 0,5919 | 0,5888 | |||
| GH / Guardant Health, Inc. | 0,07 | -41,12 | 3,77 | -28,07 | 0,5748 | -0,3029 | |||
| CORZ / Core Scientific, Inc. | 0,22 | 3,73 | 0,5691 | 0,5691 | |||||
| CAPR / Capricor Therapeutics, Inc. | 0,37 | 3,82 | 3,65 | 8,63 | 0,5570 | -0,0061 | |||
| XMTR / Xometry, Inc. | 0,11 | 3,60 | 0,5491 | 0,5491 | |||||
| LNTH / Lantheus Holdings, Inc. | 0,04 | -13,25 | 3,59 | -27,23 | 0,5483 | -0,2794 | |||
| OLMA / Olema Pharmaceuticals, Inc. | 0,77 | -5,73 | 3,28 | 6,80 | 0,5011 | -0,0142 | |||
| CECO / CECO Environmental Corp. | 0,11 | 3,23 | 0,4921 | 0,4921 | |||||
| TLX / Telix Pharmaceuticals Limited - Depositary Receipt (Common Stock) | 0,19 | 3,04 | 0,4633 | 0,4633 | |||||
| TREX / Trex Company, Inc. | 0,06 | -4,97 | 3,00 | -11,07 | 0,4572 | -0,1074 | |||
| KGS / Kodiak Gas Services, Inc. | 0,06 | -63,00 | 2,02 | -66,00 | 0,3085 | -0,6881 | |||
| TW / Tradeweb Markets Inc. | 0,01 | -3,93 | 1,24 | -5,28 | 0,1889 | -0,0301 | |||
| FIX / Comfort Systems USA, Inc. | 0,00 | -2,56 | 1,14 | 62,13 | 0,1744 | 0,0562 | |||
| PINS / Pinterest, Inc. | 0,03 | -2,71 | 1,13 | 12,61 | 0,1730 | 0,0042 | |||
| EVR / Evercore Inc. | 0,00 | -2,33 | 1,00 | 32,14 | 0,1518 | 0,0255 | |||
| TXRH / Texas Roadhouse, Inc. | 0,01 | -2,51 | 0,98 | 9,66 | 0,1489 | -0,0002 | |||
| LNG / Cheniere Energy, Inc. | 0,00 | -2,30 | 0,97 | 2,75 | 0,1484 | -0,0101 | |||
| MDB / MongoDB, Inc. | 0,00 | -2,29 | 0,94 | 17,08 | 0,1433 | 0,0087 | |||
| DT / Dynatrace, Inc. | 0,02 | -2,31 | 0,90 | 14,39 | 0,1371 | 0,0055 | |||
| CYBR / CyberArk Software Ltd. | 0,00 | -4,03 | 0,62 | 15,49 | 0,0945 | 0,0047 | |||
| AXON / Axon Enterprise, Inc. | 0,00 | -5,71 | 0,56 | 48,54 | 0,0855 | 0,0222 | |||
| MSCI / MSCI Inc. | 0,00 | -1,14 | 0,50 | 0,80 | 0,0765 | -0,0068 | |||
| MPWR / Monolithic Power Systems, Inc. | 0,00 | -4,46 | 0,42 | 20,57 | 0,0645 | 0,0057 | |||
| PEN / Penumbra, Inc. | 0,00 | 0,39 | 0,0601 | 0,0601 | |||||
| WST / West Pharmaceutical Services, Inc. | 0,00 | -98,18 | 0,01 | -98,35 | 0,0018 | -0,1097 | |||
| PGNY / Progyny, Inc. | 0,00 | 0,00 | 0,01 | 0,00 | 0,0017 | -0,0002 | |||
| ULTA / Ulta Beauty, Inc. | 0,00 | 0,00 | 0,01 | 37,50 | 0,0017 | 0,0002 | |||
| FTI / TechnipFMC plc | 0,00 | 0,00 | 0,01 | 10,00 | 0,0017 | -0,0000 | |||
| WMS / Advanced Drainage Systems, Inc. | 0,00 | 0,00 | 0,01 | 14,29 | 0,0013 | -0,0000 | |||
| IEX / IDEX Corporation | 0,00 | 0,00 | 0,01 | -12,50 | 0,0012 | -0,0002 | |||
| DXCM / DexCom, Inc. | 0,00 | 0,00 | 0,01 | 16,67 | 0,0012 | 0,0002 | |||
| BLD / TopBuild Corp. | 0,00 | 0,00 | 0,01 | 0,00 | 0,0012 | -0,0000 | |||
| ENTG / Entegris, Inc. | 0,00 | 0,00 | 0,01 | -14,29 | 0,0010 | -0,0002 | |||
| IQV / IQVIA Holdings Inc. | 0,00 | 0,00 | 0,01 | -14,29 | 0,0010 | -0,0002 | |||
| IDXX / IDEXX Laboratories, Inc. | 0,00 | 0,00 | 0,01 | 20,00 | 0,0010 | 0,0001 | |||
| ESTC / Elastic N.V. | 0,00 | 0,00 | 0,01 | 0,00 | 0,0010 | -0,0002 | |||
| SG / Sweetgreen, Inc. | 0,00 | -99,76 | 0,01 | -99,88 | 0,0009 | -0,7036 | |||
| FIVN / Five9, Inc. | 0,00 | -99,77 | 0,01 | -99,81 | 0,0009 | -0,4430 | |||
| GLOB / Globant S.A. | 0,00 | -99,86 | 0,01 | -99,91 | 0,0009 | -0,8815 | |||
| VIK / Viking Holdings Ltd | 0,00 | 0,00 | 0,00 | 33,33 | 0,0007 | 0,0001 | |||
| FIVE / Five Below, Inc. | 0,00 | 0,00 | 0,00 | 100,00 | 0,0007 | 0,0002 | |||
| NXT / Nextracker Inc. | 0,00 | -100,00 | 0,00 | 0,0000 | |||||
| BECN / Beacon Roofing Supply, Inc. | 0,00 | -100,00 | 0,00 | 0,0000 | |||||
| EXPO / Exponent, Inc. | 0,00 | -100,00 | 0,00 | 0,0000 | |||||
| VEEV / Veeva Systems Inc. | 0,00 | -100,00 | 0,00 | 0,0000 | |||||
| CART / Maplebear Inc. | 0,00 | -100,00 | 0,00 | 0,0000 | |||||
| BROS / Dutch Bros Inc. | 0,00 | -100,00 | 0,00 | 0,0000 | |||||
| COCO / The Vita Coco Company, Inc. | 0,00 | -100,00 | 0,00 | 0,0000 | |||||
| SKX / Skechers U.S.A., Inc. | 0,00 | -100,00 | 0,00 | 0,0000 | |||||
| QTRX / Quanterix Corporation | 0,00 | -100,00 | 0,00 | 0,0000 | |||||
| LEVI / Levi Strauss & Co. | 0,00 | -100,00 | 0,00 | 0,0000 | |||||
| AMN / AMN Healthcare Services, Inc. | 0,00 | -100,00 | 0,00 | 0,0000 | |||||
| EXLS / ExlService Holdings, Inc. | 0,00 | -100,00 | 0,00 | 0,0000 |