Grundlæggende statistik
| Institutionelle aktier (lange) | 242.258.985 - 61,68% (ex 13D/G) - change of 10,13MM shares 3,39% MRQ |
| Institutionel værdi (lang) | $ 7.617.907 USD ($1000) |
Institutionelt ejerskab og aktionærer
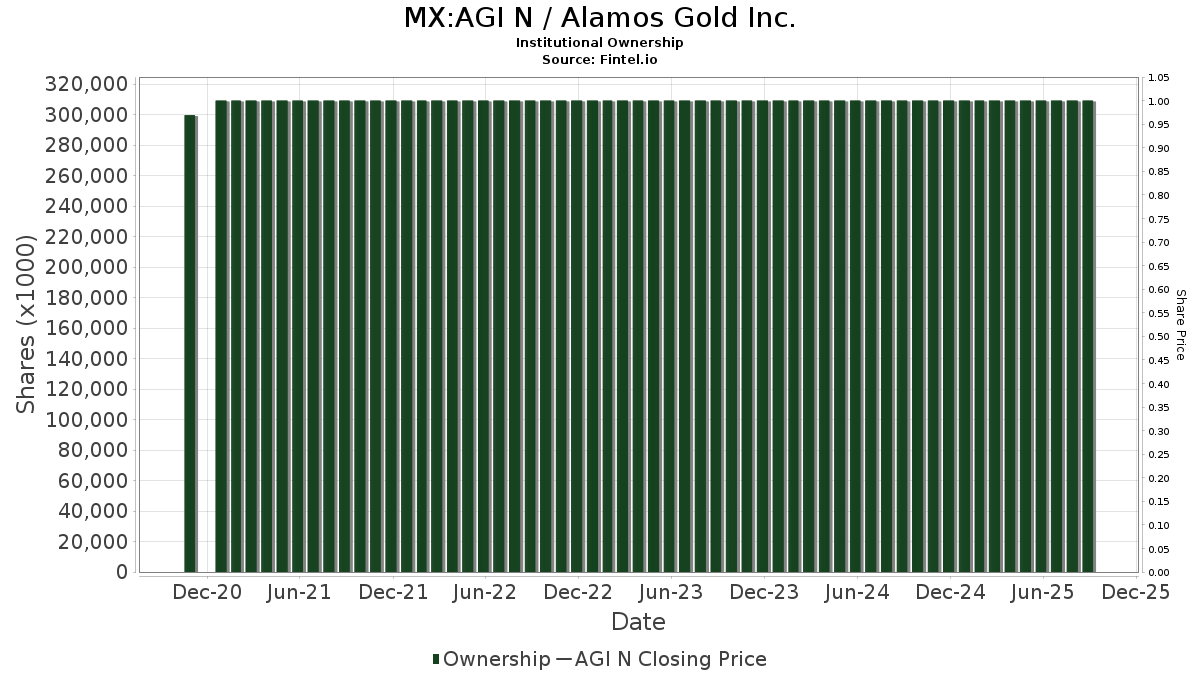
Alamos Gold Inc. (MX:AGI N) har 474 institutionelle ejere og aktionærer, der har indsendt 13D/G- eller 13F-formularer til Securities Exchange Commission (SEC). Disse institutioner har i alt 242,258,985 aktier. Største aktionærer omfatter Van Eck Associates Corp, Vanguard Group Inc, Fmr Llc, Arrowstreet Capital, Limited Partnership, CIBC Asset Management Inc, Royal Bank Of Canada, Mackenzie Financial Corp, Bank Of Montreal /can/, First Eagle Investment Management, LLC, and Norges Bank .
Alamos Gold Inc. (BMV:AGI N) institutionel ejerskabsstruktur viser aktuelle positioner i virksomheden efter institutioner og fonde, samt seneste ændringer i positionsstørrelse. Større aktionærer kan omfatte individuelle investorer, investeringsforeninger, hedgefonde eller institutioner. Skema 13D angiver, at investoren besidder (eller besidder) mere end 5 % af virksomheden og har til hensigt (eller har til hensigt at) aktivt at forfølge en ændring i forretningsstrategi. Skema 13G indikerer en passiv investering på over 5%.
Fondens stemningsscore
Fund Sentiment Score (fka Ownership Accumulation Score) finder de aktier, der bliver mest købt af fonde. Det er resultatet af en sofistikeret, multi-faktor kvantitativ model, der identificerer virksomheder med de højeste niveauer af institutionel akkumulering. Scoringsmodellen bruger en kombination af den samlede stigning i oplyste ejere, ændringerne i porteføljeallokeringer i disse ejere og andre målinger. Tallet går fra 0 til 100, hvor højere tal indikerer et højere niveau af akkumulering for sine jævnaldrende, og 50 er gennemsnittet.
Opdateringsfrekvens: Dagligt
Se Ownership Explorer, som giver en liste over højest rangerende virksomheder.
AI+ Ask Fintel’s AI assistant about Alamos Gold Inc..
Select a question to share a public post with an AI-crafted answer.
Thinking of good questions…
13F og NPORT arkivering
Detaljer om 13F-arkivering er gratis. Detaljer om NP-ansøgninger kræver et premium-medlemskab. Grønne rækker angiver nye positioner. Røde rækker angiver lukkede positioner. Klik på linket ikon for at se den fulde transaktionshistorik.
Opgrader
for at låse premium-data op og eksportere til Excel ![]() .
.
| Fil dato | Kilde | Investor | Type | Gennemsnitlig pris (Øst) |
Aktier | Δ Aktier (%) |
Rapporteret Værdi ($1000) |
Δ Værdi (%) |
Port Alloc (%) |
|
|---|---|---|---|---|---|---|---|---|---|---|
| 2026-02-06 | 13F | EverSource Wealth Advisors, LLC | 1.441 | 1,77 | 56 | 12,24 | ||||
| 2026-02-10 | 13F | Gulf International Bank (UK) Ltd | 22.414 | 0,00 | 1 | -100,00 | ||||
| 2026-02-10 | 13F | Forsta Ap-fonden | 85.600 | -1,50 | 3.310 | 9,24 | ||||
| 2026-02-12 | 13F | Penserra Capital Management LLC | 39.637 | 2 | ||||||
| 2026-04-23 | 13F | Lansforsakringar Fondforvaltning AB (publ) | 92.277 | 1,66 | 4.092 | 16,61 | ||||
| 2026-01-15 | 13F | J. Safra Sarasin Holding AG | 65.990 | 2.546 | ||||||
| 2026-01-30 | 13F | Us Bancorp \de\ | 4.244 | 0,00 | 164 | 10,88 | ||||
| 2025-11-12 | 13F | Transce3nd, LLC | 0 | -100,00 | 0 | |||||
| 2026-02-10 | 13F | Intech Investment Management Llc | 14.833 | 0,00 | 574 | 10,83 | ||||
| 2026-04-29 | 13F | CVA Family Office, LLC | 88 | 0,00 | 4 | 0,00 | ||||
| 2026-02-13 | 13F | BRITISH COLUMBIA INVESTMENT MANAGEMENT Corp | 223.721 | -8,78 | 8.639 | 1,06 | ||||
| 2026-02-06 | 13F | Pnc Financial Services Group, Inc. | 5.178 | 1,83 | 200 | 12,43 | ||||
| 2026-02-13 | 13F | Mudita Advisors LLP | 0 | -100,00 | 0 | |||||
| 2026-02-17 | 13F | Wellington Management Group Llp | 60.590 | 8,21 | 2.343 | 19,98 | ||||
| 2026-04-14 | 13F | Nbc Securities, Inc. | 316 | 14 | ||||||
| 2025-11-13 | 13F | Blueshift Asset Management, LLC | 0 | -100,00 | 0 | |||||
| 2026-02-06 | 13F | Larson Financial Group LLC | 237 | 282,26 | 9 | 350,00 | ||||
| 2026-02-13 | 13F | Walleye Capital LLC | Call | 15.500 | -29,55 | 598 | -22,06 | |||
| 2026-01-30 | 13F | Jennison Associates Llc | 682.747 | -0,85 | 26.340 | 9,74 | ||||
| 2026-02-13 | 13F | Walleye Capital LLC | Put | 47.200 | -58,01 | 1.821 | -53,55 | |||
| 2026-04-24 | 13F | Oakworth Capital, Inc. | 300 | 0,00 | 13 | 18,18 | ||||
| 2026-02-17 | 13F | T. Rowe Price Investment Management, Inc. | 55 | 0 | ||||||
| 2026-02-13 | 13F | Walleye Capital LLC | 32.351 | 72,23 | 1.248 | 90,83 | ||||
| 2026-01-27 | 13F | TD Waterhouse Canada Inc. | 110.703 | 11,41 | 4.259 | 22,22 | ||||
| 2026-02-11 | 13F | Simplex Trading, Llc | Call | 252.700 | -35,30 | 9.749 | 74.892,31 | |||
| 2026-04-23 | 13F | Grand Central Investment Group | 148.674 | 1,52 | 6.606 | 16,92 | ||||
| 2026-02-11 | 13F | Simplex Trading, Llc | Put | 32.300 | -17,60 | 1.246 | 124.500,00 | |||
| 2026-02-17 | 13F | Fmr Llc | 13.507.314 | -0,96 | 521.568 | 9,71 | ||||
| 2026-04-21 | 13F | Fruth Investment Management | 40.000 | 0,00 | 2 | 0,00 | ||||
| 2026-02-12 | 13F | Steward Partners Investment Advisory, Llc | 1.468 | 0,00 | 57 | 9,80 | ||||
| 2026-04-14 | 13F | Murphy Pohlad Asset Management LLC | 149.300 | -0,76 | 6.633 | 14,30 | ||||
| 2026-02-17 | 13F | Scientech Research LLC | 0 | -100,00 | 0 | |||||
| 2026-02-17 | 13F | Progeny 3, Inc. | 0 | -100,00 | 0 | |||||
| 2026-04-13 | 13F | IFP Advisors, Inc | 31.021 | 0,45 | 1.378 | 15,70 | ||||
| 2026-02-13 | 13F | First Trust Advisors Lp | 98.482 | -25,95 | 3.800 | -18,03 | ||||
| 2026-02-14 | 13F | Rockefeller Capital Management L.P. | 58.921 | 4.647,86 | 2.273 | 5.186,05 | ||||
| 2026-02-17 | 13F | Russell Investments Group, Ltd. | 310.738 | -15,08 | 12.040 | -5,59 | ||||
| 2025-11-12 | 13F | Headlands Technologies LLC | 0 | -100,00 | 0 | -100,00 | ||||
| 2026-02-17 | 13F | Empyrean Capital Partners, LP | 203.300 | -48,04 | 7.843 | -42,50 | ||||
| 2026-02-17 | 13F | Edmond De Rothschild Holding S.a. | 208.956 | 13,30 | 8.088 | 25,86 | ||||
| 2026-02-18 | 13F | Beacon Pointe Advisors, LLC | 48.314 | 43,36 | 1.864 | 58,69 | ||||
| 2026-02-23 | 13F | Mv Capital Management, Inc. | 5 | 0 | ||||||
| 2026-02-18 | 13F | Beacon Pointe Advisors, LLC | Call | 30.200 | 70,62 | 1.165 | 88,82 | |||
| 2026-04-24 | 13F | Triasima Portfolio Management inc. | 158.513 | 1,31 | 7.030 | 16,20 | ||||
| 2026-02-05 | 13F | Cambridge Investment Research Advisors, Inc. | 108.633 | -3,35 | 4 | 33,33 | ||||
| 2025-11-14 | 13F | AXA Investment Managers S.A. | 235.214 | 8.200 | ||||||
| 2026-01-29 | 13F | Vanguard Group Inc | 17.565.941 | 1,93 | 678.291 | 12,91 | ||||
| 2026-02-17 | 13F | State Of Wisconsin Investment Board | 202.900 | 7.845 | ||||||
| 2026-02-17 | 13F | Ninepoint Partners LP | 305.000 | 0,00 | 11.767 | 10,67 | ||||
| 2026-02-12 | 13F | DJE Kapital AG | 178.230 | -31,23 | 6.951 | 5,67 | ||||
| 2026-02-13 | 13F | Sei Investments Co | 300.202 | -9,97 | 11.582 | -0,37 | ||||
| 2026-02-13 | 13F | Epoch Investment Partners, Inc. | 0 | -100,00 | 0 | |||||
| 2026-02-11 | 13F | Fiera Capital Corp | 412.867 | -19,73 | 15.948 | -11,02 | ||||
| 2026-02-17 | 13F | Capital Fund Management S.a. | Put | 236.800 | -17,14 | 9.136 | -8,30 | |||
| 2026-02-17 | 13F | Aqr Capital Management Llc | 825.952 | 7.791,01 | 31.894 | 8.661,81 | ||||
| 2026-02-17 | 13F | Capital Fund Management S.a. | Call | 215.400 | -17,15 | 8.310 | -8,31 | |||
| 2026-02-12 | 13F | DRW Securities, LLC | 63.129 | 658,94 | 2.436 | 742,56 | ||||
| 2026-04-20 | 13F | Sowell Financial Services LLC | 24.740 | -0,29 | 1.099 | 14,84 | ||||
| 2026-02-13 | 13F | OMERS ADMINISTRATION Corp | 0 | -100,00 | 0 | -100,00 | ||||
| 2026-04-24 | 13F | Profund Advisors Llc | 45.425 | 5,12 | 2.018 | 21,06 | ||||
| 2026-02-13 | 13F | Osmosis Investment Management UK Ltd | 10.978 | 424 | ||||||
| 2026-04-22 | 13F | Stone House Investment Management, LLC | 611 | 511,00 | 27 | 800,00 | ||||
| 2026-02-13 | 13F | Baird Financial Group, Inc. | 6.027 | 233 | ||||||
| 2026-01-15 | 13F | Jaffetilchin Investment Partners, LLC | 6.110 | 0,03 | 236 | 10,85 | ||||
| 2026-02-17 | 13F | Credit Agricole S A | 90.301 | 1,02 | 3.484 | 11,78 | ||||
| 2026-04-27 | 13F | Moran Wealth Management, LLC | 62.274 | 26,43 | 2.762 | 45,06 | ||||
| 2026-02-09 | 13F | Hartland & Co., LLC | 651 | 62,75 | 25 | 92,31 | ||||
| 2026-02-12 | 13F | UniSuper Management Pty Ltd | 8.100 | 0,00 | 429 | 9,44 | ||||
| 2026-02-12 | 13F | Sprott Inc. | 1.134.107 | -27,67 | 43.754 | -19,95 | ||||
| 2026-02-10 | 13F | Zweig-DiMenna Associates LLC | 260.500 | 10.050 | ||||||
| 2026-02-17 | 13F | D. E. Shaw & Co., Inc. | Put | 55.100 | 2.126 | |||||
| 2026-02-19 | 13F | CI Private Wealth, LLC | 17.615 | -41,12 | 656 | -37,14 | ||||
| 2026-02-12 | 13F | Hrt Financial Lp | 169.685 | 7 | ||||||
| 2026-02-17 | 13F | D. E. Shaw & Co., Inc. | 261.716 | 9,68 | 10.097 | 21,39 | ||||
| 2026-02-17 | 13F | Advisor Group Holdings, Inc. | 20.037 | -1,93 | 774 | 14,52 | ||||
| 2025-11-05 | 13F | Anthracite Investment Company, Inc. | 0 | -100,00 | 0 | -100,00 | ||||
| 2026-01-28 | 13F | CAPROCK Group, Inc. | 492.236 | -1,79 | 18.990 | 24,43 | ||||
| 2026-04-23 | 13F | Harbor Investment Advisory, Llc | 65.270 | -0,51 | 2.895 | 14,12 | ||||
| 2025-11-14 | 13F | Maverick Capital Ltd | 0 | -100,00 | 0 | |||||
| 2026-02-13 | 13F | Verition Fund Management LLC | 549.989 | 21.219 | ||||||
| 2026-02-17 | 13F | Gilder Gagnon Howe & Co Llc | 142.977 | -55,36 | 5.516 | -50,60 | ||||
| 2026-02-17 | 13F | Knoll Capital Management, LLC | 50.000 | 0,00 | 1.929 | 10,67 | ||||
| 2026-04-29 | 13F | Harbour Capital Advisors, LLC | 44.970 | 1,18 | 2.031 | 18,98 | ||||
| 2026-02-13 | 13F | Sofos Investments, Inc. | 500 | 19 | ||||||
| 2026-02-17 | 13F | Tudor Investment Corp Et Al | Call | 16.700 | 72,16 | 644 | 90,53 | |||
| 2025-11-14 | 13F | Cinctive Capital Management LP | 0 | -100,00 | 0 | -100,00 | ||||
| 2026-04-07 | 13F | Farther Finance Advisors, LLC | 43.746 | 271,64 | 1.996 | 339,65 | ||||
| 2026-02-13 | 13F | Stifel Financial Corp | 215.850 | 2,28 | 8.327 | 13,20 | ||||
| 2026-02-12 | 13F | StoneX Group Inc. | 22.899 | -11,37 | 883 | -1,89 | ||||
| 2026-02-11 | 13F | Cerity Partners LLC | 32.285 | 5,88 | 1.246 | 17,23 | ||||
| 2026-04-06 | 13F | Versant Capital Management, Inc | 636 | 94,50 | 28 | 133,33 | ||||
| 2026-04-15 | 13F | Addenda Capital Inc. | 1.987.059 | -10,76 | 122.979 | 4,21 | ||||
| 2026-04-22 | 13F | Continuum Advisory, LLC | 6.037 | -22,98 | 268 | -11,26 | ||||
| 2026-02-09 | 13F | Employees Retirement System of Texas | 4.216 | 0,00 | 0 | |||||
| 2026-02-13 | 13F | Pathstone Holdings, LLC | 43.358 | -22,20 | 1.673 | -13,90 | ||||
| 2026-02-12 | 13F | Bank Of Montreal /can/ | Call | 0 | -100,00 | 0 | -100,00 | |||
| 2026-04-21 | 13F | Venturi Wealth Management, LLC | 12.420 | 117,89 | 552 | 151,60 | ||||
| 2026-02-12 | 13F | Rossby Financial, LCC | Call | 0 | -100,00 | 0 | -100,00 | |||
| 2026-02-17 | 13F | Alpine Woods Capital Investors, Llc | 26.965 | 285,21 | 1.040 | 326,23 | ||||
| 2025-11-14 | 13F | Squarepoint Ops LLC | 0 | -100,00 | 0 | -100,00 | ||||
| 2026-02-13 | 13F | Mariner, LLC | 49.497 | 3,18 | 1.910 | 14,17 | ||||
| 2026-02-13 | 13F | Schroder Investment Management Group | 1.161.979 | -14,79 | 45.445 | -3,79 | ||||
| 2026-02-12 | 13F | Northwest & Ethical Investments L.P. | 68.269 | 38,51 | 2.636 | 53,43 | ||||
| 2026-02-13 | 13F | Manufacturers Life Insurance Company, The | 0 | -100,00 | 0 | |||||
| 2026-04-23 | 13F | Oppenheimer & Co Inc | 18.984 | 843 | ||||||
| 2026-02-12 | 13F | Brown Brothers Harriman & Co | 9.901 | 0,00 | 382 | 10,43 | ||||
| 2026-04-14 | 13F | Austin Wealth Management, LLC | 9.445 | 0,00 | 437 | 11,20 | ||||
| 2026-02-10 | 13F | Avestar Capital, LLC | 13.400 | 0,00 | 517 | 10,49 | ||||
| 2025-11-14 | 13F | SummitTX Capital, L.P. | 0 | -100,00 | 0 | |||||
| 2026-02-13 | 13F | Ossiam | 37 | -99,32 | 1 | -99,47 | ||||
| 2026-02-17 | 13F | Crawford Fund Management, LLC | Call | 0 | -100,00 | 0 | ||||
| 2026-02-11 | 13F | Caldwell Investment Management Ltd. | 0 | -100,00 | 0 | |||||
| 2026-04-16 | 13F | Toth Financial Advisory Corp | 140 | 250,00 | 6 | 500,00 | ||||
| 2026-02-17 | 13F | Two Sigma Advisers, Lp | 127.558 | -15,61 | 4.921 | -6,60 | ||||
| 2026-02-13 | 13F | Bay Colony Advisory Group, Inc d/b/a Bay Colony Advisors | 41.792 | -4,97 | 1.612 | 5,22 | ||||
| 2026-02-17 | 13F | Citadel Advisors Llc | 94.379 | 188,09 | 3.641 | 218,83 | ||||
| 2026-02-17 | 13F | Citadel Advisors Llc | Call | 277.800 | -45,68 | 10.718 | -39,88 | |||
| 2026-02-10 | 13F | Easterly Investment Partners Llc | 100.657 | -33,14 | 3.883 | -26,00 | ||||
| 2026-02-17 | 13F | Citadel Advisors Llc | Put | 585.500 | -32,92 | 22.589 | -25,76 | |||
| 2026-02-17 | 13F | Aristotle Capital Boston, LLC | 966.314 | -8,30 | 37.280 | 1,49 | ||||
| 2026-02-12 | 13F | Amitell Capital Pte Ltd | 0 | -100,00 | 0 | |||||
| 2026-02-13 | 13F | General American Investors Co Inc | 241.219 | -48,94 | 9.306 | -43,49 | ||||
| 2026-02-17 | 13F | SIG North Trading, ULC | Call | 128.600 | 209,13 | 4.961 | 242,14 | |||
| 2026-02-17 | 13F | Bank Of America Corp /de/ | 2.310.497 | -11,97 | 89.139 | -2,57 | ||||
| 2026-02-17 | 13F | SIG North Trading, ULC | 15.769 | -63,90 | 608 | -60,05 | ||||
| 2026-02-17 | 13F | SIG North Trading, ULC | Put | 12.900 | 19,44 | 498 | 32,18 | |||
| 2026-02-13 | 13F | Prudential Financial Inc | 27.600 | 1.067 | ||||||
| 2026-04-24 | 13F | National Asset Management, Inc. | 120.876 | -0,01 | 5.047 | 8,21 | ||||
| 2026-02-13 | 13F | National Bank Of Canada /fi/ | 740.671 | -31,79 | 28.586 | -24,39 | ||||
| 2026-01-30 | 13F | Caldwell Securities, Inc | 93 | 0,00 | 4 | 0,00 | ||||
| 2026-04-20 | 13F | Assenagon Asset Management S.A. | 8.563 | 380 | ||||||
| 2026-02-13 | 13F | American Century Companies Inc | 1.388.998 | -29,87 | 53.601 | -22,37 | ||||
| 2026-04-17 | 13F | AdvisorNet Financial, Inc | 297 | -48,62 | 13 | -40,91 | ||||
| 2026-02-11 | 13F | LPL Financial LLC | 73.864 | -23,88 | 2.850 | -15,76 | ||||
| 2026-02-17 | 13F | Jones Financial Companies Lllp | 1.403 | 510,00 | 54 | 671,43 | ||||
| 2026-04-07 | 13F | CoreCap Advisors, LLC | 5.786 | 5.686,00 | 257 | 8.466,67 | ||||
| 2026-02-04 | 13F | First Eagle Investment Management, LLC | 6.173.289 | -1,20 | 238.382 | 9,48 | ||||
| 2026-04-17 | 13F | Webster Bank, N. A. | 154 | 7 | ||||||
| 2026-02-13 | 13F | Quarry LP | 11.475 | 443 | ||||||
| 2026-02-13 | 13F | S&t Bank/pa | 250 | 10 | ||||||
| 2026-02-17 | 13F | Brevan Howard Capital Management LP | 65.478 | 2.526 | ||||||
| 2026-02-02 | 13F | Montag A & Associates Inc | 295 | 0,00 | 11 | 10,00 | ||||
| 2026-02-13 | 13F | Towarzystwo Funduszy Inwestycyjnych Pzu Sa | 0 | -100,00 | 0 | |||||
| 2025-11-13 | 13F | Panagora Asset Management Inc | 0 | -100,00 | 0 | |||||
| 2026-02-06 | 13F | Evoke Wealth, Llc | 162.976 | 18,57 | 6.288 | 31,23 | ||||
| 2026-02-13 | 13F | Walleye Trading LLC | Put | 63.100 | 0,16 | 2.434 | 10,84 | |||
| 2026-02-05 | 13F | Gamco Investors, Inc. Et Al | 226.542 | -0,06 | 8.740 | 10,61 | ||||
| 2026-02-13 | 13F | Walleye Trading LLC | Call | 6.300 | -74,18 | 243 | -71,41 | |||
| 2026-02-13 | 13F | Walleye Trading LLC | 161.742 | 6.390,45 | 6.240 | 7.155,81 | ||||
| 2026-02-05 | 13F | Chase Investment Counsel Corp | 8.902 | 0 | ||||||
| 2026-02-17 | 13F | D. E. Shaw & Co., Inc. | Call | 0 | -100,00 | 0 | ||||
| 2026-04-24 | 13F | Private Advisor Group, LLC | 9.139 | -4,19 | 406 | 10,33 | ||||
| 2026-02-12 | 13F | Hohimer Wealth Management, Llc | 0 | -100,00 | 0 | |||||
| 2026-02-13 | 13F | National Bank Of Canada /fi/ | Call | 602 | -56,91 | 2.324 | -52,27 | |||
| 2026-02-17 | 13F | Voloridge Investment Management, Llc | 0 | -100,00 | 0 | |||||
| 2025-12-08 | 13F/A | Evelyn Partners Investment Management LLP | 0 | -100,00 | 0 | -100,00 | ||||
| 2026-02-10 | 13F | Armor Advisors, L.l.c. | 248.245 | 9.577 | ||||||
| 2026-02-13 | 13F | National Bank Of Canada /fi/ | Put | 92 | -27,56 | 355 | -19,68 | |||
| 2026-02-04 | 13F | Ameritas Advisory Services, LLC | 0 | -100,00 | 0 | |||||
| 2026-02-13 | 13F | Aigen Investment Management, Lp | 0 | -100,00 | 0 | |||||
| 2026-02-03 | 13F | Cheviot Value Management, LLC | 209.985 | 11,09 | 9.330 | 56,50 | ||||
| 2025-11-14 | 13F | Knightsbridge Asset Management, Llc | 8.183 | 0,07 | 285 | 31,34 | ||||
| 2026-04-15 | 13F | Hatch Cove Capital, Llc | 377.600 | -3,85 | 16.777 | 10,73 | ||||
| 2026-01-28 | 13F | Legacy Capital Group California, Inc. | 11.936 | 2,91 | 460 | 13,86 | ||||
| 2026-04-14 | 13F | Plancorp, LLC | 80.500 | 0,00 | 3.903 | 25,67 | ||||
| 2026-02-12 | 13F | Collier Financial | 33 | 0,00 | 1 | 0,00 | ||||
| 2026-02-10 | 13F | Bnp Paribas Arbitrage, Sa | 31.265 | 41,83 | 1.206 | 57,03 | ||||
| 2026-02-12 | 13F | SWAN Capital LLC | 200 | -16,67 | 8 | -12,50 | ||||
| 2026-01-05 | 13F | Catherine Avery Investment Management LLC | 1.902 | 0,00 | 73 | 10,61 | ||||
| 2026-02-11 | 13F | BLI - Banque de Luxembourg Investments | 690.000 | 29,94 | 26.733 | 44,25 | ||||
| 2026-04-28 | 13F | Lee Danner & Bass Inc | 260.000 | 1.200,00 | 11.552 | 1.398,18 | ||||
| 2026-02-17 | 13F | Royal Bank Of Canada | 7.750.888 | -18,08 | 299.030 | -9,34 | ||||
| 2026-02-09 | 13F | Geode Capital Management, Llc | 4.219.852 | 6,09 | 168.031 | 17,22 | ||||
| 2026-02-09 | 13F | Harbour Investments, Inc. | 796 | 0,38 | 31 | 11,11 | ||||
| 2026-02-10 | 13F | Mcrae Capital Management Inc | 22.900 | 0,00 | 883 | 10,65 | ||||
| 2026-02-13 | 13F | Great West Life Assurance Co /can/ | 220.600 | -14,67 | 9 | 0,00 | ||||
| 2026-02-09 | 13F | Williamson Legacy Group, LLC | 21.643 | -60,51 | 835 | -56,34 | ||||
| 2026-02-13 | 13F | Van Eck Associates Corp | 40.777.038 | -10,47 | 1.573 | -0,88 | ||||
| 2025-11-04 | 13F | Winnow Wealth Llc | 0 | -100,00 | 0 | |||||
| 2026-02-10 | 13F | Peapack Gladstone Financial Corp | 0 | -100,00 | 0 | |||||
| 2026-04-14 | 13F | Thurston, Springer, Miller, Herd & Titak, Inc. | 103 | 0,00 | 5 | 33,33 | ||||
| 2026-02-13 | 13F | Kestra Advisory Services, LLC | 4.415 | 170 | ||||||
| 2025-11-13 | 13F | Glenmede Investment Management, LP | 0 | -100,00 | 0 | |||||
| 2026-04-08 | 13F | Wealth Enhancement Advisory Services, Llc | 7.999 | -50,06 | 368 | -43,38 | ||||
| 2026-02-10 | 13F | Connor, Clark & Lunn Investment Management Ltd. | 881.112 | -39,62 | 34.024 | -33,10 | ||||
| 2026-01-12 | 13F | Robinson Value Management, Ltd. | 6.784 | 0,00 | 262 | 10,59 | ||||
| 2026-04-20 | 13F | Jfs Wealth Advisors, Llc | 153 | 0,00 | 7 | 20,00 | ||||
| 2026-02-12 | 13F | BlackRock, Inc. | 142.483 | 22,45 | 5.497 | 35,50 | ||||
| 2026-02-13 | 13F | MAI Capital Management | Call | 39 | 105,26 | |||||
| 2026-02-09 | 13F | Cypress Capital Management LLC (WY) | 68.710 | -0,09 | 2.651 | 10,55 | ||||
| 2026-02-09 | 13F | Huntington National Bank | 2 | 0,00 | 0 | |||||
| 2026-02-13 | 13F | JustInvest LLC | 31.840 | 19,49 | 1.228 | 32,33 | ||||
| 2026-01-22 | 13F | Harwood Advisory Group, LLC | 400 | 0,00 | 15 | 15,38 | ||||
| 2026-02-10 | 13F | Td Asset Management Inc | 1.880.194 | -12,20 | 72.698 | -2,63 | ||||
| 2026-02-17 | 13F | Ameriprise Financial Inc | 347.585 | 9,56 | 13.578 | 21,04 | ||||
| 2026-04-27 | 13F | Y-Intercept (Hong Kong) Ltd | 195.341 | 8.679 | ||||||
| 2026-02-13 | 13F | Caitong International Asset Management Co., Ltd | 78 | 3 | ||||||
| 2026-04-14 | 13F | Tradewinds Capital Management, LLC | 2 | 0,00 | 0 | |||||
| 2026-04-27 | 13F | Leonteq Securities AG | 21.628 | 95,59 | 961 | 125,35 | ||||
| 2026-01-22 | 13F | Cliftonlarsonallen Wealth Advisors, Llc | 0 | -100,00 | 0 | |||||
| 2025-11-13 | 13F | Jump Financial, LLC | 0 | -100,00 | 0 | |||||
| 2026-02-17 | 13F | Public Employees Retirement System Of Ohio | 69.559 | -0,08 | 2.686 | 10,63 | ||||
| 2026-02-17 | 13F | Price T Rowe Associates Inc /md/ | 3.073.897 | -18,93 | 119 | -10,61 | ||||
| 2026-02-12 | 13F | APG Asset Management N.V. | 217.955 | 0,16 | 7.175 | 11,14 | ||||
| 2026-02-17 | 13F | Silvercrest Asset Management Group Llc | 27.850 | 0,00 | 1.074 | 10,72 | ||||
| 2026-02-12 | 13F | Federation des caisses Desjardins du Quebec | 2.346.575 | 8,62 | 90.341 | 20,38 | ||||
| 2026-02-11 | 13F | Nikko Asset Management Americas, Inc. | 113.596 | -9,21 | 4.381 | 0,48 | ||||
| 2026-02-13 | 13F | Evelyn Partners Investment Management (Europe) Ltd | 3.300 | 0,00 | 127 | 10,43 | ||||
| 2026-02-13 | 13F | Barclays Plc | 63.740 | -59,76 | 2.459 | -55,46 | ||||
| 2026-02-13 | 13F | Brown Advisory Inc | 10.856 | -0,09 | 419 | 10,58 | ||||
| 2026-02-17 | 13F | Engineers Gate Manager LP | 19.282 | -52,36 | 744 | -47,27 | ||||
| 2026-02-13 | 13F | Resources Investment Advisors, LLC. | 112.258 | -5,45 | 4.331 | 4,64 | ||||
| 2026-02-11 | 13F | Erste Asset Management GmbH | 44.100 | 1.714 | ||||||
| 2025-10-31 | 13F | GHP Investment Advisors, Inc. | 0 | -100,00 | 0 | -100,00 | ||||
| 2026-02-17 | 13F | Old West Investment Management, LLC | 483.702 | 2,70 | 18.661 | 13,66 | ||||
| 2026-02-13 | 13F | Segall Bryant & Hamill, Llc | 1.030.392 | -16,22 | 39.753 | -7,28 | ||||
| 2025-11-13 | 13F | Spark Investment Management LLC | 0 | -100,00 | 0 | -100,00 | ||||
| 2026-04-28 | 13F | Altfest L J & Co Inc | 6.598 | 0,00 | 293 | 15,35 | ||||
| 2026-02-17 | 13F | First Manhattan Co | 158.476 | -7,53 | 6.128 | 2,56 | ||||
| 2026-04-24 | 13F | USS Investment Management Ltd | 99.031 | 4,29 | 4.408 | 19,85 | ||||
| 2026-02-12 | 13F | Campbell & CO Investment Adviser LLC | 18.246 | -87,09 | 704 | -85,73 | ||||
| 2026-02-17 | 13F | Utah Retirement Systems | 46.780 | 0,00 | 1.809 | 10,92 | ||||
| 2026-01-21 | 13F | Newbridge Financial Services Group, Inc. | 265 | 0,00 | 10 | 11,11 | ||||
| 2026-02-17 | 13F | Raymond James Financial Inc | 1.085.145 | -10,98 | 41.865 | -1,48 | ||||
| 2026-04-24 | 13F | Key FInancial Inc | 30 | 0,00 | 1 | 0,00 | ||||
| 2026-02-10 | 13F | David R. Rahn & Associates Inc. | 5.338 | 206 | ||||||
| 2026-02-17 | 13F | Gotham Asset Management, LLC | 122.225 | 20,02 | 4.715 | 32,85 | ||||
| 2026-02-12 | 13F | Scotia Capital Inc. | 75.540 | 312,92 | 2.912 | 358,58 | ||||
| 2026-02-13 | 13F | Victory Capital Management Inc | 94.403 | 3.642 | ||||||
| 2026-04-08 | 13F | Evanson Asset Management, LLC | 13.200 | 0,00 | 586 | 15,13 | ||||
| 2026-02-13 | 13F | Citigroup Inc | 143.760 | -14,35 | 5.558 | -5,01 | ||||
| 2026-02-13 | 13F | Tower Bridge Advisors | 10.000 | 0,00 | 386 | 10,63 | ||||
| 2026-02-11 | 13F | Twin Tree Management, LP | Put | 37.200 | 1.435 | |||||
| 2026-02-11 | 13F | Twin Tree Management, LP | 113.746 | 269,85 | 4.388 | 309,33 | ||||
| 2026-04-22 | 13F | Canoe Financial LP | 115.784 | -35,72 | 5.149 | -25,97 | ||||
| 2026-02-02 | 13F | Danske Bank A/s | 11.553 | -16,38 | 447 | -6,11 | ||||
| 2026-01-15 | 13F | Mn Services Vermogensbeheer B.V. | 66.800 | -12,68 | 3 | 0,00 | ||||
| 2025-11-21 | 13F/A | Royal Bank Of Canada | Call | 0 | -100,00 | 0 | -100,00 | |||
| 2026-02-10 | 13F | Oppenheimer & Close, LLC | 143.105 | -16,30 | 5.534 | -7,18 | ||||
| 2026-02-17 | 13F | Medici Capital Llc | 208.000 | 0,00 | 8.043 | 10,91 | ||||
| 2026-04-08 | 13F | E Fund Management (Hong Kong) Co., Ltd. | 15.317 | -40,71 | 681 | -47,62 | ||||
| 2026-02-12 | 13F | Renaissance Technologies Llc | 5.025.944 | -17,91 | 193.901 | -9,15 | ||||
| 2026-02-17 | 13F | Blair William & Co/il | 5.651 | -56,14 | 218 | -51,67 | ||||
| 2026-01-23 | 13F | Assetmark, Inc | 91 | 0,00 | 4 | 0,00 | ||||
| 2026-02-17 | 13F | Capstone Investment Advisors, Llc | 5.463 | -47,68 | 211 | -42,15 | ||||
| 2026-02-13 | 13F | Hurley Capital, LLC | Call | 7 | 4 | |||||
| 2026-02-13 | 13F | Natixis | 6.496 | -0,47 | 251 | 11,61 | ||||
| 2026-02-13 | 13F | Evelyn Partners Investment Management Services Ltd | 3.623 | 0,00 | 140 | 10,32 | ||||
| 2025-11-14 | 13F | Coppell Advisory Solutions LLC | 0 | -100,00 | 0 | -100,00 | ||||
| 2026-01-29 | 13F | Ashton Thomas Private Wealth, LLC | 0 | -100,00 | 0 | |||||
| 2026-02-03 | 13F | Navellier & Associates Inc | 289.224 | 2,48 | 11.158 | 13,42 | ||||
| 2026-02-13 | 13F | Beutel, Goodman & Co Ltd. | 2.058.525 | -8,68 | 80 | 1,28 | ||||
| 2025-11-14 | 13F | Driehaus Capital Management Llc | 0 | -100,00 | 0 | -100,00 | ||||
| 2026-02-13 | 13F | FORA Capital, LLC | 0 | -100,00 | 0 | |||||
| 2025-12-09 | 13F/A | Tudor Investment Corp Et Al | Put | 5.900 | -75,72 | 206 | -68,22 | |||
| 2026-02-10 | 13F | Greenwich Wealth Management LLC | 0 | -100,00 | 0 | |||||
| 2026-02-17 | 13F | Caption Management, LLC | 0 | -100,00 | 0 | |||||
| 2026-02-17 | 13F | SageView Advisory Group, LLC | 1.635 | 63 | ||||||
| 2026-02-10 | 13F | Scheer, Rowlett & Associates Investment Management Ltd. | 436.945 | 16.873 | ||||||
| 2026-02-17 | 13F | Optiver Holding B.V. | 0 | -100,00 | 0 | |||||
| 2026-02-10 | 13F | Nomura Asset Management Co Ltd | 0 | 0 | ||||||
| 2026-02-02 | 13F | Principal Financial Group Inc | 817.920 | -19,55 | 31.625 | -10,78 | ||||
| 2026-02-17 | 13F | Susquehanna Fundamental Investments, Llc | 102.060 | 0,14 | 3.937 | 10,84 | ||||
| 2026-02-13 | 13F | Carmignac Gestion | 329.968 | 52,36 | 12.730 | 68,63 | ||||
| 2026-02-13 | 13F | Motiv8 Investments LLC | 100 | 0 | ||||||
| 2026-02-13 | 13F | Gen-Wealth Partners Inc | 2.533 | 54,92 | 98 | 73,21 | ||||
| 2026-02-02 | 13F | Nkcfo Llc | 344.300 | 0,00 | 13 | 8,33 | ||||
| 2026-01-23 | 13F | Sumitomo Mitsui Trust Holdings, Inc. | 115.110 | -9,10 | 4.441 | 0,59 | ||||
| 2026-02-17 | 13F | FIL Ltd | 1.714.636 | 17,28 | 66.209 | 29,92 | ||||
| 2026-02-17 | 13F | Schonfeld Strategic Advisors LLC | 0 | -100,00 | 0 | |||||
| 2026-04-15 | 13F | McAlvany Wealth Management LLC | 106.493 | 18,38 | 4.446 | 28,13 | ||||
| 2026-04-29 | 13F/A | Salem Investment Counselors Inc | 4.310 | 191 | ||||||
| 2026-02-18 | 13F | State of Tennessee, Treasury Department | 0 | -100,00 | 0 | -100,00 | ||||
| 2026-04-15 | 13F | Merit Financial Group, LLC | 7.373 | 0,49 | 328 | 15,55 | ||||
| 2026-04-20 | 13F | Ronald Blue Trust, Inc. | 14.992 | 0,11 | 666 | 15,42 | ||||
| 2026-01-28 | 13F | U S Global Investors Inc | 35.000 | -86,00 | 1.350 | -84,51 | ||||
| 2026-04-28 | 13F | Quent Capital, LLC | 500 | 22 | ||||||
| 2026-02-13 | 13F | Colony Group, LLC | 498.205 | -0,49 | 19.221 | 10,13 | ||||
| 2026-02-10 | 13F/A | Northwestern Mutual Wealth Management Co | 8.892 | -3,68 | 343 | 6,85 | ||||
| 2026-03-12 | 13F/A | Peak6 Llc | Call | 107.000 | -66,54 | 4.128 | -62,97 | |||
| 2026-04-21 | 13F | Mesirow Financial Investment Management, Inc. | 6.874 | -24,04 | 305 | -12,61 | ||||
| 2026-01-28 | 13F | DekaBank Deutsche Girozentrale | 61.800 | 0,00 | 1 | -50,00 | ||||
| 2026-03-12 | 13F/A | Peak6 Llc | 287.197 | 11.080 | ||||||
| 2026-03-12 | 13F/A | Peak6 Llc | Put | 9.200 | -61,83 | 355 | -57,86 | |||
| 2026-02-13 | 13F | Morgan Stanley | 2.548.632 | -18,19 | 98.326 | -9,46 | ||||
| 2026-02-17 | 13F | Soapstone Management L.p. | 695.285 | 123,79 | 26.824 | 147,68 | ||||
| 2026-04-09 | 13F | Veracity Capital LLC | 10.378 | -0,77 | 461 | 14,39 | ||||
| 2026-02-13 | 13F | Gts Securities Llc | 0 | -100,00 | 0 | |||||
| 2026-02-17 | 13F | PenderFund Capital Management Ltd. | 10.000 | 0,00 | 386 | 10,92 | ||||
| 2026-04-28 | 13F | Alberta Investment Management Corp | 112.605 | 5.011 | ||||||
| 2026-02-13 | 13F | Charles Schwab Investment Management Inc | 983.332 | 0,68 | 38.020 | 11,66 | ||||
| 2026-02-13 | 13F | Arrowstreet Capital, Limited Partnership | 9.095.054 | 11,86 | 351.072 | 23,89 | ||||
| 2025-11-07 | 13F | Shell Asset Management Co | 13.900 | -51,23 | 0 | |||||
| 2026-04-15 | 13F | Cypress Wealth Services, LLC | 22.136 | 0,00 | 984 | 15,11 | ||||
| 2026-02-17 | 13F | Qube Research & Technologies Ltd | 784.831 | 30,07 | 30.279 | 43,95 | ||||
| 2026-02-13 | 13F | Dynamic Technology Lab Private Ltd | 31.576 | 1.218 | ||||||
| 2026-02-13 | 13F | Goehring & Rozencwajg Associates, LLC | 780.651 | -33,47 | 30.118 | -26,37 | ||||
| 2026-02-17 | 13F | Balyasny Asset Management Llc | 9.070 | 350 | ||||||
| 2026-02-06 | 13F/A | Rathbone Brothers plc | 41.229 | -7,41 | 1.593 | 2,58 | ||||
| 2026-02-02 | 13F | VELA Investment Management, LLC | 116.144 | -24,08 | 4.481 | -15,99 | ||||
| 2026-02-10 | 13F | Natixis Advisors, L.p. | 0 | -100,00 | 0 | |||||
| 2026-02-11 | 13F | Investors Towarzystwo Funduszy Inwestycyjnych Spolka Akcyjna | 18.178 | 703 | ||||||
| 2026-02-04 | 13F | BCJ Capital Management, LLC | 0 | -100,00 | 0 | |||||
| 2026-02-10 | 13F | Private Wealth Asset Management, LLC | 20 | 0,00 | 1 | |||||
| 2026-02-17 | 13F | Fwl Investment Management, Llc | 32.641 | -26,62 | 1.259 | -18,77 | ||||
| 2026-02-17 | 13F | Millennium Management Llc | 300.824 | -37,10 | 11.606 | -30,39 | ||||
| 2026-02-12 | 13F | BRYN MAWR TRUST Co | 200 | 0,00 | 8 | 16,67 | ||||
| 2026-02-17 | 13F | Millennium Management Llc | Call | 22.300 | -59,31 | 860 | -54,97 | |||
| 2026-04-22 | 13F | HMS Capital Management, LLC | 25.978 | 4,67 | 1.154 | 20,59 | ||||
| 2026-04-29 | 13F | Police & Firemen's Retirement System of New Jersey | 56.199 | 0,00 | 2.492 | 14,73 | ||||
| 2026-02-12 | 13F | CIBC Private Wealth Group, LLC | 3.924 | -17,93 | 151 | -9,04 | ||||
| 2026-02-17 | 13F | Lazard Asset Management Llc | 0 | -100,00 | 0 | |||||
| 2026-04-17 | 13F | Vermillion Wealth Management, Inc. | 196 | -21,60 | 9 | -11,11 | ||||
| 2026-02-11 | 13F | Capital Analysts, Inc. | 991 | 0,00 | 0 | |||||
| 2026-01-14 | 13F | ORG Partners LLC | 301 | 363,08 | 12 | 450,00 | ||||
| 2026-02-13 | 13F | Neuberger Berman Group LLC | 103.118 | -31,31 | 3.981 | -23,93 | ||||
| 2026-02-17 | 13F | Tower Research Capital LLC (TRC) | 7.938 | 306 | ||||||
| 2026-02-17 | 13F | Prelude Capital Management, Llc | 11.970 | -40,36 | 462 | -33,91 | ||||
| 2026-02-17 | 13F | Fullerton Fund Management Co Ltd | 1.631.508 | 13,12 | 62.944 | 25,20 | ||||
| 2026-04-27 | 13F | La Banque Postale Asset Management SA | 77.302 | 35,71 | 3.435 | 56,30 | ||||
| 2026-02-12 | 13F | Andra AP-fonden | 22.140 | 1.173 | ||||||
| 2026-02-17 | 13F | MIRAE ASSET GLOBAL ETFS HOLDINGS Ltd. | 142.957 | 58,37 | 5.527 | 75,63 | ||||
| 2025-11-13 | 13F | PCJ Investment Counsel Ltd. | 0 | -100,00 | 0 | |||||
| 2026-04-29 | 13F | Cary Street Partners Financial Llc | 25.695 | 3,90 | 1.142 | 19,60 | ||||
| 2026-04-15 | 13F | Steadtrust LLC | 71.730 | -6,88 | 3.187 | 7,24 | ||||
| 2026-01-21 | 13F | Modera Wealth Management, LLC | 6.528 | 0,35 | 252 | 11,06 | ||||
| 2026-01-21 | 13F/A | Euro Pacific Asset Management, LLC | 14.219 | 26,83 | 1 | |||||
| 2026-02-17 | 13F | Manatuck Hill Partners, LLC | 70.000 | -22,22 | 2.701 | -13,93 | ||||
| 2026-02-13 | 13F | Wexford Capital Lp | 8.426 | 12,32 | 325 | 24,52 | ||||
| 2026-02-10 | 13F | Norges Bank | 5.683.697 | 219.475 | ||||||
| 2026-02-13 | 13F | SRS Capital Advisors, Inc. | 116 | 0,87 | 4 | 0,00 | ||||
| 2026-04-22 | 13F | Coston, McIsaac & Partners | 554 | 0,00 | 0 | |||||
| 2026-02-13 | 13F | 1832 Asset Management L.P. | 3.775.219 | 4,06 | 145.648 | 15,16 | ||||
| 2026-04-09 | 13F | Wealth Alliance Advisory Group, LLC | 5.650 | 0,00 | 251 | 15,67 | ||||
| 2025-11-14 | 13F | Royal Bank Of Canada | Put | 0 | -100,00 | 0 | -100,00 | |||
| 2026-01-23 | 13F | Westside Investment Management, Inc. | 166 | 0,00 | 6 | 20,00 | ||||
| 2026-01-29 | 13F | IMC-Chicago, LLC | 231.130 | 142,85 | 8.917 | 168,80 | ||||
| 2026-04-07 | 13F | Signaturefd, Llc | 1.037 | 314,80 | 46 | 411,11 | ||||
| 2026-01-29 | 13F | IMC-Chicago, LLC | Put | 249.900 | 35,82 | 9.641 | 50,31 | |||
| 2026-02-13 | 13F | Aviso Financial Inc. | 859 | 33 | ||||||
| 2026-01-29 | 13F | IMC-Chicago, LLC | Call | 250.900 | -3,61 | 9.680 | 6,67 | |||
| 2026-01-20 | 13F | Cigna Investments Inc /new | 7.579 | 0,00 | 0 | |||||
| 2026-02-13 | 13F | Mml Investors Services, Llc | 5.593 | 216 | ||||||
| 2026-01-27 | 13F | Evergreen Capital Management Llc | 108.610 | -0,67 | 4.190 | 9,94 | ||||
| 2026-02-13 | 13F | Bank Of Nova Scotia | 603.631 | -0,82 | 23.308 | 9,85 | ||||
| 2026-02-17 | 13F | Weiss Asset Management LP | 69.240 | 2.671 | ||||||
| 2026-04-28 | 13F | Kingswood Wealth Advisors, Llc | 5.320 | 0,00 | 236 | 15,12 | ||||
| 2026-04-10 | 13F | Charles Schwab Trust Co | 6.135 | 273 | ||||||
| 2026-04-15 | 13F | Bayforest Capital Ltd | 458 | -59,72 | 20 | -53,49 | ||||
| 2026-02-13 | 13F | BNP Paribas Asset Management Holding S.A. | 259.149 | 14 | ||||||
| 2026-02-12 | 13F | Jane Street Group, Llc | Call | 235.000 | 24,73 | 9.066 | 38,05 | |||
| 2026-02-12 | 13F | Jane Street Group, Llc | 735.858 | 40,50 | 28.389 | 55,50 | ||||
| 2026-02-12 | 13F | Robotti Robert | 23.000 | -11,54 | 887 | -2,10 | ||||
| 2026-04-22 | 13F | Quattro Financial Advisors Llc | 59.865 | -40,57 | 2.660 | -31,57 | ||||
| 2026-02-12 | 13F | Jane Street Group, Llc | Put | 276.200 | -13,20 | 10.656 | -3,94 | |||
| 2026-02-12 | 13F | Nuveen, LLC | 444.899 | 0,38 | 17.202 | 11,33 | ||||
| 2026-02-13 | 13F | Flow Traders U.s. Llc | 0 | -100,00 | 0 | |||||
| 2026-04-24 | 13F | Keybank National Association/oh | 13.578 | 41,79 | 603 | 63,41 | ||||
| 2026-02-12 | 13F | Commonwealth Equity Services, Llc | 58.028 | -2,89 | 2.239 | 111.800,00 | ||||
| 2026-02-18 | 13F | Caitlin John, LLC | 350 | -43,09 | 14 | -38,10 | ||||
| 2026-02-13 | 13F | Korea Investment CORP | 304.216 | -34,61 | 11.763 | -27,48 | ||||
| 2026-02-10 | 13F | CIBC World Markets Inc. | 396.757 | 61,34 | 15.323 | 78,81 | ||||
| 2026-04-09 | 13F | Towarzystwo Funduszy Inwestycyjnych Allianz Polska S.A. | 56.700 | -7,95 | 2.517 | 4,40 | ||||
| 2026-02-10 | 13F | CIBC World Markets Inc. | Call | 63.800 | -14,02 | 2.464 | -4,72 | |||
| 2026-02-13 | 13F | Ubs Asset Management Americas Inc | 212.400 | -26,31 | 8.194 | -18,44 | ||||
| 2026-02-17 | 13F | Guggenheim Capital Llc | 220.878 | -17,78 | 8.521 | -9,00 | ||||
| 2026-02-17 | 13F | Hilltop Holdings Inc. | 9.583 | -13,53 | 370 | -4,40 | ||||
| 2026-02-17 | 13F | Toronto Dominion Bank | Put | 3.500 | -71,54 | 135 | -68,46 | |||
| 2026-02-13 | 13F | Lord, Abbett & Co. Llc | 180.561 | -20,65 | 7 | -14,29 | ||||
| 2026-02-17 | 13F | Toronto Dominion Bank | Call | 77.000 | 1.981,08 | 2.973 | 2.222,66 | |||
| 2026-04-16 | 13F | XML Financial, LLC | 6.500 | 289 | ||||||
| 2026-02-17 | 13F | Susquehanna International Group, Llp | Call | 1.474.500 | 28,92 | 56.886 | 42,68 | |||
| 2026-04-28 | 13F | SeaBridge Investment Advisors LLC | 20.165 | -8,40 | 896 | 5,42 | ||||
| 2026-01-27 | 13F | Zurcher Kantonalbank (Zurich Cantonalbank) | 246.840 | 3,24 | 9.544 | 14,51 | ||||
| 2026-02-17 | 13F | Susquehanna International Group, Llp | 219.902 | 386,33 | 8.484 | 438,26 | ||||
| 2026-02-17 | 13F | Toronto Dominion Bank | 348.258 | 50,97 | 13.448 | 67,28 | ||||
| 2026-02-17 | 13F | Susquehanna International Group, Llp | Put | 270.300 | 25,02 | 10.428 | 38,38 | |||
| 2026-02-05 | 13F | 1620 Investment Advisors, Inc. | 750 | -25,00 | 29 | -17,65 | ||||
| 2026-02-17 | 13F | Caption Management, LLC | Put | 700 | -22,22 | 27 | -12,90 | |||
| 2026-02-17 | 13F | Caption Management, LLC | Call | 168.600 | 1,32 | 6.505 | 12,14 | |||
| 2026-04-01 | 13F | Confluence Investment Management Llc | 35.226 | 1,59 | 1.565 | 17,05 | ||||
| 2026-04-20 | 13F | Longview Financial Advisors, Inc. | 139 | 6 | ||||||
| 2026-04-07 | 13F | Eastern Bank | 2.876 | -41,86 | 128 | -33,16 | ||||
| 2026-04-24 | 13F | Root Financial Partners, LLC | 11 | 0 | ||||||
| 2026-04-24 | 13F | Ninety One UK Ltd | 2.237.701 | -1,80 | 99.238 | 12,63 | ||||
| 2026-02-18 | 13F | GWM Advisors LLC | 57.040 | -11,97 | 2.201 | -2,57 | ||||
| 2026-01-28 | 13F | Arizona State Retirement System | 0 | -100,00 | 0 | |||||
| 2026-01-22 | 13F | Accordant Advisory Group Inc | 114.001 | 0,19 | 4.398 | 10,89 | ||||
| 2026-01-30 | 13F | Pure Portfolios Holdings Llc | 16.819 | -13,96 | 649 | -4,85 | ||||
| 2026-02-11 | 13F | Franklin Resources Inc | 3.264.434 | 2,38 | 125.986 | 13,34 | ||||
| 2026-02-13 | 13F | Toroso Investments, LLC | 47.466 | 0,95 | 1.831 | 11,71 | ||||
| 2026-02-06 | 13F | HighTower Advisors, LLC | 84.694 | 2,40 | 3.268 | 13,28 | ||||
| 2026-02-02 | 13F | Hussman Strategic Advisors, Inc. | 61.000 | 19,61 | 2.353 | 32,41 | ||||
| 2026-04-15 | 13F | Nations Financial Group Inc, /ia/ /adv | 7.263 | -3,88 | 323 | 10,65 | ||||
| 2026-04-21 | 13F | Financial Consulate, Inc | 26 | 1 | ||||||
| 2025-11-14 | 13F | Wolverine Trading, Llc | Put | 138.800 | 4.808 | |||||
| 2026-02-12 | 13F | Integrated Quantitative Investments LLC | 28.920 | 1.116 | ||||||
| 2026-02-11 | 13F | Group One Trading, L.p. | Call | 267.600 | 8,56 | 10.324 | 20,16 | |||
| 2026-02-11 | 13F | Group One Trading, L.p. | Put | 84.000 | 92,22 | 3.241 | 112,74 | |||
| 2025-11-13 | 13F | Wealth High Governance Capital Ltda | 0 | -100,00 | 0 | -100,00 | ||||
| 2026-02-17 | 13F | Keebeck Alpha, LP | 5.949 | -40,86 | 230 | -34,57 | ||||
| 2026-02-11 | 13F | Group One Trading, L.p. | 75.689 | -35,03 | 2.920 | -28,08 | ||||
| 2026-02-17 | 13F | Amundi | 3.213.738 | 8,41 | 123.986 | 20,39 | ||||
| 2025-11-14 | 13F | Wolverine Trading, Llc | Call | 202.100 | 7.001 | |||||
| 2026-02-11 | 13F | 111 Capital | 0 | -100,00 | 0 | -100,00 | ||||
| 2026-02-12 | 13F | Alps Advisors Inc | 95.744 | 3,58 | 3.694 | 14,62 | ||||
| 2026-02-10 | 13F | CIBC Asset Management Inc | 8.716.153 | 6,28 | 338.372 | 17,80 | ||||
| 2026-02-12 | 13F | Rossby Financial, LCC | 10.932 | 8,16 | 422 | 18,93 | ||||
| 2026-02-10 | 13F | Bank of New York Mellon Corp | 1.809.382 | 74,18 | 69.806 | 92,76 | ||||
| 2026-02-27 | 13F | Groupama Asset Managment | 454.387 | 43,40 | 17.530 | 58,70 | ||||
| 2026-01-22 | 13F | Massachusetts Financial Services Co /ma/ | 1.876.882 | 72.410 | ||||||
| 2026-02-13 | 13F | Royal London Asset Management Ltd | 19.534 | 7,06 | 754 | 18,40 | ||||
| 2026-04-15 | 13F | Generali Investments CEE, investicni spolecnost, a.s. | 14.836 | 0,00 | 659 | 15,21 | ||||
| 2026-04-21 | 13F | Vise Technologies, Inc. | 9.186 | 0,00 | 354 | 0,00 | ||||
| 2026-02-09 | 13F | Legal & General Group Plc | 2.769.787 | 6,74 | 107.093 | 18,38 | ||||
| 2026-02-18 | 13F | Mackenzie Financial Corp | 7.502.887 | -21,42 | 292.812 | -12,00 | ||||
| 2026-02-04 | 13F | Swiss Life Asset Management Ltd | 29.055 | 2,97 | 1.122 | 13,81 | ||||
| 2026-02-10 | 13F | Eurizon Capital SGR S.p.A. | 65.149 | 2.537 | ||||||
| 2026-02-12 | 13F | Mark Sheptoff Financial Planning, Llc | 0 | -100,00 | 0 | -100,00 | ||||
| 2026-04-23 | 13F | Klein Pavlis & Peasley Financial, Inc. | 97.661 | -9,22 | 4.339 | 4,55 | ||||
| 2026-01-15 | 13F | Hara Capital LLC | 1.760 | 0,00 | 68 | 9,84 | ||||
| 2026-04-20 | 13F | Cardinal Point Capital Management, ULC | 60.000 | -0,15 | 2.664 | 14,68 | ||||
| 2026-02-17 | 13F | NorthRock Partners, LLC | 5.900 | 0,00 | 228 | 10,73 | ||||
| 2026-02-04 | 13F | Dogwood Wealth Management LLC | 0 | -100,00 | 0 | |||||
| 2026-02-12 | 13F | Bank Of Montreal /can/ | 6.319.190 | -8,00 | 244.016 | 1,94 | ||||
| 2026-01-29 | 13F | UBS Group AG | 1.035.624 | -47,73 | 39.954 | -42,16 | ||||
| 2026-02-11 | 13F | Deutsche Bank Ag\ | 1.072.231 | 32,60 | 41.367 | 46,75 | ||||
| 2026-04-22 | 13F | Advocate Investing Services LLC | 31 | 0,00 | 1 | 0,00 | ||||
| 2026-02-13 | 13F | Dixon Mitchell Investment Counsel Inc. | 125 | 5 | ||||||
| 2026-04-21 | 13F | Stapp Wealth Management, Pllc | 16.844 | 0,00 | 748 | 15,25 | ||||
| 2025-11-12 | 13F | Catalyst Funds Management Pty Ltd | 0 | -100,00 | 0 | |||||
| 2026-04-08 | 13F | Wealth Enhancement Trust Services, Inc. | 1.000 | 0,00 | 44 | 15,79 | ||||
| 2026-02-03 | 13F | Chesapeake Capital Corp /il/ | 17.560 | 0,00 | 677 | 10,62 | ||||
| 2026-02-12 | 13F | Groupe la Francaise | 350.000 | 1,43 | 13.511 | 12,23 | ||||
| 2026-02-12 | 13F | Skandinaviska Enskilda Banken AB (publ) | 0 | -100,00 | 0 | |||||
| 2026-02-17 | 13F | Parvin Asset Management, LLC | 34.765 | 0,51 | 1.341 | 11,29 | ||||
| 2026-04-28 | 13F | Nbt Bank N A /ny | 11.690 | 0,00 | 519 | 15,08 | ||||
| 2025-11-14 | 13F | Cubist Systematic Strategies, LLC | Put | 87.300 | -34,26 | 3.043 | -13,72 | |||
| 2025-11-14 | 13F | Cubist Systematic Strategies, LLC | Call | 43.200 | -63,64 | 1.506 | -52,30 | |||
| 2025-11-24 | 13F/A | Laurel Wealth Advisors LLC | 0 | -100,00 | 0 | -100,00 | ||||
| 2026-04-23 | 13F | SJS Investment Consulting Inc. | 9 | 0,00 | 0 | |||||
| 2026-02-09 | 13F | Royce & Associates Lp | 1.224.091 | -3,92 | 47.267 | 6,43 | ||||
| 2026-04-29 | 13F | Skopos Labs, Inc. | 29.563 | 68.651,16 | 1.313 | 131.200,00 | ||||
| 2026-01-30 | 13F | Sigma Planning Corp | 11.795 | 4,96 | 234 | -40,41 | ||||
| 2026-02-12 | 13F | Brinker Capital Investments, LLC | 8.453 | 44,05 | 326 | 59,80 | ||||
| 2026-02-17 | 13F | Man Group plc | 612.845 | 2,86 | 23.644 | 13,84 | ||||
| 2026-01-28 | 13F | Geneos Wealth Management Inc. | 100 | 0,00 | 4 | 0,00 | ||||
| 2026-02-17 | 13F | Caisse De Depot Et Placement Du Quebec | 288.054 | -83,29 | 11.138 | -81,46 | ||||
| 2026-02-17 | 13F | Canada Pension Plan Investment Board | 2.619.825 | 26,79 | 101.165 | 40,49 | ||||
| 2025-11-14 | 13F | LMR Partners LLP | 0 | -100,00 | 0 | -100,00 | ||||
| 2026-02-09 | 13F | Themes Management Co LLC | 31.488 | 1.216 | ||||||
| 2026-02-10 | 13F | Hazlett, Burt & Watson, Inc. | 300 | 0 | ||||||
| 2026-02-12 | 13F | Verbena Value LP | 638.000 | 24.614 | ||||||
| 2026-02-11 | 13F | Metis Global Partners, LLC | 18.614 | -13,90 | 719 | -4,65 | ||||
| 2026-02-06 | 13F | Global Retirement Partners, LLC | 332 | 13 | ||||||
| 2026-02-13 | 13F | Allianz Se | 82.430 | 49,59 | 3.187 | 65,90 | ||||
| 2026-02-17 | 13F | Creative Planning | 28.795 | 0,44 | 1.111 | 11,11 | ||||
| 2026-02-17 | 13F | Investment Management Corp of Ontario | 51.538 | 230,58 | 1.988 | 266,11 | ||||
| 2026-02-17 | 13F | Janus Henderson Group Plc | 498.551 | -44,80 | 19.241 | -38,89 | ||||
| 2026-04-29 | 13F | Cary Street Partner Investment Advisory Llc | 392 | 9,80 | 17 | 30,77 | ||||
| 2025-11-06 | 13F | Versor Investments LP | 0 | -100,00 | 0 | |||||
| 2026-02-17 | 13F | Advisory Services Network, LLC | 6.685 | 11,21 | 258 | 22,97 | ||||
| 2026-04-09 | 13F | Moody National Bank Trust Division | 20.379 | -58,02 | 905 | -51,68 | ||||
| 2026-02-11 | 13F | O'shaughnessy Asset Management, Llc | 11.760 | 1,99 | 454 | 12,97 | ||||
| 2026-02-12 | 13F | Pembroke Management, LTD | 18.012 | 0,00 | 695 | 10,69 | ||||
| 2026-02-17 | 13F | Nokomis Capital, L.L.C. | 48.405 | 0,00 | 1.867 | 10,67 | ||||
| 2026-04-28 | 13F | SBI Securities Co., Ltd. | 5.369 | -86,49 | 239 | -84,47 | ||||
| 2026-04-28 | 13F | Split Rock Private Trading & Wealth Management, LLC | 6.990 | 0,00 | 311 | 15,24 | ||||
| 2026-02-13 | 13F | Merk Investments LLC | 450.000 | -40,00 | 17.361 | -33,60 | ||||
| 2026-02-06 | 13F | Harvest Portfolios Group Inc. | 49.287 | 14,59 | 1.903 | 26,95 | ||||
| 2026-02-19 | 13F | Invesco Ltd. | 2.159.537 | -27,58 | 83.315 | -19,85 | ||||
| 2026-01-29 | 13F | D.a. Davidson & Co. | 0 | -100,00 | 0 | |||||
| 2026-02-13 | 13F | Squarepoint Ops LLC | Call | 15.200 | -12,14 | 586 | -2,82 | |||
| 2026-02-13 | 13F | Squarepoint Ops LLC | Put | 51.600 | -51,27 | 1.991 | -46,09 | |||
| 2026-02-17 | 13F | Parallax Volatility Advisers, L.P. | 0 | -100,00 | 0 | |||||
| 2026-01-07 | 13F | Aventura Private Wealth, LLC | 100 | 4 | ||||||
| 2026-02-13 | 13F | Wells Fargo & Company/mn | 206.383 | -28,42 | 7.974 | -20,65 | ||||
| 2026-02-17 | 13F | Northern Trust Corp | 20.946 | 808 | ||||||
| 2026-04-15 | 13F | FNY Investment Advisers, LLC | 0 | -100,00 | 0 | |||||
| 2026-04-20 | 13F | Kercheville Advisors, LLC | 77.124 | -9,59 | 3.421 | -4,87 | ||||
| 2026-02-17 | 13F | Susquehanna Portfolio Strategies, LLC | 5.914 | 0,14 | 228 | 11,22 | ||||
| 2025-11-14 | 13F | Millennium Management Llc | Put | 0 | -100,00 | 0 | -100,00 | |||
| 2026-02-17 | 13F | Agf Management Ltd | 899.091 | 190,03 | 34.718 | 221,30 | ||||
| 2026-04-16 | 13F | Ballast Rock Private Wealth LLC | 8.008 | 0,00 | 356 | 15,26 | ||||
| 2025-11-12 | 13F | RiverGlades Family Offices LLC | 12.500 | 0,00 | 436 | 31,02 | ||||
| 2026-04-13 | 13F | E Fund Management Co., Ltd. | 15.317 | 681 | ||||||
| 2026-01-29 | 13F | Riggs Asset Managment Co. Inc. | 46.810 | 1,39 | 1.806 | 12,18 | ||||
| 2026-04-13 | 13F | Creative Financial Designs Inc /adv | 7 | 0,00 | 0 | |||||
| 2026-04-20 | 13F | Columbia Asset Management | 8.695 | 0,00 | 386 | 15,22 | ||||
| 2026-02-17 | 13F | Blue Line Capital, LLC / IL | 5.743 | 222 | ||||||
| 2026-01-21 | 13F | Petra Financial Advisors Inc | 22.635 | 1,91 | 873 | 12,79 | ||||
| 2026-02-12 | 13F | Hollencrest Capital Management | 10.000 | -20,63 | 386 | -12,30 | ||||
| 2026-02-17 | 13F | Point72 Asset Management, L.P. | Call | 85.900 | 504,93 | 3.314 | 569,49 | |||
| 2025-11-14 | 13F | Twinbeech Capital Lp | 0 | -100,00 | 0 | |||||
| 2026-02-11 | 13F | Winton Capital Group Ltd | 7.800 | 301 | ||||||
| 2026-04-28 | 13F | K.J. Harrison & Partners Inc | 9.778 | 434 | ||||||
| 2026-02-13 | 13F | Bridgewater Associates, LP | 281.285 | 555,91 | 10.852 | 626,31 | ||||
| 2026-02-17 | 13F | Point72 Asset Management, L.P. | Put | 120.700 | 4.657 | |||||
| 2026-02-17 | 13F | Cetera Investment Advisers | 20.153 | -7,83 | 779 | 2,23 | ||||
| 2026-02-11 | 13F | Allianz Asset Management GmbH | 95.730 | -51,50 | 3.701 | -46,21 | ||||
| 2026-02-13 | 13F | Cutler Capital Management, LLC | 11.422 | -1,38 | 441 | 9,18 | ||||
| 2026-02-10 | 13F | Jupiter Asset Management Ltd | 1.816.935 | 7,91 | 70.252 | 19,67 | ||||
| 2026-04-28 | 13F | Montrusco Bolton Investments Inc. | 88.079 | -82,81 | 3.906 | -80,28 | ||||
| 2026-02-17 | 13F | Boothbay Fund Management, Llc | 6.949 | -24,05 | 268 | -15,72 | ||||
| 2026-02-18 | 13F | First Citizens Bank & Trust Co | 16.446 | -50,23 | 634 | -44,92 | ||||
| 2025-11-13 | 13F | Bank Of Montreal /can/ | Put | 0 | -100,00 | 0 | -100,00 | |||
| 2026-01-30 | 13F | Mitsubishi UFJ Trust & Banking Corp | 17.925 | -74,71 | 684 | -72,36 | ||||
| 2026-02-10 | 13F | Envestnet Asset Management Inc | 95.582 | -10,82 | 3.688 | -1,28 | ||||
| 2026-01-29 | 13F | Calamos Wealth Management LLC | 75.066 | 0,58 | 2.896 | 11,34 | ||||
| 2026-02-17 | 13F | Alliancebernstein L.p. | 43.989 | -0,18 | 1.697 | 10,48 | ||||
| 2026-02-12 | 13F | Marex Group plc | 165.650 | -19,49 | 6.391 | -10,90 | ||||
| 2026-01-30 | 13F | Pvg Asset Management Corp | 5.343 | 206 | ||||||
| 2026-03-06 | 13F | Hsbc Holdings Plc | 0 | -100,00 | 0 | |||||
| 2026-03-31 | 13F | Sankala Group LLC | 235 | 0,00 | 10 | -25,00 | ||||
| 2026-02-17 | 13F | Woodline Partners LP | 753.597 | 29.074 | ||||||
| 2026-01-29 | 13F | Concurrent Investment Advisors, LLC | 17.114 | 660 | ||||||
| 2026-02-17 | 13F | DV Trading LLC | 4.800 | 185 | ||||||
| 2026-02-12 | 13F | Bradley Foster & Sargent Inc/ct | 674.422 | -1,76 | 26.019 | 8,73 | ||||
| 2026-02-17 | 13F | XTX Topco Ltd | 6.131 | 237 | ||||||
| 2026-04-16 | 13F | SG Americas Securities, LLC | 18.974 | 1 | ||||||
| 2026-04-28 | 13F | BW Gestao de Investimentos Ltda. | 140.461 | 6.241 | ||||||
| 2026-02-05 | 13F | Gabelli Funds Llc | 670.775 | -20,67 | 25.878 | -12,21 | ||||
| 2025-11-13 | 13F | Macquarie Group Ltd | 0 | -100,00 | 0 | -100,00 | ||||
| 2026-01-30 | 13F | Pekin Hardy Strauss, Inc. | 279.008 | 5,75 | 10.789 | 17,26 | ||||
| 2026-02-10 | 13F | State of Wyoming | 1.835 | 71 | ||||||
| 2026-02-18 | 13F | Vident Advisory, LLC | 62.619 | 255,33 | 2.416 | 293,32 | ||||
| 2026-02-11 | 13F | Twin Tree Management, LP | Call | 0 | -100,00 | 0 | -100,00 | |||
| 2026-02-06 | 13F | Cumberland Partners Ltd | 242.260 | -0,08 | 9.365 | 10,86 | ||||
| 2026-02-05 | 13F | Allworth Financial LP | 184 | -5,64 | 7 | 16,67 | ||||
| 2026-02-13 | 13F | Eschler Asset Management LLP | 521.620 | 135,37 | 20.124 | 160,50 | ||||
| 2026-02-12 | 13F | Aviva Plc | 352.596 | 5,63 | 13.626 | 17,21 | ||||
| 2026-02-04 | 13F | Atlantic Union Bankshares Corp | 651 | 25 | ||||||
| 2026-02-10 | 13F | Acadian Asset Management Llc | 19.802 | -73,40 | 1 | -100,00 | ||||
| 2026-02-11 | 13F | Jpmorgan Chase & Co | 783.735 | -31,24 | 30.237 | -23,91 | ||||
| 2026-02-11 | 13F | Jpmorgan Chase & Co | Call | 11.100 | 16,84 | 428 | 29,31 | |||
| 2026-02-17 | 13F | DZ BANK AG Deutsche Zentral Genossenschafts Bank, Frankfurt am Main | 165.442 | -21,44 | 6.383 | -13,09 | ||||
| 2026-04-27 | 13F | Oxbow Advisors, LLC | 199.132 | 240,55 | 8.847 | 292,33 | ||||
| 2026-02-17 | 13F | Spears Abacus Advisors LLC | 659.791 | -48,30 | 25.455 | -42,79 | ||||
| 2026-04-21 | 13F | BCS Private Wealth Management, Inc. | 25.887 | -6,16 | 1.150 | 8,08 | ||||
| 2026-04-08 | 13F | Violich Capital Management, Inc. | 7.000 | 0,00 | 311 | 15,19 | ||||
| 2026-01-15 | 13F | Allspring Global Investments Holdings, LLC | 1.538.980 | 4,77 | 59.428 | 16,09 | ||||
| 2026-02-11 | 13F | Empowered Funds, LLC | 17.414 | 189,13 | 672 | 221,05 | ||||
| 2026-04-16 | 13F | Sheets Smith Wealth Management | 20.055 | -0,21 | 891 | 14,97 | ||||
| 2026-02-12 | 13F | Swiss National Bank | 1.114.336 | -7,93 | 43.117 | 2,16 | ||||
| 2026-04-28 | 13F | Stratos Wealth Partners, LTD. | 32.561 | -4,94 | 1.447 | 9,46 | ||||
| 2026-02-17 | 13F | Trexquant Investment LP | 273.210 | 10.540 | ||||||
| 2025-11-14 | 13F | ExodusPoint Capital Management, LP | 224.274 | 2.478,16 | 7.818 | |||||
| 2026-02-02 | 13F | Intact Investment Management Inc. | 0 | -100,00 | 0 | |||||
| 2026-01-26 | 13F | Cwm, Llc | 11.679 | 19,20 | 0 | |||||
| 2026-02-13 | 13F | Parkside Financial Bank & Trust | 100 | 0,00 | 4 | 0,00 | ||||
| 2026-02-09 | 13F | Genus Capital Management Inc. | 9.952 | -8,88 | 385 | 1,05 | ||||
| 2026-02-17 | 13F | Jain Global LLC | 0 | -100,00 | 0 | |||||
| 2026-02-17 | 13F | Stansberry Asset Management, Llc | 29.074 | 1.124 | ||||||
| 2026-04-14 | 13F | Pinnacle Wealth Management Group, Inc. | 78.263 | 3,17 | 3.477 | 18,83 | ||||
| 2026-02-11 | 13F | Ramirez Asset Management, Inc. | 77 | 3 | ||||||
| 2026-04-22 | 13F | Spire Wealth Management | 144 | -89,75 | 6 | -88,89 | ||||
| 2026-01-23 | 13F | Oak Ridge Investments Llc | 38.923 | -40,51 | 1.502 | -34,17 | ||||
| 2026-02-03 | 13F | ASR Vermogensbeheer N.V. | 30.285 | 0,00 | 1.171 | 10,90 | ||||
| 2026-02-17 | 13F | Quantinno Capital Management LP | 16.026 | 104,18 | 618 | 126,37 | ||||
| 2026-04-23 | 13F | Kohmann Bosshard Financial Services, LLC | 0 | -100,00 | 0 | |||||
| 2026-02-12 | 13F | Dimensional Fund Advisors Lp | 2.344.828 | 8,26 | 90.466 | 19,82 | ||||
| 2026-04-17 | 13F | PKO Investment Management Joint-Stock Co | 197.463 | 21,89 | 8.767 | 39,90 | ||||
| 2026-04-06 | 13F | Rosenberg Matthew Hamilton | 390 | 0,00 | 17 | 13,33 | ||||
| 2025-11-12 | 13F | Quantbot Technologies LP | 0 | -100,00 | 0 | -100,00 | ||||
| 2026-04-13 | 13F | True Wealth Design, LLC | 205 | 540,62 | 9 | 800,00 | ||||
| 2026-02-17 | 13F | Two Sigma Investments, Lp | 160.478 | 4,68 | 6.191 | 15,85 | ||||
| 2026-04-20 | 13F | City State Bank | 500 | 0,00 | 22 | 15,79 | ||||
| 2026-02-13 | 13F | Public Sector Pension Investment Board | 0 | -100,00 | 0 | |||||
| 2026-02-17 | 13F | Magnetar Financial LLC | 0 | -100,00 | 0 | |||||
| 2026-02-18 | 13F/A | Pinnacle Financial Partners, Inc. | 10.475 | 404 | ||||||
| 2026-02-13 | 13F | Smartleaf Asset Management LLC | 722 | 44,40 | 28 | 64,71 | ||||
| 2026-02-13 | 13F | Centiva Capital, LP | 0 | -100,00 | 0 | |||||
| 2026-02-12 | 13F | Barometer Capital Management Inc. | 0 | -100,00 | 0 | |||||
| 2026-02-13 | 13F | Gmt Capital Corp | 2.007.975 | -14,71 | 77.638 | -5,42 | ||||
| 2026-02-05 | 13F | Bessemer Group Inc | 1.419 | 592,20 | 0 | |||||
| 2026-02-10 | 13F | Moors & Cabot, Inc. | 41.551 | -1,19 | 1.603 | 9,42 | ||||
| 2026-04-27 | 13F | Sound Income Strategies, LLC | 50 | 2 | ||||||
| 2026-02-10 | 13F | Goldman Sachs Group Inc | 859.348 | -62,15 | 33.154 | -58,11 | ||||
| 2026-04-22 | 13F | Pictet Asset Management Holding SA | 169.366 | -3,91 | 7.511 | 10,21 | ||||
| 2026-02-11 | 13F | Red Cedar Investment Management, Llc | 158.801 | -0,36 | 6.127 | 10,28 | ||||
| 2026-01-30 | 13F | Archer Investment Corp | 184 | 0,00 | 7 | 16,67 | ||||
| 2026-02-09 | 13F | Waratah Capital Advisors Ltd. | 939.614 | 36.250 | ||||||
| 2026-02-17 | 13F | Coastal Bridge Advisors, LLC | 16.907 | 1,81 | 654 | 12,78 | ||||
| 2026-02-04 | 13F | Midwest Trust Co | 10.800 | -4,42 | 417 | 5,85 | ||||
| 2026-04-20 | 13F | CWA Asset Management Group, LLC | 313.615 | 12,07 | 13.934 | 29,06 | ||||
| 2026-02-17 | 13F | Ardsley Advisory Partners Lp | 300.000 | -7,69 | 11.574 | 2,16 | ||||
| 2026-02-17 | 13F | Captrust Financial Advisors | 17.684 | -4,22 | 682 | 6,07 | ||||
| 2026-04-16 | 13F | Generate Investment Management Ltd | 750.000 | -37,50 | 33.322 | -28,02 | ||||
| 2026-02-23 | 13F | Virtu Financial LLC | 9.583 | 0 | ||||||
| 2025-11-12 | 13F | Forge First Asset Management Inc. | 153.300 | -55,22 | 5.343 | -41,20 |