Grundlæggende statistik
| Institutionelle ejere | 399 total, 354 long only, 5 short only, 40 long/short - change of 6,08% MRQ |
| Gennemsnitlig porteføljeallokering | 0.6212 % - change of 3,89% MRQ |
| Institutionelle aktier (lange) | 149.021.808 (ex 13D/G) - change of 15,97MM shares 12,01% MRQ |
| Institutionel værdi (lang) | $ 4.842.822 USD ($1000) |
Institutionelt ejerskab og aktionærer
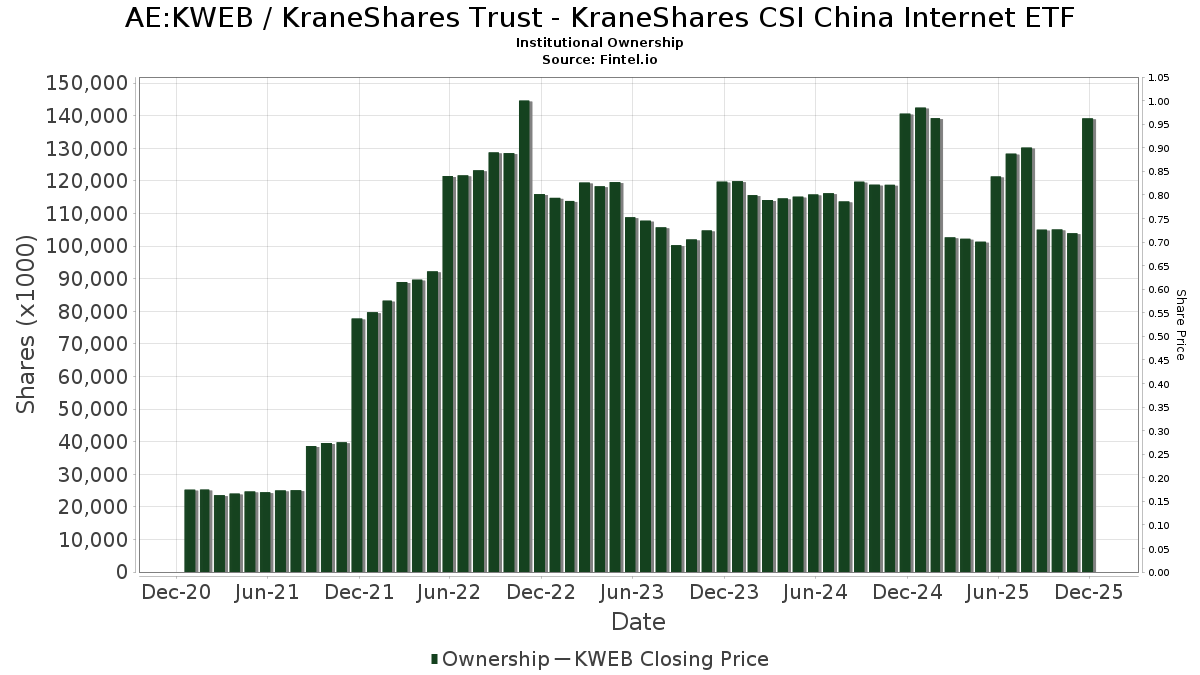
KraneShares Trust - KraneShares CSI China Internet ETF (AE:KWEB) har 399 institutionelle ejere og aktionærer, der har indsendt 13D/G- eller 13F-formularer til Securities Exchange Commission (SEC). Disse institutioner har i alt 149,050,480 aktier. Største aktionærer omfatter Susquehanna International Group, Llp, Jane Street Group, Llc, Susquehanna International Group, Llp, Citadel Advisors Llc, UBS Group AG, Jane Street Group, Llc, Bank Of Montreal /can/, UBS Group AG, Citadel Advisors Llc, and Jane Street Group, Llc .
KraneShares Trust - KraneShares CSI China Internet ETF (ADX:KWEB) institutionel ejerskabsstruktur viser aktuelle positioner i virksomheden efter institutioner og fonde, samt seneste ændringer i positionsstørrelse. Større aktionærer kan omfatte individuelle investorer, investeringsforeninger, hedgefonde eller institutioner. Skema 13D angiver, at investoren besidder (eller besidder) mere end 5 % af virksomheden og har til hensigt (eller har til hensigt at) aktivt at forfølge en ændring i forretningsstrategi. Skema 13G indikerer en passiv investering på over 5%.
Fondens stemningsscore
Fund Sentiment Score (fka Ownership Accumulation Score) finder de aktier, der bliver mest købt af fonde. Det er resultatet af en sofistikeret, multi-faktor kvantitativ model, der identificerer virksomheder med de højeste niveauer af institutionel akkumulering. Scoringsmodellen bruger en kombination af den samlede stigning i oplyste ejere, ændringerne i porteføljeallokeringer i disse ejere og andre målinger. Tallet går fra 0 til 100, hvor højere tal indikerer et højere niveau af akkumulering for sine jævnaldrende, og 50 er gennemsnittet.
Opdateringsfrekvens: Dagligt
Se Ownership Explorer, som giver en liste over højest rangerende virksomheder.
AI+ Ask Fintel’s AI assistant about KraneShares Trust - KraneShares CSI China Internet ETF.
Select a question to share a public post with an AI-crafted answer.
Thinking of good questions…
13F og NPORT arkivering
Detaljer om 13F-arkivering er gratis. Detaljer om NP-ansøgninger kræver et premium-medlemskab. Grønne rækker angiver nye positioner. Røde rækker angiver lukkede positioner. Klik på linket ikon for at se den fulde transaktionshistorik.
Opgrader
for at låse premium-data op og eksportere til Excel ![]() .
.
| Fil dato | Kilde | Investor | Type | Gennemsnitlig pris (Øst) |
Aktier | Δ Aktier (%) |
Rapporteret Værdi ($1000) |
Δ Værdi (%) |
Port Alloc (%) |
|
|---|---|---|---|---|---|---|---|---|---|---|
| 2026-02-17 | 13F | Sig Brokerage, Lp | 54.631 | 30,13 | 1.860 | 5,50 | ||||
| 2026-02-17 | 13F | Sig Brokerage, Lp | Call | 30.000 | -27,71 | 1.022 | -41,42 | |||
| 2026-02-17 | 13F | Black Maple Capital Management LP | 9.000 | 306 | ||||||
| 2026-01-20 | 13F | Nvwm, Llc | 348 | 0,00 | 12 | -21,43 | ||||
| 2026-02-17 | 13F | Old Mission Capital Llc | Call | 0 | -100,00 | 0 | ||||
| 2025-11-13 | 13F | Capital Fund Management S.a. | 0 | -100,00 | 0 | -100,00 | ||||
| 2026-02-11 | 13F | LPL Financial LLC | 726.931 | 0,47 | 24.752 | -18,56 | ||||
| 2026-02-11 | 13F | LPL Financial LLC | Put | 7.100 | 242 | |||||
| 2025-11-14 | 13F | Credit Agricole S A | 0 | -100,00 | 0 | |||||
| 2026-02-12 | 13F | Federation des caisses Desjardins du Quebec | 34.072 | 73,98 | 1.160 | 41,12 | ||||
| 2026-01-30 | 13F | Us Bancorp \de\ | 300 | 0,00 | 10 | -16,67 | ||||
| 2026-02-10 | 13F | WCG Wealth Advisors LLC | 220.051 | 7.493 | ||||||
| 2026-02-13 | 13F | SRS Capital Advisors, Inc. | 280 | 10 | ||||||
| 2026-02-11 | 13F | Simplex Trading, Llc | 95.566 | 3.254 | ||||||
| 2026-02-12 | 13F | BlackRock, Inc. | 903.484 | 0,71 | 30.764 | -18,37 | ||||
| 2026-02-02 | 13F | Cornerstone Planning Group LLC | 55 | 2 | ||||||
| 2026-02-05 | 13F | Cambridge Investment Research Advisors, Inc. | 22.905 | -8,04 | 1 | -100,00 | ||||
| 2026-02-06 | 13F | IFP Advisors, Inc | 4.123 | -31,63 | 140 | -44,66 | ||||
| 2026-02-13 | 13F | Pathstone Holdings, LLC | 9.956 | -9,43 | 339 | -26,46 | ||||
| 2026-02-17 | 13F | Old Mission Capital Llc | 788.806 | 26.859 | ||||||
| 2026-01-09 | 13F | Capstone Wealth Management Group LLC | 6.720 | 229 | ||||||
| 2025-10-27 | 13F | First Horizon Corp | 0 | -100,00 | 0 | -100,00 | ||||
| 2026-01-14 | 13F | ORG Partners LLC | 180 | -86,72 | 6 | -89,29 | ||||
| 2026-02-03 | 13F | Credit Industriel Et Commercial | 60.862 | 985,46 | 2.072 | 781,70 | ||||
| 2026-02-17 | 13F | EFG International AG | 16.722 | 569 | ||||||
| 2025-11-14 | 13F | Wetherby Asset Management Inc | 7.000 | 294 | ||||||
| 2026-02-03 | 13F | Credit Industriel Et Commercial | Put | 214.600 | 43,07 | 7.307 | 15,97 | |||
| 2026-02-06 | 13F | Larson Financial Group LLC | 8.490 | 6,09 | 289 | -13,99 | ||||
| 2025-11-14 | 13F | Brevan Howard Capital Management LP | Put | 0 | -100,00 | 0 | -100,00 | |||
| 2026-02-17 | 13F | Parallax Volatility Advisers, L.P. | 77.949 | 2.654 | ||||||
| 2026-02-17 | 13F | Parallax Volatility Advisers, L.P. | Put | 896.400 | -45,47 | 30.522 | -55,80 | |||
| 2026-01-14 | 13F | Redhawk Wealth Advisors, Inc. | 9.280 | 316 | ||||||
| 2026-02-17 | 13F | Nearwater Capital Markets, Ltd | 800.000 | 27.240 | ||||||
| 2026-02-02 | 13F | Ping Capital Management, Inc. | 495.000 | 120,00 | 16.855 | 78,31 | ||||
| 2025-08-29 | NP | CGHIX - Timber Point Global Allocations Fund Institutional Class Shares | 5.000 | -66,67 | 172 | -67,30 | ||||
| 2026-02-13 | 13F | Marshall Wace, Llp | Put | 0 | -100,00 | 0 | ||||
| 2026-02-17 | 13F | Parallax Volatility Advisers, L.P. | Call | 2.406.200 | 80,75 | 81.931 | 46,51 | |||
| 2026-02-13 | 13F | Marshall Wace, Llp | Call | 0 | -100,00 | 0 | ||||
| 2026-02-17 | 13F | Gotham Asset Management, LLC | 20.563 | 700 | ||||||
| 2026-01-05 | 13F | Anderson Hoagland & Co | 14.536 | 6,08 | 495 | -14,09 | ||||
| 2026-01-28 | 13F | Retirement Planning Co of New England, Inc. | 15.025 | -1,04 | 512 | -19,78 | ||||
| 2026-02-03 | 13F | NewEdge Wealth, LLC | 220.686 | 67,77 | 7.514 | 45,17 | ||||
| 2026-02-17 | 13F | Balyasny Asset Management Llc | Call | 515.200 | 29,19 | 17.543 | 4,71 | |||
| 2026-02-17 | 13F | Balyasny Asset Management Llc | Put | 2.765.800 | 13,47 | 94.175 | -8,03 | |||
| 2026-02-13 | 13F | Rafferty Asset Management, LLC | 4.302.191 | 6,10 | 146.490 | -14,01 | ||||
| 2026-01-23 | 13F | Assetmark, Inc | 208 | 7 | ||||||
| 2026-02-02 | 13F | APEIRON CAPITAL Ltd | 125.000 | 4.256 | ||||||
| 2026-02-17 | 13F | Balyasny Asset Management Llc | 835.998 | 255,18 | 28.466 | 187,87 | ||||
| 2026-02-12 | 13F | Federated Hermes, Inc. | 933 | -1,58 | 32 | -20,51 | ||||
| 2026-02-09 | 13F | IPG Investment Advisors LLC | 0 | -100,00 | 0 | |||||
| 2026-02-17 | 13F | Raymond James Financial Inc | 463.840 | -25,47 | 15.794 | -39,59 | ||||
| 2026-02-11 | 13F | Krane Funds Advisors LLC | 3.856.700 | 19,59 | 131.321 | 3,68 | ||||
| 2026-02-17 | 13F | Bank Of America Corp /de/ | Call | 0 | -100,00 | 0 | ||||
| 2026-02-12 | 13F | Stelac Advisory Services LLC | 130.842 | 342,74 | 4.483 | 258,85 | ||||
| 2026-02-13 | 13F | Itau Unibanco Holding S.A. | 0 | -100,00 | 0 | |||||
| 2026-02-17 | 13F | Jones Financial Companies Lllp | 55 | -32,10 | 2 | -66,67 | ||||
| 2025-11-13 | 13F | Riggs Asset Managment Co. Inc. | 0 | -100,00 | 0 | |||||
| 2025-11-14 | 13F | Cubist Systematic Strategies, LLC | Put | 44.700 | -89,48 | 1.878 | -87,13 | |||
| 2026-02-09 | 13F | Fisher Asset Management, LLC | 46.268 | 0,44 | 1.575 | -18,60 | ||||
| 2025-11-14 | 13F | Cubist Systematic Strategies, LLC | Call | 166.400 | -64,84 | 6.990 | -56,97 | |||
| 2026-02-12 | 13F | Summit Financial, LLC | 40.138 | 0,31 | 1.367 | -18,69 | ||||
| 2025-11-14 | 13F | Cubist Systematic Strategies, LLC | 86.223 | 3.622 | ||||||
| 2026-01-29 | 13F | Atlas Legacy Advisors, LLC | Call | 20.000 | 681 | |||||
| 2026-01-29 | 13F | Mivtachim The Workers Social Insurance Fund Ltd. (Under Special Management) | 232.000 | -36,78 | 7.900 | -48,76 | ||||
| 2026-02-10 | 13F | Essex Financial Services, Inc. | 8.231 | -0,86 | 280 | -19,54 | ||||
| 2026-02-17 | 13F | XTX Topco Ltd | 0 | -100,00 | 0 | |||||
| 2025-11-14 | 13F | Point72 Hong Kong Ltd | Call | 0 | -100,00 | 0 | -100,00 | |||
| 2025-11-14 | 13F | Point72 Hong Kong Ltd | 0 | -100,00 | 0 | -100,00 | ||||
| 2026-02-11 | 13F | Fore Capital, LLC | Call | 150.000 | 5.108 | |||||
| 2025-08-28 | NP | BlackRock Series Fund, Inc. - BlackRock Global Allocation Portfolio This fund is a listed as child fund of BlackRock, Inc. and if that institution has disclosed ownership in this security, then these positions will not be double counted when calculating total shares and total value | 4.482 | 0,00 | 154 | -1,92 | ||||
| 2026-02-12 | 13F | Jane Street Group, Llc | Call | 9.522.100 | -26,45 | 324.228 | -40,38 | |||
| 2026-02-11 | 13F | MidWestOne Financial Group, Inc. | 18.327 | 624 | ||||||
| 2025-11-05 | 13F | Anthracite Investment Company, Inc. | 0 | -100,00 | 0 | |||||
| 2026-02-11 | 13F | Jessup Wealth Management, Inc | 6.326 | 27,75 | 215 | 3,37 | ||||
| 2026-02-17 | 13F | Nomura Holdings Inc | Call | 2.855.200 | 35,77 | 97.220 | 10,04 | |||
| 2026-02-17 | 13F | Nomura Holdings Inc | Put | 6.715.900 | 8,38 | 228.676 | -12,16 | |||
| 2025-11-14 | 13F | Squarepoint Ops LLC | 0 | -100,00 | 0 | -100,00 | ||||
| 2026-02-13 | 13F | Citigroup Inc | Put | 1.478.000 | -7,62 | 50.326 | -25,13 | |||
| 2026-02-17 | 13F | Advisor Group Holdings, Inc. | 31.629 | -15,68 | 1.077 | -27,33 | ||||
| 2026-01-23 | 13F | LOM Asset Management Ltd | 670 | 0,00 | 23 | -21,43 | ||||
| 2026-02-17 | 13F | Wiley Bros.-aintree Capital, Llc | 15.436 | 58,07 | 463 | 12,14 | ||||
| 2026-02-13 | 13F | Citigroup Inc | 32.976 | -76,21 | 1.123 | -80,73 | ||||
| 2026-01-23 | 13F | Farther Finance Advisors, LLC | 22.277 | -25,79 | 759 | -39,89 | ||||
| 2026-02-13 | 13F | Citigroup Inc | Call | 7.012.200 | 54,00 | 238.765 | 24,82 | |||
| 2026-02-17 | 13F | State Of Wisconsin Investment Board | Call | 2.000.000 | 68.100 | |||||
| 2026-01-21 | 13F | Capital Investment Advisory Services, LLC | 10.832 | -6,62 | 369 | -24,44 | ||||
| 2026-01-15 | 13F | Highline Wealth Partners Llc | 7.994 | 5,60 | 272 | -14,47 | ||||
| 2026-01-20 | 13F | Secure Asset Management, LLC | 0 | -100,00 | 0 | |||||
| 2026-01-13 | 13F | Avaii Wealth Management, Llc | 13.288 | 16,50 | 452 | -5,64 | ||||
| 2026-01-23 | 13F | KG&L Capital Management,LLC | 13.088 | 446 | ||||||
| 2026-02-13 | 13F | Baird Financial Group, Inc. | 55.769 | -44,60 | 1.899 | -55,12 | ||||
| 2026-02-17 | 13F/A | Kovack Advisors, Inc. | 7.293 | 248 | ||||||
| 2025-10-22 | 13F | Geneos Wealth Management Inc. | 0 | -100,00 | 0 | -100,00 | ||||
| 2026-01-28 | 13F | Momentum Wealth Planning, LLC | 60.575 | -62,63 | 2.063 | -69,72 | ||||
| 2026-02-10 | 13F | Baker Avenue Asset Management, LP | 0 | -100,00 | 0 | |||||
| 2025-10-09 | 13F | Whalen Wealth Management Inc. | 0 | -100,00 | 0 | |||||
| 2026-02-06 | 13F | Gsa Capital Partners Llp | 0 | -100,00 | 0 | |||||
| 2026-02-05 | 13F | Atria Investments Llc | 6.945 | -0,42 | 236 | -19,18 | ||||
| 2026-02-12 | 13F | Jane Street Group, Llc | 15.232.248 | 114,75 | 518.658 | 74,06 | ||||
| 2026-02-12 | 13F | Jane Street Group, Llc | Put | 18.354.300 | 8,97 | 624.964 | -11,68 | |||
| 2026-02-17 | 13F | Equitable Holdings, Inc. | 30.252 | -18,60 | 1.030 | -34,02 | ||||
| 2025-11-14 | 13F | Ursa Fund Management, LLC | 0 | -100,00 | 0 | -100,00 | ||||
| 2026-02-06 | 13F | EverSource Wealth Advisors, LLC | 2.453 | -17,16 | 84 | -33,06 | ||||
| 2026-01-26 | 13F | PFG Investments, LLC | 7.606 | 259 | ||||||
| 2026-02-05 | 13F | Bessemer Group Inc | 19.620 | -99,72 | 1 | -100,00 | ||||
| 2025-09-29 | NP | CWEB - Direxion Daily CSI China Internet Index Bull 2X Shares | 4.263.009 | 1,60 | 151.081 | 12,17 | ||||
| 2026-01-07 | 13F | Harbor Investment Advisory, Llc | Call | 0 | -100,00 | 0 | -100,00 | |||
| 2025-11-14 | 13F | Flow Traders U.s. Llc | 0 | -100,00 | 0 | |||||
| 2026-02-11 | 13F | Arrowpoint Investment Partners (Singapore) Pte. Ltd. | 75.400 | 2.567 | ||||||
| 2026-02-17 | 13F | Schonfeld Strategic Advisors LLC | Call | 350.000 | -41,67 | 11.917 | -52,72 | |||
| 2026-02-17 | 13F | Osterweis Capital Management Inc | 78 | |||||||
| 2025-09-26 | NP | OWLSX - Old Westbury Large Cap Strategies Fund | 3.917.754 | -2,66 | 138.845 | 7,46 | ||||
| 2026-02-03 | 13F | Plan Group Financial, LLC | 0 | -100,00 | 0 | -100,00 | ||||
| 2026-01-15 | 13F | Affinity Wealth Management Llc | 0 | -100,00 | 0 | -100,00 | ||||
| 2026-02-17 | 13F | Schonfeld Strategic Advisors LLC | 10.500 | -33,94 | 358 | -46,48 | ||||
| 2026-01-16 | 13F | Compagnie Lombard Odier SCmA | 1.325 | 45 | ||||||
| 2026-02-05 | 13F | SkyOak Wealth, LLC | 9.038 | 0,00 | 308 | -19,00 | ||||
| 2026-02-06 | 13F/A | Rathbone Brothers plc | 64.350 | 0,00 | 2.191 | -18,94 | ||||
| 2026-02-09 | 13F | Kazazian Asset Management, LLC | 7.933 | 0,00 | 270 | -18,92 | ||||
| 2026-02-17 | 13F | Hbk Investments L P | Put | 200.000 | 0,00 | 6.810 | -18,95 | |||
| 2026-02-10 | 13F | Goldman Sachs Group Inc | Put | 852.900 | -23,69 | 29.041 | -38,15 | |||
| 2026-02-17 | 13F | Quantitative Investment Management, LLC | 0 | -100,00 | 0 | |||||
| 2026-01-29 | 13F | Kestra Private Wealth Services, Llc | Call | 0 | -100,00 | 0 | ||||
| 2026-02-10 | 13F | Goldman Sachs Group Inc | Call | 1.565.200 | -24,97 | 53.295 | -39,19 | |||
| 2026-01-30 | 13F | Oakworth Capital, Inc. | 0 | -100,00 | 0 | |||||
| 2026-02-13 | 13F | Morgan Stanley | 7.454.933 | -16,18 | 253.840 | -32,06 | ||||
| 2026-02-17 | 13F | Advisory Services Network, LLC | 40.095 | 9,30 | 1.365 | -11,36 | ||||
| 2026-02-17 | 13F | Cresset Asset Management, LLC | 29.702 | 16,16 | 1.011 | -5,87 | ||||
| 2026-02-17 | 13F | LuminArx Capital Management LP | Call | 137.400 | 17 | |||||
| 2026-02-10 | 13F | Bnp Paribas Arbitrage, Sa | Put | 6.000 | -46,67 | 20.430 | -56,77 | |||
| 2026-01-16 | 13F | Ronald Blue Trust, Inc. | 0 | -100,00 | 0 | |||||
| 2026-02-10 | 13F | Bnp Paribas Arbitrage, Sa | Call | 10.121 | 1.249,47 | 34.462 | 994,03 | |||
| 2026-02-12 | 13F | Index Technologies Group LLC | 29.525 | 1.005 | ||||||
| 2026-02-17 | 13F | J. Goldman & Co LP | Put | 470.000 | 16.004 | |||||
| 2026-02-17 | 13F | J. Goldman & Co LP | 124.145 | 4.227 | ||||||
| 2026-01-26 | 13F | Quattro Financial Advisors Llc | 78.600 | 2.676 | ||||||
| 2026-02-10 | 13F | Goldman Sachs Group Inc | 4.140.873 | 15,49 | 140.997 | -6,39 | ||||
| 2026-02-17 | 13F | J. Goldman & Co LP | Call | 160.000 | 5.448 | |||||
| 2026-01-09 | 13F | First Heartland Consultants, Inc. | 10.166 | 12,23 | 346 | -8,95 | ||||
| 2026-02-12 | 13F | Commonwealth Equity Services, Llc | 23.455 | -15,87 | 799 | 79.700,00 | ||||
| 2026-02-13 | 13F | Marathon Trading Investment Management LLC | 31.643 | -84,98 | 1.077 | -87,83 | ||||
| 2026-02-17 | 13F | Strive Financial Group ,LLC | 5.606 | 191 | ||||||
| 2025-11-14 | 13F | Militia Capital Partners, LP | Call | 159.800 | 319 | |||||
| 2026-02-10 | 13F | Bnp Paribas Arbitrage, Sa | 2.111.075 | -42,48 | 71.882 | -53,38 | ||||
| 2026-02-17 | 13F | Tower Research Capital LLC (TRC) | 404 | 2.276,47 | 14 | |||||
| 2026-01-27 | 13F | Summit Rock Advisors, LP | 6.708 | 228 | ||||||
| 2026-02-12 | 13F | Amitell Capital Pte Ltd | 0 | -100,00 | 0 | |||||
| 2026-02-11 | 13F | Janney Montgomery Scott LLC | 0 | -100,00 | 0 | |||||
| 2026-01-20 | 13F | Polunin Capital Partners Ltd | 19.226 | -53,22 | 1 | -100,00 | ||||
| 2026-02-06 | 13F | Banque Cantonale Vaudoise | 6.341 | -36,29 | 216 | |||||
| 2026-02-10 | 13F | Cornerstone Select Advisors, LLC | 7.138 | -21,18 | 243 | -36,05 | ||||
| 2026-02-17 | 13F | Dauntless Investment Group, LLC | Call | 15.400 | -25,60 | 524 | -39,70 | |||
| 2025-11-14 | 13F | Capitolis Liquid Global Markets LLC | 0 | -100,00 | 0 | |||||
| 2026-02-11 | 13F | Capital Wealth Planning, LLC | 125.584 | 11,59 | 4.276 | -9,54 | ||||
| 2026-02-18 | 13F | Skyview Financial Group LLC | 94.810 | 3.228 | ||||||
| 2026-01-15 | 13F | J. Safra Sarasin Holding AG | 0 | -100,00 | 0 | |||||
| 2026-02-17 | 13F | Summit Trail Advisors, Llc | 0 | -100,00 | 0 | |||||
| 2025-09-29 | NP | INTL - Main International ETF | 358.136 | 2,99 | 12.692 | 13,71 | ||||
| 2026-01-29 | 13F | Concurrent Investment Advisors, LLC | 0 | -100,00 | 0 | |||||
| 2026-02-17 | 13F | Two Sigma Securities, Llc | 58.542 | 1.993 | ||||||
| 2026-02-05 | 13F | Phoenix Holdings Ltd. | 230.331 | 9,42 | 7.712 | -12,79 | ||||
| 2026-01-07 | 13F | Fragasso Group Inc. | 9.660 | -0,13 | 329 | -20,39 | ||||
| 2026-02-11 | 13F | Agave Capital Management Ltd | 134.495 | 4.579 | ||||||
| 2026-02-10 | 13F | Transatlantique Private Wealth Llc | 8.907 | -4,11 | 303 | -22,31 | ||||
| 2026-01-30 | 13F | SOL Capital Management CO | 6.800 | 0,00 | 0 | |||||
| 2026-01-27 | 13F | Hedges Asset Management LLC | 11.800 | 0,00 | 402 | -18,99 | ||||
| 2026-02-17 | 13F | Clear Street Markets Llc | 63.000 | 2.145 | ||||||
| 2026-02-13 | 13F | Smartleaf Asset Management LLC | 301 | 33,78 | 10 | 11,11 | ||||
| 2026-02-12 | 13F | Capital Markets Trading UK LLP | 26.248 | 1 | ||||||
| 2025-10-31 | 13F | FACTORIAL MANAGEMENT Ltd | 0 | -100,00 | 0 | -100,00 | ||||
| 2026-02-13 | 13F | Marshall Wace, Llp | 79.300 | 2.700 | ||||||
| 2026-02-02 | 13F | CENTRAL TRUST Co | 3.770 | 188.400,00 | 128 | |||||
| 2025-11-13 | 13F | Hsbc Holdings Plc | Put | 32.300 | 55,29 | 1.354 | 90,03 | |||
| 2026-02-17 | 13F | Edmond De Rothschild Holding S.a. | 1.340 | 0,00 | 46 | -19,64 | ||||
| 2026-01-21 | 13F | Prime Capital Investment Advisors, LLC | 31.292 | 6,10 | 1.065 | -13,97 | ||||
| 2026-02-12 | 13F | Steward Partners Investment Advisory, Llc | 2.950 | -13,87 | 100 | -30,07 | ||||
| 2026-02-17 | 13F | Schonfeld Strategic Advisors LLC | Put | 0 | -100,00 | 0 | ||||
| 2026-01-29 | 13F | Ashton Thomas Private Wealth, LLC | 11.194 | 25,45 | 381 | 1,87 | ||||
| 2026-02-09 | 13F | Rit Capital Partners Plc | 0 | -100,00 | 0 | |||||
| 2025-11-14 | 13F | Sphera Management Technology Funds Ltd | 0 | -100,00 | 0 | |||||
| 2026-01-23 | 13F | Altfest L J & Co Inc | 9.338 | -94,86 | 318 | -95,84 | ||||
| 2026-01-08 | 13F | Aurora Investment Managers, LLC. | 439.806 | -0,05 | 15 | -22,22 | ||||
| 2026-02-03 | 13F | Brandywine Oak Private Wealth Llc | 0 | -100,00 | 0 | |||||
| 2026-01-23 | 13F | Legacy Bridge, LLC | 50 | 0,00 | 2 | -50,00 | ||||
| 2026-02-17 | 13F | Lazard Asset Management Llc | 125.888 | -4,90 | 4.286 | -22,91 | ||||
| 2026-01-16 | 13F | FNY Investment Advisers, LLC | 1.000 | 0 | ||||||
| 2026-01-16 | 13F | FNY Investment Advisers, LLC | Call | 1 | -85,71 | 0 | ||||
| 2026-02-03 | 13F | Maxi Investments CY Ltd | 40.000 | 0,00 | 1 | 0,00 | ||||
| 2026-02-13 | 13F | Mml Investors Services, Llc | 10.227 | -81,84 | 348 | -85,29 | ||||
| 2026-01-06 | 13F | Investors Research Corp | 80 | 0,00 | 3 | -33,33 | ||||
| 2026-02-06 | 13F | Northbridge Financial Group, Llc | 9.012 | 307 | ||||||
| 2026-01-30 | 13F | Activest Wealth Management | 96.076 | 4,52 | 3.271 | -15,28 | ||||
| 2026-02-12 | 13F | Bank Of Montreal /can/ | Call | 13.201.100 | 449.497 | |||||
| 2026-02-12 | 13F | Bank Of Montreal /can/ | 1.401.127 | 409,84 | 47.708 | 313,24 | ||||
| 2026-02-18 | 13F | CTC Alternative Strategies, Ltd. | 0 | -100,00 | 0 | |||||
| 2026-02-06 | 13F | Fortis Group Advisors, LLC | 50.641 | 1.792 | ||||||
| 2026-02-17 | 13F | Cantor Fitzgerald, L. P. | 38.770 | 1.320 | ||||||
| 2026-02-13 | 13F | Gts Securities Llc | 111.245 | 338,37 | 3.788 | 255,25 | ||||
| 2026-02-06 | 13F | Carrhae Capital LLP | Call | 6.833.500 | 232.681 | |||||
| 2026-02-12 | 13F | Glaxis Capital Management, LLC | 21.400 | 729 | ||||||
| 2026-01-29 | 13F | Comerica Bank | 24.537 | 129,64 | 835 | 86,38 | ||||
| 2026-02-12 | 13F | Menora Mivtachim Holdings Ltd. | 60.000 | 106,90 | 2.043 | 67,73 | ||||
| 2026-02-17 | 13F | Royal Bank Of Canada | 1.138.798 | -59,07 | 38.775 | -66,83 | ||||
| 2026-02-13 | 13F | Cordoba Advisory Partners LLC | 29.514 | 1.005 | ||||||
| 2026-02-17 | 13F | Private Advisor Group, LLC | 106.307 | 105,19 | 3.620 | 66,31 | ||||
| 2026-02-17 | 13F | Private Advisor Group, LLC | Put | 1.000 | -75,00 | 0 | -100,00 | |||
| 2026-02-13 | 13F | Titan Investment Solutions Ltd | 55.068 | 1.875 | ||||||
| 2026-01-29 | 13F | Sanctuary Advisors, LLC | 8.565 | -61,54 | 292 | -68,88 | ||||
| 2026-02-05 | 13F | Thrivent Financial For Lutherans | 0 | -100,00 | 0 | |||||
| 2026-02-10 | 13F | CIBC World Markets Inc. | 31.518 | 15,77 | 1.073 | -6,12 | ||||
| 2026-01-16 | 13F | Crewe Advisors LLC | 0 | -100,00 | 0 | |||||
| 2026-02-10 | 13F | BW Gestao de Investimentos Ltda. | 0 | -100,00 | 0 | -100,00 | ||||
| 2025-11-14 | 13F | Soros Fund Management Llc | 0 | -100,00 | 0 | -100,00 | ||||
| 2026-01-16 | 13F | Formidable Asset Management, LLC | 13.565 | -21,98 | 570 | -4,53 | ||||
| 2026-02-03 | 13F | SBI Securities Co., Ltd. | 837 | 634,21 | 28 | 600,00 | ||||
| 2026-02-13 | 13F | Umb Bank N A/mo | 693 | 0,00 | 24 | -20,69 | ||||
| 2026-02-11 | 13F | Modus Advisors, LLC | 192 | 7 | ||||||
| 2026-01-15 | 13F | GFG Capital, LLC | 19.628 | 668 | ||||||
| 2026-01-27 | 13F | Evergreen Capital Management Llc | 114.083 | -0,82 | 3.885 | -19,62 | ||||
| 2025-11-12 | 13F | Sterling Capital Management LLC | 0 | -100,00 | 0 | |||||
| 2026-02-17 | 13F | Moore Capital Management, Lp | 0 | -100,00 | 0 | |||||
| 2026-02-10 | 13F | Rothschild Investment Llc | 7 | 0,00 | 0 | |||||
| 2026-02-17 | 13F | Citadel Advisors Llc | Put | 9.943.100 | -27,70 | 338.563 | -41,40 | |||
| 2026-02-05 | 13F | Everstar Asset Management, LLC | 49.955 | 16,83 | 1.701 | -5,35 | ||||
| 2026-02-17 | 13F | Appaloosa Lp | 4.750.000 | -35,81 | 161.738 | -47,97 | ||||
| 2026-01-22 | 13F | Garrison Bradford & Associates Inc | 17.355 | 172,66 | 591 | 120,97 | ||||
| 2026-02-17 | 13F | Caption Management, LLC | Call | 500.000 | 17.025 | |||||
| 2026-02-13 | 13F | Tamar Securities, LLC | 153.495 | 12,37 | 5.226 | -8,92 | ||||
| 2026-02-17 | 13F | Caption Management, LLC | 84.100 | 2.864 | ||||||
| 2026-01-12 | 13F | Uhlmann Price Securities, Llc | 25.487 | 3,80 | 868 | -15,91 | ||||
| 2026-02-12 | 13F | Marex Group plc | Call | 40.000 | -33,33 | 1.362 | -45,95 | |||
| 2026-02-17 | 13F | Caption Management, LLC | Put | 650.000 | 22.132 | |||||
| 2026-02-12 | 13F | Marex Group plc | 11.120 | 379 | ||||||
| 2025-11-12 | 13F | Park Square Financial Group, LLC | 0 | -100,00 | 0 | |||||
| 2026-02-13 | 13F | Partners Capital Investment Group, Llp | 46.890 | 0,00 | 1.597 | -18,94 | ||||
| 2026-02-18 | 13F | Garton & Associates Financial Advisors LLC | 105 | 4 | ||||||
| 2026-01-30 | 13F | Sigma Planning Corp | 8.673 | 295 | ||||||
| 2026-02-13 | 13F | Soros Fund Management Llc | Call | 0 | -100,00 | 0 | ||||
| 2026-02-17 | 13F | Blair William & Co/il | 13.429 | -0,38 | 457 | -19,26 | ||||
| 2026-02-06 | 13F | Pnc Financial Services Group, Inc. | 1.494 | 0,00 | 51 | -19,35 | ||||
| 2025-10-31 | 13F | GHP Investment Advisors, Inc. | 0 | -100,00 | 0 | |||||
| 2025-08-28 | NP | KBUF - KraneShares 90% KWEB Defined Outcome January 2026 ETF | 114.900 | 0,00 | 3.945 | -1,67 | ||||
| 2026-02-13 | 13F | Kestra Advisory Services, LLC | 0 | -100,00 | 0 | |||||
| 2026-02-17 | 13F | Royal Bank Of Canada | Put | 0 | -100,00 | 0 | ||||
| 2026-02-11 | 13F | Picton Mahoney Asset Management | 1.800 | 0,00 | 61 | |||||
| 2026-02-17 | 13F | Redwood Park Advisors LLC | 302 | 5,96 | 10 | -9,09 | ||||
| 2026-02-04 | 13F | Rinkey Investments | 0 | -100,00 | 0 | |||||
| 2025-08-26 | NP | BlackRock Capital Allocation Trust This fund is a listed as child fund of BlackRock, Inc. and if that institution has disclosed ownership in this security, then these positions will not be double counted when calculating total shares and total value | 50.850 | 0,00 | 1.746 | -1,69 | ||||
| 2026-02-13 | 13F | Global Endowment Management, LP | 77.000 | 54,00 | 2.622 | 24,86 | ||||
| 2026-02-11 | 13F | Parallel Advisors, LLC | 7.855 | 27,19 | 267 | 3,09 | ||||
| 2026-02-14 | 13F | Rockefeller Capital Management L.P. | 880.394 | 51,89 | 29.997 | 23,19 | ||||
| 2026-02-17 | 13F | Citadel Advisors Llc | Call | 16.002.900 | -16,72 | 544.899 | -32,50 | |||
| 2026-02-17 | 13F | Citadel Advisors Llc | 1.494.530 | 50.889 | ||||||
| 2026-02-10 | 13F | Envestnet Asset Management Inc | 255.817 | 1,71 | 8.711 | -17,57 | ||||
| 2026-01-15 | 13F | Northstar Advisory Group, LLC | 0 | -100,00 | 0 | |||||
| 2025-11-14 | 13F | Fosun International Ltd | 0 | -100,00 | 0 | |||||
| 2026-02-17 | 13F | Prelude Capital Management, Llc | 11.090 | 10,13 | 378 | -10,87 | ||||
| 2026-01-20 | 13F | AdvisorNet Financial, Inc | 120 | 5,26 | 4 | 0,00 | ||||
| 2026-01-20 | 13F | Global Trust Asset Management, LLC | 0 | -100,00 | 0 | |||||
| 2026-02-12 | 13F | CMT Capital Markets Trading GmbH | 0 | -100,00 | 0 | |||||
| 2026-02-13 | 13F | Headlands Technologies LLC | 16.981 | -82,11 | 578 | -85,51 | ||||
| 2026-01-14 | 13F | Spire Wealth Management | 200 | -99,44 | 7 | -99,60 | ||||
| 2025-11-14 | 13F | Vienna Asset Management LLC | 0 | -100,00 | 0 | |||||
| 2026-01-08 | 13F | Chesapeake Asset Management Llc | 0 | -100,00 | 0 | -100,00 | ||||
| 2026-02-17 | 13F | Brevan Howard Capital Management LP | 29.000 | 987 | ||||||
| 2026-02-17 | 13F | DV Trading LLC | 5.690.221 | 193.752 | ||||||
| 2026-02-12 | 13F | StoneX Group Inc. | 12.487 | 425 | ||||||
| 2025-11-13 | 13F | Hsbc Holdings Plc | 92.175 | 4,86 | 3.895 | 29,84 | ||||
| 2026-02-17 | 13F | Titan Wealth (CI) Ltd | 320.191 | 10.903 | ||||||
| 2026-01-27 | 13F | Rye Brook Capital LLC | 235.150 | 37,35 | 8 | 14,29 | ||||
| 2026-02-09 | 13F | Kingsview Wealth Management, LLC | 6.713 | -95,92 | 229 | -96,70 | ||||
| 2026-02-17 | 13F | BlueCrest Capital Management Ltd | Call | 900.000 | 30.645 | |||||
| 2026-01-27 | 13F | Journey Advisory Group, LLC | 0 | -100,00 | 0 | |||||
| 2026-02-12 | 13F | Voya Investment Management Llc | 1.101.272 | -20,70 | 37.498 | -35,73 | ||||
| 2026-02-17 | 13F | BlueCrest Capital Management Ltd | 663.641 | 22.597 | ||||||
| 2026-02-17 | 13F | Atom Investors LP | 0 | -100,00 | 0 | |||||
| 2025-11-12 | 13F | NewSquare Capital LLC | 0 | -100,00 | 0 | |||||
| 2026-01-27 | 13F | Jeppson Wealth Management, Llc | 9.058 | -2,16 | 308 | -20,62 | ||||
| 2026-02-12 | 13F | Principal Securities, Inc. | 0 | -100,00 | 0 | |||||
| 2025-10-28 | 13F | BRYN MAWR TRUST Co | 700 | 0,00 | 29 | 20,83 | ||||
| 2026-01-26 | 13F | SeaBridge Investment Advisors LLC | 72.081 | -17,27 | 2.454 | -32,95 | ||||
| 2026-01-21 | 13F | Flagship Harbor Advisors, Llc | 431 | 15 | ||||||
| 2026-02-06 | 13F | Berbice Capital Management LLC | 0 | -100,00 | 0 | |||||
| 2026-02-12 | 13F | Hrt Financial Lp | 767.742 | 26 | ||||||
| 2026-01-09 | 13F | SG Americas Securities, LLC | 165.178 | 164,11 | 6 | 150,00 | ||||
| 2025-11-14 | 13F | State Of Wisconsin Investment Board | 0 | -100,00 | 0 | |||||
| 2026-01-21 | 13F | Robinhood Asset Management, LLC | 1.587.469 | 54.053 | ||||||
| 2026-01-22 | 13F | Apollon Wealth Management, LLC | 0 | -100,00 | 0 | |||||
| 2025-11-12 | 13F | CIBC Bancorp USA Inc. | 5.096 | 214 | ||||||
| 2026-02-10 | 13F | Clear Harbor Asset Management, LLC | 15.686 | 534 | ||||||
| 2026-02-17 | 13F | Turim 21 Investimentos Ltda. | 35.359 | 0,00 | 1.204 | -18,99 | ||||
| 2026-02-13 | 13F | University of Illinois Foundation | 1.025.624 | 0,00 | 34.922 | -18,95 | ||||
| 2026-01-21 | 13F | Cane Capital Partners, LLC | 13.864 | 472 | ||||||
| 2026-02-13 | 13F | Ubs Asset Management Americas Inc | 726.392 | 24.734 | ||||||
| 2026-01-27 | 13F | TD Waterhouse Canada Inc. | 142.557 | -7,50 | 4.855 | -25,80 | ||||
| 2026-01-30 | 13F | Pekin Hardy Strauss, Inc. | 108.504 | 1.102,39 | 3.695 | 874,67 | ||||
| 2026-02-13 | 13F | Stifel Financial Corp | 269.535 | 0,30 | 9.178 | -18,70 | ||||
| 2026-01-28 | 13F | Financial Perspectives, Inc | 883 | -4,95 | 30 | -23,08 | ||||
| 2026-02-13 | 13F | Mariner, LLC | 53.552 | 16,82 | 1.823 | -5,30 | ||||
| 2026-02-10 | 13F | Belvedere Trading LLC | 234.679 | 7.991 | ||||||
| 2026-01-28 | 13F | Kapitalo Investimentos Ltda | 1.734.000 | 30,18 | 59.043 | 5,51 | ||||
| 2026-02-09 | 13F | Key FInancial Inc | 112 | 0,00 | 4 | -25,00 | ||||
| 2026-02-10 | 13F | Belvedere Trading LLC | Put | 25.000 | 0,00 | 851 | -18,95 | |||
| 2026-02-10 | 13F | Belvedere Trading LLC | Call | 64.000 | 0,00 | 2.179 | -18,94 | |||
| 2026-02-17 | 13F | DME Capital Management, LP | 131.510 | 52,26 | 4.478 | 23,40 | ||||
| 2026-02-17 | 13F | Parkwood LLC | Call | 2.600.000 | 89 | |||||
| 2026-01-16 | 13F | Matauro, Llc | 96.994 | 3,03 | 3.303 | -16,49 | ||||
| 2026-02-12 | 13F | DRW Securities, LLC | Put | 270.000 | 9.194 | |||||
| 2026-02-12 | 13F | DRW Securities, LLC | 108.912 | -56,44 | 3.708 | -64,55 | ||||
| 2026-02-13 | 13F | Macquarie Group Ltd | 42.750 | 380,99 | 1.456 | 290,08 | ||||
| 2026-02-11 | 13F | Jpmorgan Chase & Co | 1.054.554 | 54,09 | 35.908 | 24,89 | ||||
| 2026-01-29 | 13F | UMA Financial Services, Inc. | 6 | 0,00 | 0 | |||||
| 2026-02-13 | 13F | Botty Investors LLC | 102.375 | 0,00 | 3.486 | -18,95 | ||||
| 2026-02-17 | 13F | Parkwood LLC | 179.000 | 0,00 | 6 | -14,29 | ||||
| 2026-01-08 | 13F | Chesapeake Asset Management Llc | Put | 8.635 | 296 | |||||
| 2026-02-10 | 13F | Moors & Cabot, Inc. | 36.178 | 395,59 | 1.232 | 302,29 | ||||
| 2026-02-12 | 13F | Insigneo Advisory Services, Llc | 13.077 | 44,05 | 445 | 16,80 | ||||
| 2026-01-07 | 13F | Magnus Financial Group LLC | 15.901 | 2,45 | 541 | -17,02 | ||||
| 2026-02-13 | 13F | Colony Group, LLC | 9.435 | 321 | ||||||
| 2026-02-09 | 13F | Bleakley Financial Group, LLC | 329.518 | 3,17 | 11.220 | -16,37 | ||||
| 2025-10-17 | 13F | Sovereign Financial Group, Inc. | 0 | -100,00 | 0 | |||||
| 2026-02-06 | 13F | Global Retirement Partners, LLC | 93 | -29,55 | 3 | -40,00 | ||||
| 2026-02-19 | 13F | CI Private Wealth, LLC | 0 | -100,00 | 0 | |||||
| 2026-01-23 | 13F | Capital Investment Counsel, Inc | 101.323 | -0,85 | 3.450 | -19,62 | ||||
| 2026-02-13 | 13F | Caxton Associates Llp | 125.000 | -85,70 | 4.256 | -88,41 | ||||
| 2026-02-11 | 13F | Group One Trading, L.p. | 601.559 | 20.483 | ||||||
| 2025-09-09 | 13F | NWF Advisory Services Inc. | 0 | -100,00 | 0 | -100,00 | ||||
| 2026-02-17 | 13F | Lakewood Capital Management, Lp | 110.000 | 3.746 | ||||||
| 2026-01-06 | 13F | Afg Fiduciary Services Limited Partnership | 20.708 | -20,47 | 738 | -33,30 | ||||
| 2025-09-09 | 13F | NWF Advisory Services Inc. | Call | 0 | -100,00 | 0 | -100,00 | |||
| 2026-02-13 | 13F | Financial Sense Advisors, Inc. | 13.588 | -68,60 | 463 | -74,59 | ||||
| 2026-02-17 | 13F | Sona Asset Management (us) Llc | 125.000 | 4.256 | ||||||
| 2026-02-02 | 13F | Ellis Investment Partners, LLC | 0 | -100,00 | 0 | |||||
| 2026-01-16 | 13F | Perigon Wealth Management, LLC | 17.559 | 19,73 | 598 | -3,08 | ||||
| 2026-02-10 | 13F | TAGStone Capital, Inc. | 6.815 | 6,07 | 232 | -13,75 | ||||
| 2026-02-12 | 13F | RPg Family Wealth Advisory, LLC | 151.658 | 1,54 | 5.164 | -17,71 | ||||
| 2026-02-17 | 13F | SageView Advisory Group, LLC | 4.073 | 139 | ||||||
| 2025-08-26 | NP | BlackRock ESG Capital Allocation Trust This fund is a listed as child fund of BlackRock, Inc. and if that institution has disclosed ownership in this security, then these positions will not be double counted when calculating total shares and total value | 52.473 | 0,00 | 1.801 | -1,64 | ||||
| 2026-01-28 | 13F | Quaker Wealth Management, LLC | 1.000 | 0,00 | 34 | -19,05 | ||||
| 2026-02-17 | 13F | Main Street Financial Solutions, LLC | 11.000 | -2,05 | 375 | -20,59 | ||||
| 2026-02-17 | 13F | Main Street Financial Solutions, LLC | Put | 2.300 | 0,00 | 6 | 100,00 | |||
| 2026-02-11 | 13F | Manchester Capital Management LLC | 935 | 32 | ||||||
| 2025-11-14 | 13F | Brevan Howard Capital Management LP | Call | 0 | -100,00 | 0 | -100,00 | |||
| 2026-01-13 | 13F | Mather Group, Llc. | 0 | -100,00 | 0 | |||||
| 2026-01-14 | 13F | Eagle Rock Investment Company, Llc | 18.913 | 0,52 | 644 | -18,61 | ||||
| 2026-02-13 | 13F | MAI Capital Management | 1.082 | 58,42 | 37 | 28,57 | ||||
| 2026-02-09 | 13F | Prospera Financial Services Inc | 43.808 | 59,26 | 1.492 | 29,09 | ||||
| 2026-01-28 | 13F | EPG Wealth Management LLC | 8.684 | 2,94 | 296 | -16,67 | ||||
| 2026-02-13 | 13F | DeepCurrents Investment Group LLC | Call | 1.400 | -70,21 | 4.767 | -75,86 | |||
| 2026-02-13 | 13F | Wells Fargo & Company/mn | Put | 1.275.000 | 54,55 | 43.414 | 25,26 | |||
| 2026-02-13 | 13F | MAI Capital Management | Call | 10 | -16,67 | |||||
| 2026-02-13 | 13F | Wells Fargo & Company/mn | 1.155.631 | -6,73 | 39.349 | -24,40 | ||||
| 2026-02-13 | 13F | Wells Fargo & Company/mn | Call | 1.600.000 | -5,88 | 54.480 | -23,72 | |||
| 2026-01-29 | 13F | DecisionPoint Financial, LLC | 61 | 2 | ||||||
| 2026-02-05 | 13F | Financial Security Advisor, Inc. | 6.560 | 223 | ||||||
| 2026-02-13 | 13F | Hurley Capital, LLC | 2.409 | 82 | ||||||
| 2026-02-13 | 13F | National Bank Of Canada /fi/ | 509.059 | 11,66 | 17.339 | -9,43 | ||||
| 2025-11-14 | 13F | Concentric Capital Strategies, LP | Call | 0 | -100,00 | 0 | ||||
| 2026-01-26 | 13F | Private Trust Co Na | 7.627 | 0,00 | 260 | -19,06 | ||||
| 2025-11-14 | 13F | Concentric Capital Strategies, LP | 0 | -100,00 | 0 | |||||
| 2026-01-20 | 13F | YANKCOM Partnership | 69 | 2 | ||||||
| 2026-02-17 | 13F | IHT Wealth Management, LLC | 62.869 | 35,42 | 2.141 | 9,74 | ||||
| 2026-02-17 | 13F | Basso Capital Management, L.p. | 6.500 | -7,47 | 221 | -25,08 | ||||
| 2025-11-20 | 13F | EMC Capital Management | 3.151 | 0 | ||||||
| 2025-08-28 | NP | KLIP - KraneShares China Internet and Covered Call Strategy ETF | 2.869.900 | -6,37 | 98.524 | -7,92 | ||||
| 2026-02-17 | 13F | Lotus Technology Management, LP | 6.377 | 217 | ||||||
| 2026-01-29 | 13F | Dunhill Financial, LLC | 8.524 | 1,07 | 290 | -18,08 | ||||
| 2026-02-17 | 13F | Toronto Dominion Bank | 0 | -100,00 | 0 | |||||
| 2026-02-12 | 13F | Brinker Capital Investments, LLC | 6.793 | 231 | ||||||
| 2026-02-13 | 13F | Neuberger Berman Group LLC | 6.203 | 211 | ||||||
| 2026-02-17 | 13F | Ameriprise Financial Inc | 223.191 | -48,15 | 7.600 | -57,98 | ||||
| 2026-01-12 | 13F | Kozak & Associates, Inc. | 88 | 3 | ||||||
| 2025-08-25 | 13F/A | Kovitz Investment Group Partners, LLC | Call | 0 | -100,00 | 0 | -100,00 | |||
| 2026-02-06 | 13F | Axxcess Wealth Management, Llc | 20.000 | 0 | ||||||
| 2026-02-17 | 13F | BTG Pactual Asset Management US LLC | Call | 0 | -100,00 | 0 | ||||
| 2026-02-17 | 13F | Snowden Capital Advisors LLC | 108.011 | 6,87 | 3.678 | -13,38 | ||||
| 2026-02-17 | 13F | BTG Pactual Asset Management US LLC | 0 | -100,00 | 0 | |||||
| 2026-01-07 | 13F | IAM Advisory, LLC | 0 | -100,00 | 0 | -100,00 | ||||
| 2026-02-06 | 13F | HighTower Advisors, LLC | 88.139 | 13,96 | 3.001 | -7,63 | ||||
| 2025-11-13 | 13F | Fore Capital, LLC | 0 | -100,00 | 0 | -100,00 | ||||
| 2026-02-13 | 13F | Bay Colony Advisory Group, Inc d/b/a Bay Colony Advisors | 0 | -100,00 | 0 | |||||
| 2026-01-15 | 13F | Fortitude Family Office, LLC | 1.310 | 45 | ||||||
| 2026-02-17 | 13F | Millennium Management Llc | Call | 7.037.500 | 38,87 | 239.627 | 12,55 | |||
| 2026-02-17 | 13F | SIH Partners, LLLP | 1.004.400 | 34.200 | ||||||
| 2026-02-17 | 13F | Risk Paradigm Group, LLC | 91.800 | 3.126 | ||||||
| 2025-09-24 | NP | Managed Account Series - BlackRock GA Dynamic Equity Fund Class K | 86.016 | 0,00 | 3.048 | 10,39 | ||||
| 2026-01-21 | 13F | Newbridge Financial Services Group, Inc. | 300 | 0,00 | 10 | -16,67 | ||||
| 2026-02-17 | 13F | Millennium Management Llc | Put | 1.796.300 | 68,30 | 61.164 | 36,41 | |||
| 2026-01-28 | 13F | Migdal Insurance & Financial Holdings Ltd. | 3.623.034 | 0,35 | 123 | -18,54 | ||||
| 2026-02-13 | 13F | Toroso Investments, LLC | 27.000 | 919 | ||||||
| 2026-02-17 | 13F | Millennium Management Llc | 60.633 | -95,25 | 2.065 | -96,15 | ||||
| 2026-02-06 | 13F | HighTower Advisors, LLC | Put | 0 | -100,00 | 0 | -100,00 | |||
| 2026-02-13 | 13F | MYDA Advisors LLC | 0 | -100,00 | 0 | |||||
| 2026-02-19 | 13F | Mcguire Capital Advisors Inc | 181 | 6 | ||||||
| 2026-02-17 | 13F | Qube Research & Technologies Ltd | Call | 1.500.000 | 0,00 | 51.075 | -18,95 | |||
| 2026-02-17 | 13F | Qube Research & Technologies Ltd | 906.147 | -61,93 | 30.854 | -69,14 | ||||
| 2026-02-10 | 13F/A | Northwestern Mutual Wealth Management Co | 135.781 | 29,95 | 4.623 | 5,33 | ||||
| 2025-11-14 | 13F | Old Mission Capital Llc | Put | 0 | -100,00 | 0 | -100,00 | |||
| 2026-02-03 | 13F | Primoris Wealth Advisors, Llc | 0 | -100,00 | 0 | |||||
| 2026-02-11 | 13F | Viewpoint Capital Management LLC | 112.590 | 1,61 | 3.834 | -17,64 | ||||
| 2026-02-17 | 13F | Qube Research & Technologies Ltd | Put | 1.800.000 | -21,74 | 61.290 | -36,57 | |||
| 2026-02-10 | 13F | BW Gestao de Investimentos Ltda. | Call | 2.400.000 | 81.720 | |||||
| 2026-02-11 | 13F | Cerity Partners LLC | 5.916 | -3,41 | 201 | -21,79 | ||||
| 2026-02-17 | 13F | Hilltop Holdings Inc. | 0 | -100,00 | 0 | |||||
| 2026-02-12 | 13F | Banco BTG Pactual S.A. | 0 | -100,00 | 0 | |||||
| 2025-11-13 | 13F | Eisler Capital Management Ltd. | 5.000 | -62,12 | 212 | -53,20 | ||||
| 2025-11-13 | 13F | Eisler Capital Management Ltd. | Call | 1.711.500 | 21.842,31 | 72.568 | 27.078,65 | |||
| 2025-11-13 | 13F | Eisler Capital Management Ltd. | Put | 1.780.400 | 5.643,23 | 75.489 | 6.994,74 | |||
| 2026-02-12 | 13F | Wealthspire Advisors, LLC | 0 | -100,00 | 0 | |||||
| 2026-02-17 | 13F | Trexquant Investment LP | 6.884 | 234 | ||||||
| 2025-11-12 | 13F | Rovida Investment Management Ltd | 0 | -100,00 | 0 | |||||
| 2026-01-22 | 13F | Fiduciary Alliance LLC | 54.353 | 3,36 | 1.851 | -16,25 | ||||
| 2026-02-10 | 13F | Lhm, Inc. | 197.414 | -12,89 | 6.722 | -29,40 | ||||
| 2025-12-03 | 13F | Strategic Investment Solutions, Inc. /IL | 100 | 0,00 | 4 | 33,33 | ||||
| 2026-02-12 | 13F | Intesa Sanpaolo S.p.a. | 8.000 | 275 | ||||||
| 2026-02-17 | 13F | Cetera Investment Advisers | 44.868 | -36,89 | 1.528 | -48,86 | ||||
| 2026-02-17 | 13F | VestGen Advisors, LLC | 54.627 | -12,47 | 1.860 | -29,03 | ||||
| 2026-01-09 | 13F | 180 Wealth Advisors, Llc | 38.398 | 10,67 | 1.307 | -10,30 | ||||
| 2026-02-06 | 13F | Fairtree Asset Management (Pty) Ltd | 7.941 | -42,10 | 270 | -53,12 | ||||
| 2026-02-09 | 13F | Huntington National Bank | 0 | |||||||
| 2026-02-13 | 13F | Peak6 Llc | Call | 206.300 | -94,79 | 7.025 | -95,78 | |||
| 2026-02-17 | 13F | Atmos Capital Gestao De Recursos Ltda. | 0 | -100,00 | 0 | |||||
| 2026-02-13 | 13F | Peak6 Llc | Put | 812.100 | -57,05 | 27.652 | -65,18 | |||
| 2026-02-09 | 13F | Wellington Shields Capital Management, LLC | 0 | -100,00 | 0 | |||||
| 2026-01-30 | 13F | Simplicity Wealth,LLC | 0 | -100,00 | 0 | -100,00 | ||||
| 2025-11-05 | 13F | Koesten, Hirschmann & Crabtree, INC. | 0 | -100,00 | 0 | |||||
| 2026-02-12 | 13F | CIBC Private Wealth Group, LLC | 5.096 | 0,00 | 174 | -19,16 | ||||
| 2026-02-17 | 13F | LMR Partners LLP | Call | 480.000 | 16.344 | |||||
| 2026-02-17 | 13F | Imprint Wealth LLC | 3.193 | -50,00 | 109 | -59,70 | ||||
| 2026-02-17 | 13F | Toronto Dominion Bank | Call | 300.000 | -43,78 | 10.215 | -54,43 | |||
| 2026-02-06 | 13F | Nano Cap New Millennium Growth Fund L P | 99.000 | 3.371 | ||||||
| 2026-02-17 | 13F | Toronto Dominion Bank | Put | 42.300 | -96,73 | 1.440 | -97,35 | |||
| 2026-02-17 | 13F | Bank Of America Corp /de/ | Put | 0 | -100,00 | 0 | ||||
| 2026-01-28 | 13F | Hudson Value Partners, LLC | 31.511 | 53,26 | 1.074 | 24,33 | ||||
| 2026-02-09 | 13F | Harbour Investments, Inc. | 1.139 | -66,58 | 39 | -73,43 | ||||
| 2026-02-13 | 13F | Senator Investment Group LP | 103.000 | 3.507 | ||||||
| 2026-01-08 | 13F | Maridea Wealth Management LLC | 6.161 | 2,87 | 210 | -13,28 | ||||
| 2026-02-17 | 13F | Graham Capital Management, L.P. | Call | 865.000 | 21.525,00 | 29.453 | 17.431,55 | |||
| 2026-02-13 | 13F | Walleye Trading LLC | Put | 936.000 | -7,49 | 31.871 | -25,02 | |||
| 2026-02-17 | 13F | Graham Capital Management, L.P. | 555.390 | 240,38 | 18.911 | 175,91 | ||||
| 2026-02-17 | 13F | LMR Partners LLP | 0 | -100,00 | 0 | |||||
| 2026-02-13 | 13F | Walleye Trading LLC | Call | 1.684.200 | 86,35 | 57.347 | 51,04 | |||
| 2026-02-13 | 13F | Absolute Gestao de Investimentos Ltda. | 0 | -100,00 | 0 | |||||
| 2026-02-13 | 13F | Walleye Trading LLC | 235.204 | -32,89 | 8.009 | -45,61 | ||||
| 2026-02-17 | 13F | Lombard Odier Asset Management (USA) Corp | 0 | -100,00 | 0 | |||||
| 2026-02-10 | 13F | David R. Rahn & Associates Inc. | 13.824 | 471 | ||||||
| 2026-01-07 | 13F | Lake Hills Wealth Management, LLC | 0 | -100,00 | 0 | |||||
| 2026-02-06 | 13F | Poehling Capital Management, LLC | 15.842 | -1,52 | 539 | -20,15 | ||||
| 2025-11-14 | 13F | Peak6 Llc | 0 | -100,00 | 0 | -100,00 | ||||
| 2026-01-07 | 13F | Harbor Investment Advisory, Llc | 77 | 0,00 | 3 | -33,33 | ||||
| 2026-02-05 | 13F | Stephens Inc /ar/ | 6.000 | -0,33 | 204 | -19,05 | ||||
| 2026-02-12 | 13F | JPL Wealth Management, LLC | 0 | -100,00 | 0 | |||||
| 2026-02-13 | 13F | Centiva Capital, LP | Call | 500.000 | 17.025 | |||||
| 2026-02-17 | 13F | Fmr Llc | 3.861 | -11,12 | 132 | -28,02 | ||||
| 2026-02-10 | 13F | Lido Advisors, LLC | 36.538 | 0,00 | 1.534 | 0,00 | ||||
| 2026-02-17 | 13F | Owl Creek Asset Management, L.P. | Call | 2.465.200 | 83.940 | |||||
| 2026-02-13 | 13F | Centiva Capital, LP | 96.594 | 3.289 | ||||||
| 2026-02-10 | 13F | Lido Advisors, LLC | Put | 36.000 | 0,00 | 1.226 | -18,98 | |||
| 2026-02-13 | 13F | Centiva Capital, LP | Put | 6.026.900 | 39,94 | 205.216 | 13,42 | |||
| 2026-02-13 | 13F | Epoch Investment Partners, Inc. | 0 | -100,00 | 0 | |||||
| 2026-02-03 | 13F | International Assets Investment Management, Llc | 1.450 | 49 | ||||||
| 2026-02-13 | 13F | Capula Management Ltd | Call | 600.000 | -50,00 | 20.430 | -59,47 | |||
| 2026-01-29 | 13F | D.a. Davidson & Co. | 0 | -100,00 | 0 | |||||
| 2026-02-13 | 13F | Capula Management Ltd | 2.128 | -91,40 | 72 | -93,07 | ||||
| 2026-02-05 | 13F | Spectrum Strategic Capital Management, LLC | 41.502 | 1.413 | ||||||
| 2026-02-17 | 13F | Woodline Partners LP | 0 | -100,00 | 0 | |||||
| 2026-01-20 | 13F | Signaturefd, Llc | 13.927 | 3,82 | 474 | -15,81 | ||||
| 2026-02-05 | 13F/A | Truxt Investmentos Ltda. | 115.932 | 4.870 | ||||||
| 2026-02-13 | 13F | Squarepoint Ops LLC | Call | 7.308.300 | 1.835,46 | 248.848 | 1.468,82 | |||
| 2026-02-13 | 13F | Squarepoint Ops LLC | Put | 339.600 | 82,97 | 11.563 | 48,30 | |||
| 2026-02-18 | 13F | Galaxy Group Investments LLC | 33.200 | 1.130 | ||||||
| 2026-02-13 | 13F | Barclays Plc | Put | 730.000 | 0,00 | 24.856 | -18,95 | |||
| 2026-02-06 | 13F | Csenge Advisory Group | 151.633 | 15,11 | 5.163 | -6,69 | ||||
| 2026-02-13 | 13F | Barclays Plc | Call | 1.000.000 | 233,33 | 34.050 | 170,17 | |||
| 2025-08-29 | NP | GDMA - Gadsden Dynamic Multi-Asset ETF | 54.989 | 26,42 | 1.888 | 24,31 | ||||
| 2026-02-20 | 13F | Kovitz Investment Group Partners, LLC | 0 | -100,00 | 0 | |||||
| 2026-01-23 | 13F | Helios Capital Management Pte. Ltd | 223.000 | 0,00 | 7.593 | -18,95 | ||||
| 2025-11-13 | 13F | FIL Ltd | Put | 0 | -100,00 | 0 | -100,00 | |||
| 2026-02-04 | 13F | Pensionmark Financial Group, Llc | 52.780 | 0,13 | 1.795 | -18,93 | ||||
| 2026-02-10 | 13F | MKP Capital Management, L.L.C. | 893.310 | 30.417 | ||||||
| 2026-02-13 | 13F | Barclays Plc | 1.407.650 | -49,06 | 47.930 | -58,71 | ||||
| 2026-02-18 | 13F | GWM Advisors LLC | 0 | -100,00 | 0 | |||||
| 2026-02-13 | 13F | Ieq Capital, Llc | 11.154 | -38,60 | 380 | -50,33 | ||||
| 2025-10-31 | 13F | BCJ Capital Management, LLC | 0 | -100,00 | 0 | -100,00 | ||||
| 2026-02-13 | 13F | Y-Intercept (Hong Kong) Ltd | 0 | -100,00 | 0 | |||||
| 2026-02-02 | 13F | Oppenheimer & Co Inc | 21.415 | 2,57 | 729 | -16,88 | ||||
| 2026-02-17 | 13F | Ursa Fund Management, LLC | Put | 300.000 | 10.215 | |||||
| 2026-02-11 | 13F | Empowered Funds, LLC | 0 | -100,00 | 0 | |||||
| 2026-02-13 | 13F | Integrated Wealth Concepts LLC | 0 | -100,00 | 0 | |||||
| 2025-11-06 | 13F | OPTIMAS CAPITAL Ltd | 0 | -100,00 | 0 | -100,00 | ||||
| 2026-02-13 | 13F | Solstein Capital, LLC | 17.856 | -34,77 | 608 | -47,22 | ||||
| 2026-02-17 | 13F | Ursa Fund Management, LLC | Call | 300.000 | 10.215 | |||||
| 2026-02-17 | 13F | Aqr Capital Management Llc | 6.508 | 21,37 | 222 | -1,78 | ||||
| 2026-02-17 | 13F | Temasek Holdings (Private) Ltd | 6.499.382 | 98,54 | 221.304 | 60,92 | ||||
| 2026-02-13 | 13F | Golden State Wealth Management, LLC | 1.313 | 2,58 | 45 | -16,98 | ||||
| 2026-02-10 | 13F | Titan Global Capital Management Usa Llc | 60.765 | -4,68 | 2.069 | -22,71 | ||||
| 2026-02-17 | 13F | Bank Of America Corp /de/ | 8.396.916 | 2,86 | 285.915 | -16,63 | ||||
| 2026-02-17 | 13F | Breakout Capital Partners, LP | 675.080 | 22.986 | ||||||
| 2026-01-26 | 13F | Washington Growth Strategies Llc | 9.220 | 0,00 | 314 | -19,12 | ||||
| 2026-02-17 | 13F | Cape Investment Advisory, Inc. | 5.754 | 196 | ||||||
| 2026-02-09 | 13F | Jefferies Financial Group Inc. | 0 | -100,00 | 0 | |||||
| 2026-02-09 | 13F | Jefferies Financial Group Inc. | Call | 0 | -100,00 | 0 | ||||
| 2026-02-20 | 13F | Sunbelt Securities, Inc. | 1.561 | 53 | ||||||
| 2026-02-06 | 13F | Kimelman & Baird, LLC | 0 | -100,00 | 0 | |||||
| 2026-02-12 | 13F | Renaissance Technologies Llc | 1.124.000 | 420,37 | 38.272 | 321,78 | ||||
| 2026-02-09 | 13F | Waratah Capital Advisors Ltd. | Call | 300.000 | 0,00 | 10.215 | -18,95 | |||
| 2026-02-17 | 13F | Main Street Financial Solutions, LLC | Call | 0 | -100,00 | 0 | ||||
| 2025-10-30 | 13F | CVA Family Office, LLC | 0 | -100,00 | 0 | |||||
| 2026-02-04 | 13F | Abc Arbitrage Sa | 199.185 | 44,20 | 6.782 | 16,89 | ||||
| 2026-02-13 | 13F | Natixis | 14.122 | 359,10 | 481 | 272,09 | ||||
| 2026-01-28 | 13F | Qvr Llc | Put | 50.000 | 0,00 | 1.702 | -18,95 | |||
| 2026-02-09 | 13F | Global Assets Advisory, LLC | 10.247 | 349 | ||||||
| 2026-02-10 | 13F | Main Management ETF Advisors, LLC | 295.593 | -20,52 | 10 | -33,33 | ||||
| 2025-09-26 | NP | BLACKROCK GLOBAL ALLOCATION FUND, INC. - BLACKROCK GLOBAL ALLOCATION FUND, INC. Investor A This fund is a listed as child fund of BlackRock, Inc. and if that institution has disclosed ownership in this security, then these positions will not be double counted when calculating total shares and total value | 494.900 | 0,00 | 17.539 | 10,41 | ||||
| 2025-08-26 | NP | WUGI - AXS Esoterica NextG Economy ETF | 28.342 | -10,51 | 973 | -12,04 | ||||
| 2026-02-06 | 13F | Copia Wealth Management | 173 | 0,00 | 6 | -28,57 | ||||
| 2026-02-13 | 13F | SPX Equities Gestao de Recursos Ltda | 2.075.400 | 70.667 | ||||||
| 2026-01-05 | 13F | Park Avenue Securities Llc | 0 | -100,00 | 0 | |||||
| 2026-02-17 | 13F | Tudor Investment Corp Et Al | Put | 3.669.400 | 294,56 | 124.943 | 219,80 | |||
| 2026-02-17 | 13F | Hamilton Wealth, LLC | 0 | -100,00 | 0 | |||||
| 2026-02-17 | 13F | Tudor Investment Corp Et Al | Call | 5.746.500 | 44,46 | 195.668 | 17,09 | |||
| 2026-02-13 | 13F | Clal Insurance Enterprises Holdings Ltd | 1.416.516 | -53,20 | 48 | -62,20 | ||||
| 2026-02-17 | 13F | Tudor Investment Corp Et Al | 291.031 | -55,94 | 9.910 | -64,29 | ||||
| 2026-01-23 | 13F | Portman Square Capital LLP | Call | 600.000 | 20.430 | |||||
| 2026-02-17 | 13F | Point72 Asset Management, L.P. | Put | 813.500 | 1.527,00 | 27.700 | 1.219,00 | |||
| 2026-02-17 | 13F | Ardsley Advisory Partners Lp | Call | 100.000 | 3.405 | |||||
| 2026-02-10 | 13F | JTC Employer Solutions Trusteee Ltd | 32.083 | 57,73 | 1 | |||||
| 2026-02-17 | 13F | Point72 Asset Management, L.P. | Call | 1.024.400 | 978,32 | 34.881 | 774,19 | |||
| 2026-02-18 | 13F | Financial Advisory Service, Inc. | 537 | 0,00 | 18 | -18,18 | ||||
| 2026-02-17 | 13F | Point72 Asset Management, L.P. | 395.000 | 38,60 | 13.450 | 12,34 | ||||
| 2026-01-21 | 13F | Kraematon Investment Advisors, Inc | 15.938 | 0,95 | 543 | -18,25 | ||||
| 2026-02-17 | 13F | SummitTX Capital, L.P. | 0 | -100,00 | 0 | |||||
| 2026-02-06 | 13F | 3EDGE Asset Management, LP | 12.128 | -49,05 | 413 | -58,80 | ||||
| 2026-02-17 | 13F | Two Sigma Investments, Lp | 200.000 | -89,51 | 6.810 | -91,50 | ||||
| 2025-09-26 | NP | OWTEX - Old Westbury Total Equity Fund | 69.560 | 11,37 | 2.465 | 23,00 | ||||
| 2026-01-22 | 13F | Trium Capital LLP | Call | 711.200 | 14 | |||||
| 2026-01-22 | 13F | Trium Capital LLP | 162.865 | -77,62 | 5.546 | -81,86 | ||||
| 2026-02-10 | 13F | Main Management LLC | 1.520 | -26,50 | 0 | |||||
| 2026-02-17 | 13F | Capital Fund Management S.a. | Put | 535.100 | -29,21 | 18.220 | -42,62 | |||
| 2026-02-17 | 13F | Capital Fund Management S.a. | Call | 766.300 | -1,91 | 26.093 | -20,49 | |||
| 2026-02-03 | 13F | Cassaday & Co Wealth Management LLC | 33.727 | 0,50 | 1.148 | -18,52 | ||||
| 2025-11-12 | 13F | HAP Trading, LLC | 100.823 | 4.236 | ||||||
| 2025-11-12 | 13F | HAP Trading, LLC | Call | 551.200 | 1.055 | |||||
| 2026-01-26 | 13F | Cwm, Llc | 983 | -32,67 | 0 | |||||
| 2026-01-23 | 13F | Gainplan LLC | 80.580 | 1,17 | 2.744 | -18,02 | ||||
| 2026-02-17 | 13F | Moore Capital Management, Lp | Call | 1.105.800 | 4.323,20 | 37.652 | 3.485,90 | |||
| 2026-02-13 | 13F | Verition Fund Management LLC | Put | 127.200 | -88,44 | 4.331 | -90,63 | |||
| 2026-02-13 | 13F | Verition Fund Management LLC | Call | 369.500 | -76,91 | 12.581 | -81,28 | |||
| 2026-02-17 | 13F | Permanens Capital L.P. | 27.792 | 36,66 | 946 | 10,77 | ||||
| 2026-02-13 | 13F | Motiv8 Investments LLC | 20 | 0 | ||||||
| 2025-11-14 | 13F | Wolverine Trading, Llc | Call | 1.190.300 | 62,01 | 49.933 | 97,11 | |||
| 2025-11-14 | 13F | Wolverine Trading, Llc | Put | 477.100 | 28,60 | 20.014 | 56,46 | |||
| 2026-01-15 | 13F | Victory Financial Group, Llc | 0 | -100,00 | 0 | |||||
| 2026-02-13 | 13F | Verition Fund Management LLC | 66.204 | 2.254 | ||||||
| 2025-11-14 | 13F | Wolverine Trading, Llc | 97.875 | -16,62 | 4.106 | 1,43 | ||||
| 2026-02-03 | 13F | Morse Asset Management, Inc | 100 | 0,00 | 3 | -25,00 | ||||
| 2025-11-17 | 13F | Sender Co & Partners, Inc. | 0 | -100,00 | 0 | -100,00 | ||||
| 2025-10-24 | 13F | Mirae Asset Securities (usa) Inc. | 0 | -100,00 | 0 | |||||
| 2026-02-13 | 13F | Wexford Capital Lp | 0 | -100,00 | 0 | |||||
| 2026-02-10 | 13F | Florida Financial Advisors, Llc | 6.603 | 225 | ||||||
| 2026-01-14 | 13F | ORG Wealth Partners, LLC | 10.001 | 0,00 | 341 | -19,05 | ||||
| 2026-02-11 | 13F | Compass Rose Asset Management, LP | 550.000 | 18.728 | ||||||
| 2026-02-13 | 13F | Northstar Group, Inc. | 13.117 | 5,99 | 447 | -14,07 | ||||
| 2026-02-17 | 13F | Dv Equities, Llc | 312.429 | 10.638 | ||||||
| 2026-02-17 | 13F | Bienville Capital Management, LLC | 6.687 | 228 | ||||||
| 2026-02-17 | 13F | Susquehanna International Group, Llp | Put | 17.476.600 | 10,67 | 595.078 | -10,30 | |||
| 2026-02-17 | 13F | Susquehanna International Group, Llp | Call | 23.353.400 | 11,07 | 795.183 | -9,97 | |||
| 2025-11-06 | 13F | Krilogy Financial LLC | 0 | -100,00 | 0 | |||||
| 2026-02-17 | 13F | Jain Global LLC | Call | 2.878.600 | 41,57 | 98.016 | 14,75 | |||
| 2026-02-17 | 13F | Jain Global LLC | Put | 55.000 | -98,27 | 1.873 | -98,59 | |||
| 2026-02-17 | 13F | Susquehanna International Group, Llp | 8.666.674 | 208,55 | 295.100 | 150,09 | ||||
| 2026-02-13 | 13F | Arkadios Wealth Advisors | 21.221 | 5,10 | 723 | -14,86 | ||||
| 2026-02-03 | 13F | K.J. Harrison & Partners Inc | 0 | -100,00 | 0 | |||||
| 2025-11-14 | 13F | Aspen Grove Capital, LLC | 0 | -100,00 | 0 | |||||
| 2026-01-08 | 13F | Wealth Enhancement Advisory Services, Llc | 85.553 | 7,32 | 3.109 | -7,42 | ||||
| 2026-02-17 | 13F | FIL Ltd | 370.445 | 0,00 | 12.627 | -18,87 | ||||
| 2026-02-17 | 13F | Boothbay Fund Management, Llc | Put | 50.000 | 0,00 | 1.702 | -18,95 | |||
| 2026-01-30 | 13F | Glenorchy Capital Ltd | 219.643 | -0,65 | 7.479 | -19,48 | ||||
| 2026-02-04 | 13F | Strait & Sound Wealth Management LLC | 0 | -100,00 | 0 | |||||
| 2026-02-17 | 13F | Sender Co & Partners, Inc. | Call | 8.600 | -60,00 | 293 | -67,66 | |||
| 2026-02-17 | 13F | DV Trading LLC | Call | 1.500 | 51 | |||||
| 2025-08-27 | NP | Jnl Series Trust - Jnl/blackrock Global Allocation Fund (a) | 80.835 | 0,00 | 2.775 | -1,63 | ||||
| 2026-02-17 | 13F | D. E. Shaw & Co., Inc. | 769.946 | -4,17 | 26.217 | -22,33 | ||||
| 2026-01-26 | 13F | Mirae Asset Global Investments Co., Ltd. | 17.279 | -92,84 | 588 | -94,20 | ||||
| 2026-02-11 | 13F | Gordian Capital Singapore Pte Ltd | 1 | 0,00 | 0 | |||||
| 2025-11-14 | 13F | Shay Capital LLC | Call | 0 | -100,00 | 0 | -100,00 | |||
| 2026-02-13 | 13F | Vontobel Holding Ltd. | 203.717 | 131,00 | 6.937 | 87,26 | ||||
| 2026-02-17 | 13F | Jain Global LLC | 497.648 | -74,28 | 16.945 | -79,15 | ||||
| 2026-02-17 | 13F | III Capital Management | 115.000 | 3.916 | ||||||
| 2026-02-11 | 13F | Allianz Asset Management GmbH | Put | 0 | -100,00 | 0 | ||||
| 2026-02-17 | 13F | Creative Planning | 10.548 | 39,47 | 359 | 13,25 | ||||
| 2026-02-17 | 13F | III Capital Management | Put | 352.400 | 11.999 | |||||
| 2026-02-17 | 13F | Quantinno Capital Management LP | 0 | -100,00 | 0 | |||||
| 2026-02-17 | 13F | Quadrature Capital Ltd | 2.688.631 | 13,09 | 91.548 | -8,34 | ||||
| 2026-02-17 | 13F | III Capital Management | Call | 850.900 | 28.973 | |||||
| 2025-10-24 | 13F | Mirae Asset Securities (usa) Inc. | Put | 0 | -100,00 | 0 | ||||
| 2025-08-28 | NP | KPRO - KraneShares 100% KWEB Defined Outcome January 2026 ETF | 88.800 | 0,00 | 3.049 | -1,68 | ||||
| 2026-02-05 | 13F | Allworth Financial LP | 76 | 3 | ||||||
| 2026-02-12 | 13F | Ci Investments Inc. | 10.000 | 0,00 | 340 | |||||
| 2026-02-17 | 13F | Symmetry Investments LP | Call | 600.000 | -89,09 | 20.430 | -91,16 | |||
| 2026-02-17 | 13F | Shay Capital LLC | 0 | -100,00 | 0 | |||||
| 2026-02-12 | 13F | Empower Advisory Group, LLC | 6.548 | 223 | ||||||
| 2026-02-13 | 13F | Bank Of Nova Scotia | 0 | -100,00 | 0 | |||||
| 2026-02-12 | 13F | SVRN Asset Management, LLC | 46.150 | 1.571 | ||||||
| 2026-02-12 | 13F | Adviser Investments LLC | 0 | -100,00 | 0 | |||||
| 2026-02-04 | 13F | MONECO Advisors, LLC | 25.841 | -52,99 | 880 | -61,93 | ||||
| 2025-11-12 | 13F | HAP Trading, LLC | Put | 399.800 | 877 | |||||
| 2026-01-21 | 13F | Y.D. More Investments Ltd | 50.000 | 0,00 | 1.702 | -18,95 | ||||
| 2026-02-12 | 13F | Custom Index Systems, Llc | 52.125 | 285,94 | 1.775 | 212,87 | ||||
| 2025-09-26 | NP | SPEDX - Alger Dynamic Opportunities Fund Class A | Short | -28.672 | -68,30 | -1.016 | -65,00 | |||
| 2026-01-29 | 13F | UBS Group AG | Put | 4.329.561 | 0,74 | 147.422 | -18,35 | |||
| 2026-02-17 | 13F | Manatuck Hill Partners, LLC | 0 | -100,00 | 0 | |||||
| 2026-01-29 | 13F | UBS Group AG | Call | 15.898.331 | 109,91 | 541.338 | 70,14 | |||
| 2026-02-12 | 13F | Scotia Capital Inc. | 10.573 | 5,39 | 360 | -14,49 | ||||
| 2026-01-29 | 13F | UBS Group AG | 10.895.134 | 40,45 | 370.979 | 13,84 | ||||
| 2026-01-23 | 13F | U.S. Capital Wealth Advisors, LLC | 250.929 | 31,71 | 8.544 | 6,76 | ||||
| 2026-02-11 | 13F | Next Capital Management LLC | 49.020 | 0,00 | 1.669 | -18,94 | ||||
| 2026-02-17 | 13F | Sona Asset Management (us) Llc | Call | 0 | -100,00 | 0 |
Other Listings
| US:KWEB | 32,70 $ |