Grundlæggende statistik
| Institutionelle aktier (lange) | 50.864.350 - 94,58% (ex 13D/G) - change of -11,24MM shares -18,11% MRQ |
| Institutionel værdi (lang) | $ 10.540.529 USD ($1000) |
Institutionelt ejerskab og aktionærer
Universal Health Services, Inc. (US:UHS) har 677 institutionelle ejere og aktionærer, der har indsendt 13D/G- eller 13F-formularer til Securities Exchange Commission (SEC). Disse institutioner har i alt 50,864,350 aktier. Største aktionærer omfatter Vanguard Group Inc, First Eagle Investment Management, LLC, BlackRock, Inc., State Street Corp, Pzena Investment Management Llc, Fmr Llc, Geode Capital Management, Llc, Dimensional Fund Advisors Lp, Goldman Sachs Group Inc, and Arrowstreet Capital, Limited Partnership .
Universal Health Services, Inc. (NYSE:UHS) institutionel ejerskabsstruktur viser aktuelle positioner i virksomheden efter institutioner og fonde, samt seneste ændringer i positionsstørrelse. Større aktionærer kan omfatte individuelle investorer, investeringsforeninger, hedgefonde eller institutioner. Skema 13D angiver, at investoren besidder (eller besidder) mere end 5 % af virksomheden og har til hensigt (eller har til hensigt at) aktivt at forfølge en ændring i forretningsstrategi. Skema 13G indikerer en passiv investering på over 5%.
The share price as of April 24, 2026 is 174,35 / share. Previously, on April 28, 2025, the share price was 172,91 / share. This represents an increase of 0,83% over that period.

Fondens stemningsscore
Fund Sentiment Score (fka Ownership Accumulation Score) finder de aktier, der bliver mest købt af fonde. Det er resultatet af en sofistikeret, multi-faktor kvantitativ model, der identificerer virksomheder med de højeste niveauer af institutionel akkumulering. Scoringsmodellen bruger en kombination af den samlede stigning i oplyste ejere, ændringerne i porteføljeallokeringer i disse ejere og andre målinger. Tallet går fra 0 til 100, hvor højere tal indikerer et højere niveau af akkumulering for sine jævnaldrende, og 50 er gennemsnittet.
Opdateringsfrekvens: Dagligt
Se Ownership Explorer, som giver en liste over højest rangerende virksomheder.
AI+ Ask Fintel’s AI assistant about Universal Health Services, Inc..
Select a question to share a public post with an AI-crafted answer.
Thinking of good questions…
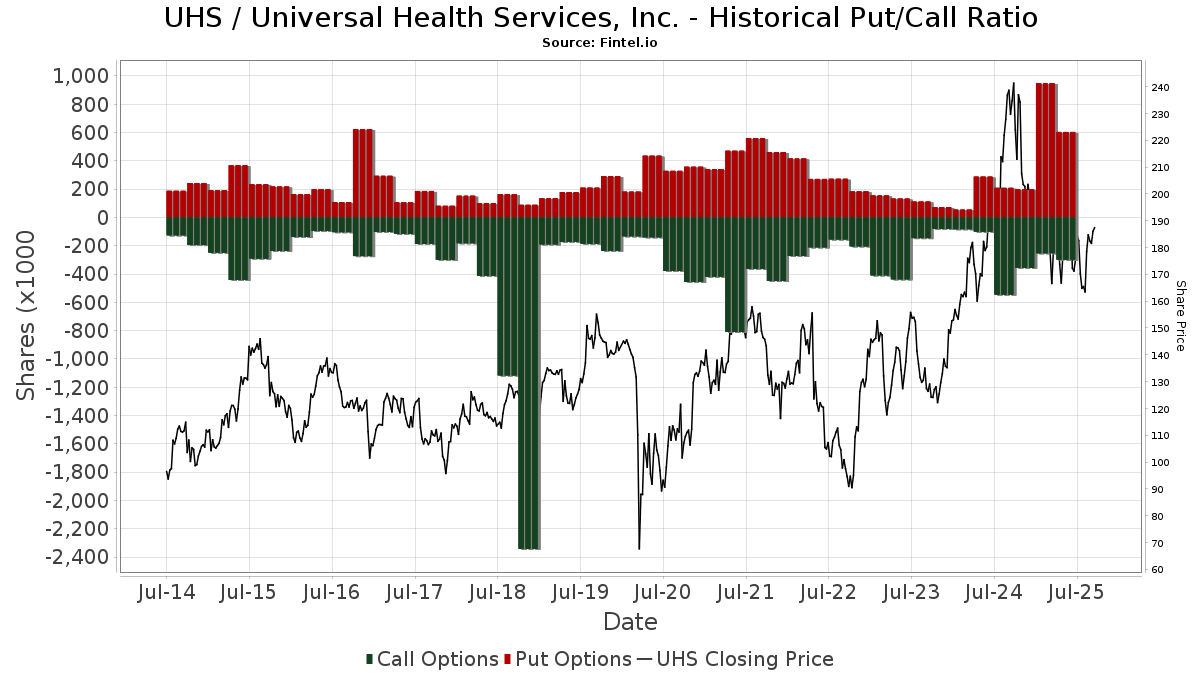
Institutionel Put/Call-forhold
Ud over at indberette standardaktie- og gældsudstedelser skal institutter med mere end 100 mill. aktiver under forvaltning også oplyse deres put- og call-optionsbeholdninger. Da salgsoptioner generelt indikerer negativ stemning, og købsoptioner indikerer positiv stemning, kan vi få en fornemmelse af den overordnede institutionelle stemning ved at plotte forholdet mellem put og kald. Diagrammet til højre viser det historiske put/call-forhold for dette instrument.
Brug af Put/Call Ratio som en indikator for investorernes stemning overvinder en af de vigtigste mangler ved at bruge totalt institutionelt ejerskab, som er, at en betydelig mængde af aktiver under forvaltning investeres passivt for at spore indekser. Passivt forvaltede fonde køber typisk ikke optioner, så indikatoren for put/call-forholdet følger mere nøje følelsen af aktivt forvaltede fonde.
13D/G-arkivering
Vi præsenterer 13D/G ansøgninger separat fra 13F ansøgninger på grund af den forskellige behandling af SEC. 13D/G-ansøgninger kan indgives af grupper af investorer (med én ledende), hvorimod 13F-ansøgninger ikke kan. Dette resulterer i situationer, hvor en investor kan indsende en 13D/G, der rapporterer én værdi for de samlede aktier (der repræsenterer alle de aktier, der ejes af investorgruppen), men derefter indsender en 13F, der rapporterer en anden værdi for de samlede aktier (der udelukkende repræsenterer deres egne) ejendomsret). Det betyder, at aktieejerskab af 13D/G-arkiver og 13F-arkiveringer ofte ikke er direkte sammenlignelige, så vi præsenterer dem separat.
Bemærk: Fra den 16. maj 2021 viser vi ikke længere ejere, der ikke har indsendt en 13D/G inden for det seneste år. Tidligere viste vi den fulde historie af 13D/G-arkiver. Generelt skal enheder, der er forpligtet til at indgive 13D/G-ansøgninger, indgive mindst årligt, før de indsender en afsluttende ansøgning. Dog forlader fonde nogle gange positioner uden at indsende en afsluttende ansøgning (dvs. de afvikler), så visning af den fulde historie resulterede nogle gange i forvirring om det nuværende ejerskab. For at undgå forvirring viser vi nu kun 'aktuelle' ejere - det vil sige - ejere, der har anmeldt inden for det seneste år.
Upgrade to unlock premium data.
| Fil dato | Form | Investor | Forrige Aktier |
Seneste Aktier |
Δ Aktier (Procent) |
Ejendomsret (Procent) |
Δ Ejerskab (Procent) |
|
|---|---|---|---|---|---|---|---|---|
| 2025-04-17 | BlackRock, Inc. | 5,001,906 | 4,139,531 | -17.24 | 7.20 | -15.29 |
13F og NPORT arkivering
Detaljer om 13F-arkivering er gratis. Detaljer om NP-ansøgninger kræver et premium-medlemskab. Grønne rækker angiver nye positioner. Røde rækker angiver lukkede positioner. Klik på linket ikon for at se den fulde transaktionshistorik.
Opgrader
for at låse premium-data op og eksportere til Excel ![]() .
.
| Fil dato | Kilde | Investor | Type | Gennemsnitlig pris (Øst) |
Aktier | Δ Aktier (%) |
Rapporteret Værdi ($1000) |
Δ Værdi (%) |
Port Alloc (%) |
|
|---|---|---|---|---|---|---|---|---|---|---|
| 2026-02-13 | 13F | Treasurer of the State of North Carolina | 59.417 | -3,34 | 13 | 0,00 | ||||
| 2026-02-11 | 13F | Brandywine Global Investment Management, LLC | 45.054 | -1,56 | 9.823 | 4,98 | ||||
| 2026-02-11 | 13F | Clearbridge Investments, LLC | 5.523 | 0,00 | 1.204 | 6,64 | ||||
| 2026-04-15 | 13F | Merit Financial Group, LLC | 5.989 | -5,98 | 1.072 | -22,84 | ||||
| 2026-01-29 | 13F | DecisionPoint Financial, LLC | 2 | 0,00 | 0 | |||||
| 2026-01-26 | 13F | AE Wealth Management LLC | 1.859 | 405 | ||||||
| 2026-02-03 | 13F | Denali Advisors Llc | 2.206 | 481 | ||||||
| 2026-02-10 | 13F | Rothschild Investment Llc | 728 | 5,35 | 159 | 12,06 | ||||
| 2026-02-17 | 13F | United Capital Financial Advisers, Llc | 1.598 | 25,43 | 348 | 33,85 | ||||
| 2026-02-17 | 13F | Farringdon Capital, Ltd. | 1.729 | 377 | ||||||
| 2026-01-29 | 13F | Resonant Capital Advisors, LLC | 3.859 | 1,58 | 841 | 8,38 | ||||
| 2026-02-17 | 13F | Coppell Advisory Solutions LLC | 9.376 | 16,36 | 2.110 | 30,25 | ||||
| 2026-02-10 | 13F | Bruce G. Allen Investments, LLC | 4 | 0,00 | 1 | |||||
| 2026-02-17 | 13F | Tudor Investment Corp Et Al | Call | 2.200 | -52,17 | 480 | -49,04 | |||
| 2026-02-11 | 13F | Brand Asset Management Group, Inc. | 1.375 | 30,83 | 300 | 39,72 | ||||
| 2026-02-12 | 13F | JPL Wealth Management, LLC | 0 | -100,00 | 0 | |||||
| 2026-02-17 | 13F | Tudor Investment Corp Et Al | 35.357 | 7.709 | ||||||
| 2025-11-12 | 13F | Simplex Trading, Llc | 0 | -100,00 | 0 | |||||
| 2026-02-13 | 13F | Umb Bank N A/mo | 909 | 0,22 | 198 | 7,03 | ||||
| 2026-04-22 | 13F | Apollon Wealth Management, LLC | 1.448 | -24,31 | 259 | -37,89 | ||||
| 2025-11-14 | 13F | Two Sigma Securities, Llc | 0 | -100,00 | 0 | -100,00 | ||||
| 2026-02-13 | 13F | Korea Investment CORP | 67.142 | 19,81 | 14.638 | 27,76 | ||||
| 2026-02-17 | 13F | Atom Investors LP | 15.661 | -53,44 | 3.414 | -50,35 | ||||
| 2026-02-17 | 13F | Engineers Gate Manager LP | 10.811 | 2.357 | ||||||
| 2026-01-29 | 13F | Sanctuary Advisors, LLC | 9.710 | 3,07 | 2.117 | 9,92 | ||||
| 2026-02-13 | 13F | Van Eck Associates Corp | 4.580 | -0,13 | 1 | |||||
| 2026-01-23 | 13F | Burney Co/ | 67.395 | -0,62 | 14.693 | 5,99 | ||||
| 2026-02-05 | 13F | HFM Investment Advisors, LLC | 5 | 66,67 | 1 | |||||
| 2026-02-12 | 13F | Hollencrest Capital Management | 1.900 | -20,37 | 414 | -14,99 | ||||
| 2026-04-14 | 13F | Drive Wealth Management, Llc | 0 | -100,00 | 0 | |||||
| 2026-01-28 | 13F | West Michigan Advisors, Llc | 1.091 | 238 | ||||||
| 2026-02-13 | 13F | Commerce Bank | 5.663 | -0,32 | 1.235 | 6,29 | ||||
| 2026-02-17 | 13F | Sciencast Management LP | 0 | -100,00 | 0 | |||||
| 2026-02-10 | 13F | Sivia Capital Partners, LLC | 1.017 | 0,79 | 222 | 7,28 | ||||
| 2026-02-17 | 13F | Susquehanna International Group, Llp | Call | 195.000 | 313,14 | 42.514 | 340,59 | |||
| 2026-04-06 | 13F | GAMMA Investing LLC | 1.351 | -30,04 | 242 | -42,62 | ||||
| 2026-02-17 | 13F | Susquehanna International Group, Llp | 13.106 | -45,07 | 2.857 | -41,42 | ||||
| 2026-02-17 | 13F | Susquehanna International Group, Llp | Put | 169.800 | 85,57 | 37.020 | 97,90 | |||
| 2026-02-13 | 13F | Sei Investments Co | 149.827 | 80,71 | 32.665 | 92,73 | ||||
| 2026-02-17 | 13F | DZ BANK AG Deutsche Zentral Genossenschafts Bank, Frankfurt am Main | 0 | -100,00 | 0 | |||||
| 2026-02-11 | 13F | Vestcor Inc | 48.570 | 0,00 | 11 | 11,11 | ||||
| 2026-02-11 | 13F | Manchester Capital Management LLC | 9 | 2 | ||||||
| 2026-02-13 | 13F | MAI Capital Management | 1.018 | 1,19 | 222 | 7,80 | ||||
| 2026-01-23 | 13F | Avion Wealth | 26 | 4,00 | 0 | |||||
| 2026-01-30 | 13F | Verity Asset Management, Inc. | 0 | -100,00 | 0 | |||||
| 2026-02-12 | 13F | Jane Street Group, Llc | 56.391 | 647,10 | 12.294 | 696,76 | ||||
| 2026-02-12 | 13F | Jane Street Group, Llc | Put | 18.100 | -35,13 | 3.946 | -30,81 | |||
| 2026-02-12 | 13F | Jane Street Group, Llc | Call | 32.600 | 409,38 | 7.107 | 443,35 | |||
| 2026-04-13 | 13F | Wedge Capital Management L L P/nc | 42.801 | 10,01 | 7.660 | -9,69 | ||||
| 2025-11-14 | 13F | Capstone Investment Advisors, Llc | 0 | -100,00 | 0 | |||||
| 2026-02-06 | 13F | EverSource Wealth Advisors, LLC | 456 | 8,31 | 99 | 15,12 | ||||
| 2025-11-07 | 13F | TCTC Holdings, LLC | 0 | -100,00 | 0 | |||||
| 2026-02-17 | 13F | Holocene Advisors, LP | 0 | -100,00 | 0 | |||||
| 2026-01-08 | 13F | Nordea Investment Management Ab | 9.201 | 187,08 | 2.039 | 211,15 | ||||
| 2026-02-09 | 13F | Huntington National Bank | 136 | 3,03 | 30 | 11,54 | ||||
| 2026-02-12 | 13F | DRW Securities, LLC | 1.029 | 224 | ||||||
| 2026-02-13 | 13F | Walleye Trading LLC | Call | 11.200 | 314,81 | 2.442 | 343,01 | |||
| 2026-02-13 | 13F | Walleye Trading LLC | 991 | -91,46 | 216 | -90,89 | ||||
| 2026-02-17 | 13F | Amundi | 132.394 | -0,67 | 28.865 | 4,70 | ||||
| 2026-02-13 | 13F | Johnson Investment Counsel Inc | 0 | -100,00 | 0 | |||||
| 2026-02-13 | 13F | Walleye Trading LLC | Put | 30.100 | -38,95 | 6.562 | -34,89 | |||
| 2026-02-17 | 13F | LMR Partners LLP | 2.097 | 457 | ||||||
| 2026-02-17 | 13F | Silvercrest Asset Management Group Llc | 1.458 | 0,00 | 318 | 6,38 | ||||
| 2026-02-05 | 13F | Park Square Financial Group, LLC | 39 | -32,76 | 7 | -45,45 | ||||
| 2026-02-17 | 13F | Cresset Asset Management, LLC | 0 | -100,00 | 0 | -100,00 | ||||
| 2026-02-13 | 13F | Walleye Capital LLC | Put | 4.100 | 310,00 | 894 | 337,75 | |||
| 2026-01-28 | 13F | Geneos Wealth Management Inc. | 74 | 48,00 | 16 | 60,00 | ||||
| 2026-02-13 | 13F | Walleye Capital LLC | 804 | 106,68 | 175 | 121,52 | ||||
| 2026-02-13 | 13F | Mufg Securities Americas Inc. | 1.488 | -2,17 | 324 | 4,52 | ||||
| 2026-02-13 | 13F | Walleye Capital LLC | Call | 800 | -85,71 | 174 | -84,79 | |||
| 2026-01-30 | 13F | Torren Management, LLC | 315 | 69 | ||||||
| 2026-02-11 | 13F | CLARET ASSET MANAGEMENT Corp | 1.287 | -0,23 | 0 | |||||
| 2025-11-14 | 13F | Point72 Asset Management, L.P. | 0 | -100,00 | 0 | -100,00 | ||||
| 2026-02-02 | 13F | Principal Financial Group Inc | 62.341 | 0,50 | 13.592 | 7,18 | ||||
| 2026-02-17 | 13F | Two Sigma Advisers, Lp | 1.700 | 371 | ||||||
| 2026-02-12 | 13F | MetLife Investment Management, LLC | 13.212 | -5,32 | 2.880 | 0,98 | ||||
| 2026-02-04 | 13F | HighPoint Advisor Group LLC | 0 | -100,00 | 0 | |||||
| 2026-02-17 | 13F/A | RBF Capital, LLC | 10.000 | 0,00 | 2.180 | 6,65 | ||||
| 2026-04-22 | 13F | Cornerstone Wealth Group, LLC | 0 | -100,00 | 0 | |||||
| 2025-10-31 | 13F | Symphony Financial, Ltd. Co. | 0 | -100,00 | 0 | -100,00 | ||||
| 2026-02-13 | 13F | Aigen Investment Management, Lp | 0 | -100,00 | 0 | |||||
| 2026-02-12 | 13F | Scotia Capital Inc. | 6.533 | 1.424 | ||||||
| 2026-02-17 | 13F | Occudo Quantitative Strategies Lp | 5.967 | 1.301 | ||||||
| 2026-04-21 | 13F | PharVision Advisers, LLC | 0 | -100,00 | 0 | |||||
| 2026-01-30 | 13F | New York State Teachers Retirement System | 55.456 | -5,37 | 12 | 9,09 | ||||
| 2026-04-08 | 13F | DiNuzzo Private Wealth, Inc. | 17 | 6,25 | 3 | 0,00 | ||||
| 2026-02-13 | 13F | Boston Partners | 57.878 | -14,37 | 12.618 | -8,68 | ||||
| 2026-02-13 | 13F | Rhumbline Advisers | 122.169 | -6,46 | 26.635 | -0,25 | ||||
| 2026-01-30 | 13F | Precision Wealth Strategies, LLC | 3.746 | 175,85 | 817 | 194,58 | ||||
| 2026-02-09 | 13F | Fisher Asset Management, LLC | 0 | -100,00 | 0 | |||||
| 2026-02-17 | 13F | Janus Henderson Group Plc | 4.909 | 2,25 | 1.070 | 8,86 | ||||
| 2026-02-03 | 13F | Mitsubishi UFJ Kokusai Asset Management Co., Ltd. | 119.385 | 5,31 | 26.250 | 13,27 | ||||
| 2026-02-12 | 13F | Hrt Financial Lp | 54.344 | 194,12 | 12 | 266,67 | ||||
| 2025-11-14 | 13F | Texas Permanent School Fund | 0 | -100,00 | 0 | |||||
| 2026-02-06 | 13F | Global Retirement Partners, LLC | 1.687 | 31,80 | 368 | 40,61 | ||||
| 2026-02-13 | 13F | Macquarie Group Ltd | 17.246 | -38,19 | 3.760 | -34,09 | ||||
| 2026-02-09 | 13F | Mediolanum International Funds Ltd | 13.303 | 16,98 | 2.994 | 30,93 | ||||
| 2026-01-28 | 13F | CAPROCK Group, Inc. | 11.200 | 155,13 | 2.442 | 206,27 | ||||
| 2026-04-07 | 13F | Carolina Wealth Advisors, LLC | 0 | -100,00 | 0 | |||||
| 2026-01-14 | 13F | ORG Partners LLC | 78 | 358,82 | 17 | 466,67 | ||||
| 2026-01-29 | 13F | Rakuten Securities, Inc. | 1 | -97,14 | 0 | -100,00 | ||||
| 2026-04-17 | 13F | Vermillion Wealth Management, Inc. | 4 | 1 | ||||||
| 2026-04-16 | 13F | SG Americas Securities, LLC | Call | 0 | -100,00 | 0 | ||||
| 2026-04-16 | 13F | Capital Investment Advisors, LLC | 1.128 | 0,27 | 202 | -17,96 | ||||
| 2026-04-20 | 13F | Ritholtz Wealth Management | 7.977 | 36,27 | 1.428 | 11,83 | ||||
| 2026-02-13 | 13F | Police & Firemen's Retirement System of New Jersey | 22.738 | -5,75 | 4.957 | 0,51 | ||||
| 2026-01-20 | 13F | Nvwm, Llc | 1 | 0,00 | 0 | |||||
| 2026-02-12 | 13F | Principal Securities, Inc. | 6.652 | 28,67 | 1.450 | 37,31 | ||||
| 2026-02-17 | 13F | Grantham, Mayo, Van Otterloo & Co. LLC | 40.879 | -9,25 | 8.912 | -3,23 | ||||
| 2025-11-14 | 13F | Mbb Public Markets I Llc | 0 | -100,00 | 0 | |||||
| 2026-02-13 | 13F | Quarry LP | 1.900 | 414 | ||||||
| 2026-02-17 | 13F | Citadel Advisors Llc | 15.445 | -97,72 | 3.367 | -97,57 | ||||
| 2026-02-10 | 13F | Fideuram Asset Management (Ireland) dac | 32 | 6 | ||||||
| 2026-02-10 | 13F/A | Northwestern Mutual Wealth Management Co | 1.549 | -13,66 | 338 | -7,92 | ||||
| 2026-02-10 | 13F | New Mexico Educational Retirement Board | 2.650 | 3,92 | 1 | |||||
| 2026-02-02 | 13F | Truist Financial Corp | 3.925 | -6,86 | 856 | -0,70 | ||||
| 2026-02-05 | 13F | Bessemer Group Inc | 1.917 | -13,53 | 0 | |||||
| 2025-10-27 | 13F | First Horizon Corp | 0 | -100,00 | 0 | |||||
| 2026-02-13 | 13F | Exome Asset Management LLC | 17.628 | 121,60 | 3.843 | 136,35 | ||||
| 2026-04-24 | 13F | Retirement Systems of Alabama | 11.729 | -0,19 | 2.099 | -18,04 | ||||
| 2026-02-17 | 13F | Tudor Investment Corp Et Al | Put | 0 | -100,00 | 0 | -100,00 | |||
| 2026-02-17 | 13F | Dv Equities, Llc | 78 | 17 | ||||||
| 2026-01-28 | 13F | Arizona State Retirement System | 15.590 | -7,96 | 3.399 | -1,88 | ||||
| 2026-01-29 | 13F | Supplemental Annuity Collective Trust of NJ | 1.000 | 0,00 | 218 | 6,86 | ||||
| 2026-02-09 | 13F | Onefund, Llc | 177 | 3,51 | 39 | 11,76 | ||||
| 2025-11-14 | 13F | Cubist Systematic Strategies, LLC | 0 | -100,00 | 0 | -100,00 | ||||
| 2026-04-14 | 13F | Bay Harbor Wealth Management, LLC | 12 | 20,00 | 2 | 0,00 | ||||
| 2026-01-30 | 13F/A | M&t Bank Corp | 3.172 | 121,20 | 692 | 136,64 | ||||
| 2026-02-17 | 13F | Citadel Advisors Llc | Put | 59.500 | -16,67 | 12.972 | -11,13 | |||
| 2026-02-17 | 13F | Citadel Advisors Llc | Call | 52.300 | 52,48 | 11.402 | 62,61 | |||
| 2026-02-02 | 13F | Qrg Capital Management, Inc. | 1.670 | 18,86 | 364 | 26,83 | ||||
| 2026-02-11 | 13F | Cookson Peirce & Co Inc | 3.521 | 768 | ||||||
| 2026-02-17 | 13F | EFG International AG | 2.197 | 479 | ||||||
| 2026-02-09 | 13F | Hantz Financial Services, Inc. | 70 | 100,00 | 0 | |||||
| 2026-02-12 | 13F | Skandinaviska Enskilda Banken AB (publ) | 29.492 | 2,69 | 6.430 | 9,50 | ||||
| 2026-04-24 | 13F | Optas, LLC | 0 | -100,00 | 0 | |||||
| 2026-01-07 | 13F | Sagespring Wealth Partners, Llc | 1.293 | 282 | ||||||
| 2026-01-23 | 13F | Transcend Wealth Collective, Llc | 2.434 | 35,98 | 531 | 45,21 | ||||
| 2026-02-12 | 13F | Colonial Trust Co / SC | 1 | 0,00 | 0 | |||||
| 2026-02-13 | 13F | Kestra Advisory Services, LLC | 0 | -100,00 | 0 | |||||
| 2026-02-06 | 13F | Saranac Partners Ltd | 0 | -100,00 | 0 | |||||
| 2026-02-17 | 13F | NEOS Investment Management LLC | 2.286 | 77,62 | 498 | 89,35 | ||||
| 2026-02-17 | 13F | MIRAE ASSET GLOBAL ETFS HOLDINGS Ltd. | 21.295 | -17,48 | 4.643 | -12,00 | ||||
| 2026-02-03 | 13F | Hemenway Trust Co LLC | 1.200 | 0,00 | 262 | 6,53 | ||||
| 2026-04-17 | 13F | Paragon Capital Management Inc | 6.831 | -2,37 | 1.223 | -19,87 | ||||
| 2026-02-12 | 13F | California Public Employees Retirement System | 100.696 | -4,11 | 21.954 | 2,26 | ||||
| 2026-01-13 | 13F | Team Financial Group, LLC | 262 | 0,00 | 57 | 7,55 | ||||
| 2026-01-27 | 13F | WealthCollab, LLC | 263 | 2,33 | 57 | 9,62 | ||||
| 2026-02-13 | 13F | Sienna Gestion | 0 | -100,00 | 0 | |||||
| 2026-02-17 | 13F | Vinva Investment Management Ltd | 108.776 | 69,66 | 24.481 | 89,91 | ||||
| 2026-02-17 | 13F | Summit Global Investments | 2.119 | -0,33 | 0 | |||||
| 2026-02-19 | 13F | CI Private Wealth, LLC | 162.985 | 348,71 | 10.317 | 38,94 | ||||
| 2026-04-21 | 13F | GHP Investment Advisors, Inc. | 35.359 | -0,21 | 6.328 | -18,08 | ||||
| 2026-02-13 | 13F | Panagora Asset Management Inc | 7.695 | -6,20 | 1.678 | 0,00 | ||||
| 2026-01-21 | 13F | New Wave Wealth Advisors Llc | 1.447 | 2,99 | 315 | 9,76 | ||||
| 2026-02-10 | 13F | Goldman Sachs Group Inc | 1.241.730 | -16,10 | 270.722 | -10,52 | ||||
| 2026-03-06 | 13F | Hsbc Holdings Plc | 119.561 | 33,08 | 26.136 | 42,34 | ||||
| 2026-04-09 | 13F | Acropolis Investment Management, LLC | 1.361 | 0,00 | 244 | -17,91 | ||||
| 2026-04-17 | 13F | Bell Investment Advisors, Inc | 35 | 0,00 | 6 | -14,29 | ||||
| 2026-01-26 | 13F | Private Trust Co Na | 224 | 229,41 | 49 | 269,23 | ||||
| 2026-02-05 | 13F | Gamco Investors, Inc. Et Al | 2.057 | -1,20 | 448 | 5,41 | ||||
| 2026-02-18 | 13F | First Citizens Bank & Trust Co | 56.177 | 2,21 | 12.248 | 9,00 | ||||
| 2026-02-05 | 13F | Passumpsic Savings Bank | 0 | -100,00 | 0 | |||||
| 2026-04-17 | 13F | CENTRAL TRUST Co | 174 | 107,14 | 31 | 72,22 | ||||
| 2026-02-04 | 13F | Dogwood Wealth Management LLC | 9 | 0,00 | 2 | 0,00 | ||||
| 2026-02-13 | 13F | Nfj Investment Group, Llc | 116.627 | -14,08 | 25.427 | -8,37 | ||||
| 2026-02-13 | 13F | FORA Capital, LLC | 2.004 | 437 | ||||||
| 2026-02-13 | 13F | Williams Jones Wealth Management, LLC. | 8.019 | 0,00 | 1.748 | 6,65 | ||||
| 2026-02-17 | 13F | Balyasny Asset Management Llc | 1.309 | -4,31 | 285 | 2,15 | ||||
| 2026-02-13 | 13F | Rafferty Asset Management, LLC | 5.947 | -5,03 | 1.297 | 1,25 | ||||
| 2026-04-20 | 13F | Moody Aldrich Partners Llc | 9.723 | 0,00 | 1.740 | -17,89 | ||||
| 2025-11-07 | 13F | Shell Asset Management Co | 0 | -100,00 | 0 | |||||
| 2026-04-27 | 13F | Sound Income Strategies, LLC | 5 | 0,00 | 1 | |||||
| 2026-02-03 | 13F | We Are One Seven, LLC | 1.056 | -9,74 | 230 | -3,77 | ||||
| 2026-02-03 | 13F | Luken Investment Analytics, LLC | 1 | 0 | ||||||
| 2026-02-11 | 13F | Ing Groep Nv | 7.138 | -2,09 | 1.556 | 4,43 | ||||
| 2026-04-10 | 13F | Quaker Wealth Management, LLC | 2 | 0 | ||||||
| 2026-01-15 | 13F | Royal Fund Management, LLC | 4.588 | 1.000 | ||||||
| 2026-02-03 | 13F | Navigoe, LLC | 5 | 0,00 | 0 | |||||
| 2026-02-17 | 13F | Voloridge Investment Management, Llc | 286.481 | 8,27 | 62.459 | 15,46 | ||||
| 2026-02-10 | 13F | Baker Avenue Asset Management, LP | 2.555 | 46,33 | 557 | 56,46 | ||||
| 2026-02-10 | 13F | Daiwa Securities Group Inc. | 8.941 | -0,37 | 2 | 0,00 | ||||
| 2026-01-21 | 13F | Greenleaf Trust | 1.410 | 0,00 | 307 | 6,60 | ||||
| 2026-04-15 | 13F | Trust Co Of Toledo Na /oh/ | 1.200 | 0,00 | 215 | -18,01 | ||||
| 2026-04-20 | 13F | Inscription Capital, LLC | 5.452 | -4,95 | 976 | -22,00 | ||||
| 2026-02-05 | 13F | Stephens Inc /ar/ | 1.235 | -1,20 | 269 | 5,49 | ||||
| 2026-02-04 | 13F | Westport Asset Management Inc | 65.059 | 0,00 | 13.301 | 0,00 | ||||
| 2026-01-30 | 13F | American Capital Advisory, LLC | 1 | 0,00 | 0 | |||||
| 2026-02-24 | 13F | SG Trading Solutions, LLC | 1.039 | 0 | ||||||
| 2026-04-20 | 13F | CWA Asset Management Group, LLC | 1.174 | 7,51 | 210 | -11,76 | ||||
| 2026-01-15 | 13F | Nisa Investment Advisors, Llc | 28.573 | 217,06 | 6.229 | 238,17 | ||||
| 2026-01-26 | 13F | Childress Capital Advisors, Llc | 1.094 | 239 | ||||||
| 2026-02-02 | 13F | Nkcfo Llc | 260 | 0 | ||||||
| 2026-02-17 | 13F | Public Employees Retirement System Of Ohio | 20.683 | -2,64 | 4.509 | 3,82 | ||||
| 2026-02-10 | 13F | Kesler, Norman & Wride, LLC | 5.051 | 52,92 | 1.101 | 85,98 | ||||
| 2026-02-13 | 13F | Arrowstreet Capital, Limited Partnership | 1.206.000 | 7,13 | 262.932 | 14,24 | ||||
| 2026-04-03 | 13F | Investors Research Corp | 23 | 0,00 | 4 | -20,00 | ||||
| 2026-02-05 | 13F | Elyxium Wealth, LLC | 116 | 25 | ||||||
| 2026-02-13 | 13F | Cornerstone Financial Management LLC | 7 | 2 | ||||||
| 2026-01-30 | 13F | Camden Capital, LLC | 1.893 | 56,84 | 413 | 67,48 | ||||
| 2026-02-17 | 13F | Dean Investment Associates, Llc | 5.743 | -1,91 | 1.252 | 4,68 | ||||
| 2025-11-14 | 13F | Point72 Hong Kong Ltd | 0 | -100,00 | 0 | |||||
| 2026-02-17 | 13F | Aqr Capital Management Llc | 623.936 | -8,97 | 136.031 | -2,40 | ||||
| 2026-02-12 | 13F | Commonwealth Equity Services, Llc | 2.773 | -19,44 | 604 | |||||
| 2026-02-11 | 13F | Meeder Asset Management Inc | 17.059 | 74,71 | 3.719 | 86,32 | ||||
| 2026-02-17 | 13F | PFM Health Sciences, LP | 57.409 | -50,62 | 12.516 | -47,34 | ||||
| 2026-01-22 | 13F | V-Square Quantitative Management LLC | 1.278 | 279 | ||||||
| 2026-02-13 | 13F | First Trust Advisors Lp | 190.499 | -0,24 | 41.533 | 6,38 | ||||
| 2025-11-14 | 13F | Scientech Research LLC | 0 | -100,00 | 0 | |||||
| 2026-04-14 | 13F | Nova Wealth Management, Inc. | 7 | 0,00 | 1 | 0,00 | ||||
| 2026-02-17 | 13F | XTX Topco Ltd | 16.832 | 3.670 | ||||||
| 2025-11-14 | 13F | Centiva Capital, LP | 0 | -100,00 | 0 | |||||
| 2025-11-13 | 13F | Glenmede Investment Management, LP | 1.512 | -6,67 | 309 | 5,46 | ||||
| 2026-04-16 | 13F | BI Asset Management Fondsmaeglerselskab A/S | 3.308 | 1 | ||||||
| 2026-01-23 | 13F | Howard Capital Management Inc. | 23.450 | 0,00 | 5.113 | 6,63 | ||||
| 2026-02-17 | 13F | Norinchukin Bank, The | 2.865 | 3,54 | 625 | 10,44 | ||||
| 2026-02-17 | 13F | Summit Trail Advisors, Llc | 9.934 | 26,19 | 2.166 | 34,56 | ||||
| 2026-02-02 | 13F | Montag A & Associates Inc | 286 | 0,00 | 62 | 6,90 | ||||
| 2026-01-30 | 13F | Levin Capital Strategies, L.p. | 8.000 | -1,38 | 1.744 | 5,19 | ||||
| 2026-04-08 | 13F | NorthCrest Asset Manangement, LLC | 0 | -100,00 | 0 | |||||
| 2026-04-10 | 13F | Linden Thomas Advisory Services, LLC | 5.902 | 0,72 | 1.056 | -17,31 | ||||
| 2026-02-13 | 13F | Natixis | 15.446 | 47,15 | 3.368 | 56,90 | ||||
| 2026-01-28 | 13F | HB Wealth Management, LLC | 1.659 | 14,18 | 362 | 21,55 | ||||
| 2026-01-23 | 13F | Optima Capital Llc | 9 | 2 | ||||||
| 2026-02-18 | 13F | Vident Advisory, LLC | 1.094 | -8,76 | 239 | -2,86 | ||||
| 2026-01-23 | 13F | Assetmark, Inc | 535 | 4,29 | 117 | 11,54 | ||||
| 2026-02-12 | 13F | Federation des caisses Desjardins du Quebec | 21.010 | 75,89 | 4.581 | 87,55 | ||||
| 2026-02-13 | 13F | Laraway Financial Inc | 3.150 | 0,00 | 687 | 6,69 | ||||
| 2026-02-13 | 13F | Platinum Investment Management Ltd | 285 | -81,42 | 62 | -80,19 | ||||
| 2026-04-20 | 13F | Louisiana State Employees Retirement System | 2.800 | 0,00 | 501 | -17,87 | ||||
| 2026-02-13 | 13F | Mml Investors Services, Llc | 9.224 | 34,93 | 2.011 | 43,95 | ||||
| 2026-02-17 | 13F | Ancora Advisors, LLC | 140 | 31 | ||||||
| 2026-01-30 | 13F | Turning Point Benefit Group, Inc. | 1 | 0,00 | 0 | |||||
| 2026-04-24 | 13F | Secured Retirement Advisors, Llc | 0 | -100,00 | 0 | |||||
| 2026-02-10 | 13F | Intech Investment Management Llc | 9.682 | -81,39 | 2.111 | -80,17 | ||||
| 2026-04-17 | 13F | Brown, Lisle/cummings, Inc. | 121 | 27,37 | 22 | 5,00 | ||||
| 2026-04-21 | 13F | Foster & Motley Inc | 2.440 | 0,00 | 0 | |||||
| 2026-01-27 | 13F | Deroy & Devereaux Private Investment Counsel Inc | 34.275 | -2,97 | 7 | 0,00 | ||||
| 2026-01-26 | 13F | Moran Wealth Management, LLC | 48.908 | 45,24 | 10.663 | 54,88 | ||||
| 2026-01-30 | 13F | Renasant Bank | 1.068 | 233 | ||||||
| 2026-02-11 | 13F | Prestige Wealth Management Group LLC | 51 | 0,00 | 11 | 10,00 | ||||
| 2026-02-09 | 13F | Jefferies Financial Group Inc. | 32.721 | 45,09 | 7.134 | 54,73 | ||||
| 2026-04-15 | 13F | Radnor Capital Management, LLC | 10.525 | -4,10 | 1.884 | -21,28 | ||||
| 2026-01-26 | 13F | Whittier Trust Co | 360 | 0,00 | 80 | 6,76 | ||||
| 2026-02-11 | 13F | Hughes Financial Services, LLC | 44 | 2,33 | 10 | 0,00 | ||||
| 2026-02-12 | 13F | Wealthspire Advisors, LLC | 0 | -100,00 | 0 | |||||
| 2026-04-22 | 13F | Sterling Capital Management LLC | 11.848 | -12,39 | 2.120 | -28,09 | ||||
| 2026-04-14 | 13F | Congress Park Capital LLC | 1.125 | 0,00 | 201 | -17,96 | ||||
| 2026-02-11 | 13F | Jpmorgan Chase & Co | 168.740 | -27,92 | 36.789 | -23,13 | ||||
| 2026-02-11 | 13F | Commonwealth Retirement Investments LLC | 100 | 22 | ||||||
| 2026-02-17 | 13F | Wellington Management Group Llp | 94.797 | 1,87 | 20.668 | 8,64 | ||||
| 2026-02-10 | 13F | Globeflex Capital L P | 44.538 | 0,00 | 9.710 | 6,64 | ||||
| 2026-02-13 | 13F | State Street Corp | 2.605.694 | 0,11 | 568.093 | 6,76 | ||||
| 2026-02-09 | 13F | Quest Partners LLC | 11.425 | 49,90 | 2.491 | 59,82 | ||||
| 2025-11-25 | 13F | Briaud Financial Planning, Inc | 0 | -100,00 | 0 | |||||
| 2026-02-05 | 13F | Applied Finance Capital Management, LLC | 0 | -100,00 | 0 | |||||
| 2026-02-26 | 13F | Anchor Investment Management, LLC | 47 | 0,00 | 10 | 11,11 | ||||
| 2026-02-05 | 13F | Amalgamated Bank | 11.039 | 2,55 | 2 | 0,00 | ||||
| 2026-02-11 | 13F | Picton Mahoney Asset Management | 1.640 | 32.700,00 | 358 | |||||
| 2026-02-17 | 13F | Schonfeld Strategic Advisors LLC | 0 | -100,00 | 0 | |||||
| 2026-04-06 | 13F | CX Institutional | 1.132 | 0,27 | 0 | |||||
| 2026-02-10 | 13F | Principia Wealth Advisory, LLC | 3 | 0,00 | 1 | |||||
| 2026-02-09 | 13F | Beck Bode, LLC | 3.025 | -4,39 | 660 | 2,01 | ||||
| 2026-02-11 | 13F | Rise Advisors, LLC | 0 | -100,00 | 0 | |||||
| 2026-02-17 | 13F | Freestone Grove Partners LP | 66.834 | -59,20 | 14.571 | -56,49 | ||||
| 2025-11-14 | 13F | Prana Capital Management, LP | 0 | -100,00 | 0 | -100,00 | ||||
| 2026-02-04 | 13F | Virginia Retirement Systems Et Al | 473.822 | 17,68 | 103.303 | 25,50 | ||||
| 2026-02-05 | 13F | Mount Lucas Management LP | 4.043 | 0,75 | 881 | 7,44 | ||||
| 2026-02-03 | 13F | SBI Securities Co., Ltd. | 405 | 221,43 | 89 | 252,00 | ||||
| 2026-02-04 | 13F | Swiss Life Asset Management Ltd | 5.946 | 10,38 | 1.296 | 17,71 | ||||
| 2026-04-21 | 13F | Venturi Wealth Management, LLC | 0 | -100,00 | 0 | |||||
| 2026-04-24 | 13F | UMA Financial Services, Inc. | 30 | 15,38 | 5 | 0,00 | ||||
| 2026-02-13 | 13F | Mariner, LLC | 12.685 | 35,03 | 2.785 | 45,05 | ||||
| 2026-02-13 | 13F | Banco Santander, S.A. | 8.010 | 1.746 | ||||||
| 2026-02-17 | 13F | Lighthouse Investment Partners, LLC | 0 | -100,00 | 0 | |||||
| 2026-02-11 | 13F | SOUTH STATE Corp | 5 | 0,00 | 1 | 0,00 | ||||
| 2026-02-18 | 13F | Achmea Investment Management B.V. | 0 | -100,00 | 0 | |||||
| 2026-01-21 | 13F | Newbridge Financial Services Group, Inc. | 251 | 55 | ||||||
| 2026-02-06 | 13F | HighTower Advisors, LLC | 13.501 | 0,32 | 2.943 | 6,98 | ||||
| 2026-04-24 | 13F | Pzena Investment Management Llc | 1.912.235 | -9,48 | 342.233 | -25,70 | ||||
| 2026-04-10 | 13F | Oak Thistle LLC | 21.629 | 130,07 | 3.871 | 88,87 | ||||
| 2026-02-17 | 13F | Varenne Capital Partners | 33.940 | -81,58 | 7.403 | -80,35 | ||||
| 2026-02-11 | 13F | Metis Global Partners, LLC | 1.791 | -7,92 | 390 | -1,76 | ||||
| 2026-02-17 | 13F | Magnetar Financial LLC | 15.589 | 3.399 | ||||||
| 2026-04-23 | 13F | SJS Investment Consulting Inc. | 221 | -5,96 | 40 | -23,53 | ||||
| 2026-04-21 | 13F | Founders Capital Management | 128 | 0,00 | 23 | -18,52 | ||||
| 2026-02-13 | 13F | National Bank Of Canada /fi/ | 36.710 | 2,62 | 8.003 | 9,44 | ||||
| 2026-02-18 | 13F | Caitlin John, LLC | 0 | -100,00 | 0 | -100,00 | ||||
| 2026-04-07 | 13F | Signaturefd, Llc | 1.193 | 40,19 | 214 | 15,14 | ||||
| 2026-02-12 | 13F | CIBC Private Wealth Group, LLC | 2.157 | 5,68 | 470 | 12,71 | ||||
| 2026-02-12 | 13F | Brinker Capital Investments, LLC | 0 | -100,00 | 0 | |||||
| 2026-02-13 | 13F | Ieq Capital, Llc | 40.870 | 26,10 | 8.911 | 34,49 | ||||
| 2025-11-03 | 13F | Great Lakes Advisors, Llc | 0 | -100,00 | 0 | |||||
| 2026-04-15 | 13F | Gf Fund Management Co. Ltd. | 1.539 | 0,00 | 275 | -17,91 | ||||
| 2026-01-22 | 13F | Personal Cfo Solutions, Llc | 4.293 | -9,10 | 936 | -3,11 | ||||
| 2026-02-02 | 13F | Benjamin Edwards Inc | 2.067 | 35,27 | 451 | 44,23 | ||||
| 2025-11-13 | 13F | GeoWealth Management, LLC | 0 | -100,00 | 0 | |||||
| 2026-02-13 | 13F | Squarepoint Ops LLC | Put | 10.800 | 414,29 | 2.355 | 448,72 | |||
| 2026-02-13 | 13F | Squarepoint Ops LLC | 1.472 | -2,13 | 321 | 4,23 | ||||
| 2026-04-16 | 13F | Capital Advisors, Ltd. LLC | 47 | 0,00 | 0 | |||||
| 2026-04-23 | 13F | Marquette Asset Management, LLC | 12 | 140,00 | 2 | 100,00 | ||||
| 2026-02-09 | 13F | Keating Financial Advisory Services, Inc. | 35 | 8 | ||||||
| 2026-02-13 | 13F | Squarepoint Ops LLC | Call | 1.900 | -84,43 | 414 | -83,40 | |||
| 2026-02-05 | 13F | Leuthold Group, Llc | 21.072 | 12,70 | 4.594 | 20,20 | ||||
| 2026-02-11 | 13F | Jpmorgan Chase & Co | Call | 0 | -100,00 | 0 | -100,00 | |||
| 2026-01-30 | 13F | AMG National Trust Bank | 9.581 | 2,47 | 2.089 | 9,26 | ||||
| 2026-02-12 | 13F | Ci Investments Inc. | 0 | -100,00 | 0 | |||||
| 2026-02-12 | 13F | Campbell & CO Investment Adviser LLC | 0 | -100,00 | 0 | |||||
| 2026-04-14 | 13F | Nbc Securities, Inc. | 8.437 | 8,26 | 1.510 | -11,18 | ||||
| 2026-04-22 | 13F | Horizon Advisory Services, Inc. | 1.627 | -3,33 | 291 | -20,49 | ||||
| 2026-02-13 | 13F | Manufacturers Life Insurance Company, The | 0 | -100,00 | 0 | |||||
| 2026-02-17 | 13F | Hotchkis & Wiley Capital Management Llc | 31.205 | -30,84 | 6.803 | -26,25 | ||||
| 2026-02-10 | 13F | Acadian Asset Management Llc | 10.918 | 1.719,67 | 2 | |||||
| 2026-01-16 | 13F | RHS Financial, LLC | 1.397 | -2,03 | 305 | 4,47 | ||||
| 2025-11-14 | 13F | Balyasny Asset Management Llc | Call | 0 | -100,00 | 0 | -100,00 | |||
| 2026-04-06 | 13F | Highline Wealth Partners Llc | 5 | 0,00 | 1 | -100,00 | ||||
| 2026-01-29 | 13F | UBS Group AG | 158.294 | -60,61 | 34.511 | -58,00 | ||||
| 2026-04-22 | 13F | Pictet Asset Management Holding SA | 26.576 | -6,04 | 4.766 | -23,10 | ||||
| 2026-02-12 | 13F | Bank Of Montreal /can/ | 53.258 | -15,09 | 11.611 | -9,44 | ||||
| 2026-04-13 | 13F | Clayton Financial Group LLC | 10 | 0,00 | 2 | -50,00 | ||||
| 2026-02-14 | 13F | Rockefeller Capital Management L.P. | 1.298 | 22,68 | 283 | 31,02 | ||||
| 2026-04-17 | 13F | Krilogy Financial LLC | 0 | -100,00 | 0 | |||||
| 2026-02-13 | 13F | Golden State Wealth Management, LLC | 32 | 0,00 | 7 | 0,00 | ||||
| 2026-01-29 | 13F | State Of Michigan Retirement System | 16.374 | -4,66 | 3.570 | 1,65 | ||||
| 2026-02-13 | 13F | Morgan Stanley | 871.377 | 59,53 | 189.978 | 70,13 | ||||
| 2026-02-12 | 13F | Dimensional Fund Advisors Lp | 1.588.911 | 6,32 | 346.447 | 13,40 | ||||
| 2026-02-11 | 13F | Havemeyer Place LP | 694 | 151 | ||||||
| 2026-01-12 | 13F | CVA Family Office, LLC | 2 | 0 | ||||||
| 2026-02-17 | 13F | DV Trading LLC | 106 | 23 | ||||||
| 2026-02-17 | 13F | TCG Advisory Services, LLC | 1.851 | 20,51 | 404 | 28,34 | ||||
| 2026-04-14 | 13F | Zrc Wealth Management, Llc | 32 | 28,00 | 6 | 0,00 | ||||
| 2025-11-07 | 13F | Gsa Capital Partners Llp | 0 | -100,00 | 0 | |||||
| 2026-02-17 | 13F | D. E. Shaw & Co., Inc. | 36.106 | 48,75 | 7.872 | 58,63 | ||||
| 2026-02-17 | 13F | Delaware Management Holdings, Inc. | 12.900 | 2.812 | ||||||
| 2026-02-17 | 13F | Northern Trust Corp | 527.226 | -1,58 | 114.946 | 4,96 | ||||
| 2026-01-05 | 13F | Catherine Avery Investment Management LLC | 21 | 0,00 | 5 | 0,00 | ||||
| 2026-02-17 | 13F | Cambria Investment Management, L.P. | 38.738 | -26,65 | 8.446 | -21,78 | ||||
| 2025-11-04 | 13F | Ogorek Anthony Joseph /ny/ /adv | 0 | -100,00 | 0 | |||||
| 2026-02-13 | 13F | Garrison Point Advisors, Llc | 5.155 | -2,55 | 1.124 | 3,89 | ||||
| 2026-01-30 | 13F | Us Bancorp \de\ | 2.628 | 2,18 | 573 | 8,95 | ||||
| 2026-04-08 | 13F | Wealth Enhancement Advisory Services, Llc | 10.983 | -8,38 | 1.941 | -26,96 | ||||
| 2025-11-14 | 13F | Binnacle Investments Inc | 16 | 60,00 | 3 | 200,00 | ||||
| 2026-02-17 | 13F | Quantinno Capital Management LP | 326.010 | 70,78 | 71.077 | 82,12 | ||||
| 2026-04-15 | 13F | Exchange Traded Concepts, Llc | 99.462 | 73,17 | 17.801 | 42,15 | ||||
| 2026-04-15 | 13F | Family Legacy Financial Solutions, LLC | 0 | -100,00 | 0 | |||||
| 2026-02-09 | 13F | Legal & General Group Plc | 217.122 | -9,16 | 47.337 | -3,12 | ||||
| 2026-02-10 | 13F | Core Wealth Advisors, Llc | 9 | 2 | ||||||
| 2026-02-05 | 13F | AustralianSuper Pty Ltd | 222.638 | -1,07 | 48.540 | 5,51 | ||||
| 2026-02-13 | 13F | Bridgefront Capital, LLC | 2.544 | 555 | ||||||
| 2026-02-04 | 13F | Oregon Public Employees Retirement Fund | 6.344 | -0,92 | 1.383 | 5,65 | ||||
| 2026-02-11 | 13F | Twin Tree Management, LP | Put | 80.600 | 68,62 | 17.572 | 79,82 | |||
| 2026-02-11 | 13F | Twin Tree Management, LP | 3.765 | 821 | ||||||
| 2026-02-10 | 13F | Railway Pension Investments Ltd | 96.700 | 0,00 | 21.083 | 6,64 | ||||
| 2026-04-20 | 13F | Greenup Street Wealth Management Llc | 1.304 | 0,08 | 233 | -17,67 | ||||
| 2026-01-27 | 13F | Sterling Group Wealth Management, LLC | 4.957 | 0,00 | 1.081 | 6,61 | ||||
| 2026-02-09 | 13F | Hartland & Co., LLC | 28 | -77,60 | 6 | -76,00 | ||||
| 2026-02-17 | 13F | SageView Advisory Group, LLC | 296 | 65 | ||||||
| 2026-02-05 | 13F | Chase Investment Counsel Corp | 4.402 | 21,40 | 1 | |||||
| 2026-04-16 | 13F | Triad Wealth Partners, LLC | 1.858 | 3,39 | 333 | -15,09 | ||||
| 2026-02-17 | 13F | Alliancebernstein L.p. | 76.729 | -29,50 | 16.728 | -24,82 | ||||
| 2026-02-10 | 13F | Mutual Of America Capital Management Llc | 5.921 | -2,98 | 1.291 | 3,45 | ||||
| 2026-02-12 | 13F | BRYN MAWR TRUST Co | 0 | -100,00 | 0 | -100,00 | ||||
| 2026-02-17 | 13F | Watershed Asset Management, L.L.C. | 1.992 | 12,48 | 434 | 61,34 | ||||
| 2026-04-22 | 13F | WestEnd Advisors, LLC | 1 | 0,00 | 0 | |||||
| 2026-04-27 | 13F | Leonteq Securities AG | 35 | 34,62 | 6 | 20,00 | ||||
| 2026-02-12 | 13F | Nuveen, LLC | 128.833 | -8,44 | 28.088 | -2,36 | ||||
| 2026-02-17 | 13F | Voleon Capital Management Lp | 12.040 | -51,20 | 2.625 | -47,98 | ||||
| 2026-01-26 | 13F | Cwm, Llc | 14.212 | 5,79 | 3 | 50,00 | ||||
| 2026-02-17 | 13F | Numerai GP LLC | 1.189 | 259 | ||||||
| 2026-01-28 | 13F | WPG Advisers, LLC | 41 | 0,00 | 9 | 0,00 | ||||
| 2026-04-07 | 13F | CoreCap Advisors, LLC | 4 | -55,56 | 1 | -100,00 | ||||
| 2026-02-13 | 13F | American Century Companies Inc | 643.372 | -17,64 | 140.268 | -12,17 | ||||
| 2026-02-17 | 13F | Glenmede Trust Co Na | 1.507 | -1,57 | 329 | 14,29 | ||||
| 2026-02-13 | 13F | Martingale Asset Management L P | 30.481 | -0,97 | 6.645 | 5,61 | ||||
| 2026-02-17 | 13F | Humankind Investments LLC | 0 | -100,00 | 0 | |||||
| 2026-02-10 | 13F | Basepoint Wealth LLC | 314 | 68 | ||||||
| 2026-04-20 | 13F | Kestra Private Wealth Services, Llc | 1.361 | 5,42 | 244 | -13,52 | ||||
| 2026-02-06 | 13F | Handelsbanken Fonder AB | 14.800 | 0,00 | 3 | 0,00 | ||||
| 2026-02-17 | 13F | Brevan Howard Capital Management LP | 20.381 | 14,45 | 4.443 | 22,06 | ||||
| 2026-01-28 | 13F | Ruffer LLP | 0 | -100,00 | 0 | |||||
| 2026-02-13 | 13F | Seneschal Advisors, LLC | 2 | 0,00 | 0 | |||||
| 2026-02-04 | 13F | Sentry Investment Management Llc | 157 | 0,00 | 0 | |||||
| 2026-02-17 | 13F | Snowden Capital Advisors LLC | 1.523 | -1,87 | 332 | 4,73 | ||||
| 2026-02-17 | 13F | Quantitative Investment Management, LLC | 0 | -100,00 | 0 | |||||
| 2026-02-03 | 13F | Bokf, Na | 10.173 | -5,67 | 2.218 | 0,59 | ||||
| 2026-02-06 | 13F | Tortoise Investment Management, LLC | 0 | -100,00 | 0 | |||||
| 2026-01-28 | 13F | Teacher Retirement System Of Texas | 137.575 | 380,29 | 29.994 | 412,28 | ||||
| 2026-02-11 | 13F | Twin Tree Management, LP | Call | 0 | -100,00 | 0 | -100,00 | |||
| 2026-02-17 | 13F | Cetera Investment Advisers | 23.510 | 20,51 | 5.126 | 28,51 | ||||
| 2025-11-12 | 13F | Headlands Technologies LLC | 0 | -100,00 | 0 | |||||
| 2026-01-27 | 13F | TD Waterhouse Canada Inc. | 800 | 0,00 | 174 | 7,41 | ||||
| 2026-01-23 | 13F | Steigerwald, Gordon & Koch Inc. | 505 | 26,25 | 110 | 35,80 | ||||
| 2026-01-28 | 13F | Klp Kapitalforvaltning As | 20.087 | 0,00 | 4.379 | 6,65 | ||||
| 2025-11-14 | 13F | PineBridge Investments, L.P. | 25.854 | -77,60 | 5.286 | -74,73 | ||||
| 2026-02-17 | 13F | Mirabella Financial Services Llp | 2.154 | 470 | ||||||
| 2026-02-12 | 13F | New York State Common Retirement Fund | 28.362 | -3,41 | 6.183 | 3,02 | ||||
| 2026-02-06 | 13F | Resona Asset Management Co.,Ltd. | 16.231 | -9,92 | 3.563 | -2,99 | ||||
| 2026-04-17 | 13F | Boston Private Wealth Llc | 11.829 | 13,13 | 2.117 | -7,15 | ||||
| 2026-02-17 | 13F | Optiver Holding B.V. | 0 | -100,00 | 0 | |||||
| 2026-04-21 | 13F | Aaron Wealth Advisors LLC | 2.240 | -65,87 | 401 | -72,03 | ||||
| 2026-02-17 | 13F | Maryland State Retirement & Pension System | 2.612 | -10,30 | 569 | -4,37 | ||||
| 2026-02-12 | 13F | Federated Hermes, Inc. | 236 | 51 | ||||||
| 2026-04-15 | 13F | Sivik Global Healthcare LLC | 17.500 | -37,50 | 3 | -50,00 | ||||
| 2026-02-12 | 13F | Voya Investment Management Llc | 92.535 | -27,02 | 20.175 | -22,17 | ||||
| 2025-10-30 | 13F | Twin Peaks Wealth Advisors, LLC | 0 | -100,00 | 0 | -100,00 | ||||
| 2026-02-23 | 13F | Virtu Financial LLC | 2.331 | 1 | ||||||
| 2026-02-13 | 13F | Ostrum Asset Management | 378 | -25,15 | 82 | -20,39 | ||||
| 2026-02-12 | 13F | Integrated Quantitative Investments LLC | 6.430 | -34,77 | 1.402 | -30,47 | ||||
| 2026-04-23 | 13F | Private Wealth Management Group, LLC | 21 | -4,55 | 4 | -25,00 | ||||
| 2026-02-09 | 13F | Smithfield Trust Co | 155 | 0,00 | 0 | |||||
| 2026-04-22 | 13F | Louisbourg Investments Inc. | 1.195 | 10,65 | 214 | -9,36 | ||||
| 2026-02-12 | 13F | UniSuper Management Pty Ltd | 9.245 | -26,63 | 2.016 | -21,75 | ||||
| 2026-02-13 | 13F | Chevy Chase Trust Holdings, Inc. | 28.003 | -2,69 | 6.105 | 3,77 | ||||
| 2026-04-20 | 13F | Assenagon Asset Management S.A. | 88.340 | 9,77 | 15.810 | -9,89 | ||||
| 2026-02-13 | 13F | Ranmore Fund Management Ltd | 0 | -100,00 | 0 | |||||
| 2026-02-20 | 13F | Kovitz Investment Group Partners, LLC | 0 | -100,00 | 0 | |||||
| 2026-02-17 | 13F | Qube Research & Technologies Ltd | 183.711 | -7,90 | 40.053 | -1,78 | ||||
| 2026-02-19 | 13F | Mcguire Capital Advisors Inc | 11 | 2 | ||||||
| 2026-04-22 | 13F | Patton Fund Management, Inc. | 1.634 | -93,02 | 292 | -94,28 | ||||
| 2026-02-09 | 13F | Jackson Creek Investment Advisors LLC | 11.450 | -3,96 | 2 | 0,00 | ||||
| 2026-02-24 | 13F | DGS Capital Management, LLC | 11.009 | 13,55 | 2.400 | 21,15 | ||||
| 2026-02-17 | 13F | Fmr Llc | 1.829.341 | -12,75 | 398.833 | -6,95 | ||||
| 2026-01-27 | 13F | Zurcher Kantonalbank (Zurich Cantonalbank) | 14.028 | -59,61 | 3.058 | -56,92 | ||||
| 2026-02-03 | 13F | Sequoia Financial Advisors, LLC | 4.650 | 6,07 | 1.014 | 13,06 | ||||
| 2025-11-13 | 13F | Css Llc/il | Call | 0 | -100,00 | 0 | -100,00 | |||
| 2026-02-17 | 13F | Nissay Asset Management Corp /japan/ /adv | 7.155 | -0,56 | 1.560 | 6,05 | ||||
| 2026-02-17 | 13F | Dark Forest Capital Management Lp | 7.050 | 1.537 | ||||||
| 2026-01-29 | 13F | Quent Capital, LLC | 215 | 17,49 | 47 | 24,32 | ||||
| 2026-02-05 | 13F | Arbejdsmarkedets Tillaegspension | 103.213 | 22.502 | ||||||
| 2026-02-17 | 13F | Polymer Capital Management (US) LLC | 3.410 | 133,24 | 743 | 149,33 | ||||
| 2025-11-14 | 13F | Deerfield Management Company, L.p. (series C) | 0 | -100,00 | 0 | -100,00 | ||||
| 2026-02-03 | 13F | International Assets Investment Management, Llc | 30 | 7 | ||||||
| 2026-02-09 | 13F | Morningstar Investment Management LLC | 4.747 | 0,00 | 1 | |||||
| 2026-02-17 | 13F | Raymond James Financial Inc | 220.836 | 13,77 | 48.583 | 22,43 | ||||
| 2026-02-11 | 13F | Fox Run Management, L.l.c. | 1.154 | 252 | ||||||
| 2026-02-17 | 13F | Gotham Asset Management, LLC | 65.710 | 10,58 | 14.326 | 17,93 | ||||
| 2026-02-11 | 13F | Inceptionr Llc | 1.431 | -63,35 | 312 | -61,03 | ||||
| 2026-04-21 | 13F | Financial Consulate, Inc | 20 | 150,00 | 4 | 200,00 | ||||
| 2026-02-13 | 13F | Prudential Financial Inc | 46.560 | -10,71 | 10.151 | -4,77 | ||||
| 2026-02-13 | 13F | Strategic Global Advisors, LLC | 7.795 | -1,76 | 1.699 | 4,75 | ||||
| 2026-02-17 | 13F | Clear Street Markets Llc | 81 | -16,49 | 18 | -10,53 | ||||
| 2026-02-10 | 13F | State of Wyoming | 625 | -15,54 | 136 | -9,93 | ||||
| 2026-02-17 | 13F | Toronto Dominion Bank | 23.962 | -27,62 | 5.224 | -22,80 | ||||
| 2026-04-21 | 13F | Vise Technologies, Inc. | 2.587 | 0,00 | 564 | 0,00 | ||||
| 2026-02-06 | 13F | Envestnet Portfolio Solutions, Inc. | 46.880 | 2,04 | 10.221 | 8,82 | ||||
| 2026-02-17 | 13F | Nomura Holdings Inc | 1.521 | -66,97 | 332 | -64,82 | ||||
| 2026-02-17 | 13F | Woodline Partners LP | 324.683 | 36,01 | 70.787 | 45,05 | ||||
| 2026-02-11 | 13F | Illinois Municipal Retirement Fund | 32.895 | -9,07 | 7.172 | -3,04 | ||||
| 2026-04-16 | 13F | SG Americas Securities, LLC | 87.227 | 62,31 | 16 | 36,36 | ||||
| 2026-02-05 | 13F | Northwestern Mutual Investment Management Company, Llc | 1.765 | -1,78 | 385 | 4,63 | ||||
| 2026-02-10 | 13F | Nomura Asset Management Co Ltd | 20.595 | 0,32 | 4.490 | 6,98 | ||||
| 2026-02-18 | 13F | EP Wealth Advisors, Inc. | 1.937 | -31,89 | 422 | -18,06 | ||||
| 2026-04-10 | 13F | Armstrong Advisory Group, Inc | 31 | -18,42 | 6 | -37,50 | ||||
| 2026-02-12 | 13F | Leith Wheeler Investment Counsel Ltd. | 33.615 | -3,39 | 7.329 | 3,02 | ||||
| 2026-02-11 | 13F | CSM Advisors, LLC | 6.057 | 7,79 | 1 | 0,00 | ||||
| 2025-11-03 | 13F | Pandora Wealth, Inc. | 0 | -100,00 | 0 | |||||
| 2026-02-10 | 13F | AdvisorShares Investments LLC | 2.150 | 469 | ||||||
| 2026-02-13 | 13F | Hudson Portfolio Management LLC | 2.720 | 0,00 | 593 | 6,65 | ||||
| 2026-02-04 | 13F | Clark Wealth Partners | 9 | 0,00 | 2 | 0,00 | ||||
| 2026-02-05 | 13F | Td Private Client Wealth Llc | 11 | 0,00 | 2 | 0,00 | ||||
| 2026-02-17 | 13F | Susquehanna Portfolio Strategies, LLC | 35.995 | 28,59 | 7.848 | 37,14 | ||||
| 2026-02-09 | 13F | Coldstream Capital Management Inc | 1.098 | -5,67 | 239 | 0,84 | ||||
| 2025-11-07 | 13F | Sierra Ocean, Llc | 0 | -100,00 | 0 | |||||
| 2026-04-24 | 13F | IFM Investors Pty Ltd | 10.566 | -10,31 | 1.891 | 94.400,00 | ||||
| 2026-02-12 | 13F | Steward Partners Investment Advisory, Llc | 140 | -15,66 | 31 | -9,09 | ||||
| 2026-01-26 | 13F | Consolidated Investment Group LLC | 18.485 | -19,58 | 4.030 | -14,24 | ||||
| 2026-02-13 | 13F | Alberta Investment Management Corp | 24.000 | 5.232 | ||||||
| 2026-02-13 | 13F | Verition Fund Management LLC | 16.749 | 18,81 | 3.652 | 26,73 | ||||
| 2026-02-20 | 13F | Sunbelt Securities, Inc. | 135 | 0,00 | 29 | 7,41 | ||||
| 2026-02-13 | 13F | Islay Capital Management, Llc | 0 | -100,00 | 0 | |||||
| 2026-02-12 | 13F | Cibc World Markets Corp | 42.991 | 494,62 | 9.373 | 615,97 | ||||
| 2026-02-13 | 13F | Citigroup Inc | 52.232 | 16,65 | 11.388 | 24,41 | ||||
| 2026-02-23 | 13F | Beaird Harris Wealth Management, LLC | 1 | 0,00 | 0 | |||||
| 2026-02-17 | 13F | Credit Agricole S A | 10.515 | -70,39 | 2.292 | -68,43 | ||||
| 2026-02-23 | 13F | Mv Capital Management, Inc. | 63 | 0,00 | 14 | 18,18 | ||||
| 2026-02-12 | 13F | BlackRock, Inc. | 4.278.062 | -2,75 | 932.703 | 3,71 | ||||
| 2026-02-06 | 13F | Csenge Advisory Group | 1.225 | 1,74 | 267 | 8,54 | ||||
| 2026-01-12 | 13F | AllSquare Wealth Management LLC | 1.125 | 0,00 | 230 | 12,81 | ||||
| 2026-04-15 | 13F | Hartford Investment Management Co | 3.197 | -0,03 | 572 | -17,93 | ||||
| 2026-01-29 | 13F | UBS Group AG | Call | 0 | -100,00 | 0 | -100,00 | |||
| 2026-02-17 | 13F | FIL Ltd | 2.929 | 5,82 | 639 | 12,92 | ||||
| 2026-04-08 | 13F | Wealth Enhancement Trust Services, Inc. | 9 | 0,00 | 2 | 0,00 | ||||
| 2026-01-29 | 13F | UBS Group AG | Put | 0 | -100,00 | 0 | -100,00 | |||
| 2026-02-17 | 13F | Quadrature Capital Ltd | 7.497 | 1.634 | ||||||
| 2026-02-17 | 13F | Mercer Global Advisors Inc /adv | 15.160 | 29,82 | 3.305 | 38,46 | ||||
| 2026-02-09 | 13F | Allstate Corp | 4.063 | 77,42 | 886 | 89,10 | ||||
| 2026-02-10 | 13F | Bank of New York Mellon Corp | 392.353 | -19,56 | 85.541 | -14,22 | ||||
| 2026-02-12 | 13F | Granite Investment Partners, LLC | 2.000 | 0,00 | 436 | 6,86 | ||||
| 2025-11-13 | 13F | Mark Sheptoff Financial Planning, Llc | 0 | -100,00 | 0 | |||||
| 2026-01-28 | 13F | Universal- Beteiligungs- und Servicegesellschaft mbH | 39.167 | -2,95 | 8.569 | 3,85 | ||||
| 2026-02-13 | 13F | Royal London Asset Management Ltd | 1.371 | 11,55 | 299 | 18,73 | ||||
| 2026-02-10 | 13F | Bnp Paribas Arbitrage, Sa | 129.631 | 29,71 | 28.262 | 38,32 | ||||
| 2026-02-17 | 13F | Utah Retirement Systems | 8.937 | -0,76 | 1.948 | 5,87 | ||||
| 2026-02-13 | 13F | Public Employees Retirement Association Of Colorado | 5.333 | 0,00 | 1 | 0,00 | ||||
| 2026-02-13 | 13F | JustInvest LLC | 10.915 | 1,01 | 2.380 | 7,70 | ||||
| 2026-02-13 | 13F | Truvestments Capital Llc | 14 | 0,00 | 3 | 50,00 | ||||
| 2026-02-17 | 13F | Advisory Services Network, LLC | 0 | -100,00 | 0 | |||||
| 2025-11-06 | 13F | Versor Investments LP | 0 | -100,00 | 0 | |||||
| 2026-02-03 | 13F | Ethic Inc. | 5.287 | 77,77 | 1.153 | 89,47 | ||||
| 2026-02-11 | 13F | Parallel Advisors, LLC | 2.048 | 13,78 | 447 | 21,20 | ||||
| 2026-02-12 | 13F | Qtron Investments LLC | 0 | -100,00 | 0 | |||||
| 2026-02-17 | 13F | Spears Abacus Advisors LLC | 1.000 | 0,00 | 218 | 6,86 | ||||
| 2026-01-27 | 13F | Brighton Jones Llc | 0 | -100,00 | 0 | |||||
| 2026-02-17 | 13F | Trexquant Investment LP | 51.610 | 11.252 | ||||||
| 2026-02-03 | 13F | Retirement Planning Group | 1.823 | 0,28 | 397 | 7,01 | ||||
| 2026-02-04 | 13F | Ameritas Advisory Services, LLC | 2.738 | 597 | ||||||
| 2026-04-24 | 13F | Yousif Capital Management, Llc | 5.488 | -0,88 | 982 | -11,21 | ||||
| 2026-02-17 | 13F | Css Llc/il | 6.079 | 12,59 | 1.325 | 20,13 | ||||
| 2025-11-12 | 13F | NewSquare Capital LLC | 0 | -100,00 | 0 | |||||
| 2026-04-13 | 13F | True Wealth Design, LLC | 246 | -3,15 | 44 | -20,00 | ||||
| 2026-02-17 | 13F | Caption Management, LLC | Call | 0 | -100,00 | 0 | -100,00 | |||
| 2026-02-17 | 13F | Guggenheim Capital Llc | 2.177 | -72,48 | 475 | -70,69 | ||||
| 2026-02-17 | 13F | Captrust Financial Advisors | 5.178 | 64,02 | 1.129 | 74,88 | ||||
| 2026-02-12 | 13F | Distillate Capital Partners LLC | 74.829 | -1,37 | 16.314 | 5,18 | ||||
| 2025-11-12 | 13F | R Squared Ltd | 0 | -100,00 | 0 | |||||
| 2026-02-13 | 13F | Wells Fargo & Company/mn | 109.271 | 55,81 | 23.823 | 66,16 | ||||
| 2026-02-13 | 13F | Great West Life Assurance Co /can/ | 26.886 | -25,18 | 6 | -28,57 | ||||
| 2026-02-18 | 13F | GWM Advisors LLC | 3.080 | 9,03 | 672 | 16,29 | ||||
| 2026-02-17 | 13F | Safe Harbor Fiduciary, LLC | 52 | 0,00 | 11 | 22,22 | ||||
| 2026-02-17 | 13F | Ameriprise Financial Inc | 71.806 | -31,17 | 15.656 | -26,59 | ||||
| 2026-02-17 | 13F | ExodusPoint Capital Management, LP | Put | 0 | -100,00 | 0 | -100,00 | |||
| 2026-04-07 | 13F | Farther Finance Advisors, LLC | 670 | -43,51 | 119 | -53,88 | ||||
| 2026-02-13 | 13F | Bridgewater Associates, LP | 220.012 | -24,13 | 47.967 | -19,09 | ||||
| 2026-04-20 | 13F | Ronald Blue Trust, Inc. | 57 | 9,62 | 10 | -9,09 | ||||
| 2026-01-23 | 13F | Sumitomo Mitsui Trust Holdings, Inc. | 124.178 | -9,21 | 27.073 | -3,18 | ||||
| 2026-02-12 | 13F | Ensign Peak Advisors, Inc | 4.624 | -60,31 | 1.008 | -57,66 | ||||
| 2026-04-22 | 13F | Spire Wealth Management | 10 | -95,54 | 2 | -97,92 | ||||
| 2026-02-17 | 13F | Lazard Asset Management Llc | 352.822 | 11,03 | 76.922 | 18,41 | ||||
| 2026-02-13 | 13F | Schroder Investment Management Group | 64.981 | 28,90 | 14.625 | 44,28 | ||||
| 2026-02-05 | 13F | Thrivent Financial For Lutherans | 10.478 | 104,57 | 2 | 100,00 | ||||
| 2026-02-02 | 13F | Danske Bank A/s | 140.514 | 25,59 | 30.635 | 33,93 | ||||
| 2026-02-18 | 13F | State of Tennessee, Treasury Department | 34.078 | -29,37 | 6.859 | -30,47 | ||||
| 2026-03-03 | 13F/A | Caitong International Asset Management Co., Ltd | 487 | 106 | ||||||
| 2026-02-11 | 13F | Zions Bancorporation, National Association /ut/ | 36 | 0,00 | 8 | 0,00 | ||||
| 2026-02-11 | 13F | LPL Financial LLC | 51.203 | 11,50 | 11.163 | 18,91 | ||||
| 2026-02-09 | 13F | Atlantic Trust, LLC | 30 | -9,09 | 7 | 0,00 | ||||
| 2026-02-11 | 13F | Deseret Mutual Benefit Administrators | 180 | 0,00 | 39 | 8,33 | ||||
| 2026-02-13 | 13F | Palisade Asset Management, LLC | 0 | -100,00 | 0 | |||||
| 2026-02-12 | 13F | State Board Of Administration Of Florida Retirement System | 52.345 | -2,19 | 11.412 | 4,31 | ||||
| 2025-11-14 | 13F | Ossiam | 0 | -100,00 | 0 | |||||
| 2026-02-11 | 13F | Buckingham Strategic Partners | 2.392 | 0,89 | 522 | -0,19 | ||||
| 2026-02-13 | 13F/A | Ontario Teachers Pension Plan Board | 0 | -100,00 | 0 | -100,00 | ||||
| 2025-11-14 | 13F | Axa S.a. | 0 | -100,00 | 0 | |||||
| 2025-11-14 | 13F | Mubadala Investment Co PJSC | 0 | -100,00 | 0 | -100,00 | ||||
| 2026-02-18 | 13F | Mackenzie Financial Corp | 35.228 | 19,50 | 7.913 | 31,30 | ||||
| 2026-02-12 | 13F | Skopos Labs, Inc. | 988 | 223 | ||||||
| 2026-02-11 | 13F | Financiere des Professionnels - Fonds d,investissement inc. | 3.615 | 15,05 | 788 | 22,74 | ||||
| 2026-04-20 | 13F | Jfs Wealth Advisors, Llc | 95 | 5,56 | 17 | -10,53 | ||||
| 2026-04-15 | 13F | Tema Etfs Llc | 432 | 0,00 | 77 | -18,09 | ||||
| 2026-04-15 | 13F | Avanza Fonder AB | 0 | -100,00 | 0 | |||||
| 2025-11-04 | 13F | Convergence Investment Partners, LLC | 0 | -100,00 | 0 | |||||
| 2026-04-15 | 13F | Valley National Advisers Inc | 1.058 | 1.634,43 | 0 | |||||
| 2026-02-12 | 13F | Rossby Financial, LCC | 8 | 0,00 | 2 | 0,00 | ||||
| 2025-11-12 | 13F | Neo Ivy Capital Management | 0 | -100,00 | 0 | |||||
| 2026-02-11 | 13F | 111 Capital | 1.142 | 249 | ||||||
| 2026-01-29 | 13F | Teachers Retirement System Of The State Of Kentucky | 4.597 | 0,00 | 1 | |||||
| 2025-10-27 | 13F | Kiker Wealth Management, LLC | 0 | -100,00 | 0 | |||||
| 2026-04-23 | 13F | Interchange Capital Partners, LLC | 0 | -100,00 | 0 | |||||
| 2026-04-21 | 13F | Pallas Capital Advisors LLC | 1.237 | -7,62 | 221 | -24,05 | ||||
| 2026-02-10 | 13F | Norges Bank | 914.294 | 199.334 | ||||||
| 2026-02-06 | 13F | Bare Financial Services, Inc | 5 | 66,67 | 1 | |||||
| 2026-01-27 | 13F | Asset Management One Co., Ltd. | 30.546 | -10,33 | 6.904 | -0,88 | ||||
| 2026-01-28 | 13F | Chicago Partners Investment Group LLC | 3.308 | 9,97 | 678 | 2,88 | ||||
| 2026-02-17 | 13F | Canada Pension Plan Investment Board | 35.700 | -40,70 | 7.783 | -36,76 | ||||
| 2026-04-23 | 13F | Oppenheimer & Co Inc | 6.224 | 1.114 | ||||||
| 2026-02-17 | 13F | Man Group plc | 9.202 | -59,73 | 2.006 | -57,05 | ||||
| 2026-02-13 | 13F | Ubs Asset Management Americas Inc | 259.027 | 3,49 | 56.473 | 10,37 | ||||
| 2026-04-13 | 13F | Mather Group, Llc. | 342 | 61 | ||||||
| 2026-02-09 | 13F | Mizuho Securities Usa Llc | 4.022 | -2,07 | 980 | 31,41 | ||||
| 2026-04-23 | 13F | Rexford Capital Inc | 700 | 0,00 | 125 | -17,76 | ||||
| 2026-02-11 | 13F | Simplex Trading, Llc | Put | 21.900 | -2,23 | 4.775 | 119.250,00 | |||
| 2026-02-11 | 13F | Simplex Trading, Llc | Call | 19.600 | 2.700,00 | 4.273 | ||||
| 2026-02-17 | 13F | Rakuten Investment Management, Inc. | 7.315 | 10,08 | 1.654 | -80,71 | ||||
| 2026-02-13 | 13F | Healthcare Of Ontario Pension Plan Trust Fund | 2.183 | -2,20 | 476 | 4,17 | ||||
| 2026-02-06 | 13F | Mach-1 Financial Group, Inc. | 2.779 | 606 | ||||||
| 2026-02-17 | 13F | Frontier Capital Management Co Llc | 986 | 0,00 | 215 | 6,47 | ||||
| 2026-02-05 | 13F | Qsemble Capital Management, LP | 1.503 | -10,85 | 328 | -4,94 | ||||
| 2026-02-09 | 13F | Catalyst Funds Management Pty Ltd | 1.006 | -8,55 | 219 | -2,23 | ||||
| 2026-02-11 | 13F | Allianz Asset Management GmbH | 281.063 | 7,87 | 61.277 | 15,04 | ||||
| 2026-02-17 | 13F | Aster Capital Management (DIFC) Ltd | 747 | 163 | ||||||
| 2026-02-17 | 13F | Jump Financial, LLC | 1.863 | -91,26 | 406 | -90,68 | ||||
| 2026-02-13 | 13F | Toroso Investments, LLC | 10.258 | 2,55 | 2.236 | 9,34 | ||||
| 2026-04-16 | 13F | Evolve Private Wealth, Llc | 4.443 | 3,93 | 795 | -14,70 | ||||
| 2026-02-04 | 13F | Securian Asset Management, Inc | 1.499 | -45,59 | 327 | -42,10 | ||||
| 2026-04-13 | 13F | Creative Financial Designs Inc /adv | 69 | 0,00 | 12 | -20,00 | ||||
| 2026-04-27 | 13F | Mount Yale Investment Advisors, LLC | 14.601 | 2.613 | ||||||
| 2025-11-13 | 13F | EntryPoint Capital, LLC | 0 | -100,00 | 0 | |||||
| 2026-02-12 | 13F | Cloud Capital Management, LLC | 0 | -100,00 | 0 | |||||
| 2026-02-17 | 13F | Bank Of America Corp /de/ | 340.911 | 11,25 | 74.325 | 18,64 | ||||
| 2026-02-17 | 13F | Advisor Group Holdings, Inc. | 2.570 | -89,76 | 560 | -89,03 | ||||
| 2026-02-13 | 13F | Neuberger Berman Group LLC | 32.972 | 43,49 | 7.189 | 53,03 | ||||
| 2026-01-12 | 13F | Rialto Wealth Management, LLC | 10 | 42,86 | 2 | 100,00 | ||||
| 2026-02-12 | 13F | Quadrant Capital Group Llc | 1.626 | 0,00 | 355 | 6,63 | ||||
| 2026-02-09 | 13F | AIA Group Ltd | 0 | -100,00 | 0 | |||||
| 2025-11-21 | 13F/A | CIBC Bancorp USA Inc. | 7.809 | 1.596 | ||||||
| 2026-02-05 | 13F | North Dakota State Investment Board | 1.862 | 406 | ||||||
| 2026-02-09 | 13F | Optimize Financial Inc | 2.259 | 1,44 | 493 | 8,13 | ||||
| 2026-02-12 | 13F | Penserra Capital Management LLC | 0 | -100,00 | 0 | |||||
| 2026-02-12 | 13F | Xponance, Inc. | 8.710 | 5,23 | 1.899 | 12,17 | ||||
| 2026-02-02 | 13F | Sachetta, LLC | 28 | 0,00 | 6 | 20,00 | ||||
| 2026-02-17 | 13F | Jain Global LLC | 0 | -100,00 | 0 | |||||
| 2026-02-17 | 13F | Creative Planning | 27.958 | 65,67 | 6.095 | 76,67 | ||||
| 2026-02-13 | 13F | Integrated Wealth Concepts LLC | 1.618 | -18,41 | 353 | -13,09 | ||||
| 2026-04-24 | 13F | Root Financial Partners, LLC | 218 | 2,83 | 39 | -15,22 | ||||
| 2026-02-04 | 13F | First Eagle Investment Management, LLC | 4.313.583 | -6,66 | 940.447 | -0,46 | ||||
| 2026-02-04 | 13F | Pensionmark Financial Group, Llc | 1.223 | -2,32 | 248 | -2,75 | ||||
| 2026-02-17 | 13F | CastleKnight Management LP | 40.100 | -48,12 | 8.743 | -44,68 | ||||
| 2026-02-13 | 13F | Cozad Asset Management Inc | 14.972 | -34,47 | 3.264 | -30,12 | ||||
| 2025-11-13 | 13F | Aware Super Pty Ltd as trustee of Aware Super | 206.837 | 23,47 | 42.286 | 39,35 | ||||
| 2026-01-26 | 13F | Mirae Asset Global Investments Co., Ltd. | 11.348 | 13,59 | 2.474 | 21,16 | ||||
| 2025-11-14 | 13F | Strategic Wealth Partners, Ltd. | 39 | 8 | ||||||
| 2026-04-14 | 13F | Perpetual Ltd | 1.865 | 22,05 | 334 | 0,00 | ||||
| 2025-11-13 | 13F | Blueshift Asset Management, LLC | 0 | -100,00 | 0 | |||||
| 2026-02-10 | 13F | Savant Capital, LLC | 2.931 | 2,38 | 639 | 9,23 | ||||
| 2026-03-04 | 13F | SHP Wealth Management | 6 | 1 | ||||||
| 2026-04-20 | 13F | KFA Private Wealth Group, LLC | 1.448 | 0,07 | 259 | -17,78 | ||||
| 2026-02-17 | 13F | Cape Investment Advisory, Inc. | 14 | 3 | ||||||
| 2026-04-13 | 13F | E Fund Management Co., Ltd. | 1.848 | 8,64 | 331 | 7,14 | ||||
| 2026-02-17 | 13F | Bayesian Capital Management, LP | 0 | -100,00 | 0 | |||||
| 2026-01-26 | 13F | Reyes Financial Architecture, Inc. | 360 | -24,05 | 78 | -18,75 | ||||
| 2025-11-14 | 13F | Graham Capital Management, L.P. | 0 | -100,00 | 0 | |||||
| 2026-02-05 | 13F | Cambridge Investment Research Advisors, Inc. | 2.035 | 2,47 | 0 | |||||
| 2025-11-14 | 13F | AXA Investment Managers S.A. | 12.269 | 2.508 | ||||||
| 2026-02-09 | 13F | Geode Capital Management, Llc | 1.751.822 | -0,63 | 380.714 | 5,99 | ||||
| 2026-01-22 | 13F | Massachusetts Financial Services Co /ma/ | 891.270 | -3,17 | 194.315 | 3,26 | ||||
| 2026-02-13 | 13F | Victory Capital Management Inc | 98.644 | -28,64 | 21.506 | -23,90 | ||||
| 2026-04-20 | 13F | State of Alaska, Department of Revenue | 30.486 | -0,18 | 5 | -16,67 | ||||
| 2026-02-17 | 13F | Redwood Investment Management, Llc | 4.971 | -15,05 | 1 | 0,00 | ||||
| 2026-02-11 | 13F | GW&K Investment Management, LLC | 24 | 0 | ||||||
| 2026-02-12 | 13F | Brown Brothers Harriman & Co | 381 | 133,74 | 83 | 151,52 | ||||
| 2026-04-23 | 13F | Vista Investment Partners Ii, Llc | 12.056 | 100,90 | 2.158 | 64,91 | ||||
| 2026-02-23 | 13F | Kera Capital Partners, Inc. | 4.116 | 112,82 | 828 | 109,62 | ||||
| 2026-04-24 | 13F | Sumitomo Mitsui DS Asset Management Company, Ltd | 7.672 | 0,52 | 1.373 | -17,44 | ||||
| 2026-02-17 | 13F | Tower Research Capital LLC (TRC) | 3.117 | 367,32 | 680 | 399,26 | ||||
| 2026-02-11 | 13F | Los Angeles Capital Management Llc | 339.326 | 47,37 | 74.207 | 57,65 | ||||
| 2026-04-13 | 13F | IFP Advisors, Inc | 1.580 | 2,27 | 283 | -16,07 | ||||
| 2026-02-11 | 13F | O'shaughnessy Asset Management, Llc | 19.911 | -46,48 | 4.341 | -42,93 | ||||
| 2026-01-20 | 13F | Stratos Wealth Partners, LTD. | 5.895 | 140,02 | 1.285 | 155,98 | ||||
| 2026-01-29 | 13F | Vanguard Group Inc | 6.486.542 | -2,59 | 1.414.196 | 3,88 | ||||
| 2026-02-10 | 13F | National Pension Service | 65.203 | 32,39 | 14.216 | 41,19 | ||||
| 2026-01-30 | 13F | Catalytic Wealth RIA, LLC | 0 | -100,00 | 0 | |||||
| 2026-02-05 | 13F | New York Life Investment Management Llc | 7.640 | -1,06 | 1.666 | 5,51 | ||||
| 2026-01-16 | 13F | Standard Life Aberdeen plc | 4.011 | -1,62 | 874 | 6,72 | ||||
| 2026-02-10 | 13F | KERR FINANCIAL PLANNING Corp | 100 | 22 | ||||||
| 2026-04-20 | 13F | Concurrent Investment Advisors, LLC | 0 | -100,00 | 0 | -100,00 | ||||
| 2026-02-12 | 13F | Alps Advisors Inc | 2.399 | 0,67 | 523 | 7,39 | ||||
| 2026-01-30 | 13F | NJ State Employees Deferred Compensation Plan | 0 | -100,00 | 0 | |||||
| 2026-02-17 | 13F | Laird Norton Trust Company, Llc | 1.243 | 271 | ||||||
| 2026-02-17 | 13F | Banco Bilbao Vizcaya Argentaria, S.a. | 0 | -100,00 | 0 | |||||
| 2026-02-17 | 13F | Khrom Capital Management Llc | 231.005 | -34,04 | 50.364 | -29,66 | ||||
| 2026-01-30 | 13F | State of New Jersey Common Pension Fund D | 18.153 | -7,22 | 3.958 | -1,05 | ||||
| 2026-02-17 | 13F | Algert Global Llc | 37.030 | 512,07 | 8 | 700,00 | ||||
| 2026-04-23 | 13F | iA Global Asset Management Inc. | 8.384 | 20,69 | 2 | 0,00 | ||||
| 2026-02-13 | 13F | Hurley Capital, LLC | 0 | -100,00 | 0 | |||||
| 2026-02-10 | 13F | United Super Pty Ltd in its capacity as Trustee for the Construction & Building Unions Superannuation Fund | 36.996 | 549,05 | 8.066 | 592,27 | ||||
| 2026-02-12 | 13F | Fortress Private Ledger, Llc | 3.019 | 34,30 | 658 | 43,36 | ||||
| 2026-02-11 | 13F | Franklin Resources Inc | 106.976 | -1,21 | 23.323 | 5,35 | ||||
| 2026-02-17 | 13F | Moore Capital Management, Lp | 0 | -100,00 | 0 | |||||
| 2026-02-11 | 13F | Prudential Plc | 0 | -100,00 | 0 | |||||
| 2025-10-27 | 13F | Bogart Wealth, LLC | 0 | -100,00 | 0 | |||||
| 2025-11-17 | 13F | Kestra Investment Management, LLC | 0 | -100,00 | 0 | -100,00 | ||||
| 2026-01-23 | 13F | Westside Investment Management, Inc. | 50 | 0,00 | 11 | 0,00 | ||||
| 2026-02-09 | 13F | Harbour Investments, Inc. | 56 | -5,08 | 12 | 0,00 | ||||
| 2026-02-05 | 13F | Mesirow Financial Investment Management, Inc. | 0 | -100,00 | 0 | |||||
| 2026-04-06 | 13F | Versant Capital Management, Inc | 1.658 | -21,35 | 297 | -35,51 | ||||
| 2026-02-10 | 13F | Forsta Ap-fonden | 26.700 | 181,05 | 5.821 | 199,74 | ||||
| 2026-02-10 | 13F | Envestnet Asset Management Inc | 91.748 | 1,14 | 20.003 | 7,85 | ||||
| 2026-04-09 | 13F | Sanders Morris Harris Llc | 2.890 | 517 | ||||||
| 2026-02-17 | 13F | Worldquant Millennium Advisors Llc | 192.633 | 477,99 | 41.998 | 516,42 | ||||
| 2026-02-10 | 13F | Gulf International Bank (UK) Ltd | 3.044 | 0,00 | 1 | |||||
| 2026-02-05 | 13F | Atria Investments Llc | 3.332 | 19,43 | 726 | 27,37 | ||||
| 2026-02-11 | 13F | Empowered Funds, LLC | 120.149 | 86,65 | 26.195 | 99,04 | ||||
| 2026-01-29 | 13F | Comerica Bank | 20.244 | -6,29 | 4.414 | -0,07 | ||||
| 2026-02-06 | 13F | Aviance Capital Partners, LLC | 5.222 | -1,29 | 1.139 | 5,27 | ||||
| 2026-04-27 | 13F | Y-Intercept (Hong Kong) Ltd | 47.576 | 79,84 | 8.515 | 47,63 | ||||
| 2025-11-07 | 13F | Readystate Asset Management Lp | 0 | -100,00 | 0 | |||||
| 2026-02-13 | 13F | Baird Financial Group, Inc. | 8.783 | -6,71 | 1.915 | -0,52 | ||||
| 2026-04-15 | 13F | Parsons Capital Management Inc/ri | 12.475 | -0,38 | 2.233 | -18,24 | ||||
| 2026-04-22 | 13F | Janney Montgomery Scott LLC | 15.961 | 58,17 | 3 | 0,00 | ||||
| 2026-02-11 | 13F | Livforsakringsbolaget Skandia, Omsesidigt | 60.700 | 67,68 | 13.229 | 78,76 | ||||
| 2026-02-17 | 13F | ISAM Funds (UK) Ltd | 3.798 | 828 | ||||||
| 2026-02-17 | 13F | Lombard Odier Asset Management (USA) Corp | 0 | -100,00 | 0 | |||||
| 2026-02-12 | 13F | AlphaCentric Advisors LLC | 592 | 30,11 | 129 | 59,26 | ||||
| 2025-11-06 | 13F | MQS Management LLC | 0 | -100,00 | 0 | -100,00 | ||||
| 2026-01-26 | 13F | Whittier Trust Co Of Nevada Inc | 5.204 | 0,00 | 1.154 | 6,96 | ||||
| 2026-02-17 | 13F | Cinctive Capital Management LP | 10.758 | -81,22 | 2.345 | -79,98 | ||||
| 2026-01-20 | 13F | Harbor Capital Advisors, Inc. | 118 | 0 | ||||||
| 2026-02-10 | 13F | Measured Wealth Private Client Group, LLC | 80 | -72,79 | 17 | -71,67 | ||||
| 2026-02-17 | 13F | Royal Bank Of Canada | 119.686 | 4,75 | 26.094 | 11,71 | ||||
| 2026-01-26 | 13F | La Banque Postale Asset Management SA | 24.899 | 5.428 | ||||||
| 2026-01-23 | 13F | Rsm Us Wealth Management Llc | 2.659 | 25,96 | 598 | 38,75 | ||||
| 2026-02-13 | 13F | Bank Of Nova Scotia | 8.600 | -11,17 | 1.875 | -5,31 | ||||
| 2026-02-17 | 13F | Howard Hughes Medical Institute | 12 | 0,00 | 3 | 0,00 | ||||
| 2025-11-06 | 13F | Whipplewood Advisors, LLC | 0 | -100,00 | 0 | |||||
| 2026-04-13 | 13F | Chesley Taft & Associates LLC | 2.245 | 4,71 | 402 | -14,13 | ||||
| 2026-02-17 | 13F | Hilltop Holdings Inc. | 0 | -100,00 | 0 | |||||
| 2026-02-10 | 13F | Private Wealth Asset Management, LLC | 1 | 0,00 | 0 | |||||
| 2026-02-17 | 13F | Clark Capital Management Group, Inc. | 333.890 | 0,77 | 72.795 | 7,47 | ||||
| 2026-04-24 | 13F | Strs Ohio | 1.255 | -2,18 | 225 | -19,71 | ||||
| 2026-01-29 | 13F | IMC-Chicago, LLC | Put | 10.300 | -29,93 | 2.246 | -25,29 | |||
| 2026-01-29 | 13F | IMC-Chicago, LLC | Call | 15.400 | 27,27 | 3.358 | 35,75 | |||
| 2026-02-12 | 13F | Aviva Plc | 29.272 | 5,12 | 6.382 | 12,10 | ||||
| 2026-02-17 | 13F | Jones Financial Companies Lllp | 328 | 20,15 | 72 | 31,48 | ||||
| 2025-11-04 | 13F | Guerra Advisors Inc | 11 | 2 | ||||||
| 2026-02-09 | 13F | Summitry Llc | 1.075 | 234 | ||||||
| 2026-02-09 | 13F | Westover Capital Advisors, LLC | 953 | 208 | ||||||
| 2026-01-22 | 13F | Bartlett & Co. Wealth Management Llc | 14 | 0,00 | 3 | 50,00 | ||||
| 2026-02-17 | 13F | California State Teachers Retirement System | 67.068 | -2,50 | 14.622 | 3,98 | ||||
| 2026-02-13 | 13F | SRS Capital Advisors, Inc. | 1.526 | -90,33 | 333 | -89,71 | ||||
| 2026-02-17 | 13F | Glenview Capital Management, Llc | 0 | -100,00 | 0 | |||||
| 2026-02-17 | 13F | Price T Rowe Associates Inc /md/ | 102.049 | -7,88 | 22 | 0,00 | ||||
| 2026-04-15 | 13F | Uncommon Cents Investing LLC | 4.744 | 4,17 | 849 | -14,42 | ||||
| 2026-02-11 | 13F | Winton Capital Group Ltd | 30.440 | 1.172,04 | 6.637 | 1.257,06 | ||||
| 2026-02-13 | 13F | Colony Group, LLC | 19.724 | 317,97 | 4.301 | 346,06 | ||||
| 2026-02-11 | 13F | Cerity Partners LLC | 32.109 | 3,73 | 7.000 | 10,62 | ||||
| 2026-04-15 | 13F | Activest Wealth Management | 0 | -100,00 | 0 | |||||
| 2026-02-10 | 13F | Lido Advisors, LLC | 2.345 | 3,12 | 482 | 3,44 | ||||
| 2026-02-13 | 13F | Smartleaf Asset Management LLC | 359 | 11,15 | 81 | 25,00 | ||||
| 2026-02-13 | 13F | South Plains Financial, Inc. | 215 | 47 | ||||||
| 2026-01-22 | 13F | Richardson Financial Services Inc. | 56 | -8,20 | 12 | 0,00 | ||||
| 2026-01-29 | 13F | Dunhill Financial, LLC | 4 | 100,00 | 1 | |||||
| 2026-02-17 | 13F | Investment Management Corp of Ontario | 3.819 | 40,77 | 833 | 50,18 | ||||
| 2025-11-14 | 13F | Wolverine Trading, Llc | 14.105 | -3,99 | 2.836 | 8,41 | ||||
| 2026-02-10 | 13F | Td Asset Management Inc | 29.325 | -2,75 | 6.393 | 3,72 | ||||
| 2025-11-14 | 13F | Wolverine Trading, Llc | Call | 6.300 | 43,18 | 1.267 | 61,69 | |||
| 2026-02-05 | 13F | Allworth Financial LP | 2.183 | -30,92 | 476 | -26,47 | ||||
| 2025-11-14 | 13F | Wolverine Trading, Llc | Put | 13.800 | -64,06 | 2.775 | -59,43 | |||
| 2026-02-17 | 13F | Boothbay Fund Management, Llc | 2.789 | 608 | ||||||
| 2026-01-28 | 13F | DekaBank Deutsche Girozentrale | 4.554 | 0,00 | 1 | |||||
| 2026-02-09 | 13F | Employees Retirement System of Texas | 477 | 0,00 | 0 | |||||
| 2026-02-05 | 13F | Canada Post Corp Registered Pension Plan | 1.335 | 28,99 | 291 | 39,90 | ||||
| 2025-11-14 | 13F | Caption Management, LLC | Put | 0 | -100,00 | 0 | -100,00 | |||
| 2026-02-13 | 13F | Parkside Financial Bank & Trust | 107 | 4,90 | 23 | 15,00 | ||||
| 2026-04-20 | 13F | BTC Capital Management, Inc. | 45.585 | 8,02 | 8.157 | -11,36 | ||||
| 2026-02-13 | 13F | Transamerica Financial Advisors, Inc. | 44 | 10 | ||||||
| 2026-02-24 | 13F/A | Pacer Advisors, Inc. | 5.797 | -18,64 | 1.264 | -13,26 | ||||
| 2026-02-10 | 13F | Commonwealth Of Pennsylvania Public School Empls Retrmt Sys | 12.848 | -5,12 | 2.801 | 1,19 | ||||
| 2026-04-22 | 13F | MeadowBrook Investment Advisors LLC | 840 | 0,60 | 150 | -17,58 | ||||
| 2026-04-17 | 13F | AdvisorNet Financial, Inc | 2 | -33,33 | 0 | |||||
| 2026-01-16 | 13F | Crowley Wealth Management, Inc. | 0 | -100,00 | 0 | |||||
| 2026-02-11 | 13F | Cunning Capital Partners, LP | 12.528 | 3 | ||||||
| 2026-02-13 | 13F | Marshall Wace, Llp | 16.388 | 3.573 | ||||||
| 2026-04-23 | 13F | Forum Financial Management, LP | 0 | -100,00 | 0 | |||||
| 2025-10-30 | 13F | Keebeck Alpha, LP | 0 | -100,00 | 0 | -100,00 | ||||
| 2025-11-13 | 13F | Kayne Anderson Rudnick Investment Management Llc | 0 | -100,00 | 0 | |||||
| 2026-04-09 | 13F | Vista Investment Partners Llc | 21.107 | 70,47 | 3.779 | 39,98 | ||||
| 2026-02-13 | 13F | BNP Paribas Asset Management Holding S.A. | 225.331 | 4,89 | 49 | 13,95 | ||||
| 2026-02-11 | 13F | Group One Trading, L.p. | Call | 22.500 | 11.150,00 | 4.905 | 12.162,50 | |||
| 2026-02-11 | 13F | Group One Trading, L.p. | Put | 100 | -87,50 | 22 | -87,12 | |||
| 2026-02-17 | 13F | State Of Wisconsin Investment Board | 41.427 | 37,34 | 9.032 | 46,46 | ||||
| 2026-04-07 | 13F | Park Avenue Securities Llc | 4.295 | 1 | ||||||
| 2026-01-27 | 13F | Tokio Marine Asset Management Co Ltd | 2.104 | 0,00 | 459 | 6,51 | ||||
| 2026-02-11 | 13F | Group One Trading, L.p. | 3.667 | 803,20 | 799 | 862,65 | ||||
| 2026-04-17 | 13F | PKO Investment Management Joint-Stock Co | 800 | 14,29 | 143 | -5,92 | ||||
| 2026-02-13 | 13F | Pathstone Holdings, LLC | 4.245 | -2,17 | 926 | 4,28 | ||||
| 2026-02-19 | 13F | Invesco Ltd. | 1.187.746 | -13,31 | 258.952 | -7,55 | ||||
| 2025-11-14 | 13F | Eqis Capital Management, Inc. | 0 | -100,00 | 0 | |||||
| 2026-02-13 | 13F | BRITISH COLUMBIA INVESTMENT MANAGEMENT Corp | 9.992 | 21,56 | 2.178 | 29,64 | ||||
| 2026-02-13 | 13F | Edgestream Partners, L.P. | 37.599 | 1.279,78 | 8.197 | 1.371,63 | ||||
| 2026-02-13 | 13F | Pinnacle Wealth Planning Services, Inc. | 84 | 18 | ||||||
| 2026-02-12 | 13F | Johnson Financial Group, Inc. | 0 | -100,00 | 0 | |||||
| 2026-04-23 | 13F | TFC Financial Management | 4 | 0,00 | 1 | |||||
| 2026-02-13 | 13F | S&t Bank/pa | 0 | -100,00 | 0 | |||||
| 2026-04-20 | 13F | SILVER OAK SECURITIES, Inc | 3.521 | 10,00 | 630 | -12,50 | ||||
| 2026-02-02 | 13F | Horizon Investments, LLC | 14.032 | 18,64 | 3.059 | 26,56 | ||||
| 2026-02-13 | 13F | OMERS ADMINISTRATION Corp | 11.701 | -3,31 | 2.551 | 3,15 | ||||
| 2025-11-10 | 13F | Asahi Life Asset Management Co., Ltd. | 0 | -100,00 | 0 | |||||
| 2026-02-06 | 13F | Covestor Ltd | 708 | -15,01 | 0 | |||||
| 2026-04-24 | 13F | Raiffeisen Bank International AG | 85 | 0,00 | 15 | -21,05 | ||||
| 2026-02-17 | 13F | CastleKnight Management LP | Call | 0 | -100,00 | 0 | ||||
| 2026-02-11 | 13F | Syon Capital Llc | 5.308 | 1.157 | ||||||
| 2026-02-17 | 13F | Millennium Management Llc | Put | 4.900 | -43,02 | 1.068 | -39,25 | |||
| 2026-04-13 | 13F | Czech National Bank | 15.043 | 3,28 | 2.692 | -15,21 | ||||
| 2026-02-17 | 13F | Millennium Management Llc | 457.579 | -8,41 | 99.761 | -2,32 | ||||
| 2026-02-17 | 13F | Perbak Capital Partners LLP | 1.098 | -78,27 | 239 | -76,84 | ||||
| 2026-02-13 | 13F | Ingalls & Snyder Llc | 1.500 | 0,00 | 0 | |||||
| 2026-02-17 | 13F | Estuary Capital Management LP | 0 | -100,00 | 0 | |||||
| 2026-02-17 | 13F | Blair William & Co/il | 1.390 | 4,12 | 303 | 11,40 | ||||
| 2026-02-03 | 13F | Stevens Capital Management Lp | 7.700 | 2 | ||||||
| 2026-02-12 | 13F | Empirical Finance, LLC | 5.086 | -1,74 | 1.109 | 4,73 | ||||
| 2026-01-06 | 13F | Board of the Pension Protection Fund | 0 | -100,00 | 0 | |||||
| 2026-04-07 | 13F | Abacus Planning Group, Inc. | 3.356 | -2,67 | 601 | -20,11 | ||||
| 2026-02-12 | 13F | Andra AP-fonden | 41.800 | -36,76 | 9.113 | -32,56 | ||||
| 2026-02-13 | 13F | Barclays Plc | 125.171 | -12,94 | 27.290 | -7,15 | ||||
| 2026-04-24 | 13F | ProShare Advisors LLC | 16.054 | -6,03 | 2.873 | -22,85 | ||||
| 2026-01-30 | 13F | Wealthfront Advisers Llc | 14.141 | -0,44 | 3.083 | 6,20 | ||||
| 2026-02-12 | 13F | Swiss National Bank | 154.500 | -6,31 | 33.684 | -0,08 | ||||
| 2025-11-14 | 13F | Wahed Invest LLC | 0 | -100,00 | 0 | |||||
| 2026-02-10 | 13F | Gw Henssler & Associates Ltd | 2.128 | -5,84 | 464 | 0,22 | ||||
| 2026-02-06 | 13F | Larson Financial Group LLC | 141 | 302,86 | 31 | 328,57 | ||||
| 2026-01-16 | 13F | Empirical Financial Services, LLC d.b.a. Empirical Wealth Management | 1.807 | 394 | ||||||
| 2026-02-17 | 13F | Capital Fund Management S.a. | 0 | -100,00 | 0 | -100,00 | ||||
| 2026-02-05 | 13F | Gabelli Funds Llc | 8.503 | 4,68 | 1.854 | 11,63 | ||||
| 2026-02-11 | 13F | Ameritas Investment Partners, Inc. | 494 | 108 | ||||||
| 2026-01-20 | 13F | Cromwell Holdings LLC | 204 | 0,00 | 44 | 7,32 | ||||
| 2026-02-13 | 13F | Landscape Capital Management, L.l.c. | 1.725 | 376 | ||||||
| 2026-02-11 | 13F | Harvest Fund Management Co., Ltd | 25 | 0,00 | 0 | |||||
| 2025-11-14 | 13F | WealthTrak Capital Management LLC | 0 | -100,00 | 0 | |||||
| 2026-04-21 | 13F | Nemes Rush Group LLC | 2 | 0,00 | 0 | |||||
| 2025-11-14 | 13F | Teza Capital Management LLC | 0 | -100,00 | 0 | |||||
| 2026-04-09 | 13F | Wedmont Private Capital | 0 | -100,00 | 0 | |||||
| 2026-02-10 | 13F | Quantbot Technologies LP | 1.181 | 257 | ||||||
| 2026-02-17 | 13F | Siemens Fonds Invest GmbH | 354 | 0,00 | 80 | 9,72 | ||||
| 2026-04-13 | 13F | Massmutual Trust Co Fsb/adv | 130 | 47,73 | 23 | 21,05 | ||||
| 2026-02-02 | 13F | Fifth Third Bancorp | 1.461 | 0,62 | 319 | 7,43 | ||||
| 2026-01-07 | 13F | Procyon Private Wealth Partners, LLC | 1.641 | -14,89 | 358 | -9,39 | ||||
| 2026-01-30 | 13F | Mitsubishi UFJ Trust & Banking Corp | 23.004 | -60,73 | 5.015 | -58,12 | ||||
| 2026-02-13 | 13F | Public Sector Pension Investment Board | 0 | -100,00 | 0 | |||||
| 2025-11-07 | 13F | Addison Advisors LLC | 0 | -100,00 | 0 | |||||
| 2026-02-13 | 13F | Stifel Financial Corp | 7.085 | 15,48 | 1.545 | 23,13 | ||||
| 2026-02-06 | 13F | Pnc Financial Services Group, Inc. | 9.281 | -3,08 | 2.023 | 3,37 | ||||
| 2026-01-26 | 13F | KBC Group NV | 169.306 | 5,68 | 37 | 12,50 | ||||
| 2026-02-02 | 13F | Intact Investment Management Inc. | 1.100 | -90,39 | 240 | -89,79 | ||||
| 2026-02-17 | 13F | Russell Investments Group, Ltd. | 233.760 | -3,87 | 51.040 | 2,73 | ||||
| 2026-01-27 | 13F | Bayforest Capital Ltd | 0 | -100,00 | 0 | |||||
| 2026-02-04 | 13F | WealthTrust Asset Management, LLC | 2.601 | -3,45 | 567 | 3,09 | ||||
| 2026-02-13 | 13F | Charles Schwab Investment Management Inc | 568.565 | -0,99 | 123.959 | 5,58 | ||||
| 2026-02-06 | 13F | Lsv Asset Management | 756.922 | 0,55 | 165 | 7,84 | ||||
| 2026-02-09 | 13F | Annis Gardner Whiting Capital Advisors, LLC | 77 | 20,31 | 17 | 23,08 | ||||
| 2026-02-17 | 13F | Clough Capital Partners L P | 76.650 | 16.711 | ||||||
| 2026-02-17 | 13F | Signature Equity Partners, LLC | 27 | 6 | ||||||
| 2026-04-13 | 13F | Gateway Investment Advisers Llc | 29.770 | 4,19 | 5.328 | -14,48 | ||||
| 2026-02-12 | 13F | Advisors Asset Management, Inc. | 1.745 | -1,58 | 380 | 4,97 | ||||
| 2026-02-17 | 13F | Invenomic Capital Management LP | 0 | -100,00 | 0 | |||||
| 2025-11-10 | 13F | Hillsdale Investment Management Inc. | 0 | -100,00 | 0 | |||||
| 2026-01-27 | 13F | Evergreen Capital Management Llc | 2.368 | 516 | ||||||
| 2025-11-14 | 13F | Point72 Asia (Singapore) Pte. Ltd. | 0 | -100,00 | 0 | |||||
| 2026-02-13 | 13F | Rhenman & Partners Asset Management AB | 0 | -100,00 | 0 | |||||
| 2026-04-15 | 13F | Fortitude Family Office, LLC | 67 | 48,89 | 12 | 22,22 | ||||
| 2026-02-10 | 13F | MUFG Securities EMEA plc | 2.264 | 109,82 | 494 | 124,09 | ||||
| 2026-02-13 | 13F | Haverford Trust Co | 2.746 | 0,00 | 599 | 6,60 | ||||
| 2026-02-13 | 13F | Safeguard Investment Advisory Group, LLC | 0 | -100,00 | 0 | |||||
| 2026-02-05 | 13F | DnB Asset Management AS | 10.491 | 0,00 | 2.287 | 6,67 | ||||
| 2026-02-17 | 13F | Prelude Capital Management, Llc | 5.819 | 109,39 | 1.269 | 123,24 | ||||
| 2026-02-11 | 13F | Deutsche Bank Ag\ | 343.516 | 3,68 | 74.893 | 10,57 | ||||
| 2026-01-29 | 13F | Ashton Thomas Private Wealth, LLC | 2.470 | 117,24 | 539 | 131,90 | ||||
| 2026-02-02 | 13F | Cornerstone Planning Group LLC | 31 | -98,44 | 6 | -93,41 | ||||
| 2026-02-10 | 13F | CIBC Asset Management Inc | 13.317 | 70,91 | 2.903 | 82,35 | ||||
| 2026-04-21 | 13F | Robeco Institutional Asset Management B.V. | 63.580 | -22,94 | 11.379 | -36,74 | ||||
| 2026-02-13 | 13F | Atlas Capital Advisors Llc | 2.957 | 404,61 | 645 | 507,55 | ||||
| 2025-11-14 | 13F | Fullerton Fund Management Co Ltd | 0 | -100,00 | 0 | |||||
| 2026-01-15 | 13F | Allspring Global Investments Holdings, LLC | 56.123 | -18,07 | 12.340 | -11,48 | ||||
| 2026-02-12 | 13F | denkapparat Operations GmbH | 4.294 | 0,00 | 936 | 6,73 | ||||
| 2026-02-03 | 13F | Crestwood Advisors Group LLC | 1.796 | 392 | ||||||
| 2026-02-11 | 13F | IMA Wealth, Inc. | 21 | 2.000,00 | 5 |