Grundlæggende statistik
| Institutionelle aktier (lange) | 444.759.123 - 92,78% (ex 13D/G) - change of -106,24MM shares -19,28% MRQ |
| Institutionel værdi (lang) | $ 16.461.112 USD ($1000) |
Institutionelt ejerskab og aktionærer
NiSource Inc. (US:NI) har 836 institutionelle ejere og aktionærer, der har indsendt 13D/G- eller 13F-formularer til Securities Exchange Commission (SEC). Disse institutioner har i alt 444,759,123 aktier. Største aktionærer omfatter Vanguard Group Inc, BlackRock, Inc., T. Rowe Price Investment Management, Inc., State Street Corp, Geode Capital Management, Llc, Deutsche Bank Ag\, Jennison Associates Llc, Fmr Llc, Capital International Investors, and Norges Bank .
NiSource Inc. (NYSE:NI) institutionel ejerskabsstruktur viser aktuelle positioner i virksomheden efter institutioner og fonde, samt seneste ændringer i positionsstørrelse. Større aktionærer kan omfatte individuelle investorer, investeringsforeninger, hedgefonde eller institutioner. Skema 13D angiver, at investoren besidder (eller besidder) mere end 5 % af virksomheden og har til hensigt (eller har til hensigt at) aktivt at forfølge en ændring i forretningsstrategi. Skema 13G indikerer en passiv investering på over 5%.
The share price as of April 13, 2026 is 47,17 / share. Previously, on April 14, 2025, the share price was 39,26 / share. This represents an increase of 20,15% over that period.

Fondens stemningsscore
Fund Sentiment Score (fka Ownership Accumulation Score) finder de aktier, der bliver mest købt af fonde. Det er resultatet af en sofistikeret, multi-faktor kvantitativ model, der identificerer virksomheder med de højeste niveauer af institutionel akkumulering. Scoringsmodellen bruger en kombination af den samlede stigning i oplyste ejere, ændringerne i porteføljeallokeringer i disse ejere og andre målinger. Tallet går fra 0 til 100, hvor højere tal indikerer et højere niveau af akkumulering for sine jævnaldrende, og 50 er gennemsnittet.
Opdateringsfrekvens: Dagligt
Se Ownership Explorer, som giver en liste over højest rangerende virksomheder.
AI+ Ask Fintel’s AI assistant about NiSource Inc..
Select a question to share a public post with an AI-crafted answer.
Thinking of good questions…
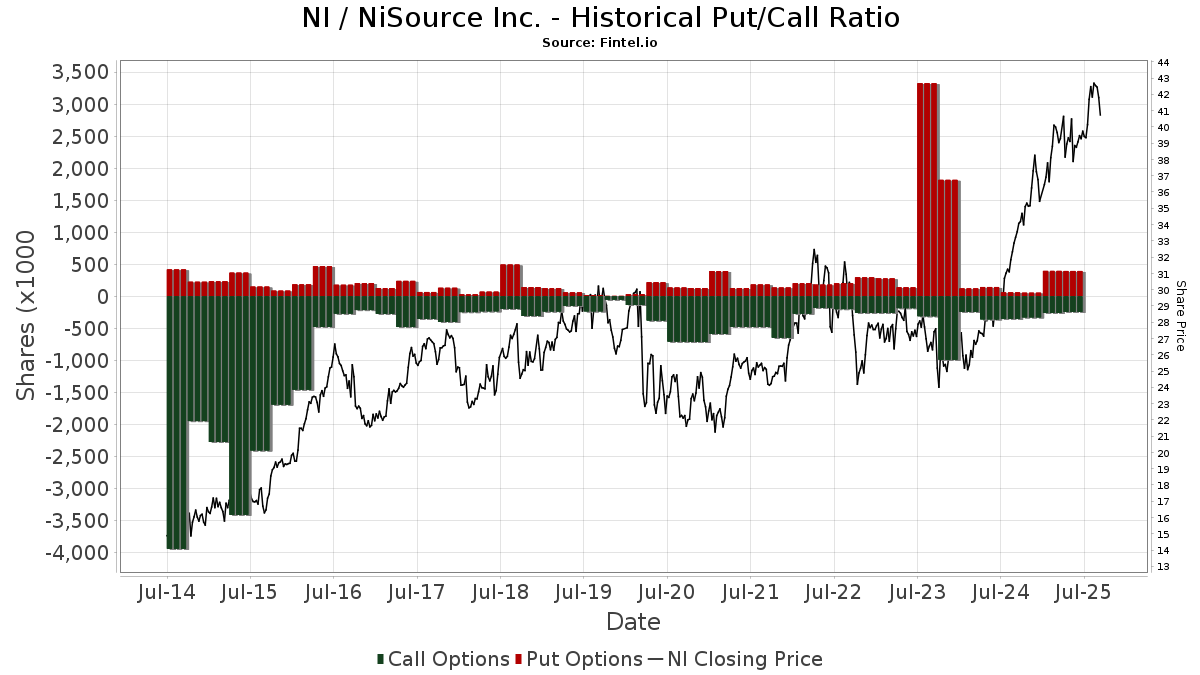
Institutionel Put/Call-forhold
Ud over at indberette standardaktie- og gældsudstedelser skal institutter med mere end 100 mill. aktiver under forvaltning også oplyse deres put- og call-optionsbeholdninger. Da salgsoptioner generelt indikerer negativ stemning, og købsoptioner indikerer positiv stemning, kan vi få en fornemmelse af den overordnede institutionelle stemning ved at plotte forholdet mellem put og kald. Diagrammet til højre viser det historiske put/call-forhold for dette instrument.
Brug af Put/Call Ratio som en indikator for investorernes stemning overvinder en af de vigtigste mangler ved at bruge totalt institutionelt ejerskab, som er, at en betydelig mængde af aktiver under forvaltning investeres passivt for at spore indekser. Passivt forvaltede fonde køber typisk ikke optioner, så indikatoren for put/call-forholdet følger mere nøje følelsen af aktivt forvaltede fonde.
13D/G-arkivering
Vi præsenterer 13D/G ansøgninger separat fra 13F ansøgninger på grund af den forskellige behandling af SEC. 13D/G-ansøgninger kan indgives af grupper af investorer (med én ledende), hvorimod 13F-ansøgninger ikke kan. Dette resulterer i situationer, hvor en investor kan indsende en 13D/G, der rapporterer én værdi for de samlede aktier (der repræsenterer alle de aktier, der ejes af investorgruppen), men derefter indsender en 13F, der rapporterer en anden værdi for de samlede aktier (der udelukkende repræsenterer deres egne) ejendomsret). Det betyder, at aktieejerskab af 13D/G-arkiver og 13F-arkiveringer ofte ikke er direkte sammenlignelige, så vi præsenterer dem separat.
Bemærk: Fra den 16. maj 2021 viser vi ikke længere ejere, der ikke har indsendt en 13D/G inden for det seneste år. Tidligere viste vi den fulde historie af 13D/G-arkiver. Generelt skal enheder, der er forpligtet til at indgive 13D/G-ansøgninger, indgive mindst årligt, før de indsender en afsluttende ansøgning. Dog forlader fonde nogle gange positioner uden at indsende en afsluttende ansøgning (dvs. de afvikler), så visning af den fulde historie resulterede nogle gange i forvirring om det nuværende ejerskab. For at undgå forvirring viser vi nu kun 'aktuelle' ejere - det vil sige - ejere, der har anmeldt inden for det seneste år.
Upgrade to unlock premium data.
| Fil dato | Form | Investor | Forrige Aktier |
Seneste Aktier |
Δ Aktier (Procent) |
Ejendomsret (Procent) |
Δ Ejerskab (Procent) |
|
|---|---|---|---|---|---|---|---|---|
| 2025-12-05 | T. Rowe Price Investment Management, Inc. | 40,716,565 | 50,331,635 | 23.61 | 10.50 | 20.69 | ||
| 2025-05-13 | STATE STREET CORP | 22,883,402 | 23,762,068 | 3.84 | 5.00 | 2.04 |
13F og NPORT arkivering
Detaljer om 13F-arkivering er gratis. Detaljer om NP-ansøgninger kræver et premium-medlemskab. Grønne rækker angiver nye positioner. Røde rækker angiver lukkede positioner. Klik på linket ikon for at se den fulde transaktionshistorik.
Opgrader
for at låse premium-data op og eksportere til Excel ![]() .
.
Important Note
In an effort to reduce load times for our mobile users, we are testing some ways to deliver lighter pages.
In this first test, we will deliver only the most recent 750 transactions (out of 994 for this stock). If you are interested in loading *all* the transactions for this company, click the "load all" button below. This is just a test and if you don't like it, please let us know by submitting some gentle feedback via the link at the bottom of this page.
Load All| Fil dato | Kilde | Investor | Type | Gennemsnitlig pris (Øst) |
Aktier | Δ Aktier (%) |
Rapporteret Værdi ($1000) |
Δ Værdi (%) |
Port Alloc (%) |
|
|---|---|---|---|---|---|---|---|---|---|---|
| 2025-11-04 | 13F | Flaharty Asset Management, LLC | 0 | -100,00 | 0 | |||||
| 2026-01-27 | 13F | Zurcher Kantonalbank (Zurich Cantonalbank) | 310.490 | 0,00 | 12.966 | -3,56 | ||||
| 2025-11-12 | 13F | Creekmur Asset Management LLC | 2.534 | 0,00 | 110 | 6,86 | ||||
| 2026-02-04 | 13F | JSF Financial, LLC | 29.992 | -0,56 | 1.252 | -4,06 | ||||
| 2026-02-13 | 13F | De Lisle Partners LLP | 100.000 | 4.176 | ||||||
| 2026-01-16 | 13F | Tema Etfs Llc | 250.840 | 83,60 | 10.475 | 77,09 | ||||
| 2026-02-10 | 13F | Arcadia Investment Management Corp/mi | 3 | 0 | ||||||
| 2026-02-03 | 13F | Lumbard & Kellner, LLC | 8.000 | 0,00 | 334 | -3,47 | ||||
| 2026-02-04 | 13F | Oregon Public Employees Retirement Fund | 54.638 | 1,55 | 2.282 | -2,06 | ||||
| 2026-02-13 | 13F | Prudential Financial Inc | 635.110 | -2,02 | 26.522 | -5,50 | ||||
| 2026-02-11 | 13F | Brand Asset Management Group, Inc. | 7.469 | 29,15 | 312 | 24,40 | ||||
| 2026-02-12 | 13F | California Public Employees Retirement System | 1.193.781 | -18,03 | 49.852 | -20,95 | ||||
| 2026-02-12 | 13F | South Dakota Investment Council | 9.600 | 10,34 | 0 | |||||
| 2026-02-13 | 13F | National Bank Of Canada /fi/ | 212.469 | -12,03 | 8.872 | -15,16 | ||||
| 2026-02-13 | 13F | Johnson Investment Counsel Inc | 0 | -100,00 | 0 | |||||
| 2026-01-14 | 13F | Tradewinds Capital Management, LLC | 69 | 0,00 | 3 | 0,00 | ||||
| 2026-02-05 | 13F | Allworth Financial LP | 10.377 | 155,03 | 433 | 146,02 | ||||
| 2026-01-07 | 13F | Sagespring Wealth Partners, Llc | 5.211 | 0,50 | 218 | -3,12 | ||||
| 2026-02-06 | 13F | Pathway Financial Advisers, LLC | 9.584 | 0,17 | 400 | -3,15 | ||||
| 2026-02-17 | 13F | Tower Research Capital LLC (TRC) | 11.701 | -64,07 | 489 | -65,37 | ||||
| 2026-02-03 | 13F | Harel Insurance Investments & Financial Services Ltd. | 521 | 6,54 | 0 | |||||
| 2026-02-11 | 13F | MCF Advisors LLC | 1.176 | 13,95 | 49 | 11,36 | ||||
| 2025-11-10 | 13F | Aurora Investment Counsel | 0 | -100,00 | 0 | -100,00 | ||||
| 2026-02-03 | 13F | NewEdge Wealth, LLC | 10.385 | 34,47 | 434 | 30,82 | ||||
| 2026-02-17 | 13F | Summit Global Investments | 91.246 | -65,32 | 4 | -72,73 | ||||
| 2026-02-11 | 13F | Sunrise Financial Services, LLC | 39 | 2 | ||||||
| 2026-02-09 | 13F | Redmond Asset Management, LLC | 6.674 | 0,00 | 279 | -3,47 | ||||
| 2026-02-10 | 13F | Eurizon Capital SGR S.p.A. | 61.574 | 2.572 | ||||||
| 2026-02-17 | 13F | Modern Wealth Management, LLC | 7.499 | -0,78 | 313 | -4,28 | ||||
| 2026-02-12 | 13F | Summit Financial, LLC | 8.144 | 15,03 | 340 | 11,11 | ||||
| 2026-02-03 | 13F | Coston, McIsaac & Partners | 282 | 0,00 | 0 | |||||
| 2026-01-12 | 13F | CVA Family Office, LLC | 55 | 0,00 | 2 | 0,00 | ||||
| 2026-01-28 | 13F | Mowery & Schoenfeld Wealth Management, LLC | 64 | 0,00 | 3 | 0,00 | ||||
| 2026-01-23 | 13F | Ritholtz Wealth Management | 6.684 | 0,18 | 279 | -3,12 | ||||
| 2026-01-28 | 13F | Consolidated Planning Corp | 140.084 | 23,86 | 5.850 | 19,44 | ||||
| 2026-02-12 | 13F | EntryPoint Capital, LLC | 11.695 | 488 | ||||||
| 2025-11-12 | 13F | Proficio Capital Partners LLC | 0 | -100,00 | 0 | |||||
| 2026-02-10 | 13F | REAP Financial Group, LLC | 845 | 15,91 | 35 | 12,90 | ||||
| 2025-11-14 | 13F | Wetherby Asset Management Inc | 7.240 | 0,21 | 313 | 7,56 | ||||
| 2026-02-13 | 13F | Acumen Wealth Advisors, LLC | 661 | 28 | ||||||
| 2026-02-10 | 13F | Root Financial Partners, LLC | 1.742 | 5,77 | 73 | 1,41 | ||||
| 2026-02-17 | 13F | Sagewood Asset Management LP | 5.748 | 240 | ||||||
| 2026-02-11 | 13F | Twin Tree Management, LP | Put | 17.500 | 8,70 | 731 | 4,73 | |||
| 2026-02-11 | 13F | Twin Tree Management, LP | 2.358 | 98 | ||||||
| 2026-01-22 | 13F | V-Square Quantitative Management LLC | 13.130 | -1,32 | 548 | -4,86 | ||||
| 2026-02-04 | 13F | Dogwood Wealth Management LLC | 6.049 | 253 | ||||||
| 2026-02-09 | 13F | Keating Financial Advisory Services, Inc. | 593 | 25 | ||||||
| 2026-02-03 | 13F | International Assets Investment Management, Llc | 549 | 23 | ||||||
| 2026-02-12 | 13F | JPL Wealth Management, LLC | 0 | -100,00 | 0 | |||||
| 2025-11-13 | 13F | Landscape Capital Management, L.l.c. | 0 | -100,00 | 0 | -100,00 | ||||
| 2026-02-17 | 13F | Lighthouse Investment Partners, LLC | 5.350 | 223 | ||||||
| 2026-01-16 | 13F | First Community Trust Na | 792 | 0,00 | 33 | -2,94 | ||||
| 2026-02-10 | 13F | Bank of New York Mellon Corp | 3.247.456 | -15,05 | 135.614 | -18,07 | ||||
| 2026-02-11 | 13F | Meeder Asset Management Inc | 207 | -6,33 | 9 | -11,11 | ||||
| 2026-01-30 | 13F | Richardson Capital Management LLC | 30 | 1 | ||||||
| 2026-02-06 | 13F | Kimelman & Baird, LLC | 13.950 | 0,00 | 583 | -3,64 | ||||
| 2026-02-13 | 13F | Golden State Wealth Management, LLC | 92 | 0,00 | 4 | 0,00 | ||||
| 2026-01-28 | 13F | WPG Advisers, LLC | 120 | 0,00 | 5 | 0,00 | ||||
| 2026-04-13 | 13F | IFP Advisors, Inc | 29.307 | -6,53 | 1.367 | 4,43 | ||||
| 2026-02-11 | 13F | Invst, LLC | 7.927 | 0,62 | 331 | -2,93 | ||||
| 2026-02-17 | 13F | Advisory Services Network, LLC | 15.171 | 1,47 | 634 | -2,16 | ||||
| 2025-10-30 | 13F | Traub Capital Management LLC | 0 | -100,00 | 0 | -100,00 | ||||
| 2026-01-26 | 13F | Moran Wealth Management, LLC | 98.546 | 0,40 | 4.115 | -3,18 | ||||
| 2026-02-17 | 13F | Energy Income Partners, LLC | 124.943 | -64,23 | 5.218 | -65,50 | ||||
| 2026-02-13 | 13F | Victory Capital Management Inc | 958.586 | -21,20 | 40.031 | -24,00 | ||||
| 2026-02-02 | 13F | Qrg Capital Management, Inc. | 16.335 | -5,34 | 682 | -8,70 | ||||
| 2026-02-04 | 13F | GGM Financials LLC | 351 | 0,86 | 15 | -6,67 | ||||
| 2026-02-17 | 13F | DZ BANK AG Deutsche Zentral Genossenschafts Bank, Frankfurt am Main | 0 | -100,00 | 0 | |||||
| 2026-02-11 | 13F | Capital International Investors | 8.167.328 | 0,38 | 341.068 | -3,19 | ||||
| 2026-04-10 | 13F | Quaker Wealth Management, LLC | 20 | 0,00 | 1 | |||||
| 2026-02-05 | 13F | Qsemble Capital Management, LP | 0 | -100,00 | 0 | |||||
| 2026-02-17 | 13F | Norinchukin Bank, The | 31.198 | 8,60 | 1.303 | 4,75 | ||||
| 2026-01-20 | 13F | Ascent Group, LLC | 38.590 | -33,32 | 1.612 | -35,71 | ||||
| 2026-02-13 | 13F | Sterling Capital Management LLC | 70.037 | -10,56 | 2.925 | -13,75 | ||||
| 2026-02-03 | 13F | We Are One Seven, LLC | 22.318 | 2,59 | 932 | -0,96 | ||||
| 2026-02-12 | 13F | New York State Common Retirement Fund | 204.184 | 0,00 | 8.527 | -3,56 | ||||
| 2026-01-20 | 13F | SOA Wealth Advisors, LLC. | 49 | 0,00 | 2 | 0,00 | ||||
| 2026-02-12 | 13F | Keystone Financial Services | 5.213 | -0,08 | 218 | -3,56 | ||||
| 2026-02-11 | 13F | J.w. Cole Advisors, Inc. | 8.372 | 2,49 | 336 | -4,82 | ||||
| 2026-02-17 | 13F/A | Northwest & Ethical Investments L.P. | 15.206 | -9,82 | 639 | -12,23 | ||||
| 2026-01-30 | 13F | R Squared Ltd | 10.664 | 445 | ||||||
| 2025-11-05 | 13F | Lokken Investment Group LLC | 4.727 | 205 | ||||||
| 2026-02-13 | 13F | Arkadios Wealth Advisors | 8.780 | 0,43 | 367 | -3,17 | ||||
| 2026-04-07 | 13F | Mb, Levis & Associates, Llc | 118 | 0,85 | 5 | 25,00 | ||||
| 2026-02-09 | 13F | Quest Partners LLC | 38.313 | 60,55 | 1.600 | 54,79 | ||||
| 2026-02-09 | 13F | Geode Capital Management, Llc | 12.459.421 | 2,01 | 518.301 | -1,59 | ||||
| 2026-02-12 | 13F | Empirical Finance, LLC | 14.142 | -3,83 | 591 | -7,23 | ||||
| 2026-01-29 | 13F | Dunhill Financial, LLC | 43 | 30,30 | 2 | 0,00 | ||||
| 2026-01-29 | 13F | Northern Oak Wealth Management Inc | 21.766 | -8,91 | 909 | -12,19 | ||||
| 2026-02-13 | 13F | Resources Investment Advisors, LLC. | 10.814 | -7,15 | 452 | -10,52 | ||||
| 2026-02-02 | 13F | Oppenheimer & Co Inc | 73.102 | 0,00 | 3.053 | -3,57 | ||||
| 2026-02-17 | 13F | Ameriprise Financial Inc | 1.540.866 | -10,37 | 64.347 | -13,56 | ||||
| 2026-02-19 | 13F | Atomi Financial Group, Inc. | 15.045 | 3,69 | 628 | 0,00 | ||||
| 2026-04-13 | 13F | Bank of New Hampshire | 500 | 0,00 | 23 | 15,00 | ||||
| 2026-02-09 | 13F | Cary Street Partner Investment Advisory Llc | 805 | 7,76 | 34 | 3,13 | ||||
| 2026-02-09 | 13F | MQS Management LLC | 10.365 | 433 | ||||||
| 2026-02-05 | 13F | Gamco Investors, Inc. Et Al | 6.300 | 0,00 | 263 | -3,31 | ||||
| 2025-11-12 | 13F | Ameriflex Group, Inc. | 0 | -100,00 | 0 | -100,00 | ||||
| 2026-01-23 | 13F | LOM Asset Management Ltd | 11.769 | 1,80 | 491 | -2,00 | ||||
| 2026-01-05 | 13F | Park National Corp /oh/ | 5.424 | -0,15 | 227 | -3,83 | ||||
| 2026-01-28 | 13F | Badgley Phelps Wealth Managers, LLC | 592.980 | 3,42 | 24.763 | -0,26 | ||||
| 2026-02-13 | 13F | Korea Investment CORP | 283.961 | 10,16 | 11.858 | 6,24 | ||||
| 2026-01-30 | 13F | Turning Point Benefit Group, Inc. | 230 | 2.200,00 | 10 | |||||
| 2026-01-30 | 13F | American Capital Advisory, LLC | 16 | 45,45 | 1 | |||||
| 2026-02-17 | 13F/A | Beverly Hills Private Wealth, LLC | 7.763 | -3,41 | 324 | -6,90 | ||||
| 2026-02-13 | 13F | Hurley Capital, LLC | 0 | -100,00 | 0 | |||||
| 2026-01-29 | 13F | Supplemental Annuity Collective Trust of NJ | 20.000 | 0,00 | 835 | -3,58 | ||||
| 2026-02-17 | 13F | Atom Investors LP | 44.029 | 1.839 | ||||||
| 2025-11-14 | 13F | Graham Capital Management, L.P. | 0 | -100,00 | 0 | -100,00 | ||||
| 2026-01-30 | 13F | North Star Investment Management Corp. | 302 | 20,80 | 13 | 20,00 | ||||
| 2026-02-11 | 13F | Strategy Asset Managers Llc | 15.979 | -0,97 | 667 | -4,44 | ||||
| 2025-11-12 | 13F | Cramer Rosenthal Mcglynn Llc | 0 | -100,00 | 0 | |||||
| 2026-01-26 | 13F | Main Street Group, LTD | 0 | -100,00 | 0 | |||||
| 2026-02-13 | 13F | Sei Investments Co | 488.939 | -5,02 | 20.418 | -8,40 | ||||
| 2026-01-12 | 13F | Lee Johnson Capital Management, Llc | 49.203 | -2,49 | 2.055 | -6,00 | ||||
| 2026-02-13 | 13F | Mariner, LLC | 18.305 | 105,08 | 763 | 97,67 | ||||
| 2026-02-17 | 13F | ExodusPoint Capital Management, LP | Put | 0 | -100,00 | 0 | -100,00 | |||
| 2026-02-06 | 13F | Newport Trust Co | 5.700.723 | -0,63 | 238.062 | -4,17 | ||||
| 2026-03-09 | 13F/A | CI Private Wealth, LLC | 82.229 | 16,23 | 3.435 | 12,11 | ||||
| 2026-02-10 | 13F | Mutual Of America Capital Management Llc | 169.497 | 2,56 | 7.078 | -1,09 | ||||
| 2026-02-13 | 13F | Public Sector Pension Investment Board | 0 | -100,00 | 0 | |||||
| 2026-02-17 | 13F | Vennlight Capital Management, LP | 91.024 | 3.801 | ||||||
| 2026-02-11 | 13F | Vaughan David Investments Inc/il | 1.290.697 | -1,86 | 54 | -5,36 | ||||
| 2026-01-26 | 13F | Thomasville National Bank | 591.847 | 2,38 | 24.716 | -1,26 | ||||
| 2026-02-12 | 13F | Federation des caisses Desjardins du Quebec | 108.494 | 17,24 | 4.531 | 13,05 | ||||
| 2026-01-21 | 13F | Yousif Capital Management, Llc | 73.366 | -5,61 | 3.184 | -5,38 | ||||
| 2026-04-13 | 13F | Wedge Capital Management L L P/nc | 115.829 | -31,97 | 5.405 | -23,98 | ||||
| 2026-02-13 | 13F | Mufg Securities Americas Inc. | 12.856 | 1,25 | 537 | -2,37 | ||||
| 2026-02-10 | 13F | Acadian Asset Management Llc | 8.155 | 0 | ||||||
| 2026-01-26 | 13F | JNBA Financial Advisors | 244 | 0,00 | 10 | 0,00 | ||||
| 2026-02-03 | 13F | Crossmark Global Holdings, Inc. | 18.522 | 0,93 | 773 | -2,64 | ||||
| 2026-02-11 | 13F | Picton Mahoney Asset Management | 291.600 | 7,75 | 12.177 | 110.600,00 | ||||
| 2026-02-13 | 13F | Icon Advisers Inc/co | 24.300 | 0,00 | 1.015 | -3,61 | ||||
| 2026-02-05 | 13F | Thrivent Financial For Lutherans | 2.085.746 | -11,23 | 87 | -13,86 | ||||
| 2026-02-06 | 13F | Lloyd Advisory Services, LLC. | 21 | 1 | ||||||
| 2025-11-14 | 13F | Nomura Holdings Inc | Call | 0 | -100,00 | 0 | -100,00 | |||
| 2026-01-23 | 13F | Robeco Institutional Asset Management B.V. | 364.579 | -5,34 | 15.225 | -8,71 | ||||
| 2026-02-09 | 13F | Coldstream Capital Management Inc | 9.638 | 14,86 | 402 | 10,74 | ||||
| 2026-02-11 | 13F | Franklin Resources Inc | 6.118.568 | -3,16 | 255.511 | -6,60 | ||||
| 2026-02-13 | 13F | Barclays Plc | 1.455.306 | 25,92 | 60.774 | 21,44 | ||||
| 2026-02-06 | 13F | Leonteq Securities AG | 1.660 | -5,47 | 69 | -9,21 | ||||
| 2026-02-17 | 13F | Woodline Partners LP | 81.302 | 30,65 | 3.395 | 26,02 | ||||
| 2026-01-27 | 13F | TD Waterhouse Canada Inc. | 1.463 | -59,26 | 61 | -60,39 | ||||
| 2026-02-11 | 13F | Illinois Municipal Retirement Fund | 26.919 | -0,95 | 1.124 | -4,42 | ||||
| 2026-02-17 | 13F | Brevan Howard Capital Management LP | 109.343 | 35,27 | 4.566 | 30,46 | ||||
| 2026-02-10 | 13F | Shepherd Financial Partners LLC | 7.711 | -0,19 | 322 | -3,59 | ||||
| 2026-01-21 | 13F | Raleigh Capital Management Inc. | 488 | -2,79 | 20 | -4,76 | ||||
| 2026-02-10 | 13F | Fideuram Asset Management (Ireland) dac | 390 | 14 | ||||||
| 2026-02-17 | 13F | Advisor Group Holdings, Inc. | 103.466 | -25,08 | 4.321 | -27,10 | ||||
| 2026-01-20 | 13F | Cigna Investments Inc /new | 0 | -100,00 | 0 | |||||
| 2026-02-17 | 13F | Captrust Financial Advisors | 58.788 | 23,85 | 2.455 | 19,42 | ||||
| 2026-04-13 | 13F | Hm Payson & Co | 3.399 | 28,60 | 159 | 43,64 | ||||
| 2026-01-23 | 13F/A | HF Advisory Group, LLC | 59.281 | 8,62 | 2.476 | 4,74 | ||||
| 2026-02-23 | 13F | Wealth Preservation Advisors, LLC | 82 | 0,00 | 3 | 0,00 | ||||
| 2026-02-06 | 13F | Motco | 120 | 0,00 | 5 | 0,00 | ||||
| 2026-02-11 | 13F | Rise Advisors, LLC | 0 | -100,00 | 0 | |||||
| 2026-02-13 | 13F | Quattro Advisors LLC | 109 | 5 | ||||||
| 2026-04-10 | 13F | Country Trust Bank | 700 | 0,00 | 33 | 10,34 | ||||
| 2026-02-11 | 13F | Meeder Advisory Services, Inc. | 41.641 | 1.739 | ||||||
| 2026-02-13 | 13F | Level Four Advisory Services, Llc | 15.679 | -15,88 | 655 | -18,96 | ||||
| 2026-02-10 | 13F | Principia Wealth Advisory, LLC | 28 | -6,67 | 1 | 0,00 | ||||
| 2026-04-13 | 13F | Community Trust & Investment Co | 75.036 | -0,57 | 3.501 | 11,11 | ||||
| 2025-11-04 | 13F | Transcend Wealth Collective, Llc | 0 | -100,00 | 0 | -100,00 | ||||
| 2026-01-30 | 13F | Sigma Planning Corp | 12.912 | -8,25 | 539 | -11,49 | ||||
| 2026-04-13 | 13F | Clayton Financial Group LLC | 25 | 0,00 | 1 | 0,00 | ||||
| 2026-02-17 | 13F | Toronto Dominion Bank | 179.482 | -7,43 | 7.495 | -10,72 | ||||
| 2026-02-13 | 13F | Bridgefront Capital, LLC | 8.212 | 343 | ||||||
| 2026-02-05 | 13F | High Note Wealth, LLC | 4 | 0,00 | 0 | |||||
| 2026-01-23 | 13F | Bellevue Asset Management, Llc | 188 | 1,08 | 8 | -12,50 | ||||
| 2026-02-06 | 13F | Envestnet Portfolio Solutions, Inc. | 9.756 | -12,30 | 407 | -15,38 | ||||
| 2026-02-03 | 13F | Wesbanco Bank Inc | 38.756 | -1,40 | 1.618 | -4,94 | ||||
| 2025-10-24 | 13F | Pinnacle Bancorp, Inc. | 0 | -100,00 | 0 | |||||
| 2026-01-14 | 13F | LVW Advisors, LLC | 0 | -100,00 | 0 | |||||
| 2026-02-17 | 13F | SummitTX Capital, L.P. | 136.520 | -14,47 | 5.701 | -17,51 | ||||
| 2026-02-03 | 13F | Sequoia Financial Advisors, LLC | 59.157 | 0,21 | 2.470 | -3,36 | ||||
| 2026-02-05 | 13F | Cambridge Investment Research Advisors, Inc. | 43.141 | 2,13 | 2 | 0,00 | ||||
| 2026-02-11 | 13F | Metis Global Partners, LLC | 49.621 | 1,28 | 2.072 | -2,31 | ||||
| 2025-11-13 | 13F | Riggs Asset Managment Co. Inc. | 0 | -100,00 | 0 | |||||
| 2026-01-30 | 13F | Wealth High Governance Capital Ltda | 0 | -100,00 | 0 | -100,00 | ||||
| 2026-02-17 | 13F | Ibex Wealth Advisors | 11.062 | -4,37 | 462 | -7,80 | ||||
| 2026-02-05 | 13F | Mesirow Financial Investment Management, Inc. | 8.005 | -3,20 | 334 | -6,70 | ||||
| 2026-02-12 | 13F | Federated Hermes, Inc. | 2.036 | -59,46 | 85 | -60,83 | ||||
| 2026-02-24 | 13F | Bell Investment Advisors, Inc | 181 | 0,00 | 8 | 0,00 | ||||
| 2026-01-30 | 13F | Keybank National Association/oh | 14.490 | -0,95 | 605 | -4,42 | ||||
| 2026-01-20 | 13F | Princeton Global Asset Management LLC | 372 | 0,00 | 16 | -6,25 | ||||
| 2026-04-13 | 13F | Artemis Investment Management LLP | 979.771 | 104,73 | 45.716 | 128,76 | ||||
| 2025-11-13 | 13F | Rehmann Capital Advisory Group | 0 | -100,00 | 0 | |||||
| 2026-04-10 | 13F | Finward Bancorp | 28.158 | -0,35 | 1.314 | 11,27 | ||||
| 2026-01-29 | 13F | Cherokee Insurance Co | 10.000 | 0,00 | 418 | -3,70 | ||||
| 2026-02-04 | 13F | HighPoint Advisor Group LLC | 7.893 | -0,54 | 330 | -4,08 | ||||
| 2026-02-11 | 13F | Fjarde Ap-fonden /fourth Swedish National Pension Fund | 280.000 | 11.693 | ||||||
| 2026-02-13 | 13F | Dai-Ichi Life Insurance Company, Ltd | 154.093 | -13,58 | 6.435 | -16,66 | ||||
| 2026-02-03 | 13F | Bokf, Na | 140.206 | -8,53 | 5.855 | -11,78 | ||||
| 2025-12-09 | 13F/A | Tudor Investment Corp Et Al | 264.593 | 11.457 | ||||||
| 2026-01-21 | 13F | Sound Income Strategies, LLC | 89 | 1.680,00 | 4 | |||||
| 2025-11-07 | 13F | Synovus Financial Corp | 5.418 | 0,00 | 235 | 7,34 | ||||
| 2026-04-13 | 13F | True Wealth Design, LLC | 95 | -7,77 | 4 | 0,00 | ||||
| 2026-04-09 | 13F | Goelzer Investment Management, Inc. | 245.549 | -20,46 | 11.457 | -11,12 | ||||
| 2026-02-06 | 13F | Profund Advisors Llc | 23.681 | -3,77 | 989 | -7,23 | ||||
| 2026-02-17 | 13F | DV Trading LLC | 1.125 | 47 | ||||||
| 2026-02-17 | 13F | Farringdon Capital, Ltd. | 0 | -100,00 | 0 | |||||
| 2026-02-09 | 13F | Investors Portfolio Services LLC | 52 | 2 | ||||||
| 2026-02-11 | 13F | Havemeyer Place LP | 14.606 | 610 | ||||||
| 2026-02-13 | 13F | Aviso Financial Inc. | 0 | -100,00 | 0 | |||||
| 2026-02-10 | 13F | Core Wealth Advisors, Llc | 1 | 0 | ||||||
| 2026-02-09 | 13F | William Blair Investment Management, Llc | 10.368 | -8,22 | 433 | -11,66 | ||||
| 2026-02-17 | 13F | Tcw Group Inc | 1.836.962 | -21,97 | 76.712 | -24,74 | ||||
| 2026-01-16 | 13F | Ronald Blue Trust, Inc. | 4.660 | 12,05 | 195 | 7,78 | ||||
| 2026-02-10 | 13F | BW Gestao de Investimentos Ltda. | 0 | -100,00 | 0 | |||||
| 2026-02-04 | 13F | Swiss Life Asset Management Ltd | 81.659 | 15,31 | 3.410 | 11,22 | ||||
| 2026-02-17 | 13F | GAM Holding AG | 0 | -100,00 | 0 | |||||
| 2025-11-14 | 13F | Strategic Wealth Partners, Ltd. | 1.119 | 0,00 | 48 | 6,67 | ||||
| 2026-02-05 | 13F | Td Private Client Wealth Llc | 5.910 | -9,62 | 247 | -13,07 | ||||
| 2026-01-20 | 13F | Hanson & Doremus Investment Management | 99.304 | 0,05 | 4 | 0,00 | ||||
| 2026-01-29 | 13F | State Of Michigan Retirement System | 124.969 | -1,88 | 5.219 | -5,39 | ||||
| 2026-01-12 | 13F | Contravisory Investment Management, Inc. | 14.093 | -6,62 | 589 | -9,95 | ||||
| 2026-02-11 | 13F | Jpmorgan Chase & Co | 7.477.325 | -11,98 | 312.253 | -15,11 | ||||
| 2026-02-11 | 13F | Jpmorgan Chase & Co | Call | 900 | 38 | |||||
| 2026-01-23 | 13F | Private Wealth Management Group, LLC | 6 | 0,00 | 0 | |||||
| 2026-04-07 | 13F | Pathway Financial Advisors LLC | 4.987 | 0,00 | 237 | 13,46 | ||||
| 2026-02-17 | 13F | Ninepoint Partners LP | 37.720 | -3,94 | 1.575 | -7,35 | ||||
| 2026-02-17 | 13F | Warren Averett Asset Management, LLC | 101.627 | -25,84 | 4.244 | -28,48 | ||||
| 2026-02-17 | 13F | Voleon Capital Management Lp | 10.852 | 61,49 | 453 | 56,21 | ||||
| 2026-02-11 | 13F | Flagship Wealth Advisors, Llc | 0 | -100,00 | 0 | |||||
| 2026-02-17 | 13F | Nomura Holdings Inc | 14.012 | -40,33 | 585 | -42,42 | ||||
| 2026-02-11 | 13F | Ing Groep Nv | 61.671 | 2.575 | ||||||
| 2026-02-17 | 13F | NEOS Investment Management LLC | 303.779 | 69,11 | 12.686 | 63,09 | ||||
| 2026-02-03 | 13F | SBI Securities Co., Ltd. | 55 | -58,02 | 2 | -60,00 | ||||
| 2026-02-17 | 13F | Altshuler Shaham Ltd | 5.778 | 5,17 | 241 | 1,69 | ||||
| 2026-02-12 | 13F | Advisors Asset Management, Inc. | 76.559 | 7,83 | 3.197 | 4,00 | ||||
| 2026-02-02 | 13F | Bay Harbor Wealth Management, LLC | 44 | 57,14 | 2 | 0,00 | ||||
| 2025-11-14 | 13F | Binnacle Investments Inc | 43 | 95,45 | 2 | |||||
| 2026-02-24 | 13F | SG Trading Solutions, LLC | 11.593 | 0 | ||||||
| 2026-02-13 | 13F | Verition Fund Management LLC | 398.377 | -65,20 | 16.636 | -66,44 | ||||
| 2026-02-18 | 13F | First Citizens Bank & Trust Co | 23.002 | -21,30 | 961 | -24,11 | ||||
| 2026-01-27 | 13F | Regions Financial Corp | 10.558 | -7,86 | 441 | -11,29 | ||||
| 2026-01-15 | 13F | Retirement Systems of Alabama | 864.783 | 0,12 | 36.113 | -3,44 | ||||
| 2026-02-17 | 13F | D1 Capital Partners L.P. | 1.214.570 | 50.720 | ||||||
| 2026-02-17 | 13F | Delaware Management Holdings, Inc. | 1.530.383 | 63.909 | ||||||
| 2026-01-20 | 13F | AdvisorNet Financial, Inc | 611 | 0,00 | 26 | -3,85 | ||||
| 2026-02-11 | 13F | Prudential Plc | 12.863 | -79,27 | 537 | -80,01 | ||||
| 2026-02-18 | 13F | GWM Advisors LLC | 0 | -100,00 | 0 | |||||
| 2026-04-09 | 13F | Moody National Bank Trust Division | 15.584 | -3,89 | 727 | 7,39 | ||||
| 2026-02-17 | 13F | Millennium Management Llc | 352.507 | -88,87 | 14.721 | -89,26 | ||||
| 2026-02-17 | 13F | Wellington Management Group Llp | 4.237.172 | 72,72 | 176.944 | 66,57 | ||||
| 2026-02-10 | 13F | Nomura Asset Management Co Ltd | 163.453 | 7,81 | 6.826 | 3,98 | ||||
| 2025-11-14 | 13F | WealthTrak Capital Management LLC | 0 | -100,00 | 0 | -100,00 | ||||
| 2026-02-17 | 13F | Wiley Bros.-aintree Capital, Llc | 43.505 | 61,04 | 1.817 | 55,08 | ||||
| 2026-01-21 | 13F | Capital Advisors, Ltd. LLC | 82 | 0,00 | 0 | |||||
| 2026-02-13 | 13F | Centaurus Financial, Inc. | 3.414 | 1,91 | 0 | |||||
| 2026-02-13 | 13F | Alyeska Investment Group, L.P. | 370.316 | 15.464 | ||||||
| 2026-02-13 | 13F | Entropy Technologies, LP | 26.716 | -64,29 | 1.116 | -65,58 | ||||
| 2026-02-11 | 13F | Capital International Inc /ca/ | 911.679 | -3,13 | 38.072 | -6,58 | ||||
| 2026-01-20 | 13F | Stratos Wealth Partners, LTD. | 0 | -100,00 | 0 | |||||
| 2026-02-04 | 13F | Tsfg, Llc | 200 | 0,00 | 0 | |||||
| 2026-02-05 | 13F | Pinnacle Associates Ltd | 7.018 | 0,66 | 293 | -2,66 | ||||
| 2026-02-12 | 13F | UniSuper Management Pty Ltd | 59.576 | -9,41 | 2.488 | -12,64 | ||||
| 2026-02-17 | 13F | Trexquant Investment LP | 419.471 | 71,84 | 17.517 | 65,74 | ||||
| 2026-02-06 | 13F | Fortis Group Advisors, LLC | 257 | 0,00 | 11 | -9,09 | ||||
| 2026-02-11 | 13F | Inceptionr Llc | 46.534 | 1.943 | ||||||
| 2026-02-09 | 13F | Avalon Trust Co | 4.000 | 0,00 | 167 | -3,47 | ||||
| 2026-02-13 | 13F | Smartleaf Asset Management LLC | 2.522 | 5,83 | 106 | 3,92 | ||||
| 2026-02-13 | 13F | Ostrum Asset Management | 3.888 | -24,88 | 162 | -27,68 | ||||
| 2026-02-12 | 13F | APG Asset Management N.V. | 250.285 | 2.006,07 | 8.899 | 1.936,38 | ||||
| 2026-02-09 | 13F | Smithfield Trust Co | 140 | 0,00 | 0 | |||||
| 2026-01-23 | 13F | Sage Mountain Advisors LLC | 11.288 | 471 | ||||||
| 2026-02-13 | 13F | Public Employees Retirement Association Of Colorado | 43.938 | 0,00 | 2 | 0,00 | ||||
| 2026-02-11 | 13F | Deutsche Bank Ag\ | 10.349.376 | -13,99 | 432.190 | -17,05 | ||||
| 2026-02-17 | 13F | Russell Investments Group, Ltd. | 862.003 | 16,21 | 36.006 | 12,12 | ||||
| 2026-01-29 | 13F | Comerica Bank | 128.478 | -8,53 | 5.365 | -11,77 | ||||
| 2026-02-10 | 13F | 3Chopt Investment Partners, LLC | 8.260 | -0,37 | 345 | -4,18 | ||||
| 2026-02-02 | 13F | Sandro Wealth Management LLC | 5.126 | 214 | ||||||
| 2025-10-31 | 13F | Intact Investment Management Inc. | 0 | -100,00 | 0 | |||||
| 2026-02-11 | 13F | OneAscent Wealth Management LLC | 0 | -100,00 | 0 | |||||
| 2026-02-10 | 13F | Hilltop Partners LLC | 7.157 | 0,00 | 299 | -3,56 | ||||
| 2026-02-24 | 13F | Barnes Wealth Management Group, Inc | 5.398 | -0,66 | 225 | -4,26 | ||||
| 2026-02-10 | 13F | Goldman Sachs Group Inc | 3.531.175 | -16,43 | 147.462 | -19,40 | ||||
| 2026-02-13 | 13F | Bollard Group LLC | 151.579 | -9,17 | 6 | -14,29 | ||||
| 2026-02-17 | 13F | Polymer Capital Management (US) LLC | 125.000 | -54,13 | 5.220 | -55,76 | ||||
| 2026-02-17 | 13F | Guggenheim Capital Llc | 377.160 | -7,12 | 15.750 | -10,42 | ||||
| 2026-01-13 | 13F | Stephens Consulting, LLC | 4 | 0 | ||||||
| 2026-02-11 | 13F | O'shaughnessy Asset Management, Llc | 65.634 | 1,00 | 2.741 | -2,60 | ||||
| 2026-02-11 | 13F | TruNorth Capital Management, LLC | 0 | -100,00 | 0 | |||||
| 2026-02-18 | 13F | Mackenzie Financial Corp | 111.977 | 74,93 | 4.699 | 69,58 | ||||
| 2025-10-24 | 13F | Hemington Wealth Management | 1.411 | -5,87 | 0 | |||||
| 2026-01-20 | 13F | Trust Co Of Toledo Na /oh/ | 1.000 | 0,00 | 42 | -4,65 | ||||
| 2026-01-27 | 13F | First Horizon Corp | 62 | 0,00 | 3 | 0,00 | ||||
| 2025-11-14 | 13F | Wolverine Trading, Llc | 28.599 | 1.236 | ||||||
| 2025-11-14 | 13F | Wolverine Trading, Llc | Call | 14.700 | 172,22 | 635 | 195,35 | |||
| 2026-02-04 | 13F | Clark Wealth Partners | 1 | 0,00 | 0 | |||||
| 2025-11-14 | 13F | Wolverine Trading, Llc | Put | 25.600 | 250,68 | 1.106 | 280,07 | |||
| 2026-02-13 | 13F | Virtus ETF Advisers LLC | 10.877 | -20,61 | 454 | -23,44 | ||||
| 2026-02-17 | 13F | Nissay Asset Management Corp /japan/ /adv | 77.338 | -4,30 | 3.230 | -7,72 | ||||
| 2026-01-26 | 13F/A | LifeWealth Investments, LLC | 0 | -100,00 | 0 | |||||
| 2026-02-09 | 13F | Beck Bode, LLC | 479.141 | 0,33 | 20.009 | -3,24 | ||||
| 2026-02-10 | 13F | Reaves W H & Co Inc | 5.424.733 | 8,29 | 226.537 | 4,43 | ||||
| 2026-02-11 | 13F | Cedar Mountain Advisors, LLC | 14 | 0,00 | 1 | |||||
| 2026-02-17 | 13F | Aster Capital Management (DIFC) Ltd | 0 | -100,00 | 0 | |||||
| 2026-02-18 | 13F | Achmea Investment Management B.V. | 41.624 | 1,02 | 2 | 0,00 | ||||
| 2026-02-06 | 13F | Resona Asset Management Co.,Ltd. | 148.751 | -0,90 | 6.217 | -4,33 | ||||
| 2026-04-08 | 13F | Community Financial Services Group, LLC | 1.582 | 74 | ||||||
| 2026-02-10 | 13F | Envestnet Asset Management Inc | 490.612 | -4,80 | 20.488 | -8,19 | ||||
| 2026-02-18 | 13F | EP Wealth Advisors, Inc. | 14.265 | 6,36 | 596 | 9,98 | ||||
| 2026-02-12 | 13F | Ensign Peak Advisors, Inc | 496.494 | -42,89 | 20.734 | -44,92 | ||||
| 2026-02-17 | 13F | Mercer Global Advisors Inc /adv | 40.276 | 35,88 | 1.682 | 31,02 | ||||
| 2026-02-14 | 13F | Rockefeller Capital Management L.P. | 693.225 | 48,94 | 28.927 | 43,53 | ||||
| 2026-02-10 | 13F | Horizon Bancorp Inc /in/ | 16.197 | 0,00 | 1 | |||||
| 2026-01-28 | 13F | Universal- Beteiligungs- und Servicegesellschaft mbH | 212.709 | -0,57 | 8.885 | -4,07 | ||||
| 2026-02-10 | 13F | Norges Bank | 8.066.389 | 336.852 | ||||||
| 2025-10-30 | 13F | Twin Peaks Wealth Advisors, LLC | 0 | -100,00 | 0 | |||||
| 2026-02-13 | 13F | Ubs Asset Management Americas Inc | 4.046.284 | 2,18 | 168.973 | -1,45 | ||||
| 2026-02-13 | 13F | Cornerstone Financial Management LLC | 456 | 19 | ||||||
| 2026-02-17 | 13F | Sherbrooke Park Advisers Llc | 0 | -100,00 | 0 | |||||
| 2026-01-14 | 13F | Exchange Traded Concepts, Llc | 682.330 | -2,22 | 28.494 | -5,70 | ||||
| 2026-01-16 | 13F | Louisiana State Employees Retirement System | 24.400 | -1,21 | 1.019 | -4,77 | ||||
| 2026-02-17 | 13F | Susquehanna Fundamental Investments, Llc | 221.332 | -11,05 | 9.243 | -14,22 | ||||
| 2026-02-17 | 13F | PharVision Advisers, LLC | 5.326 | 222 | ||||||
| 2025-11-13 | 13F | Panagora Asset Management Inc | 0 | -100,00 | 0 | |||||
| 2026-04-08 | 13F | Sapient Capital Llc | 7.907 | -3,89 | 369 | 6,67 | ||||
| 2026-02-17 | 13F | Price T Rowe Associates Inc /md/ | 854.634 | 0,90 | 36 | -2,78 | ||||
| 2026-04-06 | 13F | CX Institutional | 6.684 | 15,76 | 0 | |||||
| 2026-02-10 | 13F | State of Wyoming | 9.349 | -2,04 | 390 | -5,57 | ||||
| 2026-02-17 | 13F | Glenmede Trust Co Na | 64.258 | -33,79 | 2.683 | -31,03 | ||||
| 2026-02-13 | 13F | JustInvest LLC | 52.761 | 7,55 | 2.203 | 3,72 | ||||
| 2026-02-17 | 13F | Canada Pension Plan Investment Board | 4.400 | 184 | ||||||
| 2026-02-18 | 13F | State of Tennessee, Treasury Department | 306.782 | 5,90 | 13.587 | 8,32 | ||||
| 2026-02-06 | 13F | Tortoise Investment Management, LLC | 0 | -100,00 | 0 | |||||
| 2026-01-28 | 13F | Davis Capital Management | 1 | -83,33 | 0 | |||||
| 2026-02-13 | 13F | Great West Life Assurance Co /can/ | 555.261 | -28,45 | 23 | -30,30 | ||||
| 2026-01-08 | 13F | Regent Peak Wealth Advisors LLC | 8.586 | 0,26 | 359 | -3,24 | ||||
| 2026-02-13 | 13F | Banco Santander, S.A. | 180.476 | 0,00 | 7.537 | -3,56 | ||||
| 2026-01-09 | 13F | SG Americas Securities, LLC | 196.237 | 69,30 | 8 | 60,00 | ||||
| 2026-02-02 | 13F | CENTRAL TRUST Co | 540 | 22,73 | 23 | 15,79 | ||||
| 2026-02-17 | 13F | BTG Pactual Asset Management US LLC | 0 | -100,00 | 0 | |||||
| 2026-01-30 | 13F | Jennison Associates Llc | 9.429.794 | -1,03 | 393.788 | -4,55 | ||||
| 2026-02-05 | 13F | Amalgamated Bank | 88.354 | -3,00 | 4 | 0,00 | ||||
| 2026-02-12 | 13F | StoneX Group Inc. | 4.884 | 0,39 | 204 | -3,33 | ||||
| 2026-02-17 | 13F | Clear Street Markets Llc | 708 | -12,81 | 30 | -17,14 | ||||
| 2026-02-17 | 13F | Maryland State Retirement & Pension System | 472.429 | 2,85 | 19.729 | -0,81 | ||||
| 2026-02-06 | 13F | McKinley Carter Wealth Services, Inc. | 7.918 | -14,47 | 331 | -17,50 | ||||
| 2026-04-10 | 13F | Armstrong Advisory Group, Inc | 1.102 | 0,00 | 51 | 10,87 | ||||
| 2026-02-10 | 13F | Axq Capital, Lp | 17.321 | 723 | ||||||
| 2026-02-17 | 13F | Citadel Advisors Llc | Put | 38.000 | -96,25 | 1.587 | -96,39 | |||
| 2026-01-23 | 13F | Monarch Capital Management Inc/ | 5.370 | 0,00 | 224 | -3,45 | ||||
| 2026-02-10 | 13F | Evolution Wealth Management Inc. | 78 | 3 | ||||||
| 2026-03-05 | 13F | Gunpowder Capital Management, LLC dba Oliver Wealth Management | 213 | 9 | ||||||
| 2026-02-11 | 13F | Vestcor Inc | 65.854 | 320,68 | 3 | |||||
| 2026-02-17 | 13F | Citadel Advisors Llc | 2.486.380 | 111,59 | 103.831 | 104,07 | ||||
| 2026-02-05 | 13F | Northwestern Mutual Investment Management Company, Llc | 15.247 | 1,60 | 637 | -2,00 | ||||
| 2026-02-04 | 13F | Pacer Advisors, Inc. | 0 | -100,00 | 0 | |||||
| 2026-01-23 | 13F | Cantor Fitzgerald Investment Adviser L.p. | 206.036 | -0,57 | 8.604 | -4,10 | ||||
| 2026-02-12 | 13F | State Board Of Administration Of Florida Retirement System | 373.534 | -4,92 | 15.599 | -8,30 | ||||
| 2026-01-29 | 13F | Schnieders Capital Management, Llc. | 20.784 | -0,61 | 868 | -4,20 | ||||
| 2026-01-23 | 13F | Sumitomo Mitsui Trust Holdings, Inc. | 1.037.042 | -5,36 | 43.307 | -8,73 | ||||
| 2026-02-12 | 13F | Mount Yale Investment Advisors, LLC | 15.036 | -2,67 | 628 | -6,14 | ||||
| 2026-04-10 | 13F | Oak Thistle LLC | 94.030 | 38,58 | 4.387 | 54,85 | ||||
| 2026-01-28 | 13F | Teacher Retirement System Of Texas | 15.554 | -74,77 | 650 | -75,68 | ||||
| 2026-02-06 | 13F | Bare Financial Services, Inc | 0 | -100,00 | 0 | |||||
| 2026-01-22 | 13F | Wetzel Investment Advisors, Inc. | 5.826 | 0,00 | 243 | -3,57 | ||||
| 2026-01-09 | 13F | Assenagon Asset Management S.A. | 506.363 | -72,84 | 21.146 | -73,80 | ||||
| 2026-02-17 | 13F | Susquehanna Portfolio Strategies, LLC | 207.788 | 0,00 | 8.677 | -3,56 | ||||
| 2025-11-14 | 13F | Walleye Capital LLC | Call | 0 | -100,00 | 0 | -100,00 | |||
| 2026-01-30 | 13F | Laurel Wealth Advisors LLC | 1.090 | 46 | ||||||
| 2026-02-09 | 13F | Frazier Financial Advisors, LLC | 3.649 | 0,00 | 152 | -3,80 | ||||
| 2026-01-30 | 13F | Archer Investment Corp | 13.537 | 0,00 | 565 | -3,58 | ||||
| 2026-04-02 | 13F | NorthAvenue LLC | 1 | 0 | ||||||
| 2026-02-04 | 13F | Ameritas Advisory Services, LLC | 14.752 | 3.012,24 | 616 | 2.980,00 | ||||
| 2026-01-26 | 13F | Paradigm Financial Partners, Llc | 9.502 | -57,31 | 397 | -58,88 | ||||
| 2025-10-28 | 13F | Prossimo Advisors, LLC | 0 | -100,00 | 0 | |||||
| 2025-11-14 | 13F | Williamson Legacy Group, LLC | 0 | -100,00 | 0 | |||||
| 2026-02-17 | 13F | Jones Financial Companies Lllp | 215.259 | 4,83 | 8.989 | 2,84 | ||||
| 2026-02-10 | 13F/A | Northwestern Mutual Wealth Management Co | 17.047 | -25,61 | 712 | -28,33 | ||||
| 2025-10-23 | 13F | Anb Bank | 0 | -100,00 | 0 | -100,00 | ||||
| 2026-01-14 | 13F | ORG Partners LLC | 318 | 3,25 | 13 | 0,00 | ||||
| 2026-02-10 | 13F | Ilmarinen Mutual Pension Insurance Co | 0 | -100,00 | 0 | -100,00 | ||||
| 2026-02-11 | 13F | Deseret Mutual Benefit Administrators | 651 | 0,00 | 27 | -3,57 | ||||
| 2026-02-17 | 13F | Laird Norton Trust Company, Llc | 13.566 | 567 | ||||||
| 2026-02-12 | 13F | Penserra Capital Management LLC | 30 | 150,00 | 0 | |||||
| 2026-02-13 | 13F | Advyzon Investment Management, LLC | 5.969 | 17,27 | 249 | 13,18 | ||||
| 2026-02-09 | 13F | Huntington National Bank | 27.659 | -3,89 | 1.155 | -7,30 | ||||
| 2026-02-13 | 13F | Integrated Wealth Concepts LLC | 7.133 | 12,77 | 298 | 8,79 | ||||
| 2026-01-28 | 13F | Barrett & Company, Inc. | 650 | 0,00 | 27 | -3,57 | ||||
| 2026-02-11 | 13F | Janney Montgomery Scott LLC | 161.976 | 0,96 | 7 | 0,00 | ||||
| 2026-02-13 | 13F | Gen-Wealth Partners Inc | 999 | -10,72 | 42 | -14,58 | ||||
| 2026-04-13 | 13F | Mather Group, Llc. | 5.695 | 3,94 | 266 | 16,23 | ||||
| 2026-02-04 | 13F | ELCO Management Co., LLC | 13.216 | 552 | ||||||
| 2026-03-04 | 13F | SHP Wealth Management | 4.260 | 178 | ||||||
| 2026-01-29 | 13F | UBS Group AG | Call | 0 | -100,00 | 0 | -100,00 | |||
| 2026-02-02 | 13F | Millstone Evans Group, LLC | 27 | 0,00 | 1 | 0,00 | ||||
| 2026-02-13 | 13F | Jacobi Capital Management LLC | 6.736 | 0,07 | 281 | -3,44 | ||||
| 2026-02-17 | 13F | Utah Retirement Systems | 77.613 | 0,43 | 3.241 | -3,14 | ||||
| 2026-03-12 | 13F/A | Peak6 Llc | Put | 0 | -100,00 | 0 | -100,00 | |||
| 2026-02-12 | 13F | Xponance, Inc. | 79.597 | 4,60 | 3.324 | 0,85 | ||||
| 2026-02-17 | 13F | Dark Forest Capital Management Lp | 0 | -100,00 | 0 | -100,00 | ||||
| 2025-11-14 | 13F | Natixis | 0 | -100,00 | 0 | |||||
| 2026-04-02 | 13F | Crumly & Associates Inc. | 21.065 | 8,88 | 983 | 21,69 | ||||
| 2026-04-13 | 13F | Wolff Wiese Magana Llc | 395 | 0,00 | 18 | 12,50 | ||||
| 2026-01-23 | 13F | Smallwood Wealth Investment Management, LLC | 500 | 0,00 | 21 | -4,76 | ||||
| 2026-02-13 | 13F | Walleye Trading LLC | Call | 15.700 | 109,33 | 656 | 102,16 | |||
| 2026-02-17 | 13F | Prosperity Consulting Group, LLC | 22.265 | -5,52 | 930 | -8,92 | ||||
| 2026-02-13 | 13F | Walleye Trading LLC | Put | 26.400 | -84,32 | 1.102 | -84,89 | |||
| 2026-02-12 | 13F | Colonial Trust Advisors | 750 | 0,00 | 31 | -3,12 | ||||
| 2026-01-21 | 13F | Aaron Wealth Advisors LLC | 5.145 | 215 | ||||||
| 2026-02-12 | 13F | Cibc World Markets Corp | 66.161 | 11,71 | 2.763 | 15,61 | ||||
| 2026-04-08 | 13F | RDA Financial Network | 0 | -100,00 | 0 | |||||
| 2026-01-30 | 13F | NJ State Employees Deferred Compensation Plan | 0 | -100,00 | 0 | |||||
| 2025-11-14 | 13F | Point72 Europe (London) LLP | 178.100 | 7.712 | ||||||
| 2026-02-03 | 13F | Ethic Inc. | 13.317 | 34,58 | 556 | 29,91 | ||||
| 2026-02-06 | 13F | Vestmark Advisory Solutions, Inc. | 28.916 | 1.208 | ||||||
| 2026-02-17 | 13F | FIL Ltd | 7.074 | 67,63 | 295 | 62,09 | ||||
| 2026-02-02 | 13F | Strs Ohio | 574.429 | 0,03 | 23.988 | -3,53 | ||||
| 2026-02-17 | 13F | Susquehanna International Group, Llp | Call | 123.700 | 58,39 | 5.166 | 52,77 | |||
| 2026-02-05 | 13F | ANTIPODES PARTNERS Ltd | 2.083.217 | 7,28 | 87.002 | 3,47 | ||||
| 2026-02-17 | 13F | Susquehanna International Group, Llp | 95.328 | 28,33 | 3.981 | 23,76 | ||||
| 2026-02-17 | 13F | Susquehanna International Group, Llp | Put | 45.900 | 59,38 | 1.917 | 53,65 | |||
| 2025-11-14 | 13F | AXA Investment Managers S.A. | 26.236 | 1.136 | ||||||
| 2026-04-06 | 13F | GAMMA Investing LLC | 28.549 | 8,15 | 1.332 | 20,87 | ||||
| 2026-01-29 | 13F | UMA Financial Services, Inc. | 91 | 0,00 | 4 | 0,00 | ||||
| 2026-02-13 | 13F | Neuberger Berman Group LLC | 533.222 | 8,99 | 22.267 | 5,12 | ||||
| 2026-02-17 | 13F | Harvest Investment Services, LLC | 4.829 | 202 | ||||||
| 2026-02-17 | 13F | Credit Agricole S A | 187.273 | 16,45 | 7.821 | 12,31 | ||||
| 2026-01-26 | 13F | Mirae Asset Global Investments Co., Ltd. | 79.606 | 23,83 | 3.324 | 19,44 | ||||
| 2026-01-12 | 13F | Rialto Wealth Management, LLC | 28 | 12,00 | 1 | 0,00 | ||||
| 2026-02-17 | 13F | Fwl Investment Management, Llc | 0 | -100,00 | 0 | |||||
| 2026-02-23 | 13F | Mv Capital Management, Inc. | 100 | 0,00 | 4 | 0,00 | ||||
| 2026-02-11 | 13F | TCTC Holdings, LLC | 74 | 0,00 | 3 | 0,00 | ||||
| 2026-02-17 | 13F | Balyasny Asset Management Llc | Call | 0 | -100,00 | 0 | ||||
| 2026-01-21 | 13F | Kraematon Investment Advisors, Inc | 5.194 | 10,77 | 217 | 6,40 | ||||
| 2026-02-11 | 13F | OneAscent Investment Solutions LLC | 6.915 | -0,09 | 289 | -3,68 | ||||
| 2026-01-29 | 13F | Teachers Retirement System Of The State Of Kentucky | 36.638 | 0,00 | 2 | 0,00 | ||||
| 2026-02-09 | 13F | Morningstar Investment Management LLC | 5.223 | -0,38 | 0 | |||||
| 2026-02-13 | 13F | Colony Group, LLC | 32.045 | 128,81 | 1.338 | 120,79 | ||||
| 2026-04-08 | 13F | Arlington Trust Co LLC | 35 | 2 | ||||||
| 2026-02-12 | 13F | Qtron Investments LLC | 0 | -100,00 | 0 | |||||
| 2026-02-20 | 13F | Kovitz Investment Group Partners, LLC | 0 | -100,00 | 0 | |||||
| 2025-11-25 | 13F | Briaud Financial Planning, Inc | 0 | -100,00 | 0 | |||||
| 2026-02-10 | 13F | Savant Capital, LLC | 14.557 | -1,45 | 608 | -5,01 | ||||
| 2026-02-12 | 13F/A | Pinebridge Investments Llc | 20.319 | 849 | ||||||
| 2025-11-12 | 13F | Tounjian Advisory Partners, Llc | 0 | -100,00 | 0 | -100,00 | ||||
| 2025-11-13 | 13F | Hartree Partners, LP | 0 | -100,00 | 0 | -100,00 | ||||
| 2026-02-06 | 13F | Kingdom Financial Group LLC. | 14.632 | 611 | ||||||
| 2026-02-17 | 13F | Man Group plc | 369.425 | 17,17 | 15.427 | 13,00 | ||||
| 2026-02-03 | 13F | CGC Financial Services, LLC | 200 | 0,00 | 8 | 0,00 | ||||
| 2026-02-04 | 13F | Sentry Investment Management Llc | 1.175 | 0,00 | 0 | |||||
| 2025-10-22 | 13F | Stanley-Laman Group, Ltd. | 0 | -100,00 | 0 | |||||
| 2026-02-09 | 13F | Key FInancial Inc | 378 | 0,00 | 16 | -6,25 | ||||
| 2026-02-13 | 13F | Rhumbline Advisers | 1.000.123 | -0,78 | 41.765 | -4,31 | ||||
| 2026-02-10 | 13F | Moors & Cabot, Inc. | 9.185 | -3,92 | 384 | -7,26 | ||||
| 2026-02-04 | 13F | Hartford Investment Management Co | 28.077 | 0,04 | 1.172 | -3,54 | ||||
| 2026-02-13 | 13F | Knollwood Investment Advisory, LLC | 5.416 | 0,00 | 226 | -3,42 | ||||
| 2026-02-17 | 13F | Aventail Capital Group, LP | 207.848 | -17,66 | 8.680 | -20,59 | ||||
| 2026-01-27 | 13F | Probity Advisors, Inc. | 0 | -100,00 | 0 | |||||
| 2026-02-13 | 13F | Ceredex Value Advisors LLC | 462.050 | 19.295 | ||||||
| 2026-01-27 | 13F | Meritage Portfolio Management | 9.151 | -7,81 | 382 | -10,96 | ||||
| 2026-02-05 | 13F | 1st Source Bank | 23.323 | 0,00 | 974 | -3,57 | ||||
| 2026-01-30 | 13F | State of New Jersey Common Pension Fund D | 129.509 | -0,94 | 5.408 | -4,45 | ||||
| 2025-11-14 | 13F | Hrt Financial Lp | 0 | -100,00 | 0 | -100,00 | ||||
| 2026-01-23 | 13F | Patton Fund Management, Inc. | 82.115 | 34,52 | 3.429 | 29,74 | ||||
| 2026-02-13 | 13F | Walleye Capital LLC | 32.678 | -60,38 | 1.365 | -61,80 | ||||
| 2026-02-13 | 13F | Walleye Capital LLC | Put | 9.700 | 405 | |||||
| 2026-02-13 | 13F | Seneschal Advisors, LLC | 989 | 0,00 | 41 | -2,38 | ||||
| 2026-01-21 | 13F | Sowell Financial Services LLC | 5.940 | 2,06 | 248 | -1,20 | ||||
| 2026-02-11 | 13F | Cerity Partners LLC | 60.309 | 4,09 | 2.519 | 0,40 | ||||
| 2026-02-04 | 13F | Boston Private Wealth Llc | 22.370 | -65,81 | 934 | -67,02 | ||||
| 2026-02-13 | 13F | Toroso Investments, LLC | 6.665 | -10,90 | 278 | -13,93 | ||||
| 2026-02-13 | 13F | Walleye Trading LLC | 0 | -100,00 | 0 | -100,00 | ||||
| 2026-02-12 | 13F | Cloud Capital Management, LLC | 0 | -100,00 | 0 | |||||
| 2026-02-17 | 13F | Tortoise Capital Advisors, L.l.c. | 701.207 | 18,18 | 29.282 | 13,98 | ||||
| 2026-02-17 | 13F | Creative Planning | 109.945 | 25,83 | 4.591 | 21,36 | ||||
| 2026-02-09 | 13F | Jackson Creek Investment Advisors LLC | 27.995 | -2,84 | 1 | 0,00 | ||||
| 2026-01-16 | 13F | Crewe Advisors LLC | 609 | 0,00 | 25 | -3,85 | ||||
| 2026-02-04 | 13F | Washington Trust Bank | 198.875 | -0,54 | 8.305 | -4,07 | ||||
| 2026-02-13 | 13F | Schroder Investment Management Group | 585.864 | -48,56 | 24.636 | -49,95 | ||||
| 2026-02-10 | 13F | DT Investment Partners, LLC | 198 | 0,00 | 8 | 0,00 | ||||
| 2026-02-12 | 13F | McMillan Office, Inc. | 400 | 17 | ||||||
| 2026-02-17 | 13F | Citadel Advisors Llc | Call | 0 | -100,00 | 0 | ||||
| 2025-11-17 | 13F | LGT Financial Advisors LLC | 0 | -100,00 | 0 | |||||
| 2026-01-29 | 13F | D.a. Davidson & Co. | 5.511 | 230 | ||||||
| 2026-02-06 | 13F | Pnc Financial Services Group, Inc. | 119.783 | -4,84 | 5.002 | -8,22 | ||||
| 2026-01-23 | 13F | State of Alaska, Department of Revenue | 47.376 | -5,96 | 2 | -50,00 | ||||
| 2026-02-02 | 13F | Danske Bank A/s | 17.678 | 0,00 | 738 | -3,53 | ||||
| 2026-02-11 | 13F | Zions Bancorporation, National Association /ut/ | 620 | 113,79 | 26 | 108,33 | ||||
| 2026-01-12 | 13F | Avanza Fonder AB | 2.607 | 109 | ||||||
| 2026-02-13 | 13F | Rafferty Asset Management, LLC | 52.550 | 6,01 | 2.194 | 2,24 | ||||
| 2025-11-14 | 13F | Brooklands Fund Management Ltd | Call | 0 | -100,00 | 0 | ||||
| 2026-01-13 | 13F | Capital Investment Advisors, LLC | 7.922 | 9,37 | 331 | 5,43 | ||||
| 2026-02-13 | 13F | Marshall Wace, Llp | 26.200 | 1.094 | ||||||
| 2026-02-13 | 13F | Parkside Financial Bank & Trust | 812 | 8,56 | 34 | 3,13 | ||||
| 2026-02-13 | 13F | Chevy Chase Trust Holdings, Inc. | 242.017 | 0,71 | 10.107 | -2,87 | ||||
| 2026-02-09 | 13F | Harbour Investments, Inc. | 3.375 | 8,80 | 141 | 4,48 | ||||
| 2026-04-07 | 13F | Estate Planners Group, LLC | 475 | 20 | ||||||
| 2025-11-13 | 13F | Magnetar Financial LLC | 0 | -100,00 | 0 | |||||
| 2026-02-26 | 13F | TD Capital Management LLC | 102 | 0,00 | 4 | 0,00 | ||||
| 2026-02-17 | 13F | Strive Financial Group ,LLC | 618 | 26 | ||||||
| 2026-02-11 | 13F | Capital Analysts, Inc. | 50.899 | 2,03 | 2 | 0,00 | ||||
| 2026-01-26 | 13F | Duff & Phelps Investment Management Co | 3.106.606 | -0,50 | 129.732 | -4,03 | ||||
| 2026-02-12 | 13F | Bradley Foster & Sargent Inc/ct | 211.400 | 0,00 | 8.828 | -3,55 | ||||
| 2026-04-07 | 13F | Eastern Bank | 1.661 | -7,00 | 78 | 4,05 | ||||
| 2026-02-06 | 13F | Banque Cantonale Vaudoise | 14.559 | -2,63 | 608 | |||||
| 2026-01-12 | 13F | Skyline Advisors, Inc. | 6.373 | 0,00 | 266 | -3,27 | ||||
| 2026-02-03 | 13F | Everence Capital Management Inc | 0 | -100,00 | 0 | |||||
| 2026-01-29 | 13F | KC Investment Advisors, LLC | 0 | -100,00 | 0 | |||||
| 2026-02-10 | 13F | Argent Trust Co | 0 | -100,00 | 0 | |||||
| 2025-11-12 | 13F | Bellwether Advisors, LLC | 0 | -100,00 | 0 | |||||
| 2026-02-06 | 13F | Covestor Ltd | 399 | -15,29 | 0 | |||||
| 2025-11-14 | 13F | Ossiam | 0 | -100,00 | 0 | |||||
| 2026-04-13 | 13F | Massmutual Trust Co Fsb/adv | 839 | -8,51 | 39 | 2,63 | ||||
| 2026-01-26 | 13F | Reyes Financial Architecture, Inc. | 90 | 0,00 | 4 | 0,00 | ||||
| 2026-02-17 | 13F | Polymer Capital Management (US) LLC | Call | 0 | -100,00 | 0 | ||||
| 2026-01-29 | 13F | Calamos Advisors LLC | 212.955 | -3,90 | 8.893 | -7,32 | ||||
| 2026-01-27 | 13F | Asset Management One Co., Ltd. | 329.445 | -5,43 | 13.813 | -8,43 | ||||
| 2026-02-13 | 13F | Kennedy Capital Management, Inc. | 109.636 | -0,23 | 4.578 | -3,78 | ||||
| 2026-02-02 | 13F | Fifth Third Bancorp | 10.825 | 2,63 | 452 | -0,88 | ||||
| 2026-02-10 | 13F | Td Asset Management Inc | 1.481.539 | -0,68 | 61.869 | -4,21 | ||||
| 2026-02-12 | 13F | Triumph Capital Management | 100 | 0,00 | 4 | 0,00 | ||||
| 2026-02-13 | 13F | Baird Financial Group, Inc. | 9.761 | 27,98 | 408 | 23,33 | ||||
| 2026-02-10 | 13F | Ritter Daniher Financial Advisory LLC / DE | 241 | 0,00 | 10 | 0,00 | ||||
| 2026-01-20 | 13F | Cohen Capital Management, Inc. | 21.200 | 0,00 | 885 | -3,49 | ||||
| 2026-03-12 | 13F/A | Peak6 Llc | 0 | -100,00 | 0 | -100,00 | ||||
| 2026-02-09 | 13F | Mondrian Investment Partners LTD | 1.614 | 67 | ||||||
| 2026-02-13 | 13F | Inspire Advisors, LLC | 0 | -100,00 | 0 | |||||
| 2026-02-09 | 13F | CBIZ Investment Advisory Services, LLC | 168 | 7 | ||||||
| 2026-02-12 | 13F | Swiss National Bank | 1.290.300 | -4,90 | 53.883 | -8,28 | ||||
| 2026-02-09 | 13F | Bleakley Financial Group, LLC | 15.704 | 22,28 | 656 | 17,81 | ||||
| 2026-01-21 | 13F | Kentucky Trust Co | 425 | 0,00 | 18 | -5,56 | ||||
| 2026-02-10 | 13F | Essex Financial Services, Inc. | 5.766 | 1,44 | 241 | -2,44 | ||||
| 2026-02-13 | 13F | Police & Firemen's Retirement System of New Jersey | 201.685 | -3,22 | 8.422 | -6,66 | ||||
| 2026-01-16 | 13F | Longboard Asset Management, LP | 0 | -100,00 | 0 | |||||
| 2026-02-12 | 13F | Bahl & Gaynor Inc | 0 | -100,00 | 0 | |||||
| 2026-02-02 | 13F | Sachetta, LLC | 176 | 0,00 | 7 | 0,00 | ||||
| 2026-02-13 | 13F | Horizon Investment Services, LLC | 11.092 | 2,71 | 463 | -0,86 | ||||
| 2026-02-13 | 13F | Squarepoint Ops LLC | Put | 0 | -100,00 | 0 | -100,00 | |||
| 2026-02-02 | 13F | Breakwater Investment Management | 0 | -100,00 | 0 | |||||
| 2026-02-10 | 13F | National Pension Service | 15.150 | 49,51 | 633 | 44,29 | ||||
| 2026-02-13 | 13F | Alamea Verwaltungs GmbH | 22.710 | 24,95 | 1.006 | 27,86 | ||||
| 2026-02-13 | 13F | BNP Paribas Asset Management Holding S.A. | 108.493 | -1,09 | 5 | 0,00 | ||||
| 2026-01-14 | 13F | USA Financial Portformulas Corp | 20 | -99,89 | 1 | -100,00 | ||||
| 2026-01-28 | 13F | DekaBank Deutsche Girozentrale | 177.545 | 0,00 | 5 | -28,57 | ||||
| 2026-01-28 | 13F | Chicago Partners Investment Group LLC | 9.669 | 2,70 | 420 | 2,70 | ||||
| 2026-02-09 | 13F | Allstate Corp | 34.527 | 94,70 | 1.442 | 87,87 | ||||
| 2026-02-12 | 13F | Great Lakes Advisors, Llc | 80.916 | 0,39 | 3.379 | -3,15 | ||||
| 2026-02-09 | 13F | Cary Street Partners Financial Llc | 15.400 | 5,01 | 643 | 1,42 | ||||
| 2026-02-13 | 13F | Caitong International Asset Management Co., Ltd | 0 | -100,00 | 0 | |||||
| 2026-02-09 | 13F | New Age Alpha Advisors, LLC | 8.938 | -3,76 | 373 | -7,21 | ||||
| 2026-02-17 | 13F | Wealth Watch Advisors, INC | 20 | -35,48 | 1 | -100,00 | ||||
| 2026-02-12 | 13F | Elo Mutual Pension Insurance Co | 19.023 | -72,39 | 794 | -73,38 | ||||
| 2026-01-21 | 13F | Hartford Financial Management Inc. | 3.000 | 0,00 | 125 | -3,10 | ||||
| 2026-02-12 | 13F | Wealthspire Advisors, LLC | 0 | -100,00 | 0 | |||||
| 2026-02-12 | 13F | Sit Investment Associates Inc | 0 | -100,00 | 0 | |||||
| 2026-04-09 | 13F | Everhart Financial Group, Inc. | 33.124 | 2,27 | 1.546 | 14,28 | ||||
| 2026-02-17 | 13F | Cresset Asset Management, LLC | 5.759 | -5,23 | 240 | -8,75 | ||||
| 2026-01-21 | 13F | Newbridge Financial Services Group, Inc. | 56.382 | 0,95 | 2.355 | -2,65 | ||||
| 2026-02-05 | 13F | North Dakota State Investment Board | 16.136 | 674 | ||||||
| 2026-02-04 | 13F | Securian Asset Management, Inc | 12.975 | -42,92 | 542 | -45,02 | ||||
| 2026-01-23 | 13F | Evolution Advisers, Inc. | 5.932 | 0,00 | 0 | |||||
| 2026-02-11 | 13F | SOUTH STATE Corp | 17 | 240,00 | 1 | |||||
| 2026-02-10 | 13F | Rothschild Investment Llc | 43.081 | -0,06 | 1.799 | -3,59 | ||||
| 2026-02-11 | 13F | Prestige Wealth Management Group LLC | 37 | 0,00 | 2 | 0,00 | ||||
| 2026-02-12 | 13F | Wedbush Securities Inc | 6.414 | 4,91 | 0 | |||||
| 2026-04-07 | 13F | Blueline Advisors Llc | 481 | 0,00 | 22 | 10,00 | ||||
| 2026-01-29 | 13F | Vanguard Group Inc | 62.408.533 | 1,68 | 2.606.180 | -1,93 | ||||
| 2026-02-13 | 13F | Centiva Capital, LP | 16.565 | 692 | ||||||
| 2026-02-12 | 13F | Jane Street Group, Llc | 23.007 | -95,07 | 961 | -95,25 | ||||
| 2026-02-05 | 13F | New York Life Investment Management Llc | 65.459 | 2,30 | 2.734 | -1,34 | ||||
| 2026-02-12 | 13F | Jane Street Group, Llc | Call | 78.300 | -38,15 | 3.270 | -40,36 | |||
| 2026-02-04 | 13F | Pensionmark Financial Group, Llc | 7.871 | 3,24 | 308 | -6,67 | ||||
| 2026-01-22 | 13F | Financial Consulate, Inc | 265 | 1.666,67 | 11 | |||||
| 2026-02-13 | 13F | Kestra Advisory Services, LLC | 0 | -100,00 | 0 | |||||
| 2026-02-17 | 13F | CWM Advisors, LLC | 7.890 | -59,83 | 329 | -61,29 | ||||
| 2026-02-11 | 13F | Ameritas Investment Partners, Inc. | 4.935 | 206 | ||||||
| 2026-02-17 | 13F | California State Teachers Retirement System | 561.618 | 0,94 | 23.453 | -2,65 | ||||
| 2026-02-12 | 13F | Alps Advisors Inc | 27.398 | 28,87 | 1.144 | 24,35 | ||||
| 2026-02-17 | 13F | Zimmer Partners, LP | 3.870.100 | -34,26 | 161.615 | -36,60 | ||||
| 2026-02-17 | 13F | Twinbeech Capital Lp | 0 | -100,00 | 0 | |||||
| 2026-02-17 | 13F | Massar Capital Management, LP | 32.205 | 1.345 | ||||||
| 2026-02-18 | 13F/A | Empowered Funds, LLC | 44.068 | 264,02 | 1.840 | 251,15 | ||||
| 2026-01-14 | 13F | Jfs Wealth Advisors, Llc | 415 | 27,30 | 17 | 21,43 | ||||
| 2026-01-26 | 13F | PDS Planning, Inc | 6.061 | 0,30 | 253 | -3,07 | ||||
| 2025-11-07 | 13F | Tobam | 0 | -100,00 | 0 | |||||
| 2025-10-27 | 13F | Kiker Wealth Management, LLC | 0 | -100,00 | 0 | |||||
| 2026-01-15 | 13F | Allspring Global Investments Holdings, LLC | 62.596 | 4,37 | 2.639 | 2,17 | ||||
| 2026-01-14 | 13F | Sky Investment Group LLC | 5.230 | 218 | ||||||
| 2026-02-19 | 13F | Invesco Ltd. | 7.786.335 | -2,64 | 325.157 | -6,10 | ||||
| 2026-02-04 | 13F | LRI Investments, LLC | 534 | 0,00 | 22 | -4,35 | ||||
| 2026-02-06 | 13F | Tredje AP-fonden | 343.565 | 6,35 | 14.347 | 2,57 | ||||
| 2026-02-17 | 13F | Merewether Investment Management, LP | 0 | -100,00 | 0 | |||||
| 2026-02-11 | 13F | GW&K Investment Management, LLC | 54 | 0 | ||||||
| 2026-01-27 | 13F | Brighton Jones Llc | 0 | -100,00 | 0 | |||||
| 2026-01-28 | 13F | Bedel Financial Consulting, Inc. | 5.540 | 0,00 | 231 | -3,35 | ||||
| 2026-02-18 | 13F | Garton & Associates Financial Advisors LLC | 425 | 18 | ||||||
| 2026-01-22 | 13F | Massachusetts Financial Services Co /ma/ | 1.880.242 | 100,47 | 78.519 | 93,34 | ||||
| 2026-04-06 | 13F | Stableford Capital Ii Llc | 17.551 | -0,13 | 819 | 11,60 | ||||
| 2026-02-17 | 13F | Public Employees Retirement System Of Ohio | 160.551 | -2,02 | 6.705 | -5,50 | ||||
| 2026-02-10 | 13F | Commonwealth Of Pennsylvania Public School Empls Retrmt Sys | 896.290 | 0,99 | 37.429 | -2,60 | ||||
| 2026-02-13 | 13F | Cohen & Steers, Inc. | 4.604.468 | -15,34 | 192 | -18,30 | ||||
| 2026-02-10 | 13F | Lido Advisors, LLC | 7.222 | 18,39 | 310 | 17,05 | ||||
| 2026-01-22 | 13F | Bfsg, Llc | 198.673 | -0,79 | 8.297 | -4,31 | ||||
| 2026-02-06 | 13F | ProShare Advisors LLC | 135.519 | 11,00 | 5.659 | 7,06 | ||||
| 2026-01-16 | 13F | Standard Life Aberdeen plc | 471.016 | 21,78 | 19.670 | 17,69 | ||||
| 2026-02-11 | 13F | VeraBank, N.A. | 16.904 | -4,63 | 706 | -8,08 | ||||
| 2026-02-11 | 13F | Simplex Trading, Llc | Put | 700 | -99,32 | 29 | 625,00 | |||
| 2026-02-11 | 13F | Simplex Trading, Llc | 14.299 | -63,40 | 597 | 59.600,00 | ||||
| 2026-01-21 | 13F | SJS Investment Consulting Inc. | 57 | 147,83 | 2 | |||||
| 2026-02-11 | 13F | Simplex Trading, Llc | Call | 13.700 | -75,71 | 572 | 28.500,00 | |||
| 2026-02-13 | 13F | Healthcare Of Ontario Pension Plan Trust Fund | 18.864 | 1,21 | 788 | -2,48 | ||||
| 2026-02-03 | 13F | Mitsubishi UFJ Kokusai Asset Management Co., Ltd. | 1.017.514 | 11,13 | 42.898 | 8,20 | ||||
| 2026-02-13 | 13F | Transamerica Financial Advisors, Inc. | 285 | 12 | ||||||
| 2026-01-12 | 13F | Perkins Coie Trust Co | 521 | 0,00 | 22 | -4,55 | ||||
| 2026-02-13 | 13F | MAI Capital Management | 18.226 | -2,08 | 761 | -5,47 | ||||
| 2026-04-13 | 13F | Salem Investment Counselors Inc | 500 | 23 | ||||||
| 2026-02-06 | 13F | EverSource Wealth Advisors, LLC | 6.981 | 8,33 | 292 | 4,30 | ||||
| 2025-11-13 | 13F | FORA Capital, LLC | 0 | -100,00 | 0 | -100,00 | ||||
| 2026-02-13 | 13F | Manufacturers Life Insurance Company, The | 0 | -100,00 | 0 | |||||
| 2026-02-12 | 13F | Brown Brothers Harriman & Co | 10.362 | 7,37 | 433 | 3,60 | ||||
| 2026-02-17 | 13F | Cape Investment Advisory, Inc. | 3 | 0,00 | 0 | |||||
| 2026-01-21 | 13F | Signature Resources Capital Management, LLC | 46 | 0,00 | 2 | 0,00 | ||||
| 2026-02-13 | 13F | Y-Intercept (Hong Kong) Ltd | 35.179 | 148,46 | 1.469 | 139,64 | ||||
| 2025-11-13 | 13F | Dynamic Technology Lab Private Ltd | 0 | -100,00 | 0 | |||||
| 2026-01-22 | 13F | Venturi Wealth Management, LLC | 14.701 | -0,63 | 614 | -4,22 | ||||
| 2026-02-13 | 13F | Solstein Capital, LLC | 136 | 0,00 | 6 | 0,00 | ||||
| 2026-02-17 | 13F | Financial Avengers, Inc. | 414 | 0,00 | 18 | 0,00 | ||||
| 2026-01-14 | 13F | ORG Wealth Partners, LLC | 3.957 | 0,20 | 165 | -2,94 | ||||
| 2026-02-10 | 13F | Thompson Siegel & Walmsley Llc | 17.992 | -17,15 | 1 | |||||
| 2026-02-23 | 13F | Beaird Harris Wealth Management, LLC | 1.328 | 0,00 | 55 | -3,51 | ||||
| 2026-02-27 | 13F | Strategic Investment Solutions, Inc. /IL | 1.671 | 0,00 | 70 | -4,17 | ||||
| 2026-02-06 | 13F | Csenge Advisory Group | 9.172 | -24,30 | 383 | -26,91 | ||||
| 2026-02-12 | 13F | BRYN MAWR TRUST Co | 0 | -100,00 | 0 | -100,00 | ||||
| 2026-02-13 | 13F | Royal London Asset Management Ltd | 393.326 | 2,98 | 16.425 | -0,68 | ||||
| 2026-02-11 | 13F | Los Angeles Capital Management Llc | 4.493 | -3,73 | 189 | -6,44 | ||||
| 2026-02-17 | 13F | Boothbay Fund Management, Llc | 18.019 | 150,23 | 752 | 141,80 | ||||
| 2026-01-22 | 13F | Harwood Advisory Group, LLC | 50 | 0,00 | 2 | 0,00 | ||||
| 2026-01-07 | 13F | Holistic Financial Partners | 12.475 | 0,00 | 521 | -3,70 | ||||
| 2026-02-09 | 13F | Expressive Wealth LLC | 9.984 | 417 | ||||||
| 2026-01-27 | 13F | GHP Investment Advisors, Inc. | 450 | 0,00 | 19 | -5,26 | ||||
| 2025-11-12 | 13F | NewSquare Capital LLC | 0 | -100,00 | 0 | -100,00 | ||||
| 2026-01-23 | 13F | Lincoln Capital Corp | 64.388 | -0,09 | 2.689 | -3,66 | ||||
| 2026-02-02 | 13F | Truist Financial Corp | 57.159 | -16,57 | 2.387 | -19,55 | ||||
| 2026-02-13 | 13F | Tower Bridge Advisors | 26.382 | 24,84 | 1.102 | 20,33 | ||||
| 2026-01-21 | 13F | Flagship Harbor Advisors, Llc | 6.527 | 0,03 | 273 | -3,55 | ||||
| 2026-01-26 | 13F | KBC Group NV | 40.250 | 0,00 | 2 | 0,00 | ||||
| 2026-02-10 | 13F | Bruce G. Allen Investments, LLC | 423 | 0,00 | 18 | -5,56 | ||||
| 2026-02-12 | 13F | First Financial Bankshares Inc | 1.008.683 | 1,69 | 42.123 | -1,93 | ||||
| 2026-02-13 | 13F | Morgan Stanley | 4.882.914 | 11,37 | 203.911 | 7,41 | ||||
| 2026-02-13 | 13F | Gts Securities Llc | 5.122 | -49,06 | 214 | -51,03 | ||||
| 2026-01-26 | 13F | Annex Advisory Services, LLC | 16.301 | 0,00 | 681 | -3,55 | ||||
| 2026-01-28 | 13F | Salomon & Ludwin, LLC | 348 | 0,00 | 14 | -6,67 | ||||
| 2026-02-13 | 13F | State Street Corp | 26.735.119 | 4,51 | 1.116.459 | 0,80 | ||||
| 2026-01-29 | 13F | Verdence Capital Advisors LLC | 14.474 | 1,08 | 604 | -3,51 | ||||
| 2026-02-17 | 13F | Balyasny Asset Management Llc | 7.694 | -99,53 | 321 | -99,54 | ||||
| 2026-02-17 | 13F | Blair William & Co/il | 23.438 | 1,46 | 979 | -2,20 | ||||
| 2026-02-03 | 13F | Strengthening Families & Communities, LLC | 27.489 | -0,11 | 1.148 | -2,80 | ||||
| 2026-02-13 | 13F | Squarepoint Ops LLC | 369.470 | -9,66 | 15.429 | -12,87 | ||||
| 2026-02-12 | 13F | IFM Investors Pty Ltd | 196.196 | 8,32 | 8 | -99,90 | ||||
| 2026-02-17 | 13F | Fmr Llc | 9.138.698 | -2,76 | 381.632 | -6,22 | ||||
| 2026-02-17 | 13F | Prelude Capital Management, Llc | 46.487 | 18,80 | 1.941 | 14,58 | ||||
| 2026-02-06 | 13F | Cullen/frost Bankers, Inc. | 1.510 | 13,53 | 63 | 10,53 | ||||
| 2026-02-17 | 13F | Two Sigma Advisers, Lp | 38.400 | 150,98 | 1.604 | 142,15 | ||||
| 2026-01-30 | 13F | Activest Wealth Management | 22 | 0,00 | 1 | |||||
| 2026-02-13 | 13F | Towarzystwo Funduszy Inwestycyjnych Pzu Sa | 650 | 27 | ||||||
| 2026-04-07 | 13F | Cooper Financial Group | 5.370 | -5,41 | 251 | 5,49 | ||||
| 2026-01-28 | 13F | Arizona State Retirement System | 129.138 | -6,71 | 5.393 | -10,04 | ||||
| 2026-02-13 | 13F | HITE Hedge Asset Management LLC | 1.420.828 | -14,69 | 59.334 | -17,72 | ||||
| 2026-02-11 | 13F | Winton Capital Group Ltd | 33.269 | 24,88 | 1.389 | 20,47 | ||||
| 2026-04-07 | 13F | Park Avenue Securities Llc | 18.505 | -21,90 | 1 | |||||
| 2026-02-17 | 13F | Investment Management Corp of Ontario | 31.921 | 44,23 | 1.333 | 39,14 | ||||
| 2026-02-17 | 13F | IHT Wealth Management, LLC | 8.170 | -6,44 | 341 | -9,79 | ||||
| 2026-02-11 | 13F | Hughes Financial Services, LLC | 23 | 53,33 | 1 | |||||
| 2026-01-15 | 13F | SILVER OAK SECURITIES, Inc | 11.371 | 42,28 | 478 | 38,15 | ||||
| 2026-02-05 | 13F | Canada Post Corp Registered Pension Plan | 10.976 | 29,50 | 458 | 25,14 | ||||
| 2025-11-17 | 13F | Jacobs Levy Equity Management, Inc | 0 | -100,00 | 0 | |||||
| 2026-04-10 | 13F/A | OP Asset Management Ltd | 56.354 | 2.629 | ||||||
| 2026-02-17 | 13F | Bayesian Capital Management, LP | 0 | -100,00 | 0 | |||||
| 2026-02-11 | 13F | Syon Capital Llc | 6.271 | 262 | ||||||
| 2026-02-13 | 13F | Cornercap Investment Counsel Inc | 19.507 | -1,36 | 815 | -4,91 | ||||
| 2026-02-17 | 13F | Northern Trust Corp | 4.273.238 | -3,95 | 178.450 | -7,37 | ||||
| 2026-01-23 | 13F | Assetmark, Inc | 11.364 | 16,60 | 475 | 12,59 | ||||
| 2026-02-06 | 13F | VSM Wealth Advisory, LLC | 460 | 0,00 | 19 | 0,00 | ||||
| 2026-02-17 | 13F | Janus Henderson Group Plc | 46.796 | -10,77 | 1.954 | -13,92 | ||||
| 2026-01-15 | 13F | Nisa Investment Advisors, Llc | 121.772 | -12,82 | 5.085 | -15,92 | ||||
| 2026-02-17 | 13F | State Of Wisconsin Investment Board | 339.979 | 3,17 | 14.198 | -0,50 | ||||
| 2026-04-08 | 13F | Ausbil Investment Management Ltd | 157.560 | 25,51 | 7.390 | 40,96 | ||||
| 2025-11-14 | 13F | ExodusPoint Capital Management, LP | 0 | -100,00 | 0 | -100,00 | ||||
| 2026-02-13 | 13F | Cynosure Management, Llc | 10.298 | 430 | ||||||
| 2026-01-07 | 13F | Harbor Investment Advisory, Llc | 1.755 | 17,00 | 73 | 14,06 | ||||
| 2026-01-27 | 13F | Gf Fund Management Co. Ltd. | 0 | -100,00 | 0 | |||||
| 2026-02-13 | 13F | Bridgewater Associates, LP | 0 | -100,00 | 0 | |||||
| 2026-02-12 | 13F | Callan Family Office, LLC | 13.173 | 36,56 | 550 | 31,89 | ||||
| 2026-02-10 | 13F | CIBC Asset Management Inc | 113.497 | 69,55 | 4.740 | 63,53 | ||||
| 2026-02-17 | 13F | Principal Street Partners, LLC | 6.587 | -8,14 | 275 | -11,29 | ||||
| 2026-02-06 | 13F | Kilter Group LLC | 0 | -100,00 | 0 | |||||
| 2026-02-13 | 13F | Brookfield Asset Management Inc. | 1.444.808 | -0,74 | 60.335 | -4,27 | ||||
| 2026-02-13 | 13F | Pathstone Holdings, LLC | 38.440 | 1,62 | 1.605 | -1,95 | ||||
| 2026-02-05 | 13F | Elyxium Wealth, LLC | 789 | 33 | ||||||
| 2026-02-09 | 13F | Employees Retirement System of Texas | 877.729 | -1,76 | 37 | -5,26 | ||||
| 2026-02-09 | 13F | Kingsview Wealth Management, LLC | 8.143 | -14,88 | 340 | -17,87 | ||||
| 2026-02-13 | 13F | SRS Capital Advisors, Inc. | 13.168 | -32,45 | 550 | -34,95 | ||||
| 2025-11-12 | 13F | Fox Run Management, L.l.c. | 0 | -100,00 | 0 | |||||
| 2026-02-12 | 13F | Hollencrest Capital Management | 75 | 0,00 | 3 | 0,00 | ||||
| 2026-02-17 | 13F | Rakuten Investment Management, Inc. | 62.506 | 18,70 | 2.621 | -43,91 | ||||
| 2026-01-30 | 13F | Valued Wealth Advisors LLC | 9 | 0,00 | 0 | |||||
| 2026-02-10 | 13F | Connor, Clark & Lunn Investment Management Ltd. | 0 | -100,00 | 0 | |||||
| 2026-02-17 | 13F | Redwood Park Advisors LLC | 5 | 0,00 | 0 | |||||
| 2025-11-07 | 13F | Leeward Investments, LLC - MA | 0 | -100,00 | 0 | |||||
| 2026-02-10 | 13F | Godfrey Financial Associates, Inc. | 714 | 30 | ||||||
| 2025-11-06 | 13F | Whipplewood Advisors, LLC | 0 | -100,00 | 0 | |||||
| 2026-02-17 | 13F | Frontier Capital Management Co Llc | 12.822 | -5,37 | 535 | -8,70 | ||||
| 2026-02-12 | 13F | MetLife Investment Management, LLC | 214.912 | -0,94 | 8.975 | -4,46 | ||||
| 2026-02-06 | 13F | Addison Advisors LLC | 0 | -100,00 | 0 | |||||
| 2025-11-07 | 13F | Shell Asset Management Co | 39.332 | -34,90 | 2 | -50,00 | ||||
| 2026-01-26 | 13F | Clean Yield Group | 485 | 0,00 | 20 | -4,76 | ||||
| 2026-01-27 | 13F | Elevated Capital Advisors, LLC | 27.007 | 1,71 | 1.128 | -1,91 | ||||
| 2026-02-17 | 13F | Evolve Private Wealth, Llc | 11.162 | 466 | ||||||
| 2026-01-26 | 13F | Whittier Trust Co Of Nevada Inc | 1.757 | 11,91 | 74 | 7,35 | ||||
| 2026-02-09 | 13F | Mizuho Securities Usa Llc | 34.746 | 1,32 | 1.532 | 5,66 | ||||
| 2026-02-02 | 13F | Cornerstone Planning Group LLC | 157 | 772,22 | 7 | |||||
| 2026-02-06 | 13F | Global Retirement Partners, LLC | 22.315 | 742,39 | 932 | 716,67 | ||||
| 2026-02-13 | 13F | Bank Of Nova Scotia | 196.270 | 238,74 | 8.196 | 226,79 | ||||
| 2026-02-03 | 13F | Legacy Wealth Managment, LLC/ID | 1.626 | 30,29 | 68 | 24,07 | ||||
| 2025-11-12 | 13F | Transce3nd, LLC | 0 | -100,00 | 0 | |||||
| 2026-02-05 | 13F | Bessemer Group Inc | 17.923 | -4,02 | 1 | |||||
| 2026-02-12 | 13F | Aviva Plc | 1.485.693 | 5,82 | 62.043 | 2,06 | ||||
| 2026-02-17 | 13F | Aqr Capital Management Llc | 1.339.845 | 20,90 | 55.952 | 16,68 | ||||
| 2026-02-11 | 13F | Monetary Management Group Inc | 455 | 0,00 | 19 | 0,00 | ||||
| 2026-01-22 | 13F | Bartlett & Co. Wealth Management Llc | 228 | 94,87 | 10 | 80,00 | ||||
| 2026-02-17 | 13F | First Manhattan Co | 0 | -100,00 | 0 | |||||
| 2026-01-30 | 13F | United Community Bank | 376 | 16 | ||||||
| 2026-02-13 | 13F | Wells Fargo & Company/mn | Call | 58.400 | 2.439 | |||||
| 2026-02-13 | 13F | Wells Fargo & Company/mn | 800.624 | -1,73 | 33.434 | -5,23 | ||||
| 2026-02-12 | 13F | Commonwealth Equity Services, Llc | 87.225 | -2,81 | 3.643 | 121.300,00 | ||||
| 2026-02-05 | 13F | Atria Investments Llc | 33.230 | 30,68 | 1.388 | 25,98 | ||||
| 2026-02-10 | 13F | Daiwa Securities Group Inc. | 85.423 | 2,68 | 4 | 0,00 | ||||
| 2026-02-13 | 13F | Kayne Anderson Rudnick Investment Management Llc | 635 | 0,00 | 27 | -3,70 | ||||
| 2026-02-17 | 13F | Zimmer Partners, LP | Call | 0 | -100,00 | 0 | ||||
| 2026-01-26 | 13F | Wright Investors Service Inc | 0 | -100,00 | 0 | |||||
| 2026-02-13 | 13F | Fairman Group, LLC | 128 | 5 | ||||||
| 2026-02-10 | 13F | Meramec Financial Planners, LLC | 624 | 28 | ||||||
| 2026-01-27 | 13F | Ticino Wealth | 12.780 | 534 | ||||||
| 2026-01-23 | 13F | Rsm Us Wealth Management Llc | 8.769 | 2,74 | 369 | -0,27 | ||||
| 2026-02-13 | 13F | Pinnacle Wealth Planning Services, Inc. | 410 | 17 | ||||||
| 2026-04-13 | 13F | GoalVest Advisory LLC | 570 | 0,00 | 27 | 13,04 | ||||
| 2026-02-17 | 13F | Schonfeld Strategic Advisors LLC | 34.078 | 78,70 | 1.423 | 72,48 | ||||
| 2025-11-14 | 13F | Skopos Labs, Inc. | 0 | -100,00 | 0 | |||||
| 2026-02-03 | 13F | Farmers & Merchants Investments Inc | 280 | 0,00 | 12 | -8,33 | ||||
| 2026-01-16 | 13F | West Branch Capital LLC | 606 | 0,33 | 25 | -3,85 | ||||
| 2026-02-11 | 13F | Hilton Head Capital Partners, LLC | 51 | 2 | ||||||
| 2026-02-10 | 13F | Natixis Advisors, L.p. | 322.755 | -1,63 | 13 | -7,14 | ||||
| 2026-02-10 | 13F | Amica Mutual Insurance Co | 16.099 | 0,00 | 1 | |||||
| 2026-02-12 | 13F | Fox Hill Wealth Management | 54.746 | 3,10 | 2.286 | -0,57 | ||||
| 2026-02-17 | 13F | D. E. Shaw & Co., Inc. | 77.335 | 3.230 | ||||||
| 2026-02-17 | 13F | Agf Management Ltd | 114.653 | 4,54 | 4.788 | 0,82 |