Grundlæggende statistik
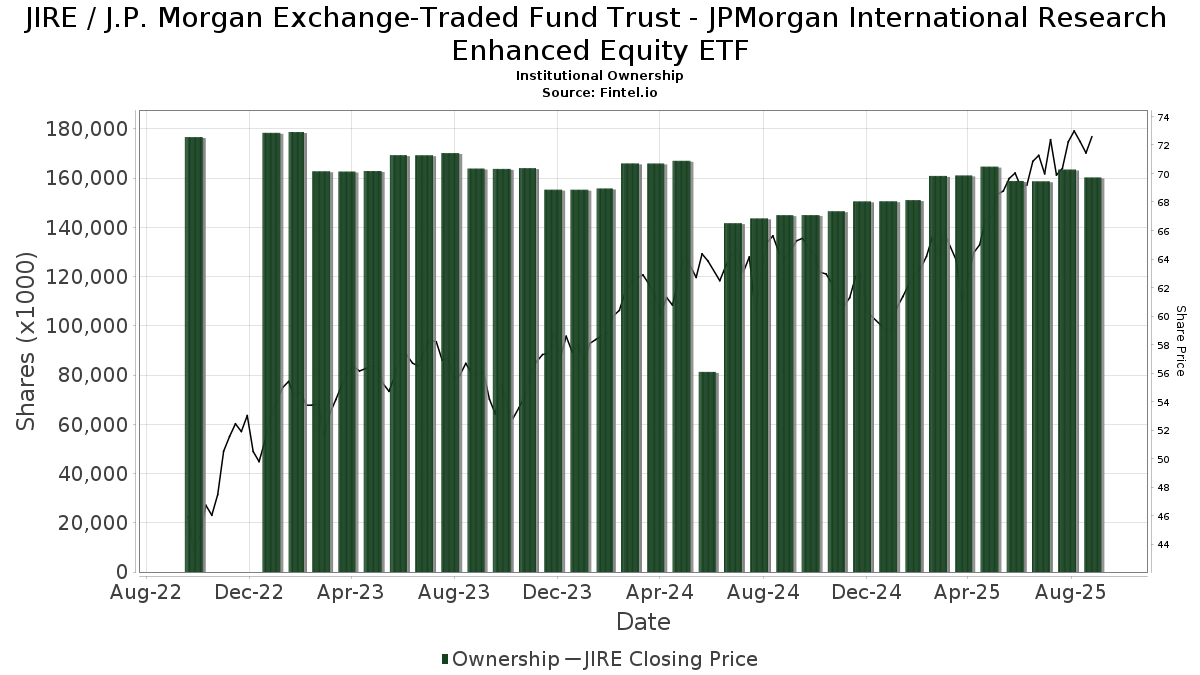
| Institutionelle ejere | 305 total, 305 long only, 0 short only, 0 long/short - change of 4,44% MRQ |
| Gennemsnitlig porteføljeallokering | 0.7771 % - change of -39,14% MRQ |
| Institutionelle aktier (lange) | 123.609.292 (ex 13D/G) - change of -46,34MM shares -27,27% MRQ |
| Institutionel værdi (lang) | $ 8.862.123 USD ($1000) |
Institutionelt ejerskab og aktionærer
J.P. Morgan Exchange-Traded Fund Trust - JPMorgan International Research Enhanced Equity ETF (US:JIRE) har 305 institutionelle ejere og aktionærer, der har indsendt 13D/G- eller 13F-formularer til Securities Exchange Commission (SEC). Disse institutioner har i alt 123,609,292 aktier. Største aktionærer omfatter Jpmorgan Chase & Co, Susquehanna International Group, Llp, LPL Financial LLC, Fmr Llc, Envestnet Asset Management Inc, Mml Investors Services, Llc, Janney Montgomery Scott LLC, Cwm, Llc, Factory Mutual Insurance Co, and Commonwealth Equity Services, Llc .
J.P. Morgan Exchange-Traded Fund Trust - JPMorgan International Research Enhanced Equity ETF (ARCA:JIRE) institutionel ejerskabsstruktur viser aktuelle positioner i virksomheden efter institutioner og fonde, samt seneste ændringer i positionsstørrelse. Større aktionærer kan omfatte individuelle investorer, investeringsforeninger, hedgefonde eller institutioner. Skema 13D angiver, at investoren besidder (eller besidder) mere end 5 % af virksomheden og har til hensigt (eller har til hensigt at) aktivt at forfølge en ændring i forretningsstrategi. Skema 13G indikerer en passiv investering på over 5%.
The share price as of March 6, 2026 is 76,93 / share. Previously, on March 10, 2025, the share price was 64,24 / share. This represents an increase of 19,75% over that period.
Fondens stemningsscore
Fund Sentiment Score (fka Ownership Accumulation Score) finder de aktier, der bliver mest købt af fonde. Det er resultatet af en sofistikeret, multi-faktor kvantitativ model, der identificerer virksomheder med de højeste niveauer af institutionel akkumulering. Scoringsmodellen bruger en kombination af den samlede stigning i oplyste ejere, ændringerne i porteføljeallokeringer i disse ejere og andre målinger. Tallet går fra 0 til 100, hvor højere tal indikerer et højere niveau af akkumulering for sine jævnaldrende, og 50 er gennemsnittet.
Opdateringsfrekvens: Dagligt
Se Ownership Explorer, som giver en liste over højest rangerende virksomheder.
AI+ Ask Fintel’s AI assistant about J.P. Morgan Exchange-Traded Fund Trust - JPMorgan International Research Enhanced Equity ETF.
Select a question to share a public post with an AI-crafted answer.
Thinking of good questions…
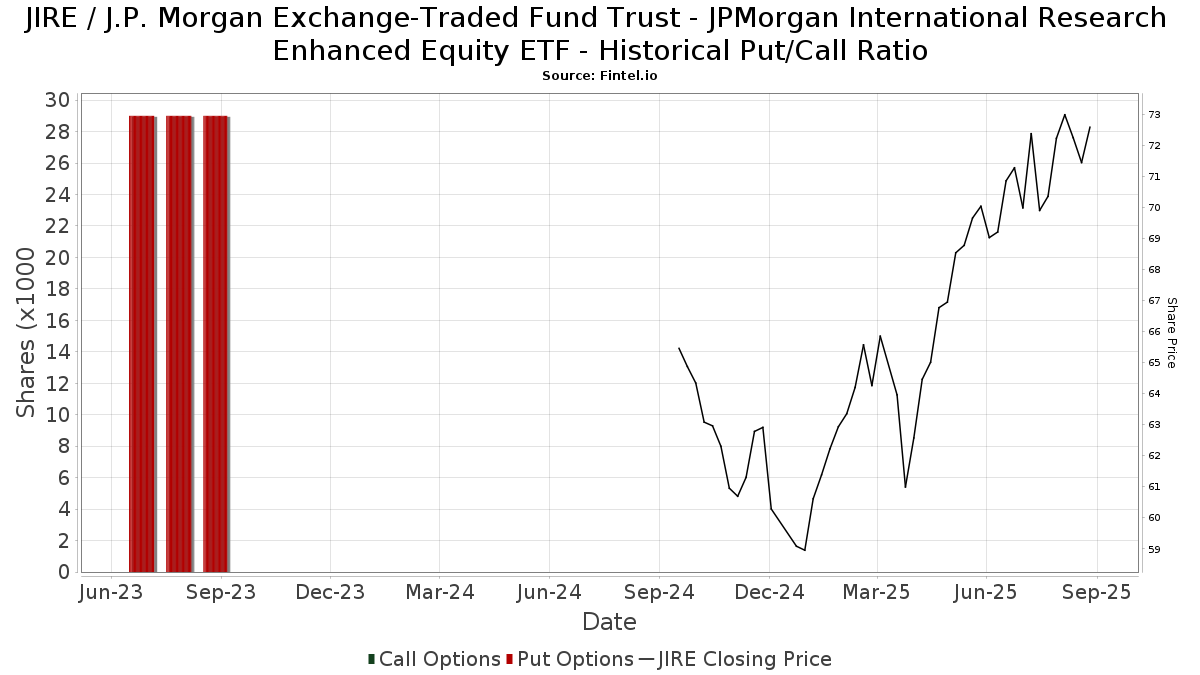
Institutionel Put/Call-forhold
Ud over at indberette standardaktie- og gældsudstedelser skal institutter med mere end 100 mill. aktiver under forvaltning også oplyse deres put- og call-optionsbeholdninger. Da salgsoptioner generelt indikerer negativ stemning, og købsoptioner indikerer positiv stemning, kan vi få en fornemmelse af den overordnede institutionelle stemning ved at plotte forholdet mellem put og kald. Diagrammet til højre viser det historiske put/call-forhold for dette instrument.
Brug af Put/Call Ratio som en indikator for investorernes stemning overvinder en af de vigtigste mangler ved at bruge totalt institutionelt ejerskab, som er, at en betydelig mængde af aktiver under forvaltning investeres passivt for at spore indekser. Passivt forvaltede fonde køber typisk ikke optioner, så indikatoren for put/call-forholdet følger mere nøje følelsen af aktivt forvaltede fonde.
13D/G-arkivering
Vi præsenterer 13D/G ansøgninger separat fra 13F ansøgninger på grund af den forskellige behandling af SEC. 13D/G-ansøgninger kan indgives af grupper af investorer (med én ledende), hvorimod 13F-ansøgninger ikke kan. Dette resulterer i situationer, hvor en investor kan indsende en 13D/G, der rapporterer én værdi for de samlede aktier (der repræsenterer alle de aktier, der ejes af investorgruppen), men derefter indsender en 13F, der rapporterer en anden værdi for de samlede aktier (der udelukkende repræsenterer deres egne) ejendomsret). Det betyder, at aktieejerskab af 13D/G-arkiver og 13F-arkiveringer ofte ikke er direkte sammenlignelige, så vi præsenterer dem separat.
Bemærk: Fra den 16. maj 2021 viser vi ikke længere ejere, der ikke har indsendt en 13D/G inden for det seneste år. Tidligere viste vi den fulde historie af 13D/G-arkiver. Generelt skal enheder, der er forpligtet til at indgive 13D/G-ansøgninger, indgive mindst årligt, før de indsender en afsluttende ansøgning. Dog forlader fonde nogle gange positioner uden at indsende en afsluttende ansøgning (dvs. de afvikler), så visning af den fulde historie resulterede nogle gange i forvirring om det nuværende ejerskab. For at undgå forvirring viser vi nu kun 'aktuelle' ejere - det vil sige - ejere, der har anmeldt inden for det seneste år.
Upgrade to unlock premium data.
13F og NPORT arkivering
Detaljer om 13F-arkivering er gratis. Detaljer om NP-ansøgninger kræver et premium-medlemskab. Grønne rækker angiver nye positioner. Røde rækker angiver lukkede positioner. Klik på linket ikon for at se den fulde transaktionshistorik.
Opgrader
for at låse premium-data op og eksportere til Excel ![]() .
.
| Fil dato | Kilde | Investor | Type | Gennemsnitlig pris (Øst) |
Aktier | Δ Aktier (%) |
Rapporteret Værdi ($1000) |
Δ Værdi (%) |
Port Alloc (%) |
|
|---|---|---|---|---|---|---|---|---|---|---|
| 2026-01-20 | 13F | BAM Wealth Management, LLC | 3.478 | -7,94 | 260 | -6,14 | ||||
| 2026-02-10 | 13F | Providence Financial Advisors, LLC | 111.777 | 0,61 | 8.370 | 2,45 | ||||
| 2026-02-10 | 13F | Twin Peaks Wealth Advisors, LLC | 11.761 | 955 | ||||||
| 2026-01-22 | 13F | Richardson Financial Services Inc. | 221 | -47,51 | 17 | -46,67 | ||||
| 2026-02-09 | 13F | Arq Wealth Advisors, Llc | 61.008 | 21,03 | 4.568 | 23,23 | ||||
| 2026-02-04 | 13F | Ameritas Advisory Services, LLC | 10.211 | 765 | ||||||
| 2026-01-21 | 13F | Planning Directions Inc | 17.473 | 4,93 | 1.308 | 6,86 | ||||
| 2026-01-26 | 13F | Whittier Trust Co Of Nevada Inc | 2.081 | 160 | ||||||
| 2026-02-02 | 13F | Cornerstone Planning Group LLC | 0 | -100,00 | 0 | |||||
| 2026-01-07 | 13F | Lake Street Financial Llc | 23.009 | 12,79 | 1.723 | 14,80 | ||||
| 2026-02-11 | 13F | Vestor Capital, Llc | 585 | -99,79 | 20 | -5,00 | ||||
| 2026-01-14 | 13F | Eastern Bank | 1.049.850 | 3,07 | 78.613 | 4,95 | ||||
| 2026-01-07 | 13F | Cyndeo Wealth Partners, LLC | 20.876 | 13,28 | 1.563 | 15,35 | ||||
| 2026-01-12 | 13F | First Bank & Trust | 12.164 | 15,79 | 911 | 17,88 | ||||
| 2026-02-12 | 13F | Rossby Financial, LCC | 139 | -54,72 | 10 | -54,55 | ||||
| 2026-02-10 | 13F | 3Chopt Investment Partners, LLC | 18.573 | 9,18 | 1.391 | 11,20 | ||||
| 2026-01-20 | 13F | Family Legacy Financial Solutions, LLC | 0 | -100,00 | 0 | |||||
| 2026-01-30 | 13F | Caldwell Trust Co | 0 | -100,00 | 0 | |||||
| 2026-02-02 | 13F | Mcdonald Partners Llc | 5.078 | 380 | ||||||
| 2026-02-20 | 13F | McLaughlin Asset Management, Inc. | 12.534 | 939 | ||||||
| 2026-01-23 | 13F | Galvin, Gaustad & Stein, LLC | 83.689 | 5,63 | 6.267 | 7,55 | ||||
| 2026-02-09 | 13F | Banco de Sabadell, S.A | 659 | 0,00 | 0 | |||||
| 2025-11-12 | 13F | Transce3nd, LLC | 0 | -100,00 | 0 | -100,00 | ||||
| 2026-01-12 | 13F | VisionPoint Advisory Group, LLC | 20.519 | -6,23 | 1.536 | -4,54 | ||||
| 2026-02-13 | 13F | Ausdal Financial Partners, Inc. | 5.653 | 16,05 | 423 | 18,16 | ||||
| 2026-02-06 | 13F | Envestnet Portfolio Solutions, Inc. | 6.893 | 2,15 | 516 | 4,03 | ||||
| 2026-02-17 | 13F | GeoWealth Management, LLC | 9.853 | 7,80 | 738 | 9,67 | ||||
| 2026-01-28 | 13F | HB Wealth Management, LLC | 30.941 | -5,34 | 2.317 | -3,62 | ||||
| 2026-01-28 | 13F | Fairway Wealth LLC | 0 | -100,00 | 0 | |||||
| 2026-02-12 | 13F | Federation des caisses Desjardins du Quebec | 743 | 56 | ||||||
| 2026-01-28 | 13F | Geneos Wealth Management Inc. | 25.204 | -1,33 | 1.887 | 0,48 | ||||
| 2026-01-29 | 13F | Concurrent Investment Advisors, LLC | 5.543 | 10,97 | 415 | 13,08 | ||||
| 2026-02-13 | 13F | Stifel Financial Corp | 67.638 | 203,08 | 5.065 | 208,59 | ||||
| 2026-02-17 | 13F | Bank Of America Corp /de/ | 43.465 | 1.475,96 | 3.255 | 1.510,89 | ||||
| 2026-01-13 | 13F | Sharkey, Howes & Javer | 29.133 | -5,64 | 2.181 | -3,92 | ||||
| 2026-02-09 | 13F | Kingsview Wealth Management, LLC | 36.852 | -65,80 | 2.759 | -65,18 | ||||
| 2025-10-16 | 13F | Ronald Blue Trust, Inc. | 0 | -100,00 | 0 | |||||
| 2026-02-03 | 13F | Grimes & Company, Inc. | 250.644 | 32,33 | 18.768 | 34,74 | ||||
| 2026-02-13 | 13F | TFB Advisors LLC | 12.583 | -0,33 | 942 | 1,29 | ||||
| 2026-02-11 | 13F | Buckingham Strategic Partners | 6.935 | 519 | ||||||
| 2026-02-10 | 13F | Bank of New York Mellon Corp | 5.368 | -99,51 | 402 | -99,51 | ||||
| 2026-01-05 | 13F | Miller Global Investments, LLC | 555 | 42 | ||||||
| 2026-01-08 | 13F | Genesis Private Wealth, Llc | 3.673 | 2,11 | 275 | 4,17 | ||||
| 2026-02-06 | 13F | Creative Financial Designs Inc /adv | 18.568 | -51,03 | 1.390 | -50,14 | ||||
| 2026-01-21 | 13F | Sound Income Strategies, LLC | 39 | 0,00 | 3 | 50,00 | ||||
| 2026-02-06 | 13F | Larson Financial Group LLC | 68 | 5 | ||||||
| 2026-02-10 | 13F | Essex Financial Services, Inc. | 5.300 | 0,13 | 397 | 1,80 | ||||
| 2026-02-12 | 13F | von Borstel & Associates, Inc. | 0 | -100,00 | 0 | |||||
| 2026-02-05 | 13F | Allworth Financial LP | 256 | 0,00 | 19 | 5,56 | ||||
| 2026-01-12 | 13F | Sax Wealth Advisors, Llc | 326.182 | 12,10 | 24.425 | 14,14 | ||||
| 2026-02-14 | 13F | Rockefeller Capital Management L.P. | 292.398 | 3,99 | 21.895 | 5,88 | ||||
| 2026-01-26 | 13F | Red Mountain Financial, LLC | 29.704 | 21,88 | 2.224 | 24,11 | ||||
| 2026-02-13 | 13F | SRS Capital Advisors, Inc. | 390 | 29 | ||||||
| 2026-02-11 | 13F | Capital Analysts, Inc. | 1.776 | 476,62 | 0 | |||||
| 2026-01-26 | 13F | Greenwood Capital Associates Llc | 128.163 | 28,47 | 9.597 | 30,81 | ||||
| 2026-02-18 | 13F | GWM Advisors LLC | 35.558 | 78,00 | 2.663 | 81,21 | ||||
| 2026-02-09 | 13F | Investors Portfolio Services LLC | 71.492 | 5.353 | ||||||
| 2026-02-06 | 13F | Kennedy Investment Group | 2.852 | 214 | ||||||
| 2026-02-03 | 13F | Anfield Capital Management, LLC | 198 | 0,00 | 15 | 0,00 | ||||
| 2026-01-21 | 13F | Mayfair Advisory Group, LLC | 6.201 | 69,89 | 470 | 75,37 | ||||
| 2026-01-26 | 13F | Integrated Capital Management, LLC | 9.922 | 1,35 | 743 | 0,54 | ||||
| 2026-02-12 | 13F | Financial Network Wealth Management LLC | 4.553 | 59,81 | 0 | |||||
| 2026-02-12 | 13F | Great Valley Advisor Group, Inc. | 807.304 | 3,62 | 60.451 | 5,51 | ||||
| 2026-02-17 | 13F | Captrust Financial Advisors | 17.704 | 33,16 | 1.326 | 35,62 | ||||
| 2026-02-04 | 13F | Madison Asset Management, LLC | 310.496 | -0,12 | 23.250 | 1,70 | ||||
| 2026-02-04 | 13F | Summit Wealth Group Llc / Co | 3.054 | 229 | ||||||
| 2026-02-24 | 13F | Bell Investment Advisors, Inc | 26 | 0,00 | 2 | 0,00 | ||||
| 2026-02-10 | 13F | Dynasty Wealth Management, Llc | 1.616.537 | 9,59 | 121.046 | 11,59 | ||||
| 2026-02-13 | 13F | Kestra Advisory Services, LLC | 0 | -100,00 | 0 | |||||
| 2026-02-05 | 13F | Thrivent Financial For Lutherans | 290.996 | 45,57 | 22 | 50,00 | ||||
| 2026-01-16 | 13F | Aspire Capital Advisors LLC | 144.210 | 3,95 | 10.798 | 5,84 | ||||
| 2026-02-17 | 13F | Modern Wealth Management, LLC | 456.208 | 24,63 | 34.161 | 26,90 | ||||
| 2026-01-08 | 13F | Cooper Financial Group | 35.541 | 107,12 | 2.661 | 111,02 | ||||
| 2026-02-13 | 13F | Change Path, LLC | 45.694 | -4,80 | 3.422 | -3,06 | ||||
| 2026-01-26 | 13F | United Advisor Group, LLC | 3.114 | -4,36 | 233 | -2,51 | ||||
| 2026-01-14 | 13F | New England Professional Planning Group Inc. | 765.871 | 0,90 | 57.348 | 5,44 | ||||
| 2026-01-26 | 13F | Cwm, Llc | 1.706.206 | 12,66 | 128 | 14,41 | ||||
| 2026-02-11 | 13F | Janney Montgomery Scott LLC | 1.777.070 | 2,64 | 133 | 4,72 | ||||
| 2026-02-11 | 13F | Smithbridge Asset Management Inc/de | 272.505 | 115,66 | 20.405 | 119,60 | ||||
| 2026-02-17 | 13F | Royal Bank Of Canada | 282.365 | 6,54 | 21.144 | 8,49 | ||||
| 2026-02-17 | 13F | Aqr Capital Management Llc | 0 | -100,00 | 0 | |||||
| 2025-11-05 | 13F | Lokken Investment Group LLC | 35.666 | 2,59 | 2.623 | 6,59 | ||||
| 2026-02-11 | 13F | First Command Advisory Services, Inc. | 0 | -100,00 | 0 | |||||
| 2026-02-12 | 13F | Brinker Capital Investments, LLC | 4.079 | 5,73 | 305 | 7,77 | ||||
| 2026-01-28 | 13F | West Michigan Advisors, Llc | 31.335 | 0,94 | 2.346 | 2,80 | ||||
| 2026-02-12 | 13F | Conservest Capital Advisors, Inc. | 876.883 | 0,01 | 65.661 | 1,83 | ||||
| 2026-01-28 | 13F | Badgley Phelps Wealth Managers, LLC | 255.467 | -6,61 | 19.129 | -4,91 | ||||
| 2026-02-11 | 13F | LPL Financial LLC | 5.936.698 | 3,07 | 444.540 | 4,95 | ||||
| 2026-02-13 | 13F | Intrepid Financial Planning Group LLC | 20.340 | 0,08 | 1.523 | 1,94 | ||||
| 2026-01-30 | 13F | Us Bancorp \de\ | 2.651 | 13,97 | 199 | 15,79 | ||||
| 2026-01-23 | 13F | Factory Mutual Insurance Co | 1.671.130 | 125.134 | ||||||
| 2026-01-29 | 13F | UBS Group AG | 316 | -95,32 | 24 | -95,36 | ||||
| 2026-01-12 | 13F | DAVENPORT & Co LLC | 4.442 | 333 | ||||||
| 2026-02-13 | 13F | Portfolio Resources Advisor Group, Inc. | 1.320 | 99 | ||||||
| 2026-02-05 | 13F | Bessemer Group Inc | 390 | 0,00 | 0 | |||||
| 2026-02-13 | 13F | National Bank Of Canada /fi/ | 0 | -100,00 | 0 | |||||
| 2026-02-09 | 13F | Allen Capital Group, LLC | 2.938 | -6,85 | 220 | -5,19 | ||||
| 2026-02-17 | 13F | Creative Planning | 8.625 | 83,39 | 646 | 86,96 | ||||
| 2026-01-26 | 13F | Private Trust Co Na | 9.533 | -0,78 | 714 | 0,99 | ||||
| 2026-02-11 | 13F | Franklin Resources Inc | 3.751 | 0,59 | 281 | 2,19 | ||||
| 2025-10-16 | 13F | Lowe Wealth Advisors, LLC | 6.126 | 89,89 | 451 | 97,37 | ||||
| 2026-01-14 | 13F | Fairvoy Private Wealth, LLC | 6.021 | 9,02 | 451 | 10,84 | ||||
| 2026-02-06 | 13F | IFP Advisors, Inc | 18.108 | 21,75 | 1.356 | 23,97 | ||||
| 2026-01-22 | 13F | Phoenix Wealth Advisors | 5.995 | 0,00 | 449 | 1,82 | ||||
| 2026-01-27 | 13F | Belpointe Asset Management LLC | 25.694 | -2,94 | 1.924 | -1,18 | ||||
| 2026-02-13 | 13F | Mariner, LLC | 9.586 | 0,32 | 718 | 2,14 | ||||
| 2026-02-17 | 13F | Raymond James Financial Inc | 1.347.980 | 20,74 | 100.937 | 22,94 | ||||
| 2026-01-16 | 13F | Trust Co Of Vermont | 2 | 0,00 | 0 | |||||
| 2026-02-02 | 13F | Miracle Mile Advisors, LLC | 3.658 | -0,49 | 274 | 1,11 | ||||
| 2026-02-17 | 13F | Wiley Bros.-aintree Capital, Llc | 7.195 | 63,34 | 539 | 66,56 | ||||
| 2026-01-20 | 13F | Ascent Group, LLC | 22.754 | -4,56 | 1.704 | -2,85 | ||||
| 2026-01-21 | 13F | Base Wealth Management LLC | 93.118 | 10,82 | 6.973 | 12,83 | ||||
| 2026-02-13 | 13F | MAI Capital Management | 8.199 | 747,88 | 614 | 763,38 | ||||
| 2026-01-14 | 13F | EdgeRock Capital LLC | 285.201 | 6,61 | 21.359 | 8,57 | ||||
| 2026-02-02 | 13F | MN Wealth Advisors, LLC | 105.191 | -3,16 | 7.877 | -0,89 | ||||
| 2026-01-27 | 13F | Berger Financial Group, Inc | 6.683 | 2,28 | 500 | 4,17 | ||||
| 2026-02-10 | 13F | REAP Financial Group, LLC | 32 | 2 | ||||||
| 2026-02-13 | 13F | Wilkerson Advisory Group LLC | 23 | 2 | ||||||
| 2026-01-21 | 13F | Register Financial Advisors LLC | 73 | 0,00 | 5 | 0,00 | ||||
| 2026-02-12 | 13F | Wayfinding Financial, LLC | 24.738 | 1,19 | 2 | 0,00 | ||||
| 2026-01-26 | 13F | Northwest Capital Management Inc | 9.288 | 11,54 | 695 | 13,56 | ||||
| 2026-02-12 | 13F | Cutler Investment Counsel Llc | 465.225 | 4,60 | 34.836 | 6,51 | ||||
| 2025-09-26 | NP | PFSEX - RiskPro® 30+ Fund Class R | 511.757 | 17,82 | 35.396 | 25,38 | ||||
| 2026-01-22 | 13F | Elm3 Financial Group, LLC | 2.682 | 201 | ||||||
| 2026-02-19 | 13F | Invesco Ltd. | 918.000 | 0,00 | 68.740 | 1,82 | ||||
| 2026-02-05 | 13F | Cambridge Investment Research Advisors, Inc. | 496.275 | -1,51 | 37 | 0,00 | ||||
| 2026-02-10 | 13F | Natixis Advisors, L.p. | 24.165 | 2 | ||||||
| 2026-01-29 | 13F | Kestra Private Wealth Services, Llc | 36.708 | 2,00 | 2.749 | 3,85 | ||||
| 2026-02-09 | 13F | Cary Street Partners Financial Llc | 5.469 | 4,27 | 410 | 6,23 | ||||
| 2026-01-26 | 13F | Wbh Advisory Inc | 33.558 | 17,73 | 2.513 | 19,85 | ||||
| 2026-01-29 | 13F | D.a. Davidson & Co. | 14.877 | 0,00 | 1.114 | 1,74 | ||||
| 2025-11-04 | 13F | Tsfg, Llc | 0 | -100,00 | 0 | |||||
| 2026-02-20 | 13F | Ruggaard & Associates LLC | 14.152 | 2,52 | 1.060 | 4,33 | ||||
| 2026-02-12 | 13F | Tripletail Wealth Management, LLC | 0 | -100,00 | 0 | |||||
| 2026-02-09 | 13F | Millington Financial Advisors, LLC | 2.584 | 207 | ||||||
| 2026-02-17 | 13F | Equitable Holdings, Inc. | 153.888 | 38,94 | 11.523 | 41,47 | ||||
| 2026-02-02 | 13F | Truist Financial Corp | 0 | -100,00 | 0 | |||||
| 2025-09-26 | NP | PFJDX - RiskPro® Dynamic 20-30 Fund Class R | 116.090 | -2,42 | 8.029 | 3,84 | ||||
| 2026-01-21 | 13F | Leo Wealth, LLC | 313.751 | 61,75 | 23.502 | 64,76 | ||||
| 2026-01-23 | 13F | Farther Finance Advisors, LLC | 7.270 | 21,27 | 544 | 23,64 | ||||
| 2026-02-10 | 13F/A | Northwestern Mutual Wealth Management Co | 471.987 | 41,68 | 35.342 | 44,26 | ||||
| 2026-01-05 | 13F | Park Avenue Securities Llc | 172.957 | 4,61 | 13 | 0,00 | ||||
| 2026-01-07 | 13F | Lakeridge Wealth Management LLC | 3.193 | 12,67 | 239 | 14,90 | ||||
| 2026-02-17 | 13F | Susquehanna International Group, Llp | 10.057.946 | 51.442,21 | 753.139 | 52.383,48 | ||||
| 2026-01-16 | 13F | BridgePort Financial Solutions, LLC | 70.353 | -1,47 | 5.268 | 0,32 | ||||
| 2025-11-10 | 13F | Convergence Financial, LLC | 0 | -100,00 | 0 | -100,00 | ||||
| 2026-02-11 | 13F | Francis Financial, Inc. | 367.367 | 5,24 | 27.508 | 7,16 | ||||
| 2026-02-05 | 13F | Aegis Wealth Management, Inc. | 4.558 | 341 | ||||||
| 2026-02-02 | 13F | Independence Asset Advisors, LLC | 6.214 | 465 | ||||||
| 2026-01-21 | 13F | Kaizen Financial Strategies | 79.310 | 5,30 | 5.939 | 6,36 | ||||
| 2026-02-02 | 13F | Ashton Thomas Securities, Llc | 995 | 0,00 | 75 | 1,37 | ||||
| 2026-02-06 | 13F | HighTower Advisors, LLC | 15.903 | 110,36 | 1.191 | 114,03 | ||||
| 2026-02-17 | 13F | Advisor Group Holdings, Inc. | 628.804 | -21,40 | 47.090 | -19,00 | ||||
| 2026-01-12 | 13F | Bulwark Capital Corp | 0 | -100,00 | 0 | -100,00 | ||||
| 2026-01-12 | 13F | Richard P Slaughter Associates Inc | 754.348 | 5,41 | 56.486 | 7,33 | ||||
| 2026-01-13 | 13F | ForthRight Wealth Management, LLC | 109.333 | 16,83 | 8.187 | 18,95 | ||||
| 2026-02-17 | 13F | Gallagher Fiduciary Advisors, LLC | 6.767 | 44,10 | 507 | 46,67 | ||||
| 2026-02-13 | 13F | Wells Fargo & Company/mn | 120.689 | 3.272,14 | 9.037 | 3.336,12 | ||||
| 2026-02-05 | 13F | Atria Investments Llc | 33.153 | 10,55 | 2.482 | 12,56 | ||||
| 2026-02-12 | 13F | Elevation Wealth Management LLC | 16.646 | 1.246 | ||||||
| 2026-02-13 | 13F | Mill Creek Capital Advisors, LLC | 4.656 | 0,00 | 349 | 1,75 | ||||
| 2026-02-17 | 13F | Jones Financial Companies Lllp | 505.580 | 41,75 | 37.858 | 45,42 | ||||
| 2026-01-30 | 13F | Oakworth Capital, Inc. | 0 | -100,00 | 0 | |||||
| 2026-02-17 | 13F | Wealth Watch Advisors, INC | 15 | 1 | ||||||
| 2026-01-26 | 13F | Merit Financial Group, LLC | 4.734 | 354 | ||||||
| 2026-01-29 | 13F | Integras Partners LLC | 11.415 | -4,55 | 855 | -2,84 | ||||
| 2026-01-07 | 13F | Sagespring Wealth Partners, Llc | 1.632.821 | 10,22 | 103.796 | 14,30 | ||||
| 2026-02-05 | 13F | PCG Wealth Advisors, LLC | 31.366 | -0,45 | 2.349 | 1,34 | ||||
| 2026-01-08 | 13F | Traveka Wealth, LLC | 7.052 | 98,82 | 528 | 103,08 | ||||
| 2026-02-12 | 13F | BlackRock, Inc. | 1 | 0,00 | 0 | |||||
| 2026-02-10 | 13F | Foundations Investment Advisors, LLC | 8.442 | 632 | ||||||
| 2026-01-30 | 13F | Bogart Wealth, LLC | 1.204.109 | -26,21 | 90.164 | -24,86 | ||||
| 2026-02-17 | 13F | Citadel Advisors Llc | 20.941 | -75,03 | 1.568 | -74,57 | ||||
| 2026-02-11 | 13F | Cerity Partners LLC | 4.874 | -8,12 | 365 | -6,67 | ||||
| 2026-01-21 | 13F | Capital Investment Advisory Services, LLC | 2.317 | -0,39 | 173 | 1,17 | ||||
| 2026-01-23 | 13F | Assetmark, Inc | 1.490.268 | -5,54 | 111.591 | -3,82 | ||||
| 2026-02-09 | 13F | Harbour Investments, Inc. | 5.617 | 2,86 | 421 | 4,74 | ||||
| 2026-02-03 | 13F | Financial Partners Group, Inc | 2.615 | 205 | ||||||
| 2026-02-17 | 13F | Qube Research & Technologies Ltd | 1.609 | 120 | ||||||
| 2026-01-13 | 13F | Dakota Wealth Management | 36.445 | 2.729 | ||||||
| 2026-02-17 | 13F | Advisory Services Network, LLC | 3.638 | 15,35 | 272 | 17,75 | ||||
| 2026-02-11 | 13F | Jpmorgan Chase & Co | 57.617.571 | -6,07 | 4.314.404 | -4,36 | ||||
| 2026-02-10 | 13F | Hazlett, Burt & Watson, Inc. | 308 | 0 | ||||||
| 2026-02-18 | 13F | Beacon Pointe Advisors, LLC | 2.718 | 203 | ||||||
| 2026-02-09 | 13F | Cary Street Partner Investment Advisory Llc | 6.673 | 5,19 | 500 | 7,08 | ||||
| 2026-01-26 | 13F | Lionsbridge Wealth Management LLC | 14.673 | -0,20 | 1.099 | 1,57 | ||||
| 2026-02-18 | 13F | EP Wealth Advisors, Inc. | 263.536 | 5,65 | 19.734 | 11,79 | ||||
| 2026-01-13 | 13F | CoreCap Advisors, LLC | 0 | -100,00 | 0 | |||||
| 2026-02-13 | 13F | Arete Wealth Advisors, LLC | 9.771 | -1,73 | 1 | |||||
| 2026-02-12 | 13F | WealthPLAN Partners, LLC | 6.877 | 515 | ||||||
| 2026-01-16 | 13F | Valicenti Advisory Services Inc | 38.102 | 3,79 | 3 | 0,00 | ||||
| 2026-02-17 | 13F | Ameriprise Financial Inc | 338.269 | 602,69 | 25.327 | 615,45 | ||||
| 2026-01-28 | 13F | Southern Farm Bureau Life Insurance | 322.180 | 0,00 | 24 | 4,35 | ||||
| 2025-11-12 | 13F | Park Square Financial Group, LLC | 0 | -100,00 | 0 | |||||
| 2026-02-04 | 13F | Mascoma Wealth Management LLC | 176.620 | 2,78 | 13.225 | 4,66 | ||||
| 2026-01-22 | 13F | Quotient Wealth Partners, LLC | 3.172 | -10,37 | 238 | -8,85 | ||||
| 2026-02-03 | 13F | We Are One Seven, LLC | 46.195 | 499,55 | 3.459 | 511,13 | ||||
| 2025-11-13 | 13F | Total Investment Management Inc | 0 | -100,00 | 0 | |||||
| 2026-02-19 | 13F | Atomi Financial Group, Inc. | 8.751 | -29,21 | 655 | -27,94 | ||||
| 2026-02-17 | 13F | Cetera Investment Advisers | 1.240.202 | 11,86 | 92.866 | 13,90 | ||||
| 2026-01-15 | 13F | Signature Wealth Management Group | 5.260 | 2,29 | 394 | 3,97 | ||||
| 2026-01-27 | 13F | My Purposeful Wealth Corp. | 10.813 | 66,07 | 810 | 69,25 | ||||
| 2026-02-12 | 13F | Commonwealth Equity Services, Llc | 1.636.548 | 7,34 | 122.545 | 109.314,29 | ||||
| 2026-01-26 | 13F | Asset Dedication, LLC | 223 | -5,51 | 17 | -5,88 | ||||
| 2026-02-12 | 13F | Quadrant Capital Group Llc | 885 | 66 | ||||||
| 2025-11-12 | 13F | Creekmur Asset Management LLC | 0 | -100,00 | 0 | |||||
| 2026-01-27 | 13F | Semus Wealth Partners LLC | 4.988 | -0,48 | 373 | 1,36 | ||||
| 2026-01-21 | 13F | Raleigh Capital Management Inc. | 0 | -100,00 | 0 | |||||
| 2026-02-05 | 13F | Cornerstone Wealth Management, LLC | 10.999 | 20,08 | 824 | 22,29 | ||||
| 2026-02-17 | 13F | Garden State Investment Advisory Services LLC | 71.744 | 16,24 | 5.374 | 18,40 | ||||
| 2026-01-27 | 13F | Purus Wealth Management, LLC | 31.389 | 4,14 | 2.350 | 6,05 | ||||
| 2026-02-04 | 13F | Pensionmark Financial Group, Llc | 30.329 | 554 | ||||||
| 2026-02-13 | 13F | Morgan Stanley | 288.842 | -11,23 | 21.629 | -9,61 | ||||
| 2026-02-09 | 13F | Hantz Financial Services, Inc. | 103 | 0 | ||||||
| 2026-01-20 | 13F | Sovran Advisors, LLC | 5.800 | 1,49 | 450 | 5,90 | ||||
| 2026-01-14 | 13F | Pallas Capital Advisors LLC | 423.633 | 12,47 | 31.722 | 14,52 | ||||
| 2026-01-26 | 13F | AE Wealth Management LLC | 304 | -16,71 | 23 | -15,38 | ||||
| 2026-02-11 | 13F | Vise Technologies, Inc. | 22.366 | 251,06 | 1.675 | 257,69 | ||||
| 2026-02-23 | 13F | Beaird Harris Wealth Management, LLC | 4.075 | 305 | ||||||
| 2026-01-20 | 13F | AdvisorNet Financial, Inc | 11.124 | 5,16 | 833 | 7,08 | ||||
| 2026-02-06 | 13F | Csenge Advisory Group | 2.943 | 220 | ||||||
| 2025-10-21 | 13F | Sterling Investment Counsel, LLC | 0 | -100,00 | 0 | |||||
| 2026-02-13 | 13F | Bay Colony Advisory Group, Inc d/b/a Bay Colony Advisors | 0 | -100,00 | 0 | -100,00 | ||||
| 2026-02-06 | 13F | Ignite Planners, LLC | 31.797 | 14,02 | 2.498 | 21,85 | ||||
| 2026-02-13 | 13F | OpenArc Corporate Advisory, LLC | 44.095 | 3.302 | ||||||
| 2026-01-07 | 13F | Massmutual Trust Co Fsb/adv | 35.528 | -3,45 | 2.660 | -1,70 | ||||
| 2026-02-17 | 13F | Capital Planning Advisors, LLC | 318.343 | 3,92 | 23.838 | 5,82 | ||||
| 2026-01-29 | 13F | TBH Global Asset Management, LLC | 0 | -100,00 | 0 | -100,00 | ||||
| 2026-01-12 | 13F | Shira Ridge Wealth Management | 4.466 | 3,16 | 334 | 5,03 | ||||
| 2026-01-02 | 13F | First Financial Bank - Trust Division | 466.225 | 3,04 | 34.911 | 4,92 | ||||
| 2026-02-11 | 13F | Cedar Mountain Advisors, LLC | 4.021 | 0,00 | 301 | 2,03 | ||||
| 2026-01-08 | 13F | Firethorn Wealth Partners, Llc | 12.093 | 2,15 | 905 | 4,02 | ||||
| 2026-01-26 | 13F | Key Capital Management, INC | 239 | 18 | ||||||
| 2026-02-12 | 13F | StoneX Group Inc. | 9.318 | -45,75 | 698 | -44,81 | ||||
| 2026-01-28 | 13F | N.E.W. Advisory Services LLC | 1.225 | 406,20 | 92 | 435,29 | ||||
| 2026-01-23 | 13F | HBW Advisory Services LLC | 45.561 | 58,03 | 3.412 | 60,90 | ||||
| 2026-02-13 | 13F | Advyzon Investment Management, LLC | 3.569 | 11,29 | 267 | 13,62 | ||||
| 2026-02-02 | 13F | Millstone Evans Group, LLC | 201 | 15 | ||||||
| 2026-01-29 | 13F | Dunhill Financial, LLC | 402 | 30 | ||||||
| 2026-02-04 | 13F | Pure Financial Advisors, Inc. | 661.354 | 0,97 | 49.522 | 2,81 | ||||
| 2026-02-12 | 13F | Foster Dykema Cabot & Partners, Llc | 0 | -100,00 | 0 | |||||
| 2026-01-14 | 13F | Goelzer Investment Management, Inc. | 4.343 | 0,00 | 325 | 1,88 | ||||
| 2026-02-05 | 13F | Stephens Inc /ar/ | 3.970 | 297 | ||||||
| 2026-02-13 | 13F | Golden State Wealth Management, LLC | 17.871 | 67,49 | 1.338 | 70,66 | ||||
| 2026-02-17 | 13F | Cape Investment Advisory, Inc. | 11 | 1 | ||||||
| 2026-02-02 | 13F | Legacy Edge Advisors, LLC | 38.845 | 2.909 | ||||||
| 2026-02-13 | 13F | LGT Financial Advisors LLC | 125 | -50,98 | 9 | -50,00 | ||||
| 2026-02-05 | 13F | WealthPlan Investment Management, LLC | 206.140 | 33,20 | 15.436 | 35,63 | ||||
| 2026-02-13 | 13F | Resources Investment Advisors, LLC. | 5.730 | 429 | ||||||
| 2026-01-08 | 13F | Sound View Wealth Advisors Group, LLC | 17.036 | 272,86 | 1.276 | 279,46 | ||||
| 2026-01-21 | 13F | Paladin Advisory Group, LLC | 805 | 0,00 | 60 | 1,69 | ||||
| 2026-02-12 | 13F | Principal Securities, Inc. | 0 | -100,00 | 0 | |||||
| 2026-02-13 | 13F | Level Four Advisory Services, Llc | 511.036 | 2,11 | 38.266 | 3,97 | ||||
| 2026-02-10 | 13F | Root Financial Partners, LLC | 754 | 654,00 | 56 | 700,00 | ||||
| 2026-01-21 | 13F | Lockerman Financial Group, Inc. | 23.171 | -1,78 | 1.735 | 0,06 | ||||
| 2026-02-12 | 13F | CIBC Private Wealth Group, LLC | 71 | 173,08 | 5 | 400,00 | ||||
| 2026-02-11 | 13F | Etesian Wealth Advisors, Inc. | 97.931 | 8,79 | 7.333 | 10,77 | ||||
| 2026-02-12 | 13F | Johnson Financial Group, Inc. | 26 | 2 | ||||||
| 2026-02-06 | 13F | GPS Wealth Strategies Group, LLC | 0 | -100,00 | 0 | |||||
| 2026-01-23 | 13F | Financial Connections Group, Inc. | 77.343 | -2,01 | 6 | 0,00 | ||||
| 2026-02-09 | 13F | Huntington National Bank | 27 | 3,85 | ||||||
| 2026-02-10 | 13F | Lido Advisors, LLC | 27.037 | 154,83 | 2.025 | 159,49 | ||||
| 2026-02-17 | 13F | Fmr Llc | 3.272.122 | 18,56 | 245.016 | 20,72 | ||||
| 2026-01-15 | 13F | Quantum Financial Planning Services, Inc. | 9.672 | 77,53 | 724 | 81,00 | ||||
| 2026-02-17 | 13F | Private Advisor Group, LLC | 932.480 | 1,87 | 69.824 | 3,72 | ||||
| 2026-02-02 | 13F | Oak Harbor Wealth Partners, Llc | 461 | 35 | ||||||
| 2026-01-16 | 13F | Kendall Capital Management | 325.315 | 7,26 | 24.360 | 9,22 | ||||
| 2026-01-23 | 13F | Bryant Woods Investment Advisors, LLC | 128.458 | 11,75 | 9.619 | 13,78 | ||||
| 2026-02-13 | 13F | Smartleaf Asset Management LLC | 14 | 180,00 | 1 | |||||
| 2026-01-26 | 13F | Parcion Private Wealth LLC | 26.473 | 0,00 | 1.982 | 1,85 | ||||
| 2026-01-15 | 13F | SILVER OAK SECURITIES, Inc | 47.505 | 2,67 | 3.579 | 5,17 | ||||
| 2026-01-28 | 13F | Gentry Private Wealth, Llc | 7.511 | -10,18 | 562 | -8,47 | ||||
| 2026-01-05 | 13F | GoalVest Advisory LLC | 528 | -15,52 | 40 | -13,33 | ||||
| 2026-01-23 | 13F | Bellevue Asset Management, Llc | 74.581 | 3,64 | 5.587 | 5,56 | ||||
| 2026-02-04 | 13F | Meridian Wealth Management, LLC | 6.487 | -8,80 | 486 | -7,27 | ||||
| 2026-02-17 | 13F | Signature Equity Partners, LLC | 469 | 35 | ||||||
| 2026-02-12 | 13F | BRYN MAWR TRUST Co | 0 | -100,00 | 0 | -100,00 | ||||
| 2026-02-11 | 13F | J.w. Cole Advisors, Inc. | 10.611 | 19,33 | 795 | 21,59 | ||||
| 2026-02-13 | 13F | Aptus Capital Advisors, LLC | 778 | 37,46 | 58 | 41,46 | ||||
| 2025-11-14 | 13F | Logan Capital Management Inc | 0 | -100,00 | 0 | -100,00 | ||||
| 2026-02-02 | 13F/A | Fortress Wealth Group, LLC | 3.083 | 3,39 | 242 | 8,52 | ||||
| 2026-02-12 | 13F | Renaissance Technologies Llc | 3.300 | 247 | ||||||
| 2026-02-11 | 13F | O'shaughnessy Asset Management, Llc | 9.240 | -6,57 | 692 | -4,95 | ||||
| 2026-02-03 | 13F | International Assets Investment Management, Llc | 576 | 43 | ||||||
| 2026-01-27 | 13F | 5T Wealth, LLC | 36.170 | 2.709 | ||||||
| 2026-02-12 | 13F | Steward Partners Investment Advisory, Llc | 11.307 | 1,70 | 847 | 3,55 | ||||
| 2026-02-17 | 13F | Gladstone Institutional Advisory LLC | 4.981 | 373 | ||||||
| 2026-01-22 | 13F | Cliftonlarsonallen Wealth Advisors, Llc | 629.076 | 13,98 | 47.105 | 16,06 | ||||
| 2026-02-13 | 13F | Integrated Wealth Concepts LLC | 62.477 | -82,86 | 4.678 | -82,55 | ||||
| 2026-02-06 | 13F | Global Retirement Partners, LLC | 39.256 | -2,07 | 2.940 | -0,27 | ||||
| 2025-10-27 | 13F | Kiker Wealth Management, LLC | 0 | -100,00 | 0 | |||||
| 2026-01-29 | 13F | Comerica Bank | 1.308 | 0,31 | 98 | 2,11 | ||||
| 2026-02-13 | 13F | Motiv8 Investments LLC | 35 | 0 | ||||||
| 2026-01-29 | 13F | Sanctuary Advisors, LLC | 16.831 | -34,43 | 1.260 | -33,23 | ||||
| 2026-02-13 | 13F | Gts Securities Llc | 15.547 | 17,43 | 1.164 | 19,63 | ||||
| 2026-02-13 | 13F | Mml Investors Services, Llc | 1.780.194 | 18,77 | 133.301 | 20,94 | ||||
| 2026-02-12 | 13F | Tiemann Investment Advisors, Llc | 7.015 | -1,41 | 525 | 0,38 | ||||
| 2026-02-11 | 13F | Tradition Wealth Management, LLC | 255.404 | 8,80 | 19.125 | 10,79 | ||||
| 2026-02-06 | 13F | Axxcess Wealth Management, Llc | 12.956 | 13,45 | 970 | 15,61 | ||||
| 2026-02-13 | 13F | Transamerica Financial Advisors, Inc. | 1.957 | 147 | ||||||
| 2026-01-21 | 13F | Walkner Condon Financial Advisors LLC | 6.005 | 2,47 | 450 | 4,42 | ||||
| 2026-02-05 | 13F | Atlas Wealth LLC | 8.690 | 37,83 | 651 | 40,39 | ||||
| 2026-02-05 | 13F | Western Wealth Management, LLC | 34.202 | 1,13 | 2.561 | 2,98 | ||||
| 2026-02-12 | 13F | Scotia Capital Inc. | 43.284 | 7,60 | 3.241 | 9,57 | ||||
| 2026-02-17 | 13F | Ameriflex Group, Inc. | 1.125 | 603,12 | 84 | 663,64 | ||||
| 2026-01-07 | 13F | Harbor Investment Advisory, Llc | 279 | 3,33 | 21 | 5,26 | ||||
| 2026-02-06 | 13F | Pnc Financial Services Group, Inc. | 23.231 | 2.668,89 | 1.740 | 2.750,82 | ||||
| 2026-01-15 | 13F | Saxony Capital Management, LLC | 12.772 | 956 | ||||||
| 2026-02-06 | 13F | Elk River Wealth Management, LLC | 368.322 | -0,97 | 27.494 | 0,52 | ||||
| 2026-02-10 | 13F | Envestnet Asset Management Inc | 2.898.625 | 6,01 | 217.049 | 7,94 | ||||
| 2026-02-12 | 13F | Jane Street Group, Llc | 102.199 | -66,02 | 7.653 | -65,40 | ||||
| 2026-01-14 | 13F | Spire Wealth Management | 9 | -10,00 | 1 | |||||
| 2026-02-06 | 13F | Vestmark Advisory Solutions, Inc. | 1.246.584 | 9,91 | 93.344 | 11,92 | ||||
| 2026-01-22 | 13F | Financial Consulate, Inc | 45 | 3 | ||||||
| 2026-01-06 | 13F | Unique Wealth, Llc | 95.820 | 11,00 | 7.175 | 13,01 | ||||
| 2026-01-09 | 13F | Marshall Financial Group LLC | 15.746 | -13,43 | 1.179 | -11,82 | ||||
| 2026-01-30 | 13F | Boyer Financial Services, Inc. | 20.709 | 1.571 | ||||||
| 2026-02-11 | 13F | Dearborn Partners Llc | 9.195 | 48,91 | 689 | 51,54 | ||||
| 2026-03-04 | 13F | SHP Wealth Management | 21 | 2 | ||||||
| 2026-01-08 | 13F | Choice Wealth Advisors, LLC | 300.715 | 0,05 | 22.518 | 1,87 | ||||
| 2026-01-23 | 13F | Family Investment Center, Inc. | 281.619 | -2,88 | 21.088 | -1,11 | ||||
| 2026-01-30 | 13F | Wagner Wealth Management, Llc | 109.204 | 3,64 | 8.177 | 5,52 | ||||
| 2026-01-23 | 13F | U.S. Capital Wealth Advisors, LLC | 57.288 | 30,94 | 4.290 | 33,32 | ||||
| 2026-01-08 | 13F | Wealth Enhancement Advisory Services, Llc | 81.642 | -4,57 | 6.269 | -1,54 | ||||
| 2026-02-17 | 13F | Glenmede Trust Co Na | 0 | -100,00 | 0 | |||||
| 2026-02-14 | 13F | Bank of Marin | 7.851 | 0,00 | 588 | 1,73 | ||||
| 2026-02-11 | 13F | Gateway Wealth Partners, LLC | 8.154 | 16,35 | 611 | 18,45 | ||||
| 2026-01-08 | 13F | Centerline Wealth Advisors, LLC | 92.954 | 0,28 | 6.960 | 2,11 | ||||
| 2026-01-23 | 13F | Patten Group, Inc. | 5.115 | 0,45 | 383 | 2,41 | ||||
| 2026-02-12 | 13F | Bank Of Montreal /can/ | 95 | 6 | ||||||
| 2026-01-12 | 13F | Daymark Wealth Partners, Llc | 454.696 | 2.563,25 | 34.048 | 2.612,91 | ||||
| 2026-02-11 | 13F | Parallel Advisors, LLC | 314 | 0,00 | 24 | 0,00 | ||||
| 2026-02-14 | 13F | Whipplewood Advisors, LLC | 3.298 | -1,17 | 247 | 0,41 | ||||
| 2026-01-29 | 13F | Wealth Alliance Advisory Group, LLC | 0 | -100,00 | 0 | |||||
| 2026-02-17 | 13F | IHT Wealth Management, LLC | 51.758 | -0,54 | 3.876 | 1,25 | ||||
| 2026-01-12 | 13F | PUREfi Wealth, LLC | 4.498 | 337 | ||||||
| 2026-02-10 | 13F | IFG Advisory, LLC | 4.990 | 374 | ||||||
| 2025-11-14 | 13F/A | NorthRock Partners, LLC | 0 | -100,00 | 0 | |||||
| 2026-02-11 | 13F | Hughes Financial Services, LLC | 822.617 | 2,33 | 61.598 | 2,01 | ||||
| 2026-02-02 | 13F | Mutual Advisors, LLC | 30.175 | -0,28 | 2.260 | 0,00 |