Grundlæggende statistik
| Institutionelle ejere | 404 total, 404 long only, 0 short only, 0 long/short - change of 8,82% MRQ |
| Gennemsnitlig porteføljeallokering | 0.4284 % - change of 11,30% MRQ |
| Institutionelle aktier (lange) | 25.862.529 (ex 13D/G) - change of 0,54MM shares 2,14% MRQ |
| Institutionel værdi (lang) | $ 1.992.803 USD ($1000) |
Institutionelt ejerskab og aktionærer
iShares Trust - iShares Morningstar Mid-Cap Growth ETF (US:IMCG) har 404 institutionelle ejere og aktionærer, der har indsendt 13D/G- eller 13F-formularer til Securities Exchange Commission (SEC). Disse institutioner har i alt 25,862,529 aktier. Største aktionærer omfatter Vantagepoint Investment Advisers Llc, LPL Financial LLC, Morgan Stanley, Raymond James Financial Inc, Cetera Investment Advisers, Northwestern Mutual Wealth Management Co, Ameriprise Financial Inc, Commonwealth Equity Services, Llc, Bank Of America Corp /de/, and Advisor Group Holdings, Inc. .
iShares Trust - iShares Morningstar Mid-Cap Growth ETF (ARCA:IMCG) institutionel ejerskabsstruktur viser aktuelle positioner i virksomheden efter institutioner og fonde, samt seneste ændringer i positionsstørrelse. Større aktionærer kan omfatte individuelle investorer, investeringsforeninger, hedgefonde eller institutioner. Skema 13D angiver, at investoren besidder (eller besidder) mere end 5 % af virksomheden og har til hensigt (eller har til hensigt at) aktivt at forfølge en ændring i forretningsstrategi. Skema 13G indikerer en passiv investering på over 5%.
The share price as of April 30, 2026 is 88,02 / share. Previously, on May 2, 2025, the share price was 73,58 / share. This represents an increase of 19,62% over that period.

Fondens stemningsscore
Fund Sentiment Score (fka Ownership Accumulation Score) finder de aktier, der bliver mest købt af fonde. Det er resultatet af en sofistikeret, multi-faktor kvantitativ model, der identificerer virksomheder med de højeste niveauer af institutionel akkumulering. Scoringsmodellen bruger en kombination af den samlede stigning i oplyste ejere, ændringerne i porteføljeallokeringer i disse ejere og andre målinger. Tallet går fra 0 til 100, hvor højere tal indikerer et højere niveau af akkumulering for sine jævnaldrende, og 50 er gennemsnittet.
Opdateringsfrekvens: Dagligt
Se Ownership Explorer, som giver en liste over højest rangerende virksomheder.
AI+ Ask Fintel’s AI assistant about iShares Trust - iShares Morningstar Mid-Cap Growth ETF.
Select a question to share a public post with an AI-crafted answer.
Thinking of good questions…
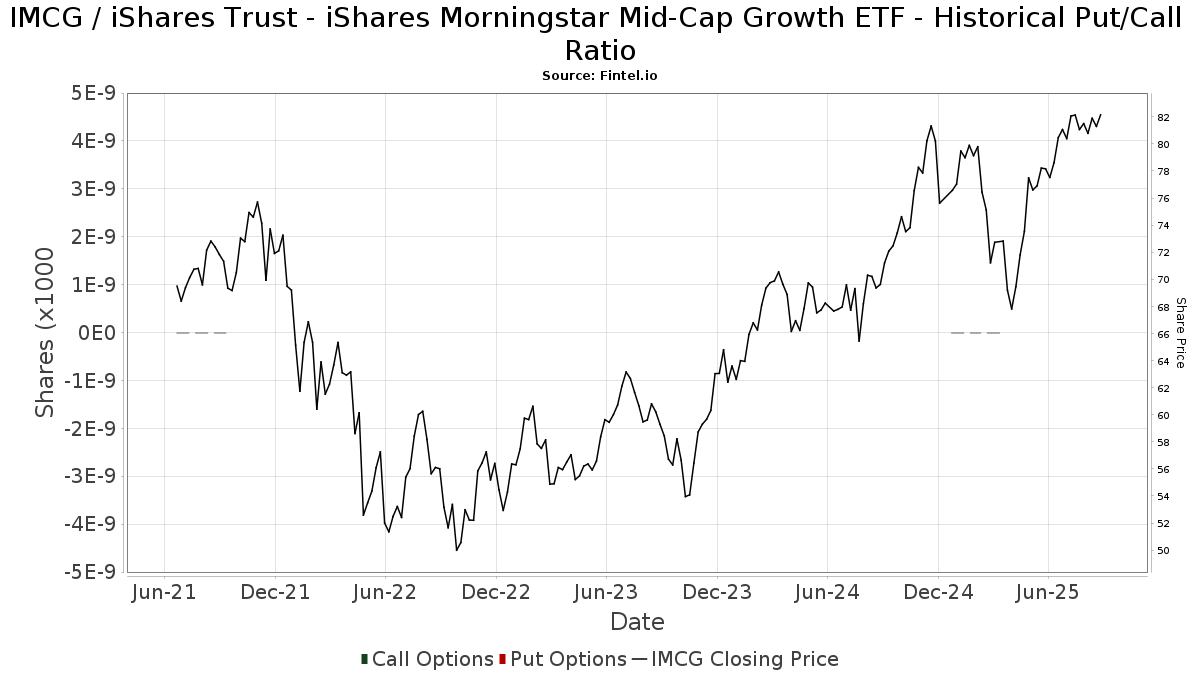
Institutionel Put/Call-forhold
Ud over at indberette standardaktie- og gældsudstedelser skal institutter med mere end 100 mill. aktiver under forvaltning også oplyse deres put- og call-optionsbeholdninger. Da salgsoptioner generelt indikerer negativ stemning, og købsoptioner indikerer positiv stemning, kan vi få en fornemmelse af den overordnede institutionelle stemning ved at plotte forholdet mellem put og kald. Diagrammet til højre viser det historiske put/call-forhold for dette instrument.
Brug af Put/Call Ratio som en indikator for investorernes stemning overvinder en af de vigtigste mangler ved at bruge totalt institutionelt ejerskab, som er, at en betydelig mængde af aktiver under forvaltning investeres passivt for at spore indekser. Passivt forvaltede fonde køber typisk ikke optioner, så indikatoren for put/call-forholdet følger mere nøje følelsen af aktivt forvaltede fonde.
13D/G-arkivering
Vi præsenterer 13D/G ansøgninger separat fra 13F ansøgninger på grund af den forskellige behandling af SEC. 13D/G-ansøgninger kan indgives af grupper af investorer (med én ledende), hvorimod 13F-ansøgninger ikke kan. Dette resulterer i situationer, hvor en investor kan indsende en 13D/G, der rapporterer én værdi for de samlede aktier (der repræsenterer alle de aktier, der ejes af investorgruppen), men derefter indsender en 13F, der rapporterer en anden værdi for de samlede aktier (der udelukkende repræsenterer deres egne) ejendomsret). Det betyder, at aktieejerskab af 13D/G-arkiver og 13F-arkiveringer ofte ikke er direkte sammenlignelige, så vi præsenterer dem separat.
Bemærk: Fra den 16. maj 2021 viser vi ikke længere ejere, der ikke har indsendt en 13D/G inden for det seneste år. Tidligere viste vi den fulde historie af 13D/G-arkiver. Generelt skal enheder, der er forpligtet til at indgive 13D/G-ansøgninger, indgive mindst årligt, før de indsender en afsluttende ansøgning. Dog forlader fonde nogle gange positioner uden at indsende en afsluttende ansøgning (dvs. de afvikler), så visning af den fulde historie resulterede nogle gange i forvirring om det nuværende ejerskab. For at undgå forvirring viser vi nu kun 'aktuelle' ejere - det vil sige - ejere, der har anmeldt inden for det seneste år.
Upgrade to unlock premium data.
| Fil dato | Form | Investor | Forrige Aktier |
Seneste Aktier |
Δ Aktier (Procent) |
Ejendomsret (Procent) |
Δ Ejerskab (Procent) |
|
|---|---|---|---|---|---|---|---|---|
| 2025-10-07 | International City Management Association Retirement Corp | 3,117,331 | 8.00 |
13F og NPORT arkivering
Detaljer om 13F-arkivering er gratis. Detaljer om NP-ansøgninger kræver et premium-medlemskab. Grønne rækker angiver nye positioner. Røde rækker angiver lukkede positioner. Klik på linket ikon for at se den fulde transaktionshistorik.
Opgrader
for at låse premium-data op og eksportere til Excel ![]() .
.
| Fil dato | Kilde | Investor | Type | Gennemsnitlig pris (Øst) |
Aktier | Δ Aktier (%) |
Rapporteret Værdi ($1000) |
Δ Værdi (%) |
Port Alloc (%) |
|
|---|---|---|---|---|---|---|---|---|---|---|
| 2026-02-09 | 13F | Coldstream Capital Management Inc | 6.915 | 0,00 | 552 | -3,50 | ||||
| 2026-04-21 | 13F | Financial Consulate, Inc | 297 | 0,00 | 23 | 0,00 | ||||
| 2026-02-13 | 13F | Smartleaf Asset Management LLC | 2.862 | 9,15 | 231 | 6,94 | ||||
| 2026-04-23 | 13F | Harbor Investment Advisory, Llc | 10.930 | 0,00 | 861 | -1,38 | ||||
| 2026-02-13 | 13F | Resources Investment Advisors, LLC. | 16.403 | 14,82 | 1.310 | 10,84 | ||||
| 2026-04-17 | 13F | Nottingham Advisors, Inc. | 18.682 | 0,00 | 1.472 | -1,34 | ||||
| 2026-02-09 | 13F | Kingsview Wealth Management, LLC | 30.299 | 3,79 | 2.419 | 0,17 | ||||
| 2026-02-11 | 13F | Brand Asset Management Group, Inc. | 3.490 | -1,97 | 279 | -5,44 | ||||
| 2026-04-29 | 13F | Unified Investment Management | 4.285 | 3,25 | 338 | 1,81 | ||||
| 2026-02-11 | 13F | Ipsen Advisor Group LLC | 79.020 | 0,48 | 6.309 | -3,04 | ||||
| 2026-04-30 | 13F | Private Trust Co Na | 3.561 | -4,25 | 281 | -5,41 | ||||
| 2026-04-21 | 13F | Vise Technologies, Inc. | 12.749 | 0,00 | 1.018 | 0,00 | ||||
| 2026-02-10 | 13F | IFG Advisory, LLC | 5.156 | 412 | ||||||
| 2025-11-12 | 13F | CIBC Bancorp USA Inc. | 5.907 | 489 | ||||||
| 2026-04-17 | 13F | Signal Advisors Wealth, LLC | 9.518 | 2,15 | 750 | 0,81 | ||||
| 2025-11-14 | 13F | Strategic Wealth Partners, Ltd. | 0 | -100,00 | 0 | |||||
| 2026-04-29 | 13F | Steele Capital Management, Inc. | 203.880 | 0,27 | 16.060 | -1,07 | ||||
| 2026-02-04 | 13F | Family Legacy, Inc. | 38.701 | 2,90 | 3.090 | -0,71 | ||||
| 2026-02-02 | 13F | Benjamin Edwards Inc | 14.978 | 198,31 | 1.196 | 187,95 | ||||
| 2026-04-28 | 13F | St. Johns Investment Management Company, LLC | 400 | 0,00 | 32 | 0,00 | ||||
| 2026-02-05 | 13F | Dahring | Cusmano Llc | 2.700 | -2,56 | 216 | -6,11 | ||||
| 2026-04-27 | 13F | Mount Yale Investment Advisors, LLC | 139.661 | 9,48 | 11.001 | 8,01 | ||||
| 2026-01-29 | 13F | Comerica Bank | 11.839 | -40,78 | 945 | -42,83 | ||||
| 2026-04-07 | 13F | Signaturefd, Llc | 60 | 0,00 | 5 | 0,00 | ||||
| 2026-02-10 | 13F | American Money Management, LLC | 4.630 | 0,00 | 370 | -3,66 | ||||
| 2026-05-01 | 13F | Diversify Wealth Management, Llc | 58.319 | 33,16 | 5.016 | 37,88 | ||||
| 2026-02-12 | 13F | Chilton Capital Management Llc | 0 | -100,00 | 0 | |||||
| 2026-02-12 | 13F | Hrt Financial Lp | 29.494 | 2 | ||||||
| 2026-02-13 | 13F | Cornerstone Financial Management LLC | 287 | 23 | ||||||
| 2026-04-15 | 13F | Trust Point Inc. | 4.651 | 366 | ||||||
| 2026-01-28 | 13F | Edge Financial Advisors LLC | 4.123 | -2,34 | 329 | -5,73 | ||||
| 2026-04-30 | 13F | Financial Freedom, LLC | 9.300 | 0,10 | 733 | -1,21 | ||||
| 2026-02-09 | 13F | Horizon Family Wealth, Inc. | 27.403 | 611,40 | 2.188 | 587,74 | ||||
| 2026-02-12 | 13F | Bank Of Montreal /can/ | 6.475 | 0,00 | 517 | -3,55 | ||||
| 2026-02-10 | 13F | Envestnet Asset Management Inc | 184.438 | -3,70 | 14.726 | -7,06 | ||||
| 2026-04-20 | 13F | Eagle Strategies LLC | 161.271 | 7,24 | 12.703 | 5,81 | ||||
| 2026-02-04 | 13F | Liberty Wealth Management Llc | 3.930 | -20,69 | 314 | -23,47 | ||||
| 2026-02-17 | 13F | Blair William & Co/il | 26.543 | 6,19 | 2.119 | 2,52 | ||||
| 2026-04-09 | 13F | PFS Partners, LLC | 101.932 | 3,76 | 8.029 | 2,37 | ||||
| 2026-04-08 | 13F | Dynamic Advisor Solutions LLC | 4.098 | 6,14 | 323 | 4,55 | ||||
| 2026-04-24 | 13F | Eagle Bay Advisors LLC | 0 | -100,00 | 0 | |||||
| 2026-04-28 | 13F | Nbt Bank N A /ny | 1.652 | 1.965,00 | 130 | -0,76 | ||||
| 2026-02-06 | 13F | Pnc Financial Services Group, Inc. | 19.942 | 0,00 | 1.592 | -3,46 | ||||
| 2026-04-23 | 13F | Signature Securities Group Corporation | 6.130 | -6,04 | 483 | -7,31 | ||||
| 2026-01-29 | 13F | Quest 10 Wealth Builders, Inc. | 263 | 21 | ||||||
| 2026-01-28 | 13F | Salomon & Ludwin, LLC | 513 | -0,77 | 42 | -2,38 | ||||
| 2026-05-01 | 13F | Carnegie Capital Asset Management, LLC | 15.991 | 1,85 | 1.260 | 0,48 | ||||
| 2026-02-17 | 13F | Modern Wealth Management, LLC | 3.606 | -4,32 | 288 | -7,72 | ||||
| 2026-02-12 | 13F | Steward Partners Investment Advisory, Llc | 96.304 | 5,77 | 7.689 | 2,07 | ||||
| 2025-11-14 | 13F/A | NorthRock Partners, LLC | 0 | -100,00 | 0 | |||||
| 2026-05-01 | 13F | Castle Wealth Management Llc | 65.661 | 4,48 | 5.172 | 3,09 | ||||
| 2026-01-30 | 13F | Sigma Planning Corp | 127.905 | 1,89 | 10.212 | -1,68 | ||||
| 2026-04-14 | 13F | Zrc Wealth Management, Llc | 254 | 0,00 | 20 | 0,00 | ||||
| 2026-04-29 | 13F | Kaydan Wealth Management, Inc. | 4.950 | 0,00 | 390 | -1,52 | ||||
| 2026-02-17 | 13F | one8zero8, LLC | 30 | 2 | ||||||
| 2026-02-06 | 13F | EverSource Wealth Advisors, LLC | 105 | 0,00 | 8 | 0,00 | ||||
| 2026-02-13 | 13F | Horizon Investment Services, LLC | 20.090 | 1,64 | 1.604 | -1,90 | ||||
| 2026-04-23 | 13F | Kohmann Bosshard Financial Services, LLC | 360 | 0,00 | 28 | 0,00 | ||||
| 2026-02-06 | 13F | Kingdom Financial Group LLC. | 530 | 42 | ||||||
| 2026-04-17 | 13F | Certified Advisory Corp | 97.866 | 22,84 | 7.709 | 21,18 | ||||
| 2026-02-13 | 13F | Visionary Wealth Advisors | 25.780 | -13,42 | 2.058 | -16,44 | ||||
| 2026-02-13 | 13F | Johnson Investment Counsel Inc | 0 | -100,00 | 0 | |||||
| 2026-02-05 | 13F | Pacific Sun Financial Corp | 12.583 | 5,09 | 1.005 | 1,41 | ||||
| 2026-02-17 | 13F | Advisor Group Holdings, Inc. | 472.349 | -9,47 | 37.721 | -12,15 | ||||
| 2026-04-29 | 13F | Silver Oak Wealth Advisors Services, Llc | 88.437 | 2,64 | 6.966 | 1,26 | ||||
| 2026-02-11 | 13F | MCF Advisors LLC | 550 | 0,00 | 44 | -4,44 | ||||
| 2026-04-08 | 13F | Wealth Enhancement Advisory Services, Llc | 55.927 | -29,65 | 4.483 | -32,05 | ||||
| 2025-11-14 | 13F | Imprint Wealth LLC | 0 | -100,00 | 0 | |||||
| 2026-02-02 | 13F | Cornerstone Planning Group LLC | 352.307 | -2,41 | 29.414 | -0,06 | ||||
| 2026-02-11 | 13F | Parallel Advisors, LLC | 1.848 | 0,00 | 148 | -3,29 | ||||
| 2026-04-13 | 13F | Mlp3, Llc | 8.147 | -1,95 | 642 | -3,32 | ||||
| 2026-02-12 | 13F | Federation des caisses Desjardins du Quebec | 292 | 39,05 | 23 | 35,29 | ||||
| 2026-02-13 | 13F | Ubs Asset Management Americas Inc | 930 | 74 | ||||||
| 2026-02-17 | 13F | Asset Management Group, Inc. | 4.556 | 0,26 | 364 | -3,20 | ||||
| 2026-02-13 | 13F | SYM FINANCIAL Corp | 282 | 23 | ||||||
| 2026-02-17 | 13F | Hilltop Holdings Inc. | 21.921 | -0,35 | 1.750 | -3,79 | ||||
| 2026-04-24 | 13F | Kendall Capital Management | 3.071 | 0,07 | 242 | -1,63 | ||||
| 2026-04-28 | 13F | Hoey Investments, Inc | 171 | 13 | ||||||
| 2026-04-17 | 13F | Halbert Hargrove Global Advisors, Llc | 460 | 0,00 | 36 | 0,00 | ||||
| 2026-04-30 | 13F | First Horizon Corp | 1.627 | 0,00 | 128 | -0,78 | ||||
| 2026-02-03 | 13F | Northern Capital Management, Inc. | 3.880 | 0,00 | 310 | -3,44 | ||||
| 2026-02-13 | 13F | McAdam, LLC | 19.478 | -1,20 | 1.555 | -4,66 | ||||
| 2026-02-17 | 13F | Russell Investments Group, Ltd. | 641 | -0,62 | 51 | -3,77 | ||||
| 2026-02-13 | 13F | Stifel Financial Corp | 12.244 | 1,36 | 978 | -2,20 | ||||
| 2026-04-07 | 13F | Eastern Bank | 222 | 0,00 | 17 | 0,00 | ||||
| 2026-02-04 | 13F | Biltmore Family Office, LLC | 120 | 10 | ||||||
| 2026-04-08 | 13F | Ptm Wealth Management, Llc | 157.049 | 23,07 | 12.658 | 21,45 | ||||
| 2026-04-14 | 13F | Moisand Fitzgerald Tamayo, LLC | 774 | 0,00 | 61 | -1,64 | ||||
| 2026-02-04 | 13F | GGM Financials LLC | 535 | 0,19 | 43 | -4,55 | ||||
| 2026-04-28 | 13F | Kingswood Wealth Advisors, Llc | 51.612 | 1,35 | 4.065 | 0,00 | ||||
| 2026-02-17 | 13F | Windsor Advisory Group, LLC | 0 | -100,00 | 0 | |||||
| 2026-04-20 | 13F | Dagco, Inc. | 380 | 0,00 | 30 | -3,33 | ||||
| 2026-01-28 | 13F | Geneos Wealth Management Inc. | 7.072 | 0,06 | 565 | -3,42 | ||||
| 2026-04-17 | 13F | Capital Wealth Management, Llc | 226.883 | 14,22 | 17.872 | 12,69 | ||||
| 2026-04-27 | 13F | Hunter Associates Investment Management Llc | 21.603 | -3,46 | 2 | 0,00 | ||||
| 2026-04-28 | 13F | Whittier Trust Co | 240 | 0,00 | 19 | 0,00 | ||||
| 2026-04-10 | 13F | Rede Wealth, LLC | 3.786 | 0,00 | 298 | -1,32 | ||||
| 2026-01-22 | 13F | Rodgers & Associates, LTD | 231.448 | 2,31 | 18.479 | -1,27 | ||||
| 2026-01-07 | 13F | Procyon Private Wealth Partners, LLC | 2.807 | 8,13 | 224 | 4,67 | ||||
| 2026-02-13 | 13F | Aire Advisors, Llc | 31.376 | 0,08 | 2.505 | -3,39 | ||||
| 2026-04-09 | 13F | Secure Asset Management, LLC | 4.321 | -4,74 | 340 | -6,08 | ||||
| 2026-04-28 | 13F | Flagship Harbor Advisors, Llc | 0 | -100,00 | 0 | |||||
| 2026-02-17 | 13F | Captrust Financial Advisors | 12.888 | 1.029 | ||||||
| 2026-04-27 | 13F | Td Private Client Wealth Llc | 2.372 | -0,63 | 187 | -2,11 | ||||
| 2026-02-17 | 13F | Wiley Bros.-aintree Capital, Llc | 56.472 | -0,27 | 4.506 | -3,80 | ||||
| 2026-02-13 | 13F | Baird Financial Group, Inc. | 3.557 | -14,25 | 284 | -17,49 | ||||
| 2026-02-06 | 13F | Addison Advisors LLC | 7.550 | 0,00 | 603 | -3,53 | ||||
| 2026-01-22 | 13F | Bartlett & Co. Wealth Management Llc | 400 | 0,00 | 32 | -6,06 | ||||
| 2026-01-23 | 13F | Diversify Advisory Services, LLC | 19.820 | 3,69 | 1.654 | 5,35 | ||||
| 2026-01-28 | 13F | Bedel Financial Consulting, Inc. | 159.323 | 2,68 | 12.720 | -0,90 | ||||
| 2026-04-15 | 13F | Nations Financial Group Inc, /ia/ /adv | 138.725 | 6,85 | 10.927 | 5,42 | ||||
| 2026-01-27 | 13F | Chaney Capital Management, Inc. | 54.252 | 1,93 | 4.331 | -1,64 | ||||
| 2026-04-22 | 13F | Barnes Dennig Private Wealth Management LLC | 78 | 0,00 | 6 | 0,00 | ||||
| 2026-01-23 | 13F | Westside Investment Management, Inc. | 5.250 | 0,00 | 421 | -2,77 | ||||
| 2026-04-07 | 13F | Heartwood Wealth Advisors LLC | 3.946 | 8,14 | 311 | 6,53 | ||||
| 2026-04-30 | 13F | Roman Butler Fullerton & Co | 3.269 | -1,83 | 272 | -1,81 | ||||
| 2026-04-21 | 13F | Nemes Rush Group LLC | 366 | 0,00 | 29 | -3,45 | ||||
| 2026-02-17 | 13F | Maripau Wealth Management Llc | 6.395 | 8,15 | 506 | 3,48 | ||||
| 2026-04-21 | 13F | Pinnacle Associates Ltd | 5.597 | -7,35 | 441 | -8,71 | ||||
| 2025-11-14 | 13F | Wolverine Trading, Llc | 0 | -100,00 | 0 | |||||
| 2025-11-05 | 13F | B.O.S.S. Retirement Advisors, LLC | 0 | -100,00 | 0 | |||||
| 2026-04-08 | 13F | Evanson Asset Management, LLC | 3.000 | 0,00 | 236 | -1,26 | ||||
| 2026-02-12 | 13F | Principal Securities, Inc. | 30.842 | 1,43 | 2.462 | -2,11 | ||||
| 2026-01-20 | 13F | Sovran Advisors, LLC | 25.020 | -10,64 | 2.087 | -8,55 | ||||
| 2026-02-17 | 13F | Bank Of America Corp /de/ | 552.017 | 22,01 | 44.073 | 17,75 | ||||
| 2026-04-27 | 13F | Baer Investment Advisory LLC | 431.977 | 34.027 | ||||||
| 2026-02-18 | 13F | EP Wealth Advisors, Inc. | 0 | -100,00 | 0 | |||||
| 2026-04-15 | 13F | Valley National Advisers Inc | 40.791 | 1,99 | 3 | 0,00 | ||||
| 2026-04-17 | 13F | United Advisor Group, LLC | 25.050 | 13,29 | 1.973 | 11,78 | ||||
| 2026-04-20 | 13F | City State Bank | 2.148 | 0,00 | 169 | -1,17 | ||||
| 2026-02-11 | 13F | Truepoint, Inc. | 9.680 | 1,55 | 773 | -2,03 | ||||
| 2026-02-11 | 13F | Cerity Partners LLC | 5.651 | -14,42 | 451 | -17,40 | ||||
| 2026-01-28 | 13F | EPG Wealth Management LLC | 48 | 0,00 | 4 | 0,00 | ||||
| 2026-02-17 | 13F | Royal Bank Of Canada | 270.303 | -13,83 | 21.581 | -16,84 | ||||
| 2026-04-28 | 13F | Woodard & Co Asset Management Group Inc /adv | 1 | 0,00 | 0 | |||||
| 2026-04-17 | 13F | Ambassador Advisors, LLC | 22.310 | 63,19 | 1.757 | 61,04 | ||||
| 2026-01-21 | 13F | Snider Financial Group | 0 | -100,00 | 0 | |||||
| 2026-01-21 | 13F | Hrc Wealth Management, Llc | 11.642 | 2,05 | 930 | -1,48 | ||||
| 2026-01-27 | 13F | Vantagepoint Investment Advisers Llc | 3.080.936 | -1,17 | 245.982 | -4,62 | ||||
| 2026-01-27 | 13F | Fortitude Financial, LLC | 0 | -100,00 | 0 | |||||
| 2025-11-04 | 13F | Pineridge Advisors LLC | 0 | -100,00 | 0 | |||||
| 2026-04-16 | 13F | Clark Asset Management, LLC | 2.625 | 0,00 | 207 | -1,44 | ||||
| 2026-02-13 | 13F | Mariner, LLC | 450.978 | 24,66 | 36.006 | 20,31 | ||||
| 2026-01-23 | 13F | Bouvel Investment Partners, LLC | 0 | -100,00 | 0 | |||||
| 2026-04-29 | 13F | Envestnet Portfolio Solutions, Inc. | 0 | -100,00 | 0 | |||||
| 2026-02-13 | 13F | MAI Capital Management | 7.412 | 65,52 | 592 | 59,73 | ||||
| 2026-04-20 | 13F | Davis Investment Partners, LLC | 4.800 | 0,00 | 378 | -2,33 | ||||
| 2026-04-28 | 13F | Belpointe Asset Management LLC | 10.429 | 3,10 | 822 | 1,73 | ||||
| 2026-04-23 | 13F | American National Bank | 2.512 | 0,00 | 198 | -1,50 | ||||
| 2026-02-14 | 13F | Rockefeller Capital Management L.P. | 867 | -64,48 | 69 | -65,67 | ||||
| 2026-04-23 | 13F | Caliber Wealth Management, LLC / KS | 31.182 | -3,54 | 2.456 | -4,81 | ||||
| 2026-04-07 | 13F | CoreCap Advisors, LLC | 0 | -100,00 | 0 | -100,00 | ||||
| 2026-04-13 | 13F | IFP Advisors, Inc | 6.373 | 2,07 | 502 | 0,80 | ||||
| 2026-01-29 | 13F | UBS Group AG | 433.109 | -6,81 | 34.579 | -10,06 | ||||
| 2026-04-22 | 13F | AtlasMark Financial, Inc | 9.000 | 0,00 | 719 | 0,00 | ||||
| 2026-04-30 | 13F | Cambridge Investment Research Advisors, Inc. | 134.237 | 7,62 | 11 | 11,11 | ||||
| 2026-02-06 | 13F | HighTower Advisors, LLC | 30.424 | -0,11 | 2.429 | -3,57 | ||||
| 2025-11-13 | 13F | Renaissance Technologies Llc | 0 | -100,00 | 0 | |||||
| 2026-02-10 | 13F/A | Northwestern Mutual Wealth Management Co | 841.443 | 4,53 | 67.181 | 0,88 | ||||
| 2026-04-24 | 13F | Capital Asset Advisory Services LLC | 17.934 | -0,71 | 1.574 | 5,07 | ||||
| 2026-02-17 | 13F | High Falls Advisors, Inc | 3.503 | 0,00 | 280 | -3,46 | ||||
| 2026-04-22 | 13F | DDFG, Inc | 77.581 | 53,76 | 6.111 | 51,71 | ||||
| 2026-04-23 | 13F | J.w. Cole Advisors, Inc. | 0 | -100,00 | 0 | |||||
| 2026-04-20 | 13F | Morton Brown Family Wealth, LLC | 5 | 0,00 | 0 | |||||
| 2026-02-10 | 13F | Tandem Financial, LLC | 65.401 | -30,58 | 4.940 | -36,63 | ||||
| 2026-02-17 | 13F | North Capital, Inc. | 0 | -100,00 | 0 | |||||
| 2026-02-10 | 13F | WealthTrak Capital Management LLC | 5.780 | -0,46 | 461 | -3,96 | ||||
| 2026-04-27 | 13F | Pensionmark Financial Group, Llc | 9.149 | 2,41 | 721 | 0,98 | ||||
| 2026-02-09 | 13F | Hartland & Co., LLC | 3.890 | 0,00 | 311 | -3,43 | ||||
| 2026-01-26 | 13F | Asset Dedication, LLC | 48 | 0,00 | 4 | 0,00 | ||||
| 2026-04-28 | 13F | Stephens Inc /ar/ | 3.300 | 23,27 | 260 | 21,60 | ||||
| 2026-04-08 | 13F | Asempa Wealth Advisors | 2.795 | 0,07 | 223 | 0,00 | ||||
| 2026-02-09 | 13F | Summit Asset Management, LLC | 57.796 | -1,67 | 4.614 | -5,10 | ||||
| 2026-01-30 | 13F | Archer Investment Corp | 180 | -47,37 | 14 | -50,00 | ||||
| 2026-04-21 | 13F | Trilogy Capital Inc. | 3.652 | -18,63 | 288 | -19,83 | ||||
| 2026-04-08 | 13F | WealthCare Investment Partners, LLC | 4.090 | 0,15 | 328 | -0,30 | ||||
| 2026-04-22 | 13F | Onyx Bridge Wealth Group LLC | 7.979 | -7,12 | 629 | -8,32 | ||||
| 2026-04-17 | 13F | Verde Capital Management | 77.518 | 10,97 | 6.106 | 9,49 | ||||
| 2025-11-05 | 13F | Burt Wealth Advisors | 9.504 | 0,00 | 786 | 3,15 | ||||
| 2026-04-13 | 13F | Creative Financial Designs Inc /adv | 152.746 | -0,46 | 12.032 | -1,80 | ||||
| 2026-04-20 | 13F | Kestra Private Wealth Services, Llc | 11.366 | 0,04 | 895 | -1,32 | ||||
| 2026-02-02 | 13F | Blalock Williams, Llc | 4.700 | 0,00 | 375 | -3,35 | ||||
| 2026-02-03 | 13F | LaFleur & Godfrey LLC | 11.153 | 14,66 | 890 | 10,70 | ||||
| 2026-04-17 | 13F | AdvisorNet Financial, Inc | 11.951 | -2,70 | 941 | -3,98 | ||||
| 2026-01-26 | 13F | AE Wealth Management LLC | 21.167 | 1.416,26 | 1.690 | 1.368,70 | ||||
| 2026-02-17 | 13F | Ameriprise Financial Inc | 809.912 | -44,00 | 64.686 | -45,94 | ||||
| 2026-04-20 | 13F | Breakwater Capital Group | 2.643 | 208 | ||||||
| 2026-04-22 | 13F | Spire Wealth Management | 458 | 367,35 | 36 | 414,29 | ||||
| 2026-04-09 | 13F | Nelson, Van Denburg & Campbell Wealth Management Group, LLC | 446.106 | -28,71 | 35.140 | -29,66 | ||||
| 2026-02-19 | 13F | CI Private Wealth, LLC | 9.486 | -8,56 | 215 | -74,94 | ||||
| 2026-02-11 | 13F | Greykasell Wealth Strategies, Inc. | 731 | 0,00 | 58 | -3,33 | ||||
| 2026-02-13 | 13F | Gts Securities Llc | 6.125 | 489 | ||||||
| 2026-02-13 | 13F | Wells Fargo & Company/mn | 419.448 | -1,23 | 33.489 | -4,68 | ||||
| 2026-04-20 | 13F | Triangle Securities Wealth Management | 4.679 | 20,44 | 369 | 18,71 | ||||
| 2026-04-27 | 13F | Tanglewood Legacy Advisors, LLC | 2.094 | 0,00 | 165 | -1,80 | ||||
| 2026-04-28 | 13F | Bfsg, Llc | 100 | 0,00 | 8 | 0,00 | ||||
| 2026-02-10 | 13F | PCA Investment Advisory Services Inc. | 21.085 | 0,63 | 1.683 | -2,89 | ||||
| 2026-02-11 | 13F | Jpmorgan Chase & Co | 73.187 | -0,64 | 5.843 | -4,10 | ||||
| 2026-02-17 | 13F | Cetera Investment Advisers | 916.927 | 7,62 | 73.208 | 3,86 | ||||
| 2026-02-02 | 13F | Mutual Advisors, LLC | 8.375 | 0,01 | 669 | -3,47 | ||||
| 2026-02-17 | 13F | Regal Investment Advisors LLC | 8.240 | -41,46 | 658 | -43,56 | ||||
| 2026-02-11 | 13F | O'shaughnessy Asset Management, Llc | 2.381 | 137,15 | 190 | 128,92 | ||||
| 2026-02-17 | 13F | Susquehanna International Group, Llp | 3.591 | -87,31 | 287 | -87,78 | ||||
| 2026-02-17 | 13F | Mercer Global Advisors Inc /adv | 27.564 | -21,34 | 2.201 | -24,11 | ||||
| 2026-02-13 | 13F | Mml Investors Services, Llc | 95.115 | 10,57 | 7.594 | 6,72 | ||||
| 2026-02-12 | 13F | CIBC Private Wealth Group, LLC | 16.717 | 183,00 | 1.335 | 173,36 | ||||
| 2026-02-13 | 13F | Wilkerson Advisory Group LLC | 11.035 | 881 | ||||||
| 2026-04-23 | 13F | Marmo Financial Group, LLC | 38.935 | -1,51 | 3.067 | -2,82 | ||||
| 2026-02-18 | 13F/A | Pinnacle Financial Partners, Inc. | 4.870 | 389 | ||||||
| 2026-04-22 | 13F | Jim Saulnier & Associates, Llc | 17.816 | -0,34 | 1.403 | -1,68 | ||||
| 2026-02-09 | 13F | Huntington National Bank | 113 | 48,68 | ||||||
| 2026-02-13 | 13F | Bay Colony Advisory Group, Inc d/b/a Bay Colony Advisors | 5.965 | -2,04 | 476 | -5,37 | ||||
| 2026-01-23 | 13F | Kellett Schaffner Wealth Advisors LLC | 53.986 | 1,96 | 4.310 | -1,60 | ||||
| 2026-04-24 | 13F | Michels Family Financial, LLC | 8.047 | -1,71 | 634 | -3,06 | ||||
| 2026-02-17 | 13F | Wealth Watch Advisors, INC | 230 | 0,00 | 18 | -5,26 | ||||
| 2026-02-09 | 13F | Harbour Investments, Inc. | 11.652 | 16,11 | 930 | 12,05 | ||||
| 2026-02-12 | 13F | Summit Financial, LLC | 0 | -100,00 | 0 | |||||
| 2026-02-05 | 13F | Atria Investments Llc | 0 | -100,00 | 0 | |||||
| 2026-04-14 | 13F | Focus Financial Network, Inc. | 19.446 | -14,90 | 1.532 | -16,06 | ||||
| 2026-04-24 | 13F | KPP Advisory Services LLC | 13.708 | -8,14 | 1.080 | -9,40 | ||||
| 2026-05-01 | 13F | Valmark Advisers, Inc. | 3.158 | 1,97 | 249 | 0,40 | ||||
| 2026-02-04 | 13F | Atlantic Union Bankshares Corp | 38 | 0,00 | 3 | 0,00 | ||||
| 2026-02-11 | 13F | Meeder Advisory Services, Inc. | 6.079 | 485 | ||||||
| 2026-02-06 | 13F | Vestmark Advisory Solutions, Inc. | 126.391 | 77,49 | 10.091 | 71,30 | ||||
| 2026-02-17 | 13F | Creative Planning | 48.614 | 20,34 | 3.881 | 16,16 | ||||
| 2026-04-17 | 13F | Willner & Heller, Llc | 9.794 | -3,79 | 771 | -5,05 | ||||
| 2026-04-29 | 13F | CFS Investment Advisory Services, LLC | 3.350 | -44,65 | 292 | -39,75 | ||||
| 2026-02-13 | 13F | Jacobi Capital Management LLC | 3.719 | 5,65 | 297 | 1,72 | ||||
| 2025-11-19 | 13F | Sunbelt Securities, Inc. | 0 | -100,00 | 0 | |||||
| 2026-02-13 | 13F | Aptus Capital Advisors, LLC | 1.567 | 467,75 | 125 | 468,18 | ||||
| 2026-02-13 | 13F | Integrated Wealth Concepts LLC | 3.200 | -88,27 | 255 | -88,69 | ||||
| 2026-04-22 | 13F | Pinnacle Bancorp, Inc. | 1.751 | -20,95 | 138 | -22,16 | ||||
| 2026-02-11 | 13F | Capital Analysts, Inc. | 6.555 | -40,59 | 1 | |||||
| 2026-02-06 | 13F | Lloyd Advisory Services, LLC. | 19.184 | 1.532 | ||||||
| 2026-02-17 | 13F | Two Sigma Investments, Lp | 37.700 | 3.010 | ||||||
| 2026-04-23 | 13F | Summit Wealth Group Llc / Co | 32.050 | 0,11 | 2.525 | -1,25 | ||||
| 2026-04-15 | 13F | Scott Capital Advisors, LLC | 114.967 | 3,02 | 9.539 | 7,06 | ||||
| 2026-04-14 | 13F | Opal Wealth Advisors, LLC | 2.572 | 0,00 | 203 | -1,46 | ||||
| 2026-04-29 | 13F | Skopos Labs, Inc. | 5.079 | 50,76 | 400 | 47,06 | ||||
| 2025-11-03 | 13F | Foundations Investment Advisors, LLC | 0 | -100,00 | 0 | |||||
| 2026-04-08 | 13F | Eclectic Associates Inc /adv | 248.475 | 23,96 | 19.572 | 22,30 | ||||
| 2026-04-21 | 13F | Mayfair Advisory Group, LLC | 6.164 | -18,00 | 486 | -19,97 | ||||
| 2026-05-01 | 13F | Monetary Solutions, Ltd | 4.029 | 0,02 | 317 | -1,25 | ||||
| 2026-04-24 | 13F | Prospect Financial Services LLC | 37.922 | 0,77 | 2.987 | -0,57 | ||||
| 2026-02-17 | 13F | Fmr Llc | 12.453 | -0,80 | 994 | -4,24 | ||||
| 2026-04-15 | 13F | Stanich Group LLC | 17.647 | -0,70 | 1.390 | -2,04 | ||||
| 2026-02-11 | 13F | Franklin Resources Inc | 0 | -100,00 | 0 | -100,00 | ||||
| 2026-02-10 | 13F | TAGStone Capital, Inc. | 3.753 | 0,11 | 300 | -3,55 | ||||
| 2026-02-10 | 13F | Savant Capital, LLC | 9.245 | -31,48 | 738 | -33,87 | ||||
| 2026-02-11 | 13F | Gwn Securities Inc. | 5.091 | 6,33 | 406 | 2,53 | ||||
| 2026-04-22 | 13F | Networth Advisors, LLC | 592 | 0,51 | 47 | -2,13 | ||||
| 2026-04-16 | 13F | Everstar Asset Management, LLC | 4.580 | -15,96 | 361 | -17,24 | ||||
| 2026-05-01 | 13F | Concord Wealth Partners | 0 | -100,00 | 0 | |||||
| 2026-02-10 | 13F | Basepoint Wealth LLC | 589 | 47 | ||||||
| 2026-01-28 | 13F | Financial Perspectives, Inc | 1.563 | 0,26 | 125 | -3,12 | ||||
| 2026-04-17 | 13F | Richards, Merrill & Peterson, Inc. | 510 | 0,00 | 40 | 0,00 | ||||
| 2026-04-24 | 13F | Courage Miller Partners, LLC | 22.107 | -0,62 | 1.741 | -1,97 | ||||
| 2026-04-22 | 13F | Janney Montgomery Scott LLC | 50.026 | 1,79 | 4 | 0,00 | ||||
| 2026-04-27 | 13F | Tsfg, Llc | 517 | 0,00 | 0 | |||||
| 2026-04-07 | 13F | Park Avenue Securities Llc | 11.141 | -0,38 | 1 | |||||
| 2026-04-28 | 13F | Bogart Wealth, LLC | 2.815 | -9,51 | 222 | -10,89 | ||||
| 2026-01-29 | 13F | Virtus Wealth Solutions LLC | 53.300 | -0,21 | 4.255 | -3,69 | ||||
| 2026-05-01 | 13F | Thrivent Financial For Lutherans | 4.232 | -54,17 | 0 | |||||
| 2026-01-06 | 13F | Sanctuary Advisors, LLC | 0 | -100,00 | 0 | |||||
| 2026-04-30 | 13F | Granite Investment Partners, LLC | 2.210 | 0,05 | 174 | -1,14 | ||||
| 2026-04-20 | 13F | SILVER OAK SECURITIES, Inc | 15.738 | -0,79 | 1.240 | -3,28 | ||||
| 2026-02-06 | 13F | Global Retirement Partners, LLC | 12.292 | -41,65 | 981 | -43,69 | ||||
| 2026-04-21 | 13F | Falcon Wealth Planning | 7.831 | -1,88 | 617 | -3,30 | ||||
| 2026-02-12 | 13F | StoneX Group Inc. | 3.249 | -5,28 | 259 | -8,48 | ||||
| 2026-04-15 | 13F | DAVENPORT & Co LLC | 17.395 | 81,44 | 1.370 | 79,08 | ||||
| 2026-04-17 | 13F | Ignite Planners, LLC | 31.833 | 0,46 | 2.501 | -3,62 | ||||
| 2026-02-13 | 13F | Centaurus Financial, Inc. | 1.471 | 12,89 | 0 | |||||
| 2026-04-10 | 13F | Abound Wealth Management | 87 | 7 | ||||||
| 2026-04-17 | 13F | James J. Burns & Company, LLC | 43.436 | -2,53 | 3.421 | -3,85 | ||||
| 2026-04-30 | 13F | Kestra Advisory Services, LLC | 71.521 | 18,79 | 5.634 | 17,18 | ||||
| 2026-02-13 | 13F | Ausdal Financial Partners, Inc. | 21.483 | -1,61 | 1.715 | -5,04 | ||||
| 2026-04-14 | 13F | FC Advisory LLC | 2.637 | 0,00 | 208 | -1,43 | ||||
| 2025-11-07 | 13F | Beacon Capital Management, LLC | 0 | -100,00 | 0 | |||||
| 2026-02-12 | 13F | Sfam, Llc | 759 | 61 | ||||||
| 2026-02-17 | 13F | MGB Wealth Management, LLC | 1.654 | 27,23 | 132 | 23,36 | ||||
| 2026-04-29 | 13F | Axxcess Wealth Management, Llc | 0 | -100,00 | 0 | |||||
| 2026-02-17 | 13F | Tower Research Capital LLC (TRC) | 8.676 | 693 | ||||||
| 2026-04-24 | 13F | Bayban | 220 | 0,00 | 17 | 0,00 | ||||
| 2026-02-09 | 13F | Avalon Trust Co | 1.200 | -40,00 | 96 | -42,42 | ||||
| 2026-04-28 | 13F | Stratos Wealth Partners, LTD. | 17.374 | 221,26 | 1.369 | 217,40 | ||||
| 2026-02-09 | 13F | Financial Advisory Corp /ut/ /adv | 46.606 | 6,07 | 4 | 0,00 | ||||
| 2026-01-26 | 13F | Cwm, Llc | 196.225 | 1,97 | 16 | 0,00 | ||||
| 2026-02-13 | 13F | Glen Eagle Advisors, LLC | 772 | 12,54 | 62 | 8,93 | ||||
| 2026-01-26 | 13F | Main Street Group, LTD | 0 | -100,00 | 0 | |||||
| 2026-04-16 | 13F | Evolve Private Wealth, Llc | 6.987 | 0,00 | 550 | -1,26 | ||||
| 2026-04-28 | 13F | Golden State Equity Partners | 118 | 9 | ||||||
| 2026-02-13 | 13F | Colony Group, LLC | 7.856 | 3,22 | 627 | -0,32 | ||||
| 2026-04-16 | 13F | OxenFree Capital LLC | 110.463 | 20,28 | 9.429 | 28,60 | ||||
| 2026-04-24 | 13F | rebel Financial LLC | 4.588 | -0,43 | 361 | -1,63 | ||||
| 2026-02-12 | 13F | Jane Street Group, Llc | 19.070 | 1.523 | ||||||
| 2026-02-13 | 13F | Morgan Stanley | 1.149.360 | 10,01 | 91.765 | 6,17 | ||||
| 2025-11-10 | 13F | Rosenberg Matthew Hamilton | 0 | -100,00 | 0 | |||||
| 2026-02-03 | 13F | Ponta Wealth Partners, LLC | 9.774 | 780 | ||||||
| 2026-01-27 | 13F | Bonfire Financial | 20.255 | -2,54 | 1.617 | -5,93 | ||||
| 2026-04-20 | 13F | YANKCOM Partnership | 300 | 0,00 | 24 | 0,00 | ||||
| 2026-02-17 | 13F | Signature Equity Partners, LLC | 5 | 0 | ||||||
| 2026-02-18 | 13F | Caitlin John, LLC | 102 | 0,00 | 8 | 0,00 | ||||
| 2026-01-26 | 13F | Milestones Private Investment Advisors LLC | 2.884 | 0,00 | 230 | -3,36 | ||||
| 2026-02-12 | 13F | Richwood Investment Advisors, LLC | 3.725 | -0,67 | 308 | -0,65 | ||||
| 2026-02-26 | 13F | TD Capital Management LLC | 723 | 0,14 | 58 | -3,39 | ||||
| 2026-02-13 | 13F | Change Path, LLC | 2.840 | -8,65 | 227 | -12,06 | ||||
| 2026-05-01 | 13F | Kaizen Financial Strategies | 5.456 | -1,48 | 467 | 5,66 | ||||
| 2026-04-08 | 13F | Fermata Advisors, LLC | 5.378 | -2,15 | 424 | -3,42 | ||||
| 2026-01-29 | 13F | D.a. Davidson & Co. | 4.792 | 38,82 | 383 | 34,04 | ||||
| 2026-02-05 | 13F | Integrated Investment Consultants, LLC | 124.994 | -1,96 | 9.980 | -3,13 | ||||
| 2026-01-20 | 13F | C2P Capital Advisory Group, LLC d.b.a. Prosperity Capital Advisors | 0 | -100,00 | 0 | |||||
| 2026-02-12 | 13F | Kovack Advisors, Inc. | 3.541 | 203 | ||||||
| 2026-04-15 | 13F | Merit Financial Group, LLC | 54.568 | 11,96 | 4.298 | 10,46 | ||||
| 2026-02-18 | 13F | GWM Advisors LLC | 66.430 | 0,63 | 5.304 | -2,89 | ||||
| 2026-05-01 | 13F | Cosner Financial Group, LLC | 273.465 | 1,12 | 21.541 | -0,24 | ||||
| 2026-04-29 | 13F | Marino, Stram & Associates Llc | 70.492 | 11,12 | 5.553 | 9,64 | ||||
| 2026-02-05 | 13F | Allworth Financial LP | 4.337 | 23,60 | 346 | 19,31 | ||||
| 2026-04-09 | 13F | FCG Investment Co | 3.390 | 267 | ||||||
| 2026-02-12 | 13F | Brinker Capital Investments, LLC | 14.060 | 96,70 | 1.123 | 89,85 | ||||
| 2026-04-14 | 13F | American State Bank (Iowa) | 0 | -100,00 | 0 | |||||
| 2026-02-11 | 13F | Premier Private Wealth Management LLC | 45.544 | 3.764 | ||||||
| 2026-02-11 | 13F | Liberty Square Wealth Partners Llc | 21.262 | 0,03 | 1.698 | -3,47 | ||||
| 2026-02-13 | 13F | Capital Square, LLC | 29.652 | -1,44 | 2.367 | -4,86 | ||||
| 2026-04-16 | 13F | Capital Advisors, Ltd. LLC | 453 | 0,00 | 0 | |||||
| 2026-04-14 | 13F | Prospera Financial Services Inc | 6.151 | -3,09 | 485 | -4,35 | ||||
| 2026-04-14 | 13F | Wealthcare Advisory Partners LLC | 11.090 | 116,64 | 874 | 113,97 | ||||
| 2026-04-03 | 13F | Ridgewood Investments LLC | 8.245 | 2,36 | 649 | -2,55 | ||||
| 2026-04-15 | 13F | Steinberganna Wealth Management | 52.755 | -5,71 | 4.155 | -6,98 | ||||
| 2026-01-27 | 13F | PFG Advisors | 9.948 | -74,13 | 794 | -75,04 | ||||
| 2026-04-24 | 13F | Key FInancial Inc | 96 | 0,00 | 8 | 0,00 | ||||
| 2026-04-10 | 13F | Quaker Wealth Management, LLC | 338 | 0,30 | 27 | 0,00 | ||||
| 2026-04-22 | 13F | Asset Allocation Strategies LLC | 5.955 | -6,89 | 469 | -8,04 | ||||
| 2026-02-09 | 13F | Studio Investment Management Llc | 3.153 | 16,26 | 252 | 12,05 | ||||
| 2026-04-22 | 13F | Old Point Trust & Financial Services N A | 36.941 | 15,02 | 2.910 | 13,46 | ||||
| 2026-02-13 | 13F | Arete Wealth Advisors, LLC | 5.530 | -76,87 | 0 | -100,00 | ||||
| 2025-11-14 | 13F | Full Sail Capital, LLC | 11.520 | 0,00 | 953 | 3,14 | ||||
| 2026-04-27 | 13F | Mosley Wealth Management | 2.716 | 0,04 | 225 | -0,88 | ||||
| 2026-02-05 | 13F | BlueChip Wealth Advisors LLC | 5.563 | 107,42 | 444 | 100,90 | ||||
| 2026-04-27 | 13F | Revisor Wealth Management LLC | 5.067 | 13,58 | 399 | 7,55 | ||||
| 2026-04-27 | 13F | Denver Wealth Management, Inc. | 59.594 | 12,27 | 4.694 | 10,76 | ||||
| 2026-01-07 | 13F | Sagespring Wealth Partners, Llc | 22.451 | 0,38 | 1.793 | -3,14 | ||||
| 2026-02-10 | 13F | Godfrey Financial Associates, Inc. | 313 | 25 | ||||||
| 2026-04-14 | 13F | Nbc Securities, Inc. | 358 | 0,00 | 28 | 0,00 | ||||
| 2026-04-29 | 13F | IAG Wealth Partners, LLC | 229.955 | 2,77 | 18.114 | 1,39 | ||||
| 2026-04-15 | 13F | Trust Co Of Toledo Na /oh/ | 63 | 0,00 | 5 | -20,00 | ||||
| 2026-02-10 | 13F | Operose Advisors LLC | 888 | 0,00 | 71 | -4,11 | ||||
| 2026-04-13 | 13F | LexAurum Advisors, LLC | 4.356 | -15,53 | 343 | -19,48 | ||||
| 2026-04-30 | 13F | Ibex Wealth Advisors | 8.383 | 660 | ||||||
| 2026-04-21 | 13F | Keystone Financial Group, Inc. | 40 | 0,00 | 3 | 0,00 | ||||
| 2026-04-08 | 13F | Accel Wealth Management | 33.867 | 16,98 | 2.668 | 15,40 | ||||
| 2026-02-11 | 13F | Landing Point Financial Group, LLC | 2.720 | 0,00 | 217 | -3,56 | ||||
| 2026-02-04 | 13F | Ameritas Advisory Services, LLC | 0 | -100,00 | 0 | |||||
| 2026-02-09 | 13F | Perissos Private Wealth Management, LLC | 18.148 | 0,03 | 1.449 | -3,47 | ||||
| 2026-04-30 | 13F | LRI Investments, LLC | 29.730 | 0,00 | 2.342 | -1,35 | ||||
| 2026-04-09 | 13F | Key Client Fiduciary Advisors, LLC | 9.825 | 1,07 | 774 | -0,39 | ||||
| 2026-02-10 | 13F | MidAtlantic Capital Management, Inc. | 7.113 | -0,59 | 568 | -4,06 | ||||
| 2026-01-21 | 13F | Leo Wealth, LLC | 36.361 | 2.863 | ||||||
| 2026-01-26 | 13F | Equity Wealth Partners, LLC | 17.776 | -0,29 | 1.419 | -3,73 | ||||
| 2026-02-11 | 13F | Employees' Retirement Fund of the City of Fort Worth | 55.500 | -50,62 | 4.431 | -52,34 | ||||
| 2026-02-17 | 13F | Raymond James Financial Inc | 967.995 | -3,51 | 77.285 | -6,88 | ||||
| 2026-04-30 | 13F | Cedar Mountain Advisors, LLC | 121 | 0,00 | 10 | 0,00 | ||||
| 2026-02-13 | 13F | Granville Capital, Inc. | 133.754 | 10.679 | ||||||
| 2026-02-12 | 13F | Betterment LLC | 27.067 | 7,10 | 2 | 0,00 | ||||
| 2026-04-30 | 13F | Madison Wealth Partners, Inc | 10.695 | 12,63 | 842 | 11,08 | ||||
| 2026-01-30 | 13F | Us Bancorp \de\ | 4.335 | 0,98 | 346 | -2,54 | ||||
| 2026-01-30 | 13F | Carrera Capital Advisors | 4.936 | 394 | ||||||
| 2026-02-11 | 13F | LPL Financial LLC | 2.448.326 | 6,99 | 195.474 | 3,26 | ||||
| 2026-04-17 | 13F | Provident Wealth Management, LLC | 1 | 0,00 | 0 | |||||
| 2026-04-27 | 13F | Victory Financial Group, Llc | 431.977 | 2,54 | 34.027 | 1,16 | ||||
| 2026-04-29 | 13F | BEAM Asset Management, LLC | 260.379 | 530,06 | 20.510 | 521,70 | ||||
| 2026-01-27 | 13F | BankPlus Trust Department | 1.752 | 0,00 | 140 | -3,47 | ||||
| 2026-02-11 | 13F | Clearbridge Investments, LLC | 7.420 | -1,83 | 592 | -5,28 | ||||
| 2025-11-12 | 13F | Transce3nd, LLC | 0 | -100,00 | 0 | |||||
| 2026-01-26 | 13F | Elevation Capital Advisory, LLC | 0 | -100,00 | 0 | |||||
| 2026-02-17 | 13F | Equitable Holdings, Inc. | 208.688 | -2,71 | 16.662 | -6,11 | ||||
| 2026-02-17 | 13F | Cresset Asset Management, LLC | 11.114 | 0,00 | 887 | -3,48 | ||||
| 2026-01-23 | 13F | Assetmark, Inc | 6.823 | -1,36 | 545 | -4,90 | ||||
| 2026-04-24 | 13F | Innova Wealth Partners | 3.170 | 250 | ||||||
| 2026-04-24 | 13F | Oakworth Capital, Inc. | 420 | 0,00 | 33 | 0,00 | ||||
| 2026-04-15 | 13F | LongView Wealth Management | 4.015 | 3,03 | 343 | 6,52 | ||||
| 2026-04-23 | 13F | Oppenheimer & Co Inc | 80.219 | 0,79 | 6.319 | -0,57 | ||||
| 2026-02-09 | 13F | Delta Asset Management Llc/tn | 3.360 | 0,00 | 268 | -3,25 | ||||
| 2026-02-11 | 13F | RAM Investment Partners, LLC | 2.865 | 0,00 | 229 | -3,80 | ||||
| 2026-02-17 | 13F | Jones Financial Companies Lllp | 24.701 | 28,84 | 1.972 | 25,29 | ||||
| 2026-02-09 | 13F | Keating Financial Advisory Services, Inc. | 3.405 | 272 | ||||||
| 2026-04-27 | 13F | Sound Income Strategies, LLC | 594 | 0,00 | 47 | -4,08 | ||||
| 2026-04-13 | 13F | Neumann Capital Management, LLC | 15.076 | 0,00 | 1.188 | -1,33 | ||||
| 2026-04-27 | 13F | Integrity Wealth Partners, LLC | 11.720 | 923 | ||||||
| 2026-02-03 | 13F | We Are One Seven, LLC | 106.179 | 7,77 | 8.477 | 4,00 | ||||
| 2026-04-10 | 13F | Cerro Pacific Wealth Advisors LLC | 58.311 | 24,01 | 4.593 | 22,35 | ||||
| 2026-02-17 | 13F | Advisory Services Network, LLC | 7.658 | 39,31 | 611 | 34,58 | ||||
| 2026-04-07 | 13F | Farther Finance Advisors, LLC | 17.762 | -6,79 | 1.417 | -6,90 | ||||
| 2026-04-13 | 13F | Massmutual Trust Co Fsb/adv | 21 | 2 | ||||||
| 2026-04-16 | 13F | Allegheny Financial Group LTD | 220.414 | 36,25 | 17.362 | 34,42 | ||||
| 2026-04-10 | 13F | First Bank & Trust | 18.199 | 38,47 | 1.434 | 36,61 | ||||
| 2026-02-13 | 13F | Ieq Capital, Llc | 14.526 | 0,00 | 1.160 | -3,50 | ||||
| 2026-03-09 | 13F | Lifetime Wealth Management P.C. | 113 | 2.223 | ||||||
| 2026-02-19 | 13F | Atomi Financial Group, Inc. | 9.339 | -0,16 | 746 | -3,62 | ||||
| 2026-02-06 | 13F | Larson Financial Group LLC | 3.292 | -21,62 | 263 | -24,50 | ||||
| 2026-02-04 | 13F | Nwam Llc | 51.942 | 0,02 | 4.318 | 0,61 | ||||
| 2026-02-06 | 13F | Rockport Wealth LLC | 402.303 | -0,46 | 32.120 | -3,94 | ||||
| 2026-02-10 | 13F | Goldman Sachs Group Inc | 22.638 | 1,32 | 1.807 | -2,22 | ||||
| 2026-01-14 | 13F | ORG Partners LLC | 151 | 0,00 | 12 | 0,00 | ||||
| 2026-04-20 | 13F | Provenance Wealth Advisors, LLC | 1.034 | -31,11 | 81 | -31,93 | ||||
| 2026-04-21 | 13F | GHP Investment Advisors, Inc. | 26.782 | -0,65 | 2.110 | -2,00 | ||||
| 2026-05-01 | 13F | International Assets Investment Management, Llc | 497 | -86,42 | 40 | -86,64 | ||||
| 2026-02-03 | 13F | Buck Wealth Strategies, LLC | 9.286 | -50,08 | 741 | -51,82 | ||||
| 2025-11-13 | 13F | Sage Financial Group Inc | 0 | -100,00 | 0 | |||||
| 2026-04-17 | 13F | High Net Worth Advisory Group LLC | 4.500 | 0,00 | 354 | -1,39 | ||||
| 2025-11-12 | 13F | Creekmur Asset Management LLC | 0 | -100,00 | 0 | |||||
| 2026-04-15 | 13F | Silverlake Wealth Management Llc | 10.797 | 87,32 | 850 | 84,78 | ||||
| 2026-04-29 | 13F | Nilsine Partners, LLC | 19.445 | -12,47 | 1.699 | -4,17 | ||||
| 2026-04-07 | 13F | Central Pacific Bank - Trust Division | 18 | 0,00 | 1 | 0,00 | ||||
| 2026-02-03 | 13F | Black Diamond Financial, LLC | 47.435 | -6,57 | 3.787 | -9,83 | ||||
| 2026-04-24 | 13F | Means Investment Co., Inc. | 4.108 | 2,55 | 324 | 1,25 | ||||
| 2026-02-17 | 13F | Cape Investment Advisory, Inc. | 10.700 | 854 | ||||||
| 2026-02-17 | 13F | IHT Wealth Management, LLC | 9.014 | 0,00 | 720 | -3,49 | ||||
| 2026-02-13 | 13F | SRS Capital Advisors, Inc. | 273.141 | 21.808 | ||||||
| 2026-02-13 | 13F | Citigroup Inc | 14.806 | -3,04 | 1.182 | -6,41 | ||||
| 2026-04-08 | 13F | Afg Fiduciary Services Limited Partnership | 6.750 | 0,00 | 544 | 0,00 | ||||
| 2026-01-27 | 13F | Journey Advisory Group, LLC | 4.385 | 0,00 | 350 | -3,31 | ||||
| 2026-04-10 | 13F | Matrix Trust Co | 203.880 | 0,27 | 16 | 0,00 | ||||
| 2026-04-14 | 13F | Nova Wealth Management, Inc. | 10.227 | -53,44 | 806 | -54,08 | ||||
| 2026-02-17 | 13F | Gladstone Institutional Advisory LLC | 6.508 | 14,58 | 520 | 10,66 | ||||
| 2026-04-09 | 13F | Whitaker-Myers Wealth Managers, LTD. | 6.540 | -2,02 | 515 | -3,20 | ||||
| 2026-04-21 | 13F | HF Advisory Group, LLC | 15.166 | -2,66 | 1.195 | -3,94 | ||||
| 2026-02-12 | 13F | Investment Counsel Co Of Nevada | 143 | 11 | ||||||
| 2026-02-10 | 13F | Keyvantage Wealth, Llc | 9.673 | -1,01 | 772 | -4,46 | ||||
| 2026-02-12 | 13F | Compass Capital Management, Inc | 3.840 | 307 | ||||||
| 2026-02-12 | 13F | Commonwealth Equity Services, Llc | 563.087 | -9,73 | 44.957 | 88.049,02 | ||||
| 2026-04-24 | 13F | Private Advisor Group, LLC | 72.096 | -44,27 | 5.679 | -45,02 | ||||
| 2026-04-30 | 13F | Money Concepts Capital Corp | 17.666 | 1,87 | 1.392 | 0,51 | ||||
| 2026-02-17 | 13F | Aqr Capital Management Llc | 2.797 | 10,82 | 223 | 7,21 | ||||
| 2026-02-17 | 13F | Citadel Advisors Llc | 14.079 | 1.124 | ||||||
| 2026-02-14 | 13F | American Trust | 62.488 | -43,75 | 4.989 | -45,71 | ||||
| 2026-02-02 | 13F | Fifth Third Bancorp | 446 | 0,00 | 36 | -2,78 | ||||
| 2026-04-06 | 13F | CX Institutional | 2.064 | -8,14 | 0 | |||||
| 2026-02-12 | 13F | Wood Tarver Financial Group, LLC | 100.267 | 3,74 | 8 | 14,29 | ||||
| 2026-01-26 | 13F | Lansing Street Advisors | 0 | -100,00 | 0 | |||||
| 2026-02-13 | 13F | Transamerica Financial Advisors, Inc. | 61 | 5 | ||||||
| 2026-04-07 | 13F | Orgel Wealth Management, LLC | 291.617 | 0,13 | 22.971 | -1,21 | ||||
| 2026-04-27 | 13F | Truist Financial Corp | 107.603 | 6,15 | 8.476 | 4,72 | ||||
| 2026-01-26 | 13F | Integrated Capital Management, LLC | 0 | -100,00 | 0 | -100,00 | ||||
| 2026-01-23 | 13F | Transcend Wealth Collective, Llc | 5.289 | 0,00 | 422 | -3,43 | ||||
| 2026-02-09 | 13F | Strategic Financial Concepts, LLC | 0 | -100,00 | 0 | -100,00 |