Grundlæggende statistik
| Institutionelle aktier (lange) | 84.264.254 - 82,30% (ex 13D/G) - change of -10,46MM shares -11,04% MRQ |
| Institutionel værdi (lang) | $ 3.119.825 USD ($1000) |
Institutionelt ejerskab og aktionærer
Golar LNG Limited (US:GLNG) har 342 institutionelle ejere og aktionærer, der har indsendt 13D/G- eller 13F-formularer til Securities Exchange Commission (SEC). Disse institutioner har i alt 84,387,521 aktier. Største aktionærer omfatter Naria Inc., Rubric Capital Management LP, BlackRock, Inc., PointState Capital LP, Philosophy Capital Management LLC, Donald Smith & Co., Inc., Wolf Hill Capital Management, LP, Morgan Stanley, State Street Corp, and Luxor Capital Group, LP .
Golar LNG Limited (NasdaqGS:GLNG) institutionel ejerskabsstruktur viser aktuelle positioner i virksomheden efter institutioner og fonde, samt seneste ændringer i positionsstørrelse. Større aktionærer kan omfatte individuelle investorer, investeringsforeninger, hedgefonde eller institutioner. Skema 13D angiver, at investoren besidder (eller besidder) mere end 5 % af virksomheden og har til hensigt (eller har til hensigt at) aktivt at forfølge en ændring i forretningsstrategi. Skema 13G indikerer en passiv investering på over 5%.
The share price as of March 17, 2026 is 46,31 / share. Previously, on March 18, 2025, the share price was 35,04 / share. This represents an increase of 32,16% over that period.

Fondens stemningsscore
Fund Sentiment Score (fka Ownership Accumulation Score) finder de aktier, der bliver mest købt af fonde. Det er resultatet af en sofistikeret, multi-faktor kvantitativ model, der identificerer virksomheder med de højeste niveauer af institutionel akkumulering. Scoringsmodellen bruger en kombination af den samlede stigning i oplyste ejere, ændringerne i porteføljeallokeringer i disse ejere og andre målinger. Tallet går fra 0 til 100, hvor højere tal indikerer et højere niveau af akkumulering for sine jævnaldrende, og 50 er gennemsnittet.
Opdateringsfrekvens: Dagligt
Se Ownership Explorer, som giver en liste over højest rangerende virksomheder.
AI+ Ask Fintel’s AI assistant about Golar LNG Limited.
Select a question to share a public post with an AI-crafted answer.
Thinking of good questions…
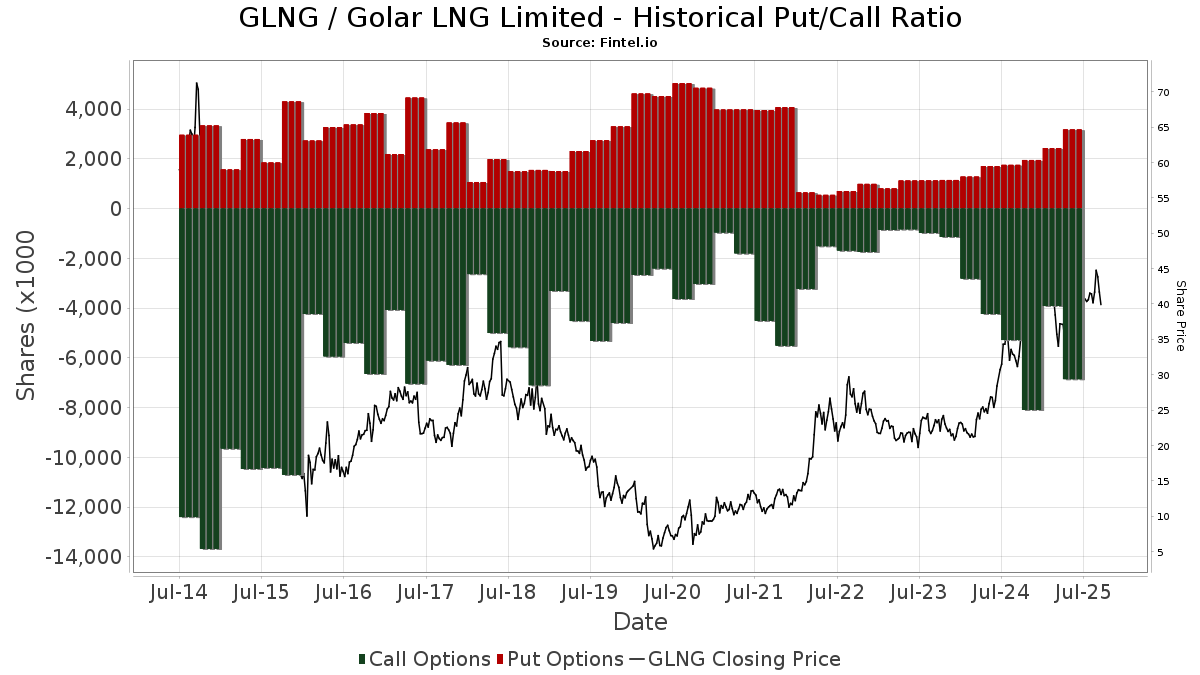
Institutionel Put/Call-forhold
Ud over at indberette standardaktie- og gældsudstedelser skal institutter med mere end 100 mill. aktiver under forvaltning også oplyse deres put- og call-optionsbeholdninger. Da salgsoptioner generelt indikerer negativ stemning, og købsoptioner indikerer positiv stemning, kan vi få en fornemmelse af den overordnede institutionelle stemning ved at plotte forholdet mellem put og kald. Diagrammet til højre viser det historiske put/call-forhold for dette instrument.
Brug af Put/Call Ratio som en indikator for investorernes stemning overvinder en af de vigtigste mangler ved at bruge totalt institutionelt ejerskab, som er, at en betydelig mængde af aktiver under forvaltning investeres passivt for at spore indekser. Passivt forvaltede fonde køber typisk ikke optioner, så indikatoren for put/call-forholdet følger mere nøje følelsen af aktivt forvaltede fonde.
13D/G-arkivering
Vi præsenterer 13D/G ansøgninger separat fra 13F ansøgninger på grund af den forskellige behandling af SEC. 13D/G-ansøgninger kan indgives af grupper af investorer (med én ledende), hvorimod 13F-ansøgninger ikke kan. Dette resulterer i situationer, hvor en investor kan indsende en 13D/G, der rapporterer én værdi for de samlede aktier (der repræsenterer alle de aktier, der ejes af investorgruppen), men derefter indsender en 13F, der rapporterer en anden værdi for de samlede aktier (der udelukkende repræsenterer deres egne) ejendomsret). Det betyder, at aktieejerskab af 13D/G-arkiver og 13F-arkiveringer ofte ikke er direkte sammenlignelige, så vi præsenterer dem separat.
Bemærk: Fra den 16. maj 2021 viser vi ikke længere ejere, der ikke har indsendt en 13D/G inden for det seneste år. Tidligere viste vi den fulde historie af 13D/G-arkiver. Generelt skal enheder, der er forpligtet til at indgive 13D/G-ansøgninger, indgive mindst årligt, før de indsender en afsluttende ansøgning. Dog forlader fonde nogle gange positioner uden at indsende en afsluttende ansøgning (dvs. de afvikler), så visning af den fulde historie resulterede nogle gange i forvirring om det nuværende ejerskab. For at undgå forvirring viser vi nu kun 'aktuelle' ejere - det vil sige - ejere, der har anmeldt inden for det seneste år.
Upgrade to unlock premium data.
| Fil dato | Form | Investor | Forrige Aktier |
Seneste Aktier |
Δ Aktier (Procent) |
Ejendomsret (Procent) |
Δ Ejerskab (Procent) |
|
|---|---|---|---|---|---|---|---|---|
| 2025-08-15 | Naria Inc. | 10,284,166 | 10,284,166 | 0.00 | 9.80 | -1.01 | ||
| 2025-07-08 | MORGAN STANLEY | 7,984,176 | 2,531,820 | -68.29 | 2.40 | -68.42 | ||
| 2025-05-14 | Rubric Capital Management LP | 7,710,211 | 8,975,149 | 16.41 | 8.59 | 16.24 | ||
| 2025-05-02 | INTEGRATED CORE STRATEGIES (US) LLC | 5,493,753 | 55,889 | -98.98 | 0.10 | -98.11 |
13F og NPORT arkivering
Detaljer om 13F-arkivering er gratis. Detaljer om NP-ansøgninger kræver et premium-medlemskab. Grønne rækker angiver nye positioner. Røde rækker angiver lukkede positioner. Klik på linket ikon for at se den fulde transaktionshistorik.
Opgrader
for at låse premium-data op og eksportere til Excel ![]() .
.
| Fil dato | Kilde | Investor | Type | Gennemsnitlig pris (Øst) |
Aktier | Δ Aktier (%) |
Rapporteret Værdi ($1000) |
Δ Værdi (%) |
Port Alloc (%) |
|
|---|---|---|---|---|---|---|---|---|---|---|
| 2026-02-04 | 13F | First Eagle Investment Management, LLC | 293.472 | 3,78 | 10.920 | -4,43 | ||||
| 2026-02-10 | 13F | Clear Harbor Asset Management, LLC | 12.050 | 448 | ||||||
| 2025-11-14 | 13F | Garnet Equity Capital Holdings, Inc. | Call | 0 | -100,00 | 0 | -100,00 | |||
| 2026-03-12 | 13F/A | Peak6 Llc | Put | 70.400 | -45,38 | 2.620 | -49,71 | |||
| 2025-11-12 | 13F | Bardin Hill Management Partners Lp | 0 | -100,00 | 0 | -100,00 | ||||
| 2026-03-12 | 13F/A | Peak6 Llc | 11.122 | -86,46 | 414 | -87,56 | ||||
| 2026-02-12 | 13F | Quadrant Capital Group Llc | 699 | -16,29 | 26 | -21,21 | ||||
| 2026-02-13 | 13F | Morgan Stanley | 2.110.671 | 14,04 | 78.538 | 5,01 | ||||
| 2025-09-25 | NP | DFAX - Dimensional World ex U.S. Core Equity 2 ETF | 3.007 | 0,00 | 124 | -3,15 | ||||
| 2026-02-10 | 13F | Thompson Siegel & Walmsley Llc | 285.076 | 9,43 | 11 | 0,00 | ||||
| 2026-01-26 | 13F | Merit Financial Group, LLC | 7.106 | -7,38 | 264 | -14,84 | ||||
| 2026-02-13 | 13F | Barclays Plc | 356.660 | 113,75 | 13.271 | 96,84 | ||||
| 2026-02-17 | 13F | Harvey Capital Management Inc | 123.950 | -12,35 | 4.612 | -19,29 | ||||
| 2026-02-09 | 13F | Royce & Associates Lp | 18.006 | -75,00 | 670 | -76,98 | ||||
| 2026-02-17 | 13F | Lonestar Capital Management LLC | 0 | -100,00 | 0 | |||||
| 2026-02-12 | 13F | Steward Partners Investment Advisory, Llc | 168 | 0,00 | 6 | 0,00 | ||||
| 2026-02-11 | 13F | Zions Bancorporation, National Association /ut/ | 1.175 | 44 | ||||||
| 2026-01-26 | 13F | Mountain Hill Investment Partners Corp. | 13.662 | 0,00 | 508 | -7,97 | ||||
| 2026-01-28 | 13F | WIT Partners Advisory Pte. Ltd. | 5.230 | 185 | ||||||
| 2025-09-29 | NP | PRFZ - Invesco FTSE RAFI US 1500 Small-Mid ETF This fund is a listed as child fund of Invesco Ltd. and if that institution has disclosed ownership in this security, then these positions will not be double counted when calculating total shares and total value | 70.561 | -34,48 | 2.904 | -36,55 | ||||
| 2025-09-26 | NP | TIEIX - TIAA-CREF Equity Index Fund Institutional Class | 73.946 | 0,00 | 3.044 | -3,18 | ||||
| 2026-02-13 | 13F | Wexford Capital Lp | 3.863 | 0,00 | 144 | -8,33 | ||||
| 2026-02-11 | 13F | J.Safra Asset Management Corp | 7.208 | 76,62 | 268 | 63,41 | ||||
| 2025-09-25 | NP | DFIEX - International Core Equity Portfolio - Institutional Class This fund is a listed as child fund of Dimensional Fund Advisors Lp and if that institution has disclosed ownership in this security, then these positions will not be double counted when calculating total shares and total value | 19.800 | 0,00 | 815 | -3,21 | ||||
| 2026-02-09 | 13F | Rit Capital Partners Plc | 125.218 | -84,85 | 4.657 | -86,06 | ||||
| 2026-02-17 | 13F | Numerai GP LLC | 0 | -100,00 | 0 | |||||
| 2025-09-26 | NP | FSSNX - Fidelity Small Cap Index Fund This fund is a listed as child fund of Fmr Llc and if that institution has disclosed ownership in this security, then these positions will not be double counted when calculating total shares and total value | 1.004.048 | 0,39 | 41.327 | -2,79 | ||||
| 2026-01-29 | 13F | UBS Group AG | 729.649 | -11,39 | 27.150 | -18,41 | ||||
| 2026-02-17 | 13F | Prelude Capital Management, Llc | 78.333 | -38,99 | 2.915 | -43,83 | ||||
| 2026-02-17 | 13F | Caption Management, LLC | Call | 145.000 | 0,00 | 5.395 | -7,92 | |||
| 2026-02-17 | 13F | Caption Management, LLC | 40.900 | 78,60 | 1.522 | 64,43 | ||||
| 2026-02-12 | 13F | Federation des caisses Desjardins du Quebec | 1.550 | 0,00 | 58 | -8,06 | ||||
| 2026-02-13 | 13F | SRS Capital Advisors, Inc. | 286 | 54,59 | 11 | 42,86 | ||||
| 2026-02-11 | 13F | Simplex Trading, Llc | Call | 274.000 | 17,04 | 10.196 | 113.177,78 | |||
| 2026-02-11 | 13F | Simplex Trading, Llc | Put | 121.600 | -24,24 | 4.525 | 75.300,00 | |||
| 2026-01-09 | 13F | SG Americas Securities, LLC | 31.142 | 289,32 | 1 | |||||
| 2026-02-11 | 13F | Simplex Trading, Llc | 22.955 | 682,65 | 854 | |||||
| 2026-02-17 | 13F | Sig Brokerage, Lp | Call | 8.600 | 320 | |||||
| 2025-11-13 | 13F | Cobalt Capital Management, Inc. | 0 | -100,00 | 0 | |||||
| 2026-02-17 | 13F | D. E. Shaw & Co., Inc. | 0 | -100,00 | 0 | |||||
| 2026-02-17 | 13F | Advisor Group Holdings, Inc. | 81.679 | -0,85 | 3.039 | -8,96 | ||||
| 2026-01-30 | 13F | Kiker Wealth Management, LLC | 0 | -100,00 | 0 | |||||
| 2026-02-13 | 13F | Beck Capital Management, Llc | 0 | -100,00 | 0 | |||||
| 2026-02-06 | 13F | ProShare Advisors LLC | 17.868 | 4,51 | 665 | -3,77 | ||||
| 2026-02-13 | 13F | Dockside LLC | 46.262 | 1.721 | ||||||
| 2026-02-06 | 13F | Larson Financial Group LLC | 346 | -13,50 | 13 | -25,00 | ||||
| 2026-02-17 | 13F | Nomura Holdings Inc | 0 | -100,00 | 0 | |||||
| 2026-02-12 | 13F | Commonwealth Equity Services, Llc | 10.673 | 11,47 | 397 | |||||
| 2025-11-14 | 13F | Point72 Asia (Singapore) Pte. Ltd. | 1.127 | 46 | ||||||
| 2026-02-11 | 13F | Rise Advisors, LLC | 0 | -100,00 | 0 | |||||
| 2025-11-14 | 13F | Maverick Capital Ltd | 0 | -100,00 | 0 | |||||
| 2025-11-21 | 13F/A | CIBC Bancorp USA Inc. | 10.659 | 431 | ||||||
| 2026-02-11 | 13F | LPL Financial LLC | 59.966 | -1,21 | 2.231 | -9,05 | ||||
| 2026-02-17 | 13F | Jones Financial Companies Lllp | 126 | -74,80 | 5 | -80,00 | ||||
| 2026-02-17 | 13F | Philosophy Capital Management LLC | 2.376.098 | -1,89 | 88.415 | -9,66 | ||||
| 2026-02-17 | 13F | Clearline Capital LP | 1.067.153 | 172,64 | 39.709 | 151,06 | ||||
| 2026-01-23 | 13F | Portman Square Capital LLP | Put | 0 | -100,00 | 0 | -100,00 | |||
| 2026-02-13 | 13F | JustInvest LLC | 12.984 | -1,72 | 483 | -9,38 | ||||
| 2026-02-17 | 13F | Encompass Capital Advisors LLC | 0 | -100,00 | 0 | |||||
| 2026-02-17 | 13F | Wellington Management Group Llp | 0 | -100,00 | 0 | |||||
| 2026-02-11 | 13F | Manchester Capital Management LLC | 0 | -100,00 | 0 | -100,00 | ||||
| 2026-02-17 | 13F | Capstone Investment Advisors, Llc | 0 | -100,00 | 0 | -100,00 | ||||
| 2026-02-06 | 13F | Leonteq Securities AG | 1 | -99,87 | 0 | -100,00 | ||||
| 2026-02-17 | 13F | ExodusPoint Capital Management, LP | Call | 0 | -100,00 | 0 | -100,00 | |||
| 2026-02-13 | 13F | Marshall Wace, Llp | 400.389 | 14.898 | ||||||
| 2026-02-13 | 13F | Sei Investments Co | 23.685 | 134,27 | 881 | 115,93 | ||||
| 2026-02-17 | 13F | Northern Trust Corp | 607.854 | -13,32 | 22.618 | -20,19 | ||||
| 2026-01-05 | 13F | GAMMA Investing LLC | 492 | -9,72 | 18 | -18,18 | ||||
| 2026-02-09 | 13F | Geode Capital Management, Llc | 1.302.683 | -2,84 | 48.473 | -10,53 | ||||
| 2026-02-06 | 13F | Intrust Bank Na | 41.632 | -0,19 | 1.549 | -8,07 | ||||
| 2026-02-13 | 13F | Prudential Financial Inc | 6.116 | -52,36 | 228 | -56,18 | ||||
| 2026-02-13 | 13F | MYDA Advisors LLC | 50.000 | -67,95 | 1.860 | -70,49 | ||||
| 2025-09-26 | NP | SUNAMERICA SERIES TRUST - SA Legg Mason Tactical Opportunities Portfolio Class 1 | 376 | 0,00 | 15 | 0,00 | ||||
| 2026-02-13 | 13F | MYDA Advisors LLC | Call | 130.000 | 4.837 | |||||
| 2026-02-13 | 13F | Parkside Financial Bank & Trust | 51 | -48,48 | 2 | -75,00 | ||||
| 2026-02-13 | 13F | American Century Companies Inc | 94.044 | 90,84 | 3.499 | 75,74 | ||||
| 2026-02-05 | 13F | Peak Asset Management, LLC | 56.350 | 0,00 | 2.097 | -7,95 | ||||
| 2026-02-13 | 13F | Squarepoint Ops LLC | Call | 0 | -100,00 | 0 | -100,00 | |||
| 2026-02-14 | 13F | Rockefeller Capital Management L.P. | 80.892 | 37,99 | 3.010 | 27,11 | ||||
| 2026-01-23 | 13F | Private Wealth Management Group, LLC | 104 | 0,00 | 4 | -25,00 | ||||
| 2026-02-13 | 13F | Walleye Trading LLC | Call | 29.700 | 22,73 | 1.105 | 13,10 | |||
| 2026-02-13 | 13F | Walleye Trading LLC | 45.323 | -63,58 | 1.686 | -66,47 | ||||
| 2026-02-06 | 13F | Pnc Financial Services Group, Inc. | 94 | -21,67 | 3 | -25,00 | ||||
| 2025-10-17 | 13F | Range Financial Group LLC | 0 | -100,00 | 0 | |||||
| 2026-02-13 | 13F | Walleye Trading LLC | Put | 171.800 | 1,12 | 6.393 | -6,89 | |||
| 2026-02-17 | 13F | IHT Wealth Management, LLC | 33.875 | 41,74 | 1.260 | 30,57 | ||||
| 2026-02-09 | 13F | MQS Management LLC | 0 | -100,00 | 0 | |||||
| 2026-02-17 | 13F | Qube Research & Technologies Ltd | 1.183.703 | 11,08 | 44.046 | 2,28 | ||||
| 2025-09-23 | NP | GSATX - Goldman Sachs Small Cap Value Insights Fund Class A | 162.139 | 2,46 | 6.674 | -0,77 | ||||
| 2025-11-14 | 13F | Ion Asset Management Ltd. | 16.000 | 48,08 | 647 | 45,17 | ||||
| 2026-02-11 | 13F | Inceptionr Llc | 0 | -100,00 | 0 | |||||
| 2026-02-12 | 13F | Castleark Management Llc | 12.210 | -47,93 | 454 | -52,06 | ||||
| 2026-02-12 | 13F | Sit Investment Associates Inc | 0 | -100,00 | 0 | |||||
| 2025-11-14 | 13F | Point72 Hong Kong Ltd | 0 | -100,00 | 0 | |||||
| 2026-02-13 | 13F | Resources Investment Advisors, LLC. | 8.003 | 0,00 | 298 | -8,05 | ||||
| 2026-02-09 | 13F | Emerald Mutual Fund Advisers Trust | 7.233 | 263,65 | 269 | 236,25 | ||||
| 2026-01-30 | 13F | Us Bancorp \de\ | 8.523 | 0,00 | 317 | -7,85 | ||||
| 2025-09-23 | NP | GCSIX - Goldman Sachs Small Cap Equity Insights Fund Institutional | 60.623 | 146,37 | 2.495 | 138,76 | ||||
| 2025-11-14 | 13F | Mariner, LLC | 0 | -100,00 | 0 | |||||
| 2026-02-02 | 13F | Principal Financial Group Inc | 21.823 | -5,67 | 812 | -13,06 | ||||
| 2025-09-24 | NP | Innovator ETFs Trust - Innovator IBD Breakout Opportunities ETF | 0 | -100,00 | 0 | -100,00 | ||||
| 2026-02-10 | 13F | Bank of New York Mellon Corp | 278.408 | -3,79 | 10.360 | -11,41 | ||||
| 2026-02-12 | 13F | Amitell Capital Pte Ltd | 0 | -100,00 | 0 | |||||
| 2025-11-14 | 13F | Diameter Capital Partners LP | 0 | -100,00 | 0 | |||||
| 2026-02-05 | 13F | Freemont Management S.A. | 20.800 | 197,14 | 774 | 174,11 | ||||
| 2026-01-23 | 13F | Farther Finance Advisors, LLC | 7.690 | 0,79 | 286 | -7,14 | ||||
| 2025-09-26 | NP | REBYX - U.S. Small Cap Equity Fund Class Y | 13.845 | 0,00 | 570 | -3,23 | ||||
| 2026-02-10 | 13F | Ellevest, Inc. | 0 | -100,00 | 0 | |||||
| 2026-02-10 | 13F | Goldman Sachs Group Inc | 757.331 | -3,71 | 28.180 | -11,34 | ||||
| 2026-02-10 | 13F | Goldman Sachs Group Inc | Call | 100.000 | -60,00 | 3.721 | -63,17 | |||
| 2026-02-13 | 13F | Stifel Financial Corp | 603.345 | -0,89 | 22.450 | -8,74 | ||||
| 2026-02-17 | 13F | Fmr Llc | 760.548 | -1,25 | 28.300 | -9,07 | ||||
| 2025-09-26 | NP | TISEX - TIAA-CREF Quant Small-Cap Equity Fund Institutional Class | 105.786 | -74,47 | 4.354 | -75,28 | ||||
| 2026-02-11 | 13F | Hughes Financial Services, LLC | 1 | 0 | ||||||
| 2026-02-17 | 13F | Zacks Investment Management | 0 | -100,00 | 0 | |||||
| 2026-02-13 | 13F | Verition Fund Management LLC | Put | 15.900 | -73,72 | 592 | -75,82 | |||
| 2026-02-13 | 13F | Verition Fund Management LLC | Call | 15.100 | -70,85 | 562 | -73,20 | |||
| 2026-01-07 | 13F | Lake Hills Wealth Management, LLC | 15.804 | 588 | ||||||
| 2026-02-12 | 13F | Jane Street Group, Llc | Call | 184.500 | -57,17 | 6.865 | -60,56 | |||
| 2026-02-12 | 13F | Jane Street Group, Llc | 459.419 | -60,28 | 17.095 | -63,43 | ||||
| 2026-02-13 | 13F | Wells Fargo & Company/mn | 175.339 | 23,54 | 6.524 | 13,76 | ||||
| 2026-02-12 | 13F | Jane Street Group, Llc | Put | 479.500 | -38,50 | 17.842 | -43,37 | |||
| 2026-02-13 | 13F | Verition Fund Management LLC | 659.812 | -1,00 | 24.552 | -8,84 | ||||
| 2026-02-11 | 13F | Jpmorgan Chase & Co | 208.320 | 277,32 | 7.752 | 247,42 | ||||
| 2026-02-13 | 13F | DG Capital Management, LLC | 5.481 | -95,36 | 204 | -95,75 | ||||
| 2026-02-17 | 13F | Tudor Investment Corp Et Al | Call | 7.200 | -63,45 | 268 | -66,46 | |||
| 2026-02-13 | 13F | Neo Ivy Capital Management | 0 | -100,00 | 0 | |||||
| 2026-02-17 | 13F | Tudor Investment Corp Et Al | 42.496 | 3,00 | 1.581 | -5,16 | ||||
| 2025-09-26 | NP | HUMDX - Huber Capital Mid Cap Value Fund Investor Class | 27.339 | 0,00 | 1.125 | -3,18 | ||||
| 2026-02-13 | 13F | Squarepoint Ops LLC | Put | 8.000 | -73,94 | 298 | -76,05 | |||
| 2026-02-13 | 13F | Squarepoint Ops LLC | 543.578 | 147,03 | 20.227 | 127,49 | ||||
| 2026-02-17 | 13F | Jump Financial, LLC | 50.257 | -79,59 | 1.870 | -81,21 | ||||
| 2026-02-10 | 13F | Envestnet Asset Management Inc | 7.912 | -83,84 | 294 | -85,14 | ||||
| 2026-02-12 | 13F | Hrt Financial Lp | 113.458 | 157,36 | 4 | 300,00 | ||||
| 2026-02-13 | 13F | Rubric Capital Management LP | 9.178.978 | 0,00 | 341.550 | -7,92 | ||||
| 2026-02-17 | 13F | Royal Bank Of Canada | 4.332 | 50,68 | 161 | 38,79 | ||||
| 2026-02-17 | 13F | Bayberry Capital Partners LP | 0 | -100,00 | 0 | |||||
| 2026-02-13 | 13F | Glen Eagle Advisors, LLC | 5 | 0,00 | 0 | |||||
| 2025-11-12 | 13F | Cresset Asset Management, LLC | 10.511 | 0,00 | 425 | -1,85 | ||||
| 2026-02-13 | 13F | Cloverfields Capital Group, Lp | 92.479 | 0,69 | 3.441 | -7,28 | ||||
| 2025-11-12 | 13F | Cambridge Investment Research Advisors, Inc. | 0 | -100,00 | 0 | |||||
| 2026-01-09 | 13F | Park Place Capital Corp | 0 | -100,00 | 0 | |||||
| 2026-02-02 | 13F | Oppenheimer & Co Inc | 30.000 | 0,00 | 1.116 | -7,92 | ||||
| 2026-02-05 | 13F | Tejara Capital Ltd | 369.026 | 87,77 | 13.731 | 72,91 | ||||
| 2025-11-14 | 13F | Susquehanna Fundamental Investments, Llc | 0 | -100,00 | 0 | |||||
| 2026-02-17 | 13F | Tower Research Capital LLC (TRC) | 6.694 | 46,00 | 249 | 34,59 | ||||
| 2026-02-13 | 13F | HITE Hedge Asset Management LLC | 176.977 | 6.585 | ||||||
| 2026-02-18 | 13F | Vident Advisory, LLC | 8.149 | 22,95 | 303 | 13,48 | ||||
| 2025-11-21 | 13F | Nebula Research & Development LLC | 0 | -100,00 | 0 | |||||
| 2026-02-12 | 13F | Campbell & CO Investment Adviser LLC | 0 | -100,00 | 0 | |||||
| 2025-11-14 | 13F | Graham Capital Management, L.P. | 0 | -100,00 | 0 | |||||
| 2026-01-12 | 13F | Naria Inc. | 10.284.166 | 0,00 | 382.674 | -7,92 | ||||
| 2026-02-13 | 13F | Headlands Technologies LLC | 21.860 | 813 | ||||||
| 2026-02-17 | 13F | Point72 Asset Management, L.P. | Put | 376.300 | 14.002 | |||||
| 2026-02-17 | 13F | Point72 Asset Management, L.P. | 79.819 | -77,67 | 2.970 | -79,44 | ||||
| 2026-02-17 | 13F | Raymond James Financial Inc | 0 | -100,00 | 0 | |||||
| 2026-02-14 | 13F | Militia Capital Partners, LP | 45.000 | 3,69 | 1.674 | -4,51 | ||||
| 2026-01-20 | 13F | Signaturefd, Llc | 819 | -3,08 | 30 | -11,76 | ||||
| 2026-02-10 | 13F | State of Wyoming | 3.878 | 12,67 | 144 | 3,60 | ||||
| 2026-02-17 | 13F | Garnet Equity Capital Holdings, Inc. | 384.504 | 0,00 | 14.307 | -7,92 | ||||
| 2026-02-09 | 13F | Emerald Advisers, Llc | 0 | -100,00 | 0 | |||||
| 2026-02-17 | 13F | Jain Global LLC | 0 | -100,00 | 0 | |||||
| 2026-01-15 | 13F | Westmount Partners, LLC | 9.070 | 0,02 | 337 | -7,16 | ||||
| 2026-02-11 | 13F | Fox Run Management, L.l.c. | 7.549 | -65,93 | 281 | -68,72 | ||||
| 2026-02-05 | 13F | Pinnacle Associates Ltd | 1.001.465 | -3,18 | 37.265 | -10,85 | ||||
| 2026-02-17 | 13F | Aqr Capital Management Llc | 13.877 | -40,18 | 516 | -44,93 | ||||
| 2025-11-14 | 13F | Skopos Labs, Inc. | 0 | -100,00 | 0 | |||||
| 2026-02-10 | 13F | Bnp Paribas Arbitrage, Sa | 25.551 | -74,79 | 951 | -76,80 | ||||
| 2026-02-13 | 13F | Police & Firemen's Retirement System of New Jersey | 26.004 | -6,06 | 968 | -13,51 | ||||
| 2026-02-17 | 13F | Old West Investment Management, LLC | 59.252 | 29,79 | 2.205 | 19,52 | ||||
| 2025-09-24 | NP | BLACKROCK FUNDS - iShares Russell Small/Mid-Cap Index Fund Investor A | 15.281 | 14,31 | 629 | 10,56 | ||||
| 2026-02-17 | 13F | Citadel Advisors Llc | Call | 144.600 | -40,47 | 5.381 | -45,19 | |||
| 2026-02-10 | 13F | Savant Capital, LLC | 11.974 | 75,37 | 446 | 61,82 | ||||
| 2026-02-17 | 13F | Citadel Advisors Llc | 1.018.224 | 66,41 | 37.888 | 53,23 | ||||
| 2026-02-17 | 13F | Citadel Advisors Llc | Put | 465.400 | -2,47 | 17.318 | -10,20 | |||
| 2025-09-26 | NP | UAPIX - Ultrasmall-cap Profund Investor Class | 1.107 | 9,39 | 46 | 4,65 | ||||
| 2025-09-29 | NP | IDMO - Invesco S&P International Developed Momentum ETF This fund is a listed as child fund of Invesco Ltd. and if that institution has disclosed ownership in this security, then these positions will not be double counted when calculating total shares and total value | 21.743 | 78,27 | 895 | 72,59 | ||||
| 2026-02-12 | 13F | Brown Brothers Harriman & Co | 1.751 | 65 | ||||||
| 2026-01-08 | 13F | Maridea Wealth Management LLC | 0 | -100,00 | 0 | |||||
| 2026-02-17 | 13F | Sagefield Capital LP | 244.271 | -30,94 | 9.089 | -36,41 | ||||
| 2026-02-09 | 13F | Terril Brothers, Inc. | 15.775 | 29,04 | 587 | 18,62 | ||||
| 2026-02-19 | 13F | Invesco Ltd. | 711.679 | -5,49 | 26.482 | -12,97 | ||||
| 2025-09-29 | NP | RSSL - Global X Russell 2000 ETF | 51.187 | -14,83 | 2.107 | -17,54 | ||||
| 2026-02-17 | 13F | Freestone Grove Partners LP | 154.674 | 5.755 | ||||||
| 2026-01-30 | 13F | Levin Capital Strategies, L.p. | 519.088 | 16,30 | 19.315 | 7,09 | ||||
| 2026-02-13 | 13F | Sterling Capital Management LLC | 5.916 | -17,89 | 220 | -24,40 | ||||
| 2026-02-09 | 13F | Jefferies Financial Group Inc. | Call | 60.200 | 2.240 | |||||
| 2026-02-11 | 13F | Parallel Advisors, LLC | 34 | 70,00 | 1 | |||||
| 2026-02-09 | 13F | Jefferies Financial Group Inc. | 255.068 | 9.491 | ||||||
| 2026-02-06 | 13F | EverSource Wealth Advisors, LLC | 1.309 | -2,82 | 49 | -11,11 | ||||
| 2026-02-17 | 13F | Shay Capital LLC | 295.200 | -2,50 | 10.984 | -10,22 | ||||
| 2026-02-02 | 13F | Strs Ohio | 3.100 | -36,73 | 115 | -41,92 | ||||
| 2026-02-13 | 13F | Quarry LP | 56 | 2 | ||||||
| 2026-02-13 | 13F | Diametric Capital, LP | 136.538 | 79,20 | 5.081 | 65,04 | ||||
| 2026-02-17 | 13F | Gilder Gagnon Howe & Co Llc | 0 | -100,00 | 0 | |||||
| 2026-02-13 | 13F | Toroso Investments, LLC | 16.502 | -24,40 | 614 | -30,39 | ||||
| 2025-11-13 | 13F | Hsbc Holdings Plc | 0 | -100,00 | 0 | -100,00 | ||||
| 2026-02-17 | 13F | Adage Capital Partners Gp, L.l.c. | 500.000 | -16,67 | 18.605 | -23,27 | ||||
| 2025-10-30 | 13F | Twin Peaks Wealth Advisors, LLC | 0 | -100,00 | 0 | |||||
| 2025-09-26 | NP | HUSIX - Huber Capital Small Cap Value Fund Investor Class | 181.238 | 0,00 | 7.460 | -3,17 | ||||
| 2026-02-13 | 13F | Brookfield Asset Management Inc. | 700.347 | 12,83 | 26.060 | 3,90 | ||||
| 2026-02-17 | 13F | Long Focus Capital Management, Llc | 1.526.440 | 139,50 | 56.799 | 120,53 | ||||
| 2026-02-17 | 13F | Price T Rowe Associates Inc /md/ | 56.193 | 2,62 | 2 | 0,00 | ||||
| 2026-02-12 | 13F | New York State Common Retirement Fund | 30.435 | -8,15 | 1.132 | -15,40 | ||||
| 2026-02-17 | 13F | Man Group plc | 630.477 | 115,57 | 23.460 | 98,51 | ||||
| 2025-11-14 | 13F | Wolverine Trading, Llc | 31.053 | 288,26 | 1.248 | 277,04 | ||||
| 2025-11-14 | 13F | Wolverine Trading, Llc | Call | 181.800 | 32,41 | 7.308 | 28,53 | |||
| 2025-11-14 | 13F | Wolverine Trading, Llc | Put | 49.700 | 32,53 | 1.998 | 28,59 | |||
| 2026-02-17 | 13F | Two Sigma Investments, Lp | Put | 196.000 | 2,08 | 7.293 | -5,99 | |||
| 2026-01-29 | 13F | UMA Financial Services, Inc. | 7 | 0 | ||||||
| 2026-02-17 | 13F | Elequin Capital Lp | 163 | 6 | ||||||
| 2026-02-17 | 13F | Lazard Asset Management Llc | 0 | -100,00 | 0 | |||||
| 2026-02-17 | 13F | Two Sigma Investments, Lp | 253.802 | 11,78 | 9.444 | 2,92 | ||||
| 2026-03-02 | 13F | Sankala Group LLC | 39 | 2 | ||||||
| 2025-09-26 | NP | HUDIX - Huber Capital Diversified Large Cap Value Fund Investor Class | 31.803 | 0,00 | 1.309 | -3,11 | ||||
| 2026-02-12 | 13F | Voya Investment Management Llc | 17.298 | -4,48 | 644 | -12,04 | ||||
| 2026-02-02 | 13F | Truist Financial Corp | 0 | -100,00 | 0 | |||||
| 2026-02-12 | 13F | State Board Of Administration Of Florida Retirement System | 28.928 | 0,00 | 1.076 | -7,88 | ||||
| 2025-11-14 | 13F | Lombard Odier Asset Management (USA) Corp | 0 | -100,00 | 0 | -100,00 | ||||
| 2026-02-12 | 13F | BlackRock, Inc. | 5.554.487 | -1,06 | 206.682 | -8,90 | ||||
| 2026-01-16 | 13F | FNY Investment Advisers, LLC | 3.090 | -77,19 | 0 | |||||
| 2026-02-11 | 13F | Metis Global Partners, LLC | 11.990 | 32,11 | 446 | 21,86 | ||||
| 2026-02-17 | 13F | J. Goldman & Co LP | Call | 0 | -100,00 | 0 | ||||
| 2025-11-13 | 13F | Crossingbridge Advisors, LLC | 0 | -100,00 | 0 | |||||
| 2026-01-14 | 13F | Appian Way Asset Management LP | 0 | -100,00 | 0 | |||||
| 2026-01-23 | 13F | State of Alaska, Department of Revenue | 4.540 | 6,42 | 0 | |||||
| 2026-02-11 | 13F | Donald Smith & Co., Inc. | 2.151.627 | 80.062 | ||||||
| 2026-02-17 | 13F | Capitolis Liquid Global Markets LLC | 83.100 | -86,85 | 3.092 | -87,89 | ||||
| 2026-02-13 | 13F | Kettle Hill Capital Management, Llc | 158.561 | 5.900 | ||||||
| 2025-09-26 | NP | HULIX - Huber Capital Equity Income Fund Investor Class | 467.685 | 32,53 | 19.250 | 28,34 | ||||
| 2026-02-17 | 13F | D. E. Shaw & Co., Inc. | Put | 13.400 | -3,60 | 499 | -11,23 | |||
| 2026-02-17 | 13F | D. E. Shaw & Co., Inc. | Call | 130.000 | 1.071,17 | 4.837 | 979,69 | |||
| 2026-01-07 | 13F | Procyon Private Wealth Partners, LLC | 0 | -100,00 | 0 | |||||
| 2026-02-13 | 13F | De Lisle Partners LLP | 268.390 | 1,90 | 9.985 | -6,18 | ||||
| 2026-02-17 | 13F | SummitTX Capital, L.P. | 81.844 | 1,95 | 3.045 | -6,13 | ||||
| 2026-02-11 | 13F | Los Angeles Capital Management Llc | 420 | 17 | ||||||
| 2026-02-17 | 13F | Amundi | 18.143 | -0,47 | 675 | -5,73 | ||||
| 2026-02-11 | 13F | Two Seas Capital LP | 1.170.998 | 6,84 | 43.573 | -1,62 | ||||
| 2026-02-06 | 13F | IFP Advisors, Inc | 118 | 0,00 | 4 | 0,00 | ||||
| 2026-02-13 | 13F | Manufacturers Life Insurance Company, The | 0 | -100,00 | 0 | |||||
| 2025-10-23 | 13F | Kingswood Wealth Advisors, Llc | 0 | -100,00 | 0 | -100,00 | ||||
| 2026-02-17 | 13F | ION Fund Management Ltd | 16.000 | 595 | ||||||
| 2025-09-24 | NP | Innovator ETFs Trust - Innovator U.S. Small Cap Managed Floor ETF | 871 | 6,22 | 36 | 2,94 | ||||
| 2026-02-05 | 13F | ARS Investment Partners, LLC | 317.021 | 7,08 | 11.796 | -1,40 | ||||
| 2026-02-17 | 13F | Cambria Investment Management, L.P. | 6.844 | 255 | ||||||
| 2026-02-02 | 13F | Pinnacle Wealth Management Advisory Group, LLC | 8.170 | 0,00 | 304 | -7,88 | ||||
| 2026-01-07 | 13F | Permanent Capital Management, LP | 59.183 | 13,15 | 2.202 | 4,21 | ||||
| 2026-02-17 | 13F | Cartenna Capital, LP | 1.308.683 | -32,02 | 48.696 | -37,40 | ||||
| 2026-02-17 | 13F | Kemnay Advisory Services Inc. | 240 | 9 | ||||||
| 2026-02-11 | 13F | Winton Capital Group Ltd | 16.024 | 596 | ||||||
| 2025-09-24 | NP | PJARX - SmallCap Value Fund II R-3 | 5.559 | -27,69 | 229 | -30,06 | ||||
| 2026-01-08 | 13F | Versant Capital Management, Inc | 410 | 2,50 | 15 | -6,25 | ||||
| 2026-02-11 | 13F | Ameritas Investment Partners, Inc. | 7.934 | 295 | ||||||
| 2026-02-05 | 13F | Bessemer Group Inc | 140 | 0,00 | 0 | |||||
| 2025-09-25 | NP | EFCAX - Emerald Insights Fund Class A | 2.262 | 93 | ||||||
| 2026-02-06 | 13F | Bare Financial Services, Inc | 17 | -41,38 | 1 | -100,00 | ||||
| 2026-02-13 | 13F | Knollwood Investment Advisory, LLC | 14.900 | 0,00 | 554 | -7,97 | ||||
| 2025-09-25 | NP | VASVX - Vanguard Selected Value Fund Investor Shares | 813.300 | 0,00 | 33.475 | -3,16 | ||||
| 2025-09-26 | NP | FSUMX - Fidelity Series Sustainable U.S. Market Fund | 263 | -30,97 | 11 | -37,50 | ||||
| 2026-02-06 | 13F | Cullen/frost Bankers, Inc. | 6 | -98,18 | 0 | -100,00 | ||||
| 2026-02-13 | 13F | Natixis | 1.943 | -12,20 | 72 | -19,10 | ||||
| 2025-09-26 | NP | FSSLX - Fidelity Series Small Cap Core Fund | 132.985 | 0,00 | 5.474 | -3,17 | ||||
| 2026-02-23 | 13F | Virtu Financial LLC | 0 | -100,00 | 0 | |||||
| 2026-02-17 | 13F | Cinctive Capital Management LP | 0 | -100,00 | 0 | |||||
| 2025-09-24 | NP | Innovator ETFs Trust - Innovator Gradient Tactical Rotation Strategy ETF | 1.127 | 46 | ||||||
| 2026-02-17 | 13F | Sona Asset Management (us) Llc | Put | 0 | -100,00 | 0 | ||||
| 2026-02-13 | 13F | Y-Intercept (Hong Kong) Ltd | 13.974 | 520 | ||||||
| 2026-02-13 | 13F | Healthcare Of Ontario Pension Plan Trust Fund | 45.687 | 1.700 | ||||||
| 2026-02-17 | 13F | FIL Ltd | 1.642.648 | 4,04 | 61.123 | -4,20 | ||||
| 2026-02-17 | 13F | Lakewood Capital Management, Lp | 435.000 | 45,00 | 16.186 | 33,51 | ||||
| 2026-02-03 | 13F | F/M Investments LLC | 7.233 | 269 | ||||||
| 2026-02-13 | 13F | Charles Schwab Investment Management Inc | 243.096 | -2,12 | 9.046 | -9,87 | ||||
| 2026-02-10 | 13F | Intech Investment Management Llc | 37.808 | -7,55 | 1.407 | -14,89 | ||||
| 2026-02-17 | 13F | Canada Pension Plan Investment Board | 431.884 | -17,73 | 16.070 | -24,25 | ||||
| 2026-02-17 | 13F | DV Trading LLC | 4 | 0 | ||||||
| 2025-09-25 | NP | DFALX - Large Cap International Portfolio - Institutional Class This fund is a listed as child fund of Dimensional Fund Advisors Lp and if that institution has disclosed ownership in this security, then these positions will not be double counted when calculating total shares and total value | 6.906 | 0,00 | 284 | -3,07 | ||||
| 2026-01-12 | 13F | CVA Family Office, LLC | 76 | 0,00 | 3 | -33,33 | ||||
| 2026-02-06 | 13F | Gsa Capital Partners Llp | 81.431 | 10,75 | 3 | 50,00 | ||||
| 2025-10-20 | 13F | Ascent Group, LLC | 0 | -100,00 | 0 | |||||
| 2026-01-29 | 13F | Huntleigh Advisors, Inc. | 21.018 | 5,30 | 782 | -2,98 | ||||
| 2026-02-17 | 13F | Hound Partners, LLC | 705.460 | 7,09 | 26.250 | -1,39 | ||||
| 2026-02-13 | 13F | WealthTrust Axiom LLC | 5.850 | -2,50 | 218 | -10,33 | ||||
| 2026-02-13 | 13F | Victory Capital Management Inc | 143.416 | -0,77 | 5.337 | -8,63 | ||||
| 2026-02-17 | 13F | Twinbeech Capital Lp | 0 | -100,00 | 0 | |||||
| 2026-02-12 | 13F | Cibc World Markets Corp | 6.467 | -47,51 | 241 | -52,66 | ||||
| 2026-02-03 | 13F | Ethic Inc. | 8.022 | -13,69 | 298 | -20,53 | ||||
| 2026-02-12 | 13F | Xponance, Inc. | 7.619 | -2,88 | 284 | -10,73 | ||||
| 2026-02-12 | 13F | MetLife Investment Management, LLC | 54.398 | -6,50 | 2.024 | -13,91 | ||||
| 2026-02-11 | 13F | CenterBook Partners LP | 201.008 | 7.480 | ||||||
| 2026-02-03 | 13F | SBI Securities Co., Ltd. | 120 | 3,45 | 4 | 0,00 | ||||
| 2026-02-20 | 13F | Sunbelt Securities, Inc. | 640 | 24 | ||||||
| 2026-02-17 | 13F | Troluce Capital Advisors LLC | Call | 598.700 | -20,17 | 22.278 | -26,50 | |||
| 2026-02-17 | 13F | California State Teachers Retirement System | 6.018 | -3,62 | 224 | -11,51 | ||||
| 2026-02-09 | 13F | King Luther Capital Management Corp | 118.445 | 306,00 | 4.407 | 274,11 | ||||
| 2025-11-14 | 13F | Bayesian Capital Management, LP | 0 | -100,00 | 0 | |||||
| 2026-02-12 | 13F | Rossby Financial, LCC | 5.000 | 186 | ||||||
| 2025-09-26 | NP | FITFX - Fidelity Flex International Index Fund This fund is a listed as child fund of Fmr Llc and if that institution has disclosed ownership in this security, then these positions will not be double counted when calculating total shares and total value | 10.484 | 432 | ||||||
| 2026-02-17 | 13F | Russell Investments Group, Ltd. | 61.344 | -3,00 | 2.283 | -10,68 | ||||
| 2026-01-15 | 13F | Nisa Investment Advisors, Llc | 3.812 | -6,71 | 142 | -14,55 | ||||
| 2025-11-12 | 13F | HAP Trading, LLC | Call | 100.500 | 51 | |||||
| 2026-02-11 | 13F | Franklin Resources Inc | 16.707 | 2,20 | 622 | -5,91 | ||||
| 2025-11-07 | 13F | Sierra Ocean, Llc | 0 | -100,00 | 0 | |||||
| 2025-11-12 | 13F | HAP Trading, LLC | 11.903 | 481 | ||||||
| 2025-11-14 | 13F | Point72 (DIFC) Ltd | 2.429 | 98 | ||||||
| 2026-02-18 | 13F | Garton & Associates Financial Advisors LLC | 320 | 12 | ||||||
| 2026-02-17 | 13F | Aster Capital Management (DIFC) Ltd | 42 | -92,77 | 2 | -95,65 | ||||
| 2026-02-10 | 13F | Quantbot Technologies LP | 1.018 | -98,81 | 38 | -98,93 | ||||
| 2025-09-26 | NP | ETTOX - E*TRADE No Fee Total Market Index Fund | 43 | 290,91 | 2 | |||||
| 2026-02-17 | 13F | AYAL Capital Advisors Ltd | 161.319 | 6,82 | 6.003 | -1,64 | ||||
| 2026-02-04 | 13F | Hosking Partners LLP | 400.472 | -1,19 | 14.902 | -9,02 | ||||
| 2026-02-09 | 13F | GeoSphere Capital Management | 0 | -100,00 | 0 | |||||
| 2026-02-13 | 13F | Cetera Trust Company, N.A | 6.935 | 0,00 | 258 | -7,86 | ||||
| 2026-02-03 | 13F | Chesapeake Capital Corp /il/ | 15.977 | -25,00 | 595 | -30,93 | ||||
| 2026-02-17 | 13F | Boothbay Fund Management, Llc | Call | 169.500 | -20,16 | 6.307 | -26,48 | |||
| 2026-02-17 | 13F | Boothbay Fund Management, Llc | 181.134 | -30,80 | 6.740 | -36,29 | ||||
| 2026-02-05 | 13F | Amalgamated Bank | 3.071 | -5,19 | 0 | |||||
| 2026-01-16 | 13F | Crewe Advisors LLC | 27 | 0,00 | 1 | 0,00 | ||||
| 2026-02-09 | 13F | Huntington National Bank | 1 | 0,00 | 0 | |||||
| 2026-02-13 | 13F | Sourcerock Group LLC | 167.499 | -0,22 | 6.233 | -8,12 | ||||
| 2026-02-13 | 13F | Pinnacle Wealth Planning Services, Inc. | 66 | 2 | ||||||
| 2026-02-17 | 13F | Luxor Capital Group, LP | Call | 0 | -100,00 | 0 | ||||
| 2026-02-17 | 13F | Aquatic Capital Management LLC | 16.424 | 611 | ||||||
| 2026-01-23 | 13F | Assetmark, Inc | 280 | 13.900,00 | 10 | |||||
| 2026-01-20 | 13F | AdvisorNet Financial, Inc | 247 | 0,00 | 9 | 0,00 | ||||
| 2026-02-18 | 13F | Mackenzie Financial Corp | 6.294 | 0,00 | 234 | -7,87 | ||||
| 2026-02-17 | 13F | Public Employees Retirement System Of Ohio | 661 | 3,93 | 25 | -4,00 | ||||
| 2026-02-17 | 13F | Bank Of America Corp /de/ | 714.917 | 25,32 | 26.602 | 15,40 | ||||
| 2026-02-17 | 13F | Persistent Asset Partners Ltd | 39.362 | 1.465 | ||||||
| 2026-02-10 | 13F | Rothschild Investment Llc | 127 | -15,33 | 5 | -33,33 | ||||
| 2026-02-17 | 13F | Luxor Capital Group, LP | 1.653.100 | 78,58 | 61.512 | 64,44 | ||||
| 2026-01-30 | 13F/A | M&t Bank Corp | 18.708 | 0,32 | 696 | -7,57 | ||||
| 2026-02-17 | 13F | Advisory Services Network, LLC | 38.944 | 4,90 | 1.449 | -3,40 | ||||
| 2025-11-04 | 13F | Penserra Capital Management LLC | 0 | -100,00 | 0 | |||||
| 2026-01-20 | 13F | Perpetual Ltd | 0 | -100,00 | 0 | |||||
| 2026-02-17 | 13F | OnyxPoint Global Management LP | Call | 28.900 | 0,00 | 1.075 | -7,88 | |||
| 2026-02-06 | 13F | Covestor Ltd | 1.601 | 0,00 | 0 | |||||
| 2026-02-13 | 13F | State Street Corp | 1.894.643 | -2,03 | 70.500 | -9,79 | ||||
| 2025-09-26 | NP | FZILX - Fidelity ZERO International Index Fund This fund is a listed as child fund of Fmr Llc and if that institution has disclosed ownership in this security, then these positions will not be double counted when calculating total shares and total value | 20.521 | 11,34 | 845 | 7,79 | ||||
| 2026-02-13 | 13F | Arkadios Wealth Advisors | 0 | -100,00 | 0 | |||||
| 2026-02-02 | 13F | Fifth Third Bancorp | 1.300 | 0,00 | 48 | -7,69 | ||||
| 2026-02-13 | 13F | Transamerica Financial Advisors, Inc. | 4 | 0 | ||||||
| 2025-09-24 | NP | SWSSX - Schwab Small-Cap Index Fund This fund is a listed as child fund of Charles Schwab Investment Management Inc and if that institution has disclosed ownership in this security, then these positions will not be double counted when calculating total shares and total value | 254.333 | 3,27 | 10.468 | 0,01 | ||||
| 2026-02-18 | 13F | GWM Advisors LLC | 50 | 0,00 | 2 | -50,00 | ||||
| 2026-02-13 | 13F | Bridgewater Associates, LP | 7.095 | 264 | ||||||
| 2026-02-17 | 13F | Private Advisor Group, LLC | 0 | -100,00 | 0 | |||||
| 2025-09-26 | NP | TISBX - TIAA-CREF Small-Cap Blend Index Fund Institutional Class | 130.106 | 3,51 | 5.355 | 0,24 | ||||
| 2025-09-26 | NP | BKSE - BNY Mellon US Small Cap Core Equity ETF | 3.204 | -33,83 | 132 | -36,10 | ||||
| 2026-01-07 | 13F | Massmutual Trust Co Fsb/adv | 19 | 0,00 | 1 | |||||
| 2026-02-09 | 13F | Keating Financial Advisory Services, Inc. | 5 | 0 | ||||||
| 2026-02-17 | 13F | Optiver Holding B.V. | 673 | -10,15 | 25 | -16,67 | ||||
| 2026-02-17 | 13F | T. Rowe Price Investment Management, Inc. | 29.325 | -95,50 | 1 | -96,15 | ||||
| 2025-09-25 | NP | VT - Vanguard Total World Stock Index Fund ETF Shares | 64.126 | 0,74 | 2.639 | -2,44 | ||||
| 2026-02-02 | 13F | Danske Bank A/s | 0 | -100,00 | 0 | -100,00 | ||||
| 2026-02-13 | 13F | Smartleaf Asset Management LLC | 490 | -46,09 | 18 | -50,00 | ||||
| 2025-09-26 | NP | SLPIX - Small-cap Profund Investor Class | 90 | -6,25 | 4 | -25,00 | ||||
| 2026-02-05 | 13F | O'Brien Greene & Co. Inc | 78.200 | 0,00 | 2.910 | -7,94 | ||||
| 2026-01-29 | 13F | IMC-Chicago, LLC | 43.522 | 1.619 | ||||||
| 2026-01-29 | 13F | IMC-Chicago, LLC | Put | 83.200 | 20,58 | 3.096 | 11,01 | |||
| 2026-01-29 | 13F | IMC-Chicago, LLC | Call | 111.000 | -9,02 | 4.130 | -16,23 | |||
| 2026-02-05 | 13F | Atria Investments Llc | 17.381 | -3,86 | 647 | -11,51 | ||||
| 2026-01-27 | 13F | WealthCollab, LLC | 500 | -1,19 | 19 | -10,00 | ||||
| 2026-02-17 | 13F | J. Goldman & Co LP | 26.966 | -95,28 | 1.003 | -95,66 | ||||
| 2026-01-20 | 13F | Harbor Capital Advisors, Inc. | 215 | -1,83 | 0 | |||||
| 2026-02-12 | 13F | Marex Group plc | 9.166 | 31,66 | 341 | 21,35 | ||||
| 2026-02-17 | 13F | Sciencast Management LP | 12.133 | 451 | ||||||
| 2026-02-17 | 13F | Gallagher Fiduciary Advisors, LLC | 17.185 | 8,86 | 639 | 0,31 | ||||
| 2026-02-17 | 13F | Clear Street Markets Llc | 8.300 | 309 | ||||||
| 2025-11-14 | 13F | SIR Capital Management, L.P. | 0 | -100,00 | 0 | |||||
| 2025-10-24 | 13F | Meeder Asset Management Inc | 0 | -100,00 | 0 | -100,00 | ||||
| 2026-02-12 | 13F | Verbena Value LP | 1.034.600 | 38.497 | ||||||
| 2026-02-17 | 13F | Spears Abacus Advisors LLC | 10.500 | 0,00 | 391 | -8,02 | ||||
| 2026-02-24 | 13F | Bell Investment Advisors, Inc | 481 | -64,89 | 18 | -69,09 | ||||
| 2026-02-13 | 13F | Wolf Hill Capital Management, LP | Call | 637.300 | 0,00 | 23.714 | -7,92 | |||
| 2026-02-13 | 13F | Citigroup Inc | 283.386 | 315,10 | 10.545 | 282,31 | ||||
| 2026-02-13 | 13F | Caitong International Asset Management Co., Ltd | 576 | -12,46 | 21 | -19,23 | ||||
| 2026-02-13 | 13F | Wolf Hill Capital Management, LP | 2.115.822 | -4,71 | 78.730 | -12,26 | ||||
| 2026-02-05 | 13F | Allworth Financial LP | 1.021 | 2,61 | 38 | -7,50 | ||||
| 2025-11-13 | 13F | Fieldview Capital Management, LLC | 0 | -100,00 | 0 | |||||
| 2026-02-02 | 13F | Cornerstone Planning Group LLC | 23 | 0,00 | 1 | |||||
| 2026-02-17 | 13F | Atom Investors LP | 282.305 | 116,48 | 10.505 | 99,35 | ||||
| 2026-02-11 | 13F | Ramirez Asset Management, Inc. | 53 | 2 | ||||||
| 2026-02-11 | 13F | Group One Trading, L.p. | Call | 147.800 | -50,72 | 5.500 | -54,62 | |||
| 2026-02-11 | 13F | Group One Trading, L.p. | Put | 371.700 | -2,24 | 13.831 | -9,98 | |||
| 2026-02-11 | 13F | Group One Trading, L.p. | 260.341 | 10,48 | 9.687 | 1,73 | ||||
| 2026-02-13 | 13F | Fortitude Advisory Group L.L.C. | 0 | -100,00 | 0 | |||||
| 2026-02-17 | 13F | Millennium Management Llc | Call | 17.200 | -7,53 | 640 | -14,78 | |||
| 2026-02-06 | 13F/A | Rathbone Brothers plc | 40.000 | 0,00 | 1.488 | -7,92 | ||||
| 2026-02-17 | 13F | Susquehanna International Group, Llp | Call | 1.102.700 | -16,98 | 41.031 | -23,55 | |||
| 2026-02-06 | 13F | Tortoise Investment Management, LLC | 0 | -100,00 | 0 | |||||
| 2025-09-23 | NP | GSAOX - Goldman Sachs Small Cap Growth Insights Fund Class A | 3.658 | -84,65 | 151 | -72,27 | ||||
| 2026-02-17 | 13F | Susquehanna International Group, Llp | 440.423 | 12,15 | 16.388 | 3,28 | ||||
| 2026-02-17 | 13F | Susquehanna International Group, Llp | Put | 791.400 | -25,67 | 29.448 | -31,56 | |||
| 2026-02-12 | 13F | CIBC Private Wealth Group, LLC | 254 | 0,79 | 9 | -10,00 | ||||
| 2026-02-17 | 13F | Two Sigma Advisers, Lp | 17.656 | -75,33 | 657 | -77,31 | ||||
| 2026-01-26 | 13F | Cwm, Llc | 480 | -64,31 | 0 | |||||
| 2026-02-12 | 13F | Nuveen, LLC | 205.557 | -54,52 | 7.649 | -58,12 | ||||
| 2025-09-25 | NP | VYM - Vanguard High Dividend Yield Index Fund ETF Shares | 379.517 | 1,96 | 15.621 | -1,26 | ||||
| 2026-02-13 | 13F | Walleye Capital LLC | Put | 15.300 | 20,47 | 569 | 10,92 | |||
| 2026-01-27 | 13F | TD Waterhouse Canada Inc. | 188 | 0,00 | 7 | -14,29 | ||||
| 2026-02-17 | 13F/A | Laurion Capital Management LP | 18.622 | 693 | ||||||
| 2026-02-13 | 13F | Walleye Capital LLC | 272.003 | -0,67 | 10.121 | -8,53 | ||||
| 2026-02-13 | 13F | Walleye Capital LLC | Call | 39.500 | 117,03 | 1.470 | 99,86 | |||
| 2026-02-17 | 13F | Quantinno Capital Management LP | 12.130 | 91,84 | 451 | 76,86 | ||||
| 2026-02-10 | 13F | SCP Investment, LP | 6.800 | 253 | ||||||
| 2026-02-17 | 13F | PointState Capital LP | 3.932.104 | 19,33 | 146.314 | 9,89 | ||||
| 2026-02-17 | 13F | MIRAE ASSET GLOBAL ETFS HOLDINGS Ltd. | 45.352 | -2,37 | 1.688 | -10,12 | ||||
| 2026-02-12 | 13F | Dimensional Fund Advisors Lp | 32.115 | -1,42 | 1.195 | -9,27 | ||||
| 2025-09-29 | NP | SUNAMERICA SERIES TRUST - SA Small Cap Index Portfolio Class 1 | 11.368 | 1,12 | 468 | -2,10 | ||||
| 2025-11-13 | 13F | Duff & Phelps Investment Management Co | 0 | -100,00 | 0 | -100,00 | ||||
| 2026-02-17 | 13F | Millennium Management Llc | 13.291 | -3,48 | 495 | -11,15 | ||||
| 2026-02-11 | 13F | Empowered Funds, LLC | 72.070 | 2.682 | ||||||
| 2026-02-10 | 13F | Texas Yale Capital Corp. | 64.141 | -26,02 | 2.387 | -31,89 | ||||
| 2026-02-13 | 13F | MAI Capital Management | 100 | 0,00 | 4 | -25,00 | ||||
| 2025-09-26 | NP | USMIX - Extended Market Index Fund | 10.515 | -0,27 | 433 | -3,57 | ||||
| 2026-02-13 | 13F | Charter Oak Advisors LP | 234.899 | -10,65 | 8.741 | -17,73 | ||||
| 2026-02-10 | 13F | Td Asset Management Inc | 80.196 | 283,27 | 2.984 | 253,14 | ||||
| 2025-09-29 | NP | CVSIX - Calamos Market Neutral Income Fund Class A | Short | -58.000 | -2.387 | |||||
| 2025-09-26 | NP | FTLS - First Trust Long/Short Equity ETF This fund is a listed as child fund of First Trust Advisors Lp and if that institution has disclosed ownership in this security, then these positions will not be double counted when calculating total shares and total value | Short | -63.030 | 71,41 | -2.594 | 66,07 | |||
| 2026-02-02 | 13F | Amplify Investments, Llc | 2.686 | 21,43 | 105 | 17,98 | ||||
| 2026-02-17 | 13F | Blackstone Group Inc | 0 | -100,00 | 0 | |||||
| 2025-11-14 | 13F | Teza Capital Management LLC | 0 | -100,00 | 0 | |||||
| 2026-02-13 | 13F | Pathstone Holdings, LLC | 50.114 | -4,76 | 1.865 | -12,32 | ||||
| 2026-01-07 | 13F | Harbour Capital Advisors, LLC | 10.580 | -7,64 | 402 | -9,28 | ||||
| 2026-02-11 | 13F | Deutsche Bank Ag\ | 78.119 | -76,54 | 2.907 | -78,41 | ||||
| 2025-09-26 | NP | EBIT - Harbor AlphaEdge Small Cap Earners ETF | 446 | -19,64 | 18 | -21,74 | ||||
| 2026-02-17 | 13F | Ameriprise Financial Inc | 0 | -100,00 | 0 | |||||
| 2026-02-13 | 13F | Oceanic Investment Management LTD | 0 | -100,00 | 0 | |||||
| 2026-02-17 | 13F | Grizzlyrock Capital, Llc | 35.000 | 1.302 | ||||||
| 2025-09-26 | NP | PASIX - PACE Alternative Strategies Investments Class A | Short | -2.237 | -92 | |||||
| 2025-11-14 | 13F | Point72 Europe (London) LLP | 209 | 8 | ||||||
| 2025-10-21 | 13F | Global Retirement Partners, LLC | 0 | -100,00 | 0 | |||||
| 2026-02-17 | 13F | Alliancebernstein L.p. | 102.448 | -40,59 | 3.812 | -45,29 | ||||
| 2026-01-29 | 13F | Cornerstone Investment Partners, LLC | 5.698 | 0,05 | 212 | -7,83 | ||||
| 2026-02-12 | 13F | Circle Wealth Management, LLC | 5.960 | 0,00 | 222 | -7,92 | ||||
| 2026-02-17 | 13F | XTX Topco Ltd | 0 | -100,00 | 0 | |||||
| 2025-09-24 | NP | BLACKROCK FUNDS - iShares Total U.S. Stock Market Index Fund Investor A | 6.652 | 0,00 | 274 | -3,19 | ||||
| 2026-02-13 | 13F | Huber Capital Management LLC | 1.129.385 | 22,27 | 42.024 | 12,58 | ||||
| 2025-09-23 | NP | VLPAX - Virtus Duff & Phelps Select MLP and Energy Fund Class A | 20.455 | -15,01 | 842 | -17,79 | ||||
| 2026-02-13 | 13F | Rhumbline Advisers | 131.892 | -15,46 | 4.908 | -22,16 | ||||
| 2026-02-13 | 13F | Colony Group, LLC | 0 | -100,00 | 0 | |||||
| 2026-02-17 | 13F | Aventail Capital Group, LP | 72.880 | -6,61 | 2.712 | -14,02 | ||||
| 2026-02-17 | 13F | Balyasny Asset Management Llc | 643.662 | 274,89 | 23.951 | 245,20 | ||||
| 2026-02-17 | 13F | Engineers Gate Manager LP | 0 | -100,00 | 0 | |||||
| 2026-02-17 | 13F | Moore Capital Management, Lp | 297.500 | 147,92 | 11.070 | 128,27 | ||||
| 2026-02-17 | 13F | Steinberg Asset Management Llc | 1.415.800 | 2,17 | 52.682 | -5,92 | ||||
| 2026-02-06 | 13F | HighTower Advisors, LLC | 122.558 | 6,77 | 4.560 | -1,68 | ||||
| 2026-02-17 | 13F | Discovery Capital Management, Llc / Ct | 191.987 | -26,50 | 7.144 | -32,33 | ||||
| 2026-02-17 | 13F | Corsair Capital Management, L.p. | 15.003 | 0,02 | 558 | -7,92 | ||||
| 2026-02-17 | 13F | Schonfeld Strategic Advisors LLC | 32.065 | -48,88 | 1.193 | -52,92 | ||||
| 2026-02-12 | 13F | RR Advisors, LLC | 0 | -100,00 | 0 | |||||
| 2026-01-22 | 13F | Harwood Advisory Group, LLC | 2 | 0,00 | 0 | |||||
| 2026-02-17 | 13F | Magnetar Financial LLC | 0 | -100,00 | 0 | |||||
| 2026-01-29 | 13F | Vanguard Group Inc | 1.053.696 | -2,04 | 39.208 | -9,80 | ||||
| 2025-09-29 | NP | KCXIX - Knights of Columbus U.S. All Cap Index Fund I Shares | 432 | 2,61 | 18 | 0,00 | ||||
| 2025-11-04 | 13F | Rit Capital Partners Plc | Call | 0 | -100,00 | 0 | -100,00 | |||
| 2025-09-26 | NP | FESRX - First Eagle Small Cap Opportunity Fund Class R6 | 244.284 | -1,68 | 10.055 | -4,79 | ||||
| 2026-02-11 | 13F | Renaissance Group Llc | 5.582 | -96,77 | 208 | -97,03 | ||||
| 2026-02-10 | 13F/A | Northwestern Mutual Wealth Management Co | 57 | -42,42 | 2 | -50,00 | ||||
| 2026-02-13 | 13F | Ubs Asset Management Americas Inc | 778.696 | -28,03 | 28.975 | -33,72 | ||||
| 2026-02-09 | 13F | Legal & General Group Plc | 15.902 | -6,51 | 592 | -13,97 |