Grundlæggende statistik
| Institutionelle ejere | 432 total, 432 long only, 0 short only, 0 long/short - change of 5,60% MRQ |
| Gennemsnitlig porteføljeallokering | 0.3834 % - change of -0,89% MRQ |
| Institutionelle aktier (lange) | 185.418.658 (ex 13D/G) - change of 1,52MM shares 0,83% MRQ |
| Institutionel værdi (lang) | $ 6.590.670 USD ($1000) |
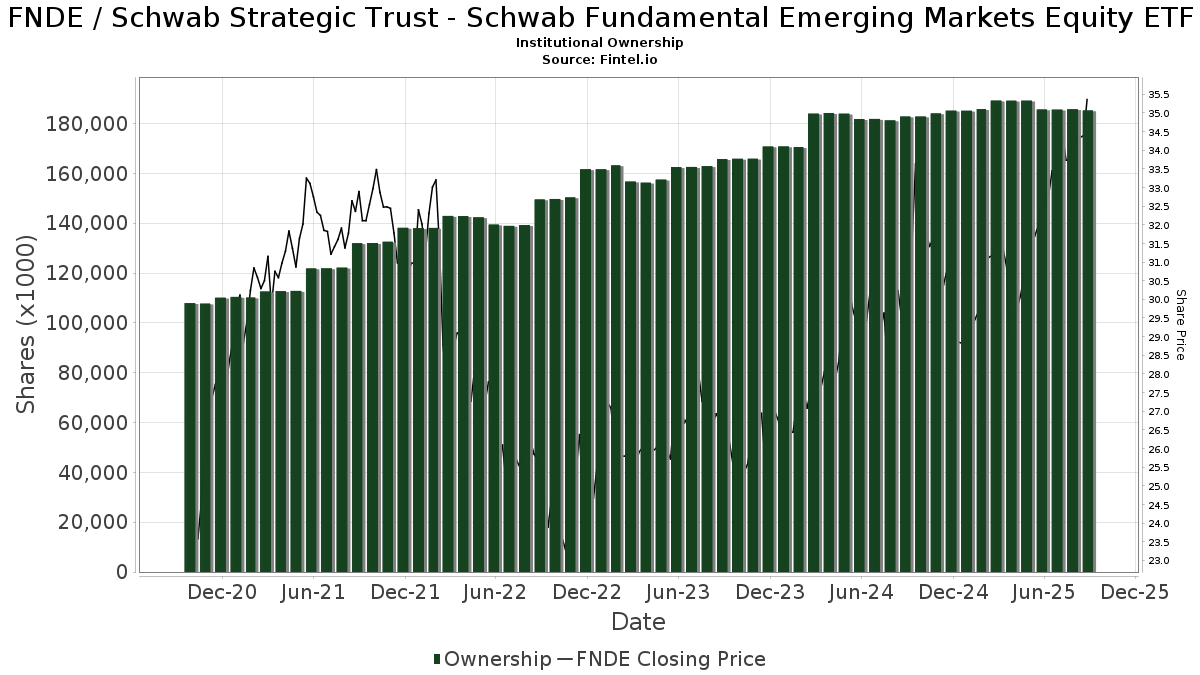
Institutionelt ejerskab og aktionærer
Schwab Strategic Trust - Schwab Fundamental Emerging Markets Equity ETF (US:FNDE) har 432 institutionelle ejere og aktionærer, der har indsendt 13D/G- eller 13F-formularer til Securities Exchange Commission (SEC). Disse institutioner har i alt 185,418,658 aktier. Største aktionærer omfatter Charles Schwab Investment Management Inc, Fmr Llc, Morgan Stanley, Bank Of America Corp /de/, Victory Capital Management Inc, Bogart Wealth, LLC, Envestnet Asset Management Inc, Foster & Motley Inc, Wells Fargo & Company/mn, and Susquehanna International Group, Llp .
Schwab Strategic Trust - Schwab Fundamental Emerging Markets Equity ETF (ARCA:FNDE) institutionel ejerskabsstruktur viser aktuelle positioner i virksomheden efter institutioner og fonde, samt seneste ændringer i positionsstørrelse. Større aktionærer kan omfatte individuelle investorer, investeringsforeninger, hedgefonde eller institutioner. Skema 13D angiver, at investoren besidder (eller besidder) mere end 5 % af virksomheden og har til hensigt (eller har til hensigt at) aktivt at forfølge en ændring i forretningsstrategi. Skema 13G indikerer en passiv investering på over 5%.
The share price as of March 19, 2026 is 37,80 / share. Previously, on March 20, 2025, the share price was 31,49 / share. This represents an increase of 20,04% over that period.
Fondens stemningsscore
Fund Sentiment Score (fka Ownership Accumulation Score) finder de aktier, der bliver mest købt af fonde. Det er resultatet af en sofistikeret, multi-faktor kvantitativ model, der identificerer virksomheder med de højeste niveauer af institutionel akkumulering. Scoringsmodellen bruger en kombination af den samlede stigning i oplyste ejere, ændringerne i porteføljeallokeringer i disse ejere og andre målinger. Tallet går fra 0 til 100, hvor højere tal indikerer et højere niveau af akkumulering for sine jævnaldrende, og 50 er gennemsnittet.
Opdateringsfrekvens: Dagligt
Se Ownership Explorer, som giver en liste over højest rangerende virksomheder.
AI+ Ask Fintel’s AI assistant about Schwab Strategic Trust - Schwab Fundamental Emerging Markets Equity ETF.
Select a question to share a public post with an AI-crafted answer.
Thinking of good questions…
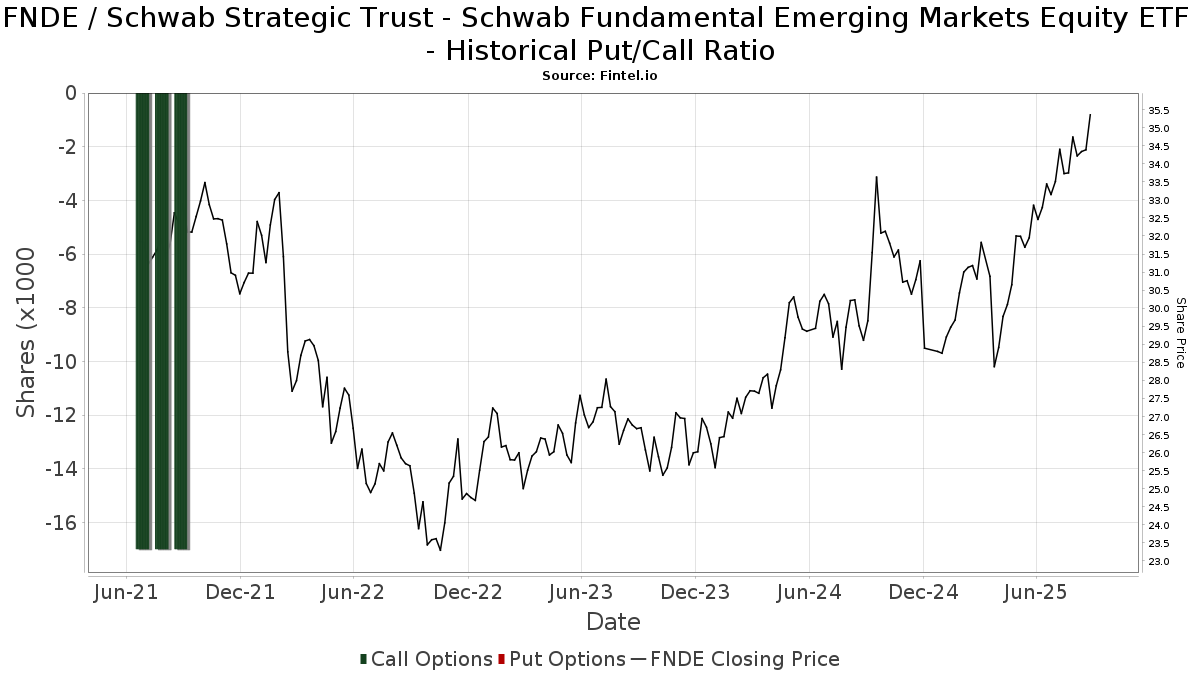
Institutionel Put/Call-forhold
Ud over at indberette standardaktie- og gældsudstedelser skal institutter med mere end 100 mill. aktiver under forvaltning også oplyse deres put- og call-optionsbeholdninger. Da salgsoptioner generelt indikerer negativ stemning, og købsoptioner indikerer positiv stemning, kan vi få en fornemmelse af den overordnede institutionelle stemning ved at plotte forholdet mellem put og kald. Diagrammet til højre viser det historiske put/call-forhold for dette instrument.
Brug af Put/Call Ratio som en indikator for investorernes stemning overvinder en af de vigtigste mangler ved at bruge totalt institutionelt ejerskab, som er, at en betydelig mængde af aktiver under forvaltning investeres passivt for at spore indekser. Passivt forvaltede fonde køber typisk ikke optioner, så indikatoren for put/call-forholdet følger mere nøje følelsen af aktivt forvaltede fonde.
13D/G-arkivering
Vi præsenterer 13D/G ansøgninger separat fra 13F ansøgninger på grund af den forskellige behandling af SEC. 13D/G-ansøgninger kan indgives af grupper af investorer (med én ledende), hvorimod 13F-ansøgninger ikke kan. Dette resulterer i situationer, hvor en investor kan indsende en 13D/G, der rapporterer én værdi for de samlede aktier (der repræsenterer alle de aktier, der ejes af investorgruppen), men derefter indsender en 13F, der rapporterer en anden værdi for de samlede aktier (der udelukkende repræsenterer deres egne) ejendomsret). Det betyder, at aktieejerskab af 13D/G-arkiver og 13F-arkiveringer ofte ikke er direkte sammenlignelige, så vi præsenterer dem separat.
Bemærk: Fra den 16. maj 2021 viser vi ikke længere ejere, der ikke har indsendt en 13D/G inden for det seneste år. Tidligere viste vi den fulde historie af 13D/G-arkiver. Generelt skal enheder, der er forpligtet til at indgive 13D/G-ansøgninger, indgive mindst årligt, før de indsender en afsluttende ansøgning. Dog forlader fonde nogle gange positioner uden at indsende en afsluttende ansøgning (dvs. de afvikler), så visning af den fulde historie resulterede nogle gange i forvirring om det nuværende ejerskab. For at undgå forvirring viser vi nu kun 'aktuelle' ejere - det vil sige - ejere, der har anmeldt inden for det seneste år.
Upgrade to unlock premium data.
13F og NPORT arkivering
Detaljer om 13F-arkivering er gratis. Detaljer om NP-ansøgninger kræver et premium-medlemskab. Grønne rækker angiver nye positioner. Røde rækker angiver lukkede positioner. Klik på linket ikon for at se den fulde transaktionshistorik.
Opgrader
for at låse premium-data op og eksportere til Excel ![]() .
.
| Fil dato | Kilde | Investor | Type | Gennemsnitlig pris (Øst) |
Aktier | Δ Aktier (%) |
Rapporteret Værdi ($1000) |
Δ Værdi (%) |
Port Alloc (%) |
|
|---|---|---|---|---|---|---|---|---|---|---|
| 2026-02-04 | 13F | Brio Consultants, LLC | 42.910 | 49,40 | 1.547 | 49,04 | ||||
| 2026-01-13 | 13F | Trust Point Inc. | 103.945 | -0,36 | 3.748 | -0,64 | ||||
| 2026-01-27 | 13F | Berger Financial Group, Inc | 10.337 | 49,29 | 373 | 48,80 | ||||
| 2025-11-12 | 13F | Accredited Wealth Management, LLC | 298 | -76,81 | 46 | 9,52 | ||||
| 2026-01-29 | 13F | Comerica Bank | 39.830 | 10,81 | 1.436 | 10,55 | ||||
| 2026-02-17 | 13F | Raymond James Financial Inc | 621.234 | 4,85 | 22.402 | 4,56 | ||||
| 2026-01-29 | 13F | UMA Financial Services, Inc. | 535 | -14,13 | 19 | -13,64 | ||||
| 2026-01-29 | 13F | Camelot Portfolios, LLC | 54 | 2 | ||||||
| 2026-02-17 | 13F | Royal Bank Of Canada | 223.733 | 42,63 | 8.069 | 42,26 | ||||
| 2026-02-13 | 13F | Charles Schwab Investment Management Inc | 122.959.346 | 0,90 | 4.433.914 | 0,62 | ||||
| 2026-02-13 | 13F | Smartleaf Asset Management LLC | 599 | 42,96 | 22 | 40,00 | ||||
| 2026-02-13 | 13F | Colony Group, LLC | 89.786 | -2,43 | 3.238 | -2,68 | ||||
| 2026-02-20 | 13F | Waterford Advisors, LLC | 0 | -100,00 | 0 | |||||
| 2026-02-10 | 13F | Envestnet Asset Management Inc | 1.353.682 | 10,86 | 48.814 | 10,55 | ||||
| 2026-01-29 | 13F | LFA - Lugano Financial Advisors SA | 213.157 | -0,35 | 7.686 | -0,62 | ||||
| 2026-02-13 | 13F | Wells Fargo & Company/mn | 1.194.405 | 17.571,33 | 43.070 | 17.551,64 | ||||
| 2026-01-27 | 13F | Waterfront Wealth Inc. | 9.088 | 0,00 | 354 | 7,60 | ||||
| 2026-01-14 | 13F | Verum Partners LLC | 10.479 | 378 | ||||||
| 2026-02-02 | 13F | Eq Wealth Advisors, Llc | 59.870 | -4,86 | 2.159 | -5,14 | ||||
| 2026-02-04 | 13F | Pensionmark Financial Group, Llc | 10.515 | 372 | ||||||
| 2026-02-12 | 13F | CIBC Private Wealth Group, LLC | 83.732 | 700,11 | 3.019 | 698,68 | ||||
| 2026-02-17 | 13F | Cahill Financial Advisors Inc | 46.948 | 1,50 | 1.693 | 1,20 | ||||
| 2026-01-23 | 13F | Farther Finance Advisors, LLC | 28.592 | 121,85 | 1.031 | 121,24 | ||||
| 2026-01-21 | 13F | Capital Investment Advisory Services, LLC | 3.108 | 0,00 | 112 | 0,00 | ||||
| 2026-02-13 | 13F | Victory Capital Management Inc | 2.022.130 | 0,00 | 72.918 | -0,28 | ||||
| 2026-01-20 | 13F | Thurston, Springer, Miller, Herd & Titak, Inc. | 29.256 | 905,02 | 1.055 | 903,81 | ||||
| 2026-02-06 | 13F | Kingdom Financial Group LLC. | 248 | 9 | ||||||
| 2026-02-06 | 13F | Global Retirement Partners, LLC | 14.320 | 200,52 | 516 | 200,00 | ||||
| 2026-02-17 | 13F | Prosperity Bancshares Inc | 75 | 3 | ||||||
| 2026-02-12 | 13F | Wealthspire Advisors, LLC | 0 | -100,00 | 0 | |||||
| 2025-11-04 | 13F | L.m. Kohn & Company | 0 | -100,00 | 0 | |||||
| 2026-02-17 | 13F | Creative Planning | 166.880 | -0,70 | 6.018 | -0,97 | ||||
| 2026-02-10 | 13F | Foundations Investment Advisors, LLC | 5.860 | 211 | ||||||
| 2026-02-11 | 13F | Cerity Partners LLC | 42.590 | 11,88 | 1.536 | 11,56 | ||||
| 2026-02-17 | 13F | SageView Advisory Group, LLC | 9.833 | 4,99 | 355 | 4,73 | ||||
| 2026-02-02 | 13F | Nicholas Hoffman & Company, LLC. | 319.559 | 4,74 | 11.523 | 4,45 | ||||
| 2026-01-07 | 13F | Fragasso Group Inc. | 25.953 | 3,06 | 936 | 2,30 | ||||
| 2026-01-12 | 13F | Rialto Wealth Management, LLC | 162 | 0,00 | 6 | 0,00 | ||||
| 2026-01-29 | 13F | RMG Wealth Management LLC | 0 | -100,00 | 0 | |||||
| 2026-02-13 | 13F | McAdam, LLC | 311.008 | -1,17 | 11.215 | -1,45 | ||||
| 2025-11-14 | 13F | 1832 Asset Management L.P. | 0 | -100,00 | 0 | -100,00 | ||||
| 2026-02-12 | 13F | Colonial Trust Co / SC | 1.147 | -8,61 | 41 | -8,89 | ||||
| 2026-02-13 | 13F | Clearview Wealth Advisors LLC | 12.421 | -4,06 | 448 | -4,49 | ||||
| 2026-01-21 | 13F | Access Financial Services, Inc. | 161.334 | 8,58 | 5.818 | 8,28 | ||||
| 2026-01-28 | 13F | Fairway Wealth LLC | 1.652 | 3,77 | 60 | 3,51 | ||||
| 2026-02-17 | 13F | Cape Investment Advisory, Inc. | 29.374 | 13.013,39 | 1.059 | 13.137,50 | ||||
| 2026-02-13 | 13F | Aptus Capital Advisors, LLC | 5.580 | 1,64 | 201 | 1,52 | ||||
| 2026-02-12 | 13F | Litman Gregory Asset Management LLC | 22.046 | -0,87 | 795 | -1,24 | ||||
| 2026-01-29 | 13F | Concurrent Investment Advisors, LLC | 159.359 | 4,44 | 5.746 | 4,15 | ||||
| 2026-02-06 | 13F | EverSource Wealth Advisors, LLC | 528 | 0,00 | 19 | 0,00 | ||||
| 2026-02-17 | 13F | Tower Research Capital LLC (TRC) | 31 | 106,67 | 1 | |||||
| 2026-02-13 | 13F | SYM FINANCIAL Corp | 1.066 | 0,00 | 38 | 0,00 | ||||
| 2026-03-04 | 13F | SHP Wealth Management | 7.411 | 267 | ||||||
| 2026-02-12 | 13F | Bank Of Montreal /can/ | 18.831 | 41,89 | 679 | 41,75 | ||||
| 2026-02-04 | 13F | Atlantic Union Bankshares Corp | 380 | 3,83 | 14 | 0,00 | ||||
| 2026-01-29 | 13F | UBS Group AG | 564.918 | 2,29 | 20.371 | 2,01 | ||||
| 2026-01-29 | 13F | Resonant Capital Advisors, LLC | 639.617 | 11,09 | 23.065 | 10,79 | ||||
| 2026-01-12 | 13F | Certified Advisory Corp | 6.366 | 12,45 | 230 | 12,25 | ||||
| 2026-02-13 | 13F | MorganRosel Wealth Management, LLC | 26.432 | 12,51 | 953 | 12,25 | ||||
| 2026-01-07 | 13F | Retirement Wealth Solutions LLC | 150 | 0,00 | 5 | 0,00 | ||||
| 2025-11-12 | 13F | CIBC Bancorp USA Inc. | 10.465 | 378 | ||||||
| 2026-02-13 | 13F | Integrity Financial Corp /WA | 2.799 | 0,00 | 101 | -0,99 | ||||
| 2026-01-14 | 13F | Wolff Wiese Magana Llc | 175 | 0,00 | 6 | 0,00 | ||||
| 2025-10-21 | 13F | Vishria Bird Financial Group, LLC | 17.172 | 0,00 | 621 | 9,54 | ||||
| 2026-01-20 | 13F | Aspiriant, Llc | 542.249 | -13,11 | 19.554 | -13,36 | ||||
| 2026-02-13 | 13F | Sei Investments Co | 6.595 | 238 | ||||||
| 2026-01-22 | 13F | Maseco Llp | 3.247 | 117 | ||||||
| 2026-02-17 | 13F | Jones Financial Companies Lllp | 68.366 | 29,65 | 2.465 | 30,42 | ||||
| 2026-02-09 | 13F | Hartland & Co., LLC | 3.607 | -0,66 | 130 | -0,76 | ||||
| 2026-01-30 | 13F | Kohmann Bosshard Financial Services, LLC | 290 | 10 | ||||||
| 2026-02-17 | 13F | Fmr Llc | 16.575.656 | -4,63 | 597.718 | -4,90 | ||||
| 2025-10-28 | 13F | First National Corp /ma/ /adv | 42.271 | 0,00 | 1.535 | 9,96 | ||||
| 2026-01-22 | 13F | Glass Jacobson Investment Advisors llc | 2.312 | 1.292,77 | 83 | 1.283,33 | ||||
| 2026-02-10 | 13F | Operose Advisors LLC | 1.424 | 0,00 | 51 | 0,00 | ||||
| 2026-01-05 | 13F | Noble Wealth Management PBC | 540 | 0,00 | 19 | 0,00 | ||||
| 2026-01-09 | 13F | Charles Schwab Trust Co | 400.759 | 3,58 | 14.451 | 3,30 | ||||
| 2026-01-13 | 13F | Kathmere Capital Management, LLC | 373.500 | 3,83 | 13.468 | 3,54 | ||||
| 2026-02-23 | 13F | Beaird Harris Wealth Management, LLC | 52 | 0,00 | 2 | 0,00 | ||||
| 2026-02-27 | 13F | Compass Financial Services Inc | 0 | -100,00 | 0 | |||||
| 2026-01-27 | 13F | Financial Management Professionals, Inc. | 84 | -4,55 | 3 | 0,00 | ||||
| 2026-01-14 | 13F | Barnes Dennig Private Wealth Management LLC | 364 | 13 | ||||||
| 2026-02-10 | 13F | IAG Wealth Partners, LLC | 43 | 0,00 | 2 | 0,00 | ||||
| 2026-02-17 | 13F | Quantinno Capital Management LP | 61.362 | 94,37 | 2.213 | 93,87 | ||||
| 2026-01-21 | 13F | Perfromance Wealth Partners, LLC | 50.510 | 54,44 | 1.821 | 54,06 | ||||
| 2026-02-10 | 13F | Seven Springs Wealth Group, LLC | 453.711 | 3,92 | 16.361 | 3,63 | ||||
| 2026-01-23 | 13F | Creative Capital Management Investments LLC | 232 | 8 | ||||||
| 2026-02-17 | 13F | Gallagher Fiduciary Advisors, LLC | 9.021 | 43,37 | 325 | 43,17 | ||||
| 2026-02-17 | 13F | Advisor Group Holdings, Inc. | 1.086.047 | 27,91 | 39.167 | 29,27 | ||||
| 2026-02-19 | 13F | CI Private Wealth, LLC | 29.761 | 108,81 | 1.073 | 108,35 | ||||
| 2026-02-17 | 13F | Quadrature Capital Ltd | 10.435 | 376 | ||||||
| 2026-01-21 | 13F | Kaizen Financial Strategies | 49.560 | -1,32 | 1.787 | -3,61 | ||||
| 2026-02-09 | 13F | Allen Capital Group, LLC | 95.641 | -1,93 | 3.449 | -2,21 | ||||
| 2026-01-20 | 13F | Austin Private Wealth, LLC | 30.683 | 0,00 | 1.106 | -0,27 | ||||
| 2026-02-13 | 13F | National Bank Of Canada /fi/ | 110.651 | -6,23 | 3.991 | -6,42 | ||||
| 2026-02-12 | 13F | Brinker Capital Investments, LLC | 141.478 | 6,35 | 5.102 | 6,05 | ||||
| 2026-02-09 | 13F | Hantz Financial Services, Inc. | 496 | 237,41 | 0 | |||||
| 2026-02-13 | 13F | Solstein Capital, LLC | 49 | 0,00 | 2 | 0,00 | ||||
| 2026-01-30 | 13F | Us Bancorp \de\ | 7.021 | 12,62 | 253 | 12,44 | ||||
| 2025-11-12 | 13F | Transce3nd, LLC | 0 | -100,00 | 0 | -100,00 | ||||
| 2026-02-18 | 13F | EP Wealth Advisors, Inc. | 214.010 | -30,12 | 7.717 | -23,66 | ||||
| 2026-01-07 | 13F | Central Pacific Bank - Trust Division | 3 | 0,00 | 0 | |||||
| 2026-01-16 | 13F | Tempus Wealth Planning, LLC | 15.513 | 2,40 | 559 | 2,19 | ||||
| 2026-01-09 | 13F | Zrc Wealth Management, Llc | 3.720 | 2,62 | 134 | 2,29 | ||||
| 2026-01-22 | 13F | Systelligence, LLC | 0 | -100,00 | 0 | |||||
| 2026-02-02 | 13F | Millstone Evans Group, LLC | 3.303 | 119 | ||||||
| 2026-01-30 | 13F | Wealth Forward, LLC | 176.303 | 0,88 | 6.357 | 0,60 | ||||
| 2026-02-04 | 13F | D'Orazio & Associates, Inc. | 7.431 | 0,00 | 268 | -0,37 | ||||
| 2026-01-23 | 13F | Brown, Lisle/cummings, Inc. | 50 | 0,00 | 2 | 0,00 | ||||
| 2026-02-13 | 13F | Palisade Asset Management, LLC | 0 | -100,00 | 0 | |||||
| 2026-01-13 | 13F | Synergy Financial Management, LLC | 27.705 | -71,04 | 999 | -69,64 | ||||
| 2026-01-26 | 13F | BCS Wealth Management | 74.359 | 206,22 | 2.681 | 205,35 | ||||
| 2026-02-11 | 13F | Ackerman Capital Advisors, LLC | 44.525 | -0,35 | 1.606 | -0,62 | ||||
| 2026-02-02 | 13F | Forza Wealth Management, LLC | 27.714 | 0,00 | 999 | -0,30 | ||||
| 2026-01-12 | 13F | CVA Family Office, LLC | 374.098 | 34,63 | 13.490 | 34,25 | ||||
| 2026-02-13 | 13F | Vivaldi Capital Management, LLC | 71.178 | 9,04 | 2.567 | 8,73 | ||||
| 2026-01-20 | 13F | Essex LLC | 158.129 | 1,76 | 5.702 | 1,48 | ||||
| 2026-02-13 | 13F | Advyzon Investment Management, LLC | 8.797 | 35,23 | 317 | 34,89 | ||||
| 2026-02-03 | 13F | McIlrath & Eck, LLC | 135 | 3,85 | 5 | 0,00 | ||||
| 2025-10-16 | 13F | Lowe Wealth Advisors, LLC | 43 | 2 | ||||||
| 2026-01-12 | 13F | Focus Financial Network, Inc. | 25.345 | 4,48 | 914 | 4,10 | ||||
| 2026-01-29 | 13F | Concord Wealth Partners | 72.663 | 2,87 | 2.620 | 2,58 | ||||
| 2026-02-02 | 13F | Breakwater Investment Management | 2.236 | 0,00 | 81 | 0,00 | ||||
| 2026-02-12 | 13F | Index Technologies Group LLC | 39.359 | 1.419 | ||||||
| 2025-11-13 | 13F | Goodman Advisory Group, LLC | 0 | 0 | ||||||
| 2026-01-13 | 13F | Mather Group, Llc. | 0 | -100,00 | 0 | |||||
| 2026-02-12 | 13F | Chilton Capital Management Llc | 313.614 | -0,23 | 11.309 | -0,51 | ||||
| 2026-01-13 | 13F | LongView Wealth Management | 7.637 | 287 | ||||||
| 2026-02-13 | 13F | Creekside Partners | 29.363 | 3,23 | 1.059 | 2,92 | ||||
| 2026-02-09 | 13F | Smithfield Trust Co | 2.233 | 0,00 | 0 | |||||
| 2025-11-12 | 13F | Cresset Asset Management, LLC | 7.006 | 253 | ||||||
| 2026-02-06 | 13F | Pnc Financial Services Group, Inc. | 0 | -100,00 | 0 | |||||
| 2026-02-13 | 13F | Pin Oak Investment Advisors Inc | 1.374 | 0,00 | 0 | -100,00 | ||||
| 2026-02-13 | 13F | Ubs Asset Management Americas Inc | 808 | 29 | ||||||
| 2026-01-28 | 13F | Geneos Wealth Management Inc. | 673 | 0,00 | 24 | 0,00 | ||||
| 2026-01-22 | 13F | Alpha Omega Wealth Management LLC | 129.208 | 0,58 | 4.659 | 0,30 | ||||
| 2026-01-23 | 13F | DHJJ Financial Advisors, Ltd. | 560 | 0,00 | 20 | 0,00 | ||||
| 2026-02-10 | 13F | Savant Capital, LLC | 176.033 | -4,63 | 6.348 | -4,90 | ||||
| 2026-02-05 | 13F | Sculati Wealth Management, LLC | 58.763 | -18,56 | 2.119 | -18,82 | ||||
| 2025-11-13 | 13F | Glenmede Investment Management, LP | 4.947 | -11,25 | 179 | -2,73 | ||||
| 2026-01-20 | 13F | Stratos Wealth Partners, LTD. | 21.297 | 6,18 | 768 | 5,79 | ||||
| 2026-02-03 | 13F | Golden Bell Financial Planning LLC | 8.111 | 0,00 | 292 | -0,34 | ||||
| 2026-02-05 | 13F | 1620 Investment Advisors, Inc. | 379 | 0,00 | 14 | 0,00 | ||||
| 2026-02-13 | 13F | Financial Freedom, LLC | 9.891 | 31,35 | 357 | 30,88 | ||||
| 2026-02-09 | 13F | HBK Sorce Advisory LLC | 0 | -100,00 | 0 | |||||
| 2026-02-11 | 13F | Shared Vision Wealth Group LLC | 6.794 | 0,00 | 265 | 7,32 | ||||
| 2026-01-08 | 13F | Fermata Advisors, LLC | 107.149 | 0,70 | 3.864 | 0,42 | ||||
| 2026-02-05 | 13F | Mission Wealth Management, Lp | 29.478 | -14,44 | 1.063 | -14,70 | ||||
| 2026-01-27 | 13F | Aspiring Ventures, LLC | 12.840 | -2,65 | 463 | -2,73 | ||||
| 2026-01-13 | 13F | Balanced Wealth Group Llc | 292.548 | 10.622 | ||||||
| 2026-02-11 | 13F | First Command Advisory Services, Inc. | 537 | 0,00 | 19 | 0,00 | ||||
| 2026-02-03 | 13F | Legacy Wealth Managment, LLC/ID | 37 | 1 | ||||||
| 2026-01-14 | 13F | Embree Financial Group | 133.367 | 93,12 | 4.809 | 92,59 | ||||
| 2026-01-22 | 13F | Red Tortoise LLC | 62.926 | 3,33 | 2.269 | 3,04 | ||||
| 2026-01-22 | 13F | HHM Wealth Advisors, LLC | 432.499 | -3,66 | 15.596 | -3,93 | ||||
| 2026-01-21 | 13F | Future Financial Wealth Managment LLC | 0 | -100,00 | 0 | |||||
| 2026-01-29 | 13F | TBH Global Asset Management, LLC | 0 | -100,00 | 0 | |||||
| 2025-10-31 | 13F | Avantax Planning Partners, Inc. | 0 | -100,00 | 0 | |||||
| 2026-01-20 | 13F | Ethos Financial Group, LLC | 39.442 | 1.422 | ||||||
| 2026-01-15 | 13F | SILVER OAK SECURITIES, Inc | 104.141 | 2,87 | 3.766 | 2,87 | ||||
| 2026-01-08 | 13F | Moller Financial Services | 353.644 | -3,50 | 12.752 | -3,77 | ||||
| 2026-02-03 | 13F | Cheviot Value Management, LLC | 129.165 | -0,38 | 5.151 | 6,60 | ||||
| 2026-02-12 | 13F | Moneta Group Investment Advisors Llc | 7.793 | 281 | ||||||
| 2026-02-13 | 13F | Kayne Anderson Rudnick Investment Management Llc | 632 | 0,00 | 23 | 0,00 | ||||
| 2026-02-13 | 13F | Saxon Interests, Inc. | 13.595 | -0,18 | 490 | 4,48 | ||||
| 2026-02-03 | 13F | International Assets Investment Management, Llc | 196 | 7 | ||||||
| 2026-02-11 | 13F | Nemes Rush Group LLC | 30 | 1 | ||||||
| 2026-02-13 | 13F | Baird Financial Group, Inc. | 105.617 | 12,74 | 3.809 | 12,43 | ||||
| 2026-01-15 | 13F | Highline Wealth Partners Llc | 0 | -100,00 | 0 | |||||
| 2026-02-17 | 13F | Ballast Financial Advisors LLC | 7.508 | 271 | ||||||
| 2026-02-12 | 13F | BlackRock, Inc. | 11.154 | -1,83 | 402 | -1,95 | ||||
| 2026-02-06 | 13F | BOK Financial Private Wealth, Inc. | 0 | -100,00 | 0 | |||||
| 2026-02-17 | 13F | Warren Averett Asset Management, LLC | 79.203 | -0,73 | 2.856 | -1,01 | ||||
| 2025-11-07 | 13F | Synovus Financial Corp | 93.889 | 3.395 | ||||||
| 2026-02-17 | 13F | TCG Advisory Services, LLC | 10.596 | 8,00 | 382 | 7,91 | ||||
| 2026-01-26 | 13F | Phillips Financial Management, Llc | 745 | 27 | ||||||
| 2026-02-17 | 13F | Abel Hall, LLC | 13.946 | -2,10 | 503 | -2,52 | ||||
| 2026-01-30 | 13F | Simplicity Wealth,LLC | 133.279 | 6,82 | 4.806 | 6,54 | ||||
| 2025-11-06 | 13F | CENTRAL TRUST Co | 0 | -100,00 | 0 | |||||
| 2026-02-12 | 13F | Mark Sheptoff Financial Planning, Llc | 254 | 0,00 | 9 | 0,00 | ||||
| 2026-02-20 | 13F | Sunbelt Securities, Inc. | 270 | 10 | ||||||
| 2026-02-02 | 13F | Riverchase Wealth Management, Llc | 17.041 | 0,00 | 614 | -0,32 | ||||
| 2025-10-20 | 13F | Mid-American Wealth Advisory Group, Inc. | 0 | -100,00 | 0 | |||||
| 2026-01-20 | 13F | AdvisorNet Financial, Inc | 8.959 | 8,21 | 323 | 8,03 | ||||
| 2026-02-02 | 13F | Oak Harbor Wealth Partners, Llc | 71 | 0,00 | 3 | 0,00 | ||||
| 2026-01-22 | 13F | Financial Consulate, Inc | 441.510 | 15.921 | ||||||
| 2025-10-06 | 13F | Von Berge Wealth Management Group, LLC | 0 | -100,00 | 0 | |||||
| 2026-02-17 | 13F | Cetera Investment Advisers | 257.393 | 10,76 | 9.282 | 10,45 | ||||
| 2026-01-15 | 13F | Pinnacle Wealth Management, LLC | 7.307 | 3,13 | 263 | 2,73 | ||||
| 2026-02-11 | 13F | Coastwise Capital Group, LLC | 9.055 | 3,20 | 327 | 2,84 | ||||
| 2026-02-11 | 13F | LPL Financial LLC | 452.853 | 7,94 | 16.330 | 7,64 | ||||
| 2026-02-12 | 13F | Steward Partners Investment Advisory, Llc | 7.376 | 9,70 | 266 | 9,05 | ||||
| 2026-01-29 | 13F | Dunhill Financial, LLC | 404 | 0,00 | 15 | 0,00 | ||||
| 2026-02-12 | 13F | Triumph Capital Management | 1.266 | 0,08 | 46 | 0,00 | ||||
| 2026-02-09 | 13F | Westover Capital Advisors, LLC | 153.512 | 3,61 | 5.536 | 3,32 | ||||
| 2026-01-22 | 13F | Bartlett & Co. Wealth Management Llc | 706 | -19,95 | 25 | -19,35 | ||||
| 2026-02-17 | 13F | Qube Research & Technologies Ltd | 181 | -99,70 | 7 | -99,73 | ||||
| 2026-01-21 | 13F | Capital Advisors Wealth Management, LLC | 6.989 | 252 | ||||||
| 2026-02-17 | 13F | Equitable Holdings, Inc. | 9.850 | 355 | ||||||
| 2026-01-29 | 13F | Quent Capital, LLC | 85 | 3 | ||||||
| 2025-11-14 | 13F | Citadel Advisors Llc | 0 | -100,00 | 0 | |||||
| 2026-02-11 | 13F | Clarity Retirement & Wealth, LLC | 25.457 | 918 | ||||||
| 2026-01-14 | 13F | Guardian Financial Partners, LLC | 34.252 | 5,88 | 1.235 | 5,65 | ||||
| 2026-02-05 | 13F | Gibson Capital, LLC | 19.078 | 0,00 | 688 | -0,29 | ||||
| 2026-02-13 | 13F | Ieq Capital, Llc | 15.480 | 558 | ||||||
| 2026-01-23 | 13F | Intelligence Driven Advisers, LLC | 6.197 | -3,05 | 223 | -3,46 | ||||
| 2026-02-10 | 13F | Crescent Grove Advisors, LLC | 6.245 | 0,00 | 225 | 0,00 | ||||
| 2026-02-13 | 13F | Resources Investment Advisors, LLC. | 8.231 | 8,79 | 297 | 8,42 | ||||
| 2026-02-10 | 13F | IFG Advisory, LLC | 231.802 | 8.359 | ||||||
| 2026-02-12 | 13F | Summit Financial, LLC | 54.109 | 25,69 | 1.951 | 25,39 | ||||
| 2026-01-12 | 13F | Abound Wealth Management | 2.580 | 15,70 | 93 | 16,25 | ||||
| 2026-02-17 | 13F | Old Mission Capital Llc | 64.390 | 2.322 | ||||||
| 2026-02-14 | 13F | Rockefeller Capital Management L.P. | 27.592 | -1,99 | 995 | -2,26 | ||||
| 2026-02-10 | 13F | Root Financial Partners, LLC | 13.675 | 29,82 | 493 | 29,74 | ||||
| 2026-02-11 | 13F | Janney Montgomery Scott LLC | 91.073 | 23,72 | 3 | 50,00 | ||||
| 2026-01-14 | 13F | Jfs Wealth Advisors, Llc | 200 | 3,63 | 7 | 16,67 | ||||
| 2025-09-26 | NP | MSTSX - Morningstar Unconstrained Allocation Fund | 561.672 | 14,00 | 18.754 | 26,47 | ||||
| 2026-01-30 | 13F | Exencial Wealth Advisors, Llc | 281.224 | -1,00 | 10.141 | -1,28 | ||||
| 2026-02-03 | 13F | Cabot Wealth Management Inc | 345.642 | 6,40 | 12.464 | 6,10 | ||||
| 2026-01-22 | 13F | Lee Financial Co | 25.068 | -1,38 | 904 | -1,74 | ||||
| 2026-01-16 | 13F | West Branch Capital LLC | 185 | 0,00 | 7 | 0,00 | ||||
| 2026-02-11 | 13F | Jpmorgan Chase & Co | 288.279 | 20,45 | 10.395 | 20,12 | ||||
| 2026-01-15 | 13F | Foster & Motley Inc | 1.264.195 | -1,14 | 46 | -2,17 | ||||
| 2026-01-06 | 13F | Collective Family Office Llc | 69.098 | 3,45 | 2.492 | 3,15 | ||||
| 2026-02-02 | 13F | Balentine LLC | 15.147 | 0,00 | 546 | -0,18 | ||||
| 2026-01-30 | 13F | Mogy Joel R Investment Counsel Inc | 47 | 0,00 | 2 | 0,00 | ||||
| 2026-02-11 | 13F | MCF Advisors LLC | 3.702 | 42,82 | 133 | 43,01 | ||||
| 2026-01-27 | 13F | WealthCollab, LLC | 5.239 | 7.960,00 | 189 | 9.300,00 | ||||
| 2026-02-09 | 13F | Harbour Investments, Inc. | 4.837 | -34,82 | 174 | -35,07 | ||||
| 2026-02-17 | 13F | Modern Wealth Management, LLC | 45.744 | -0,28 | 1.650 | -0,54 | ||||
| 2026-02-04 | 13F | Naples Global Advisors, Llc | 7.710 | 0,00 | 278 | 0,00 | ||||
| 2026-02-13 | 13F | Golden State Wealth Management, LLC | 160 | 0,63 | 6 | 0,00 | ||||
| 2025-10-15 | 13F | Sagace Wealth Management LLC | 0 | -100,00 | 0 | |||||
| 2026-01-21 | 13F | Walkner Condon Financial Advisors LLC | 18.194 | 21,13 | 656 | 20,81 | ||||
| 2026-02-17 | 13F | Advisory Services Network, LLC | 78.867 | 6,58 | 2.844 | 6,28 | ||||
| 2026-01-16 | 13F | Trust Co Of Vermont | 81 | 0,00 | 3 | 0,00 | ||||
| 2026-02-17 | 13F | Mpwm Advisory Solutions, Llc | 0 | -100,00 | 0 | |||||
| 2026-02-10 | 13F | Lido Advisors, LLC | 12.397 | 10,66 | 448 | 10,62 | ||||
| 2026-02-10 | 13F | Cherry Tree Wealth Management, LLC | 316 | 0,00 | 11 | 0,00 | ||||
| 2026-01-09 | 13F | Breakwater Capital Group | 35.679 | 2,43 | 1.287 | 2,14 | ||||
| 2025-11-04 | 13F | Jackson Creek Investment Advisors LLC | 0 | -100,00 | 0 | |||||
| 2026-02-13 | 13F | Sofos Investments, Inc. | 37 | 0,00 | 1 | 0,00 | ||||
| 2026-02-12 | 13F | Colonial Trust Advisors | 9.785 | 0,00 | 353 | -0,28 | ||||
| 2026-02-06 | 13F | HighTower Advisors, LLC | 364.132 | 539,23 | 13.131 | 537,69 | ||||
| 2026-01-30 | 13F | Capital Developers, LLC | 123.784 | 4.464 | ||||||
| 2026-02-06 | 13F | Addison Advisors LLC | 100 | 0,00 | 4 | 0,00 | ||||
| 2025-10-02 | 13F | Investors Research Corp | 0 | -100,00 | 0 | |||||
| 2026-02-11 | 13F | Symphony Financial, Ltd. Co. | 5.874 | 212 | ||||||
| 2026-02-03 | 13F | Ballast Advisors Llc | 663 | 24 | ||||||
| 2026-02-17 | 13F | McCartney Wealth Management LLC | 6.354 | 229 | ||||||
| 2026-02-11 | 13F | Brand Asset Management Group, Inc. | 22.298 | -21,41 | 804 | -21,56 | ||||
| 2026-01-28 | 13F | Kingswood Wealth Advisors, Llc | 11.279 | -7,25 | 407 | -7,52 | ||||
| 2026-01-15 | 13F | Hengehold Capital Management Llc | 40.471 | 0,00 | 1.459 | -0,27 | ||||
| 2026-02-12 | 13F | Hamilton Point Investment Advisors, LLC | 835 | 0,00 | 30 | 0,00 | ||||
| 2026-01-13 | 13F | Parsons Capital Management Inc/ri | 9.291 | -2,46 | 335 | -2,62 | ||||
| 2026-02-12 | 13F | Federation des caisses Desjardins du Quebec | 0 | -100,00 | 0 | |||||
| 2026-01-21 | 13F | SJS Investment Consulting Inc. | 538 | 0,00 | 19 | 0,00 | ||||
| 2025-10-22 | 13F | Motco | 0 | -100,00 | 0 | |||||
| 2026-02-17 | 13F | Price Financial Group Wealth Management, Inc | 6.143 | 234 | ||||||
| 2026-02-02 | 13F | Qrg Capital Management, Inc. | 23.684 | 8,01 | 854 | 7,83 | ||||
| 2026-02-06 | 13F | IFP Advisors, Inc | 35.994 | 24,78 | 1.298 | 24,35 | ||||
| 2026-01-07 | 13F | CWA Asset Management Group, LLC | 6.695 | 13,42 | 241 | 13,15 | ||||
| 2025-11-14 | 13F/A | NorthRock Partners, LLC | 0 | -100,00 | 0 | |||||
| 2026-02-09 | 13F | Integrity Alliance, Llc. | 7.689 | 22,18 | 277 | 22,03 | ||||
| 2026-01-29 | 13F | Index Fund Advisors, Inc. | 17.777 | 1,57 | 641 | 1,42 | ||||
| 2026-02-05 | 13F | Johnson & White Wealth Management, LLC | 44.611 | -2,83 | 1.609 | -3,13 | ||||
| 2026-02-13 | 13F | Morgan Stanley | 4.079.189 | 45,78 | 147.096 | 45,38 | ||||
| 2026-02-17 | 13F | Russell Investments Group, Ltd. | 1.046 | 0,58 | 38 | 0,00 | ||||
| 2026-02-18 | 13F | Beacon Pointe Advisors, LLC | 43.183 | 9,16 | 1.557 | 8,88 | ||||
| 2026-02-12 | 13F | Founders Financial Alliance, LLC | 95 | -94,50 | 3 | -95,16 | ||||
| 2026-01-26 | 13F | Asset Dedication, LLC | 204.549 | -1,35 | 7.376 | -1,61 | ||||
| 2026-02-18 | 13F | GWM Advisors LLC | 969 | -81,63 | 35 | -82,11 | ||||
| 2026-01-23 | 13F | Valley National Advisers Inc | 716 | -10,72 | 0 | |||||
| 2026-02-10 | 13F | McGrath & Associates, Inc. | 39.100 | 1,46 | 1.410 | 1,15 | ||||
| 2026-01-21 | 13F | Flagship Harbor Advisors, Llc | 1.326 | 48 | ||||||
| 2026-02-17 | 13F | Main Street Financial Solutions, LLC | 40.990 | 25,66 | 1.478 | 25,36 | ||||
| 2026-01-13 | 13F | 21 West Wealth Management LLC | 37.007 | 0,66 | 1.334 | 0,38 | ||||
| 2026-02-10 | 13F | Bank of New York Mellon Corp | 19.552 | 1,34 | 705 | 1,15 | ||||
| 2026-01-09 | 13F | Appleton Partners Inc/ma | 7.252 | 0,00 | 0 | |||||
| 2026-01-12 | 13F | Salem Investment Counselors Inc | 0 | -100,00 | 0 | |||||
| 2026-01-15 | 13F | Brookstone Capital Management | 6.439 | 232 | ||||||
| 2026-02-13 | 13F | Perspective Wealth Advisors Llc | 151.800 | 5.474 | ||||||
| 2026-01-22 | 13F | Apollon Wealth Management, LLC | 122.685 | 0,65 | 4.424 | 0,39 | ||||
| 2026-02-12 | 13F | Brown Brothers Harriman & Co | 44.168 | 2,00 | 1.593 | 1,73 | ||||
| 2026-01-14 | 13F | First County Bank /CT/ | 10.703 | 0,00 | 386 | -0,52 | ||||
| 2026-02-12 | 13F | Great Valley Advisor Group, Inc. | 0 | -100,00 | 0 | |||||
| 2026-02-17 | 13F | WFA of San Diego, LLC | 0 | -100,00 | 0 | |||||
| 2026-01-21 | 13F | Townsend Asset Management Corp /nc/ /adv | 2.193 | -2,92 | 79 | -2,47 | ||||
| 2026-01-16 | 13F | PFS Partners, LLC | 1.117 | 4,69 | 40 | 5,26 | ||||
| 2026-01-30 | 13F | Wealthfront Advisers Llc | 27.013 | 8,63 | 974 | 8,34 | ||||
| 2026-02-12 | 13F | Renaissance Technologies Llc | 29.600 | 1.067 | ||||||
| 2026-02-13 | 13F | Stifel Financial Corp | 82.954 | 16,66 | 2.991 | 16,34 | ||||
| 2026-01-20 | 13F | Signaturefd, Llc | 3.320 | 0,00 | 120 | -0,83 | ||||
| 2026-02-10 | 13F | Tandem Financial, LLC | 0 | -100,00 | 0 | |||||
| 2026-01-16 | 13F | Ronald Blue Trust, Inc. | 18 | -99,35 | 1 | -100,00 | ||||
| 2026-01-12 | 13F | Foster Group, Inc. | 18.881 | 4,59 | 681 | 4,29 | ||||
| 2026-02-10 | 13F | Hazlett, Burt & Watson, Inc. | 1.155 | 213,01 | 0 | |||||
| 2026-02-11 | 13F | SOUTH STATE Corp | 12.894 | -14,91 | 465 | -15,17 | ||||
| 2025-11-10 | 13F | Alerus Financial Na | 0 | -100,00 | 0 | |||||
| 2026-01-30 | 13F | Archer Investment Corp | 265 | -29,89 | 10 | -30,77 | ||||
| 2026-02-09 | 13F | Huntington National Bank | 89 | -17,76 | ||||||
| 2026-01-14 | 13F | Bond & Devick Financial Network, Inc. | 15.080 | 0,00 | 544 | -0,37 | ||||
| 2026-01-26 | 13F | Harbor Asset Planning, Inc. | 675 | 3,69 | 24 | 4,35 | ||||
| 2026-02-12 | 13F | Cutler Investment Counsel Llc | 30.729 | 5,69 | 1.108 | 5,42 | ||||
| 2026-01-20 | 13F | Savvy Advisors, Inc. | 11.691 | 2,68 | 422 | 2,43 | ||||
| 2026-02-13 | 13F | FF Advisors,LLC | 50.972 | -0,63 | 1.838 | -0,86 | ||||
| 2026-02-09 | 13F | Frazier Financial Advisors, LLC | 4.745 | 5,00 | 171 | 4,91 | ||||
| 2025-11-17 | 13F | FSA Wealth Management LLC | 87 | 0,00 | 3 | 50,00 | ||||
| 2026-01-30 | 13F | Activest Wealth Management | 2.837 | 102 | ||||||
| 2026-02-11 | 13F | Vermillion Wealth Management, Inc. | 3.869 | 179,75 | 140 | 178,00 | ||||
| 2026-01-20 | 13F | Pflug Koory, LLC | 799 | 0,00 | 29 | 0,00 | ||||
| 2026-02-13 | 13F | Kestra Advisory Services, LLC | 0 | -100,00 | 0 | |||||
| 2026-01-15 | 13F | ERn Financial, LLC | 62.275 | 4,93 | 2.246 | 4,61 | ||||
| 2026-01-26 | 13F | Prairiewood Capital, LLC | 337.231 | 5,76 | 12.161 | 5,47 | ||||
| 2025-11-05 | 13F | Concord Asset Management, LLC/VA | 0 | -100,00 | 0 | |||||
| 2026-01-23 | 13F | Optima Capital Llc | 62 | 2 | ||||||
| 2026-02-05 | 13F | Bedminster, LLC | 6.755 | 244 | ||||||
| 2025-10-30 | 13F | Twin Peaks Wealth Advisors, LLC | 0 | -100,00 | 0 | |||||
| 2026-01-21 | 13F | Unison Advisors LLC | 998.564 | 2,53 | 36.008 | 2,25 | ||||
| 2026-02-13 | 13F | Y-Intercept (Hong Kong) Ltd | 28.026 | 0,00 | 1.011 | -0,30 | ||||
| 2026-02-13 | 13F/A | New England Private Wealth Advisors LLC | 7.367 | 3,35 | 266 | 3,11 | ||||
| 2026-01-26 | 13F | Paradigm Financial Partners, Llc | 28.015 | -0,20 | 1.010 | -0,39 | ||||
| 2026-02-03 | 13F | Sequoia Financial Advisors, LLC | 23.087 | 8,60 | 833 | 8,33 | ||||
| 2026-01-14 | 13F | Eastern Bank | 0 | -100,00 | 0 | |||||
| 2026-01-29 | 13F | Traub Capital Management LLC | 18.197 | 6,35 | 656 | 6,15 | ||||
| 2026-02-11 | 13F | IMA Wealth, Inc. | 118 | 0,00 | 4 | 0,00 | ||||
| 2026-01-08 | 13F | Occidental Asset Management, LLC | 49.643 | -0,40 | 1.790 | -0,67 | ||||
| 2026-01-14 | 13F | Centurion Wealth Management LLC | 57.412 | 0,16 | 2.070 | -0,10 | ||||
| 2026-01-28 | 13F | Hoey Investments, Inc | 1.422 | 0,00 | 51 | 0,00 | ||||
| 2026-02-19 | 13F | Mcguire Capital Advisors Inc | 40 | 1 | ||||||
| 2026-02-02 | 13F | CX Institutional | 346 | 3,59 | 0 | |||||
| 2026-02-24 | 13F | Bell Investment Advisors, Inc | 216.567 | 2,28 | 7.809 | 2,00 | ||||
| 2026-02-12 | 13F | Quadrant Capital Group Llc | 6.241 | 0,00 | 225 | 0,00 | ||||
| 2026-01-08 | 13F | Versant Capital Management, Inc | 3.172 | -64,95 | 114 | -65,14 | ||||
| 2026-02-13 | 13F | MAI Capital Management | 160.630 | 21,12 | 5.792 | 20,79 | ||||
| 2026-03-05 | 13F | Gunpowder Capital Management, LLC dba Oliver Wealth Management | 219 | 8 | ||||||
| 2026-02-02 | 13F | Fifth Third Bancorp | 3.826 | 138 | ||||||
| 2026-02-11 | 13F | Empowered Funds, LLC | 555 | -99,35 | 20 | -99,35 | ||||
| 2026-02-02 | 13F | Ashton Thomas Securities, Llc | 2.514 | 49,29 | 91 | 50,00 | ||||
| 2026-01-28 | 13F | Davidson Kahn Capital Management, LLC | 20.966 | 0,53 | 756 | 0,27 | ||||
| 2026-02-09 | 13F | Morris Financial Concepts, Inc. | 2.768 | -1,98 | 100 | -2,94 | ||||
| 2026-02-09 | 13F | Leavell Investment Management, Inc. | 84.597 | 10,38 | 3.051 | 10,07 | ||||
| 2026-01-26 | 13F | Abbington Investment Group | 165.014 | 11,64 | 5.950 | 11,34 | ||||
| 2026-01-28 | 13F | Chicago Partners Investment Group LLC | 0 | -100,00 | 0 | |||||
| 2026-02-11 | 13F | Greykasell Wealth Strategies, Inc. | 135 | 0,00 | 5 | 0,00 | ||||
| 2026-01-08 | 13F | Wealth Enhancement Advisory Services, Llc | 136.061 | 8,89 | 5.066 | 12,31 | ||||
| 2025-11-13 | 13F | Total Investment Management Inc | 0 | -100,00 | 0 | |||||
| 2026-01-23 | 13F | Freestone Capital Holdings, LLC | 8.271 | 0,00 | 298 | -0,33 | ||||
| 2026-03-02 | 13F | Sankala Group LLC | 13.623 | 549 | ||||||
| 2025-10-24 | 13F | Bristlecone Advisors, LLC | 0 | -100,00 | 0 | |||||
| 2026-02-10 | 13F | SCS Capital Management LLC | 37.373 | -4,13 | 1.348 | -4,40 | ||||
| 2026-02-11 | 13F | Parallel Advisors, LLC | 8.403 | 0,43 | 303 | 0,33 | ||||
| 2026-02-17 | 13F | Susquehanna International Group, Llp | 1.146.566 | 41.345 | ||||||
| 2026-03-05 | 13F | Bayban | 185 | 7 | ||||||
| 2026-02-04 | 13F | Independent Advisor Alliance | 23.415 | 304,54 | 844 | 303,83 | ||||
| 2026-01-29 | 13F | Directional Asset Management | 5.765 | 208 | ||||||
| 2026-02-17 | 13F | Pinnacle Financial Partners, Inc. | 95.907 | 3.459 | ||||||
| 2026-02-05 | 13F | Tucker Asset Management Llc | 501 | 18 | ||||||
| 2026-02-06 | 13F | Harbor Advisory Corp /ma/ | 48.443 | 0,00 | 1.747 | -0,29 | ||||
| 2026-01-29 | 13F | Equita Financial Network, Inc. | 5.718 | 206 | ||||||
| 2026-02-10 | 13F/A | Northwestern Mutual Wealth Management Co | 670.554 | 54,29 | 24.180 | 53,87 | ||||
| 2026-02-12 | 13F | Lbmc Investment Advisors, Llc | 8.735 | 0,00 | 315 | -0,32 | ||||
| 2026-02-09 | 13F | Firestone Capital Management | 21.678 | -4,80 | 782 | -5,10 | ||||
| 2026-02-05 | 13F | Atria Investments Llc | 16.135 | 36,69 | 582 | 36,38 | ||||
| 2026-02-06 | 13F | Creative Financial Designs Inc /adv | 939 | 6,83 | 34 | 6,45 | ||||
| 2026-02-10 | 13F | Elgethun Capital Management | 536.745 | 9,60 | 19.355 | 8,75 | ||||
| 2026-02-17 | 13F | Clark Capital Management Group, Inc. | 79.115 | -2,93 | 2.853 | -3,22 | ||||
| 2026-02-12 | 13F | Rossby Financial, LCC | 1.487 | -13,60 | 54 | -14,52 | ||||
| 2026-01-26 | 13F | Whittier Trust Co Of Nevada Inc | 14 | 0,00 | 1 | |||||
| 2025-11-13 | 13F | Bnp Paribas Arbitrage, Sa | 0 | -100,00 | 0 | |||||
| 2026-02-13 | 13F | Citigroup Inc | 73.293 | -0,02 | 2.643 | -0,30 | ||||
| 2026-02-04 | 13F | Dogwood Wealth Management LLC | 0 | -100,00 | 0 | |||||
| 2026-01-16 | 13F | RHS Financial, LLC | 242.978 | 9,86 | 8.762 | 9,55 | ||||
| 2026-01-21 | 13F | Crews Bank & Trust | 0 | -100,00 | 0 | |||||
| 2026-02-02 | 13F | Cornerstone Planning Group LLC | 353.192 | 17.012,02 | 14.085 | 15.550,00 | ||||
| 2026-02-02 | 13F | Your Advocates Ltd., LLP | 218.629 | -0,80 | 7.884 | -1,08 | ||||
| 2026-02-13 | 13F | Goldstone Financial Group, LLC | 73.387 | 15,31 | 2.646 | 14,99 | ||||
| 2026-02-13 | 13F | Mariner, LLC | 159.913 | 18,43 | 5.766 | 18,11 | ||||
| 2026-02-06 | 13F | Envestnet Portfolio Solutions, Inc. | 6.762 | 16,05 | 244 | 15,71 | ||||
| 2026-02-17 | 13F | Bank Of America Corp /de/ | 2.157.351 | -8,54 | 77.794 | -8,79 | ||||
| 2026-02-09 | 13F | Summitry Llc | 21.606 | 779 | ||||||
| 2025-10-28 | 13F | JNBA Financial Advisors | 0 | -100,00 | 0 | |||||
| 2026-01-23 | 13F | Private Wealth Management Group, LLC | 1 | 0 | ||||||
| 2025-11-12 | 13F | Ameriflex Group, Inc. | 0 | -100,00 | 0 | |||||
| 2026-01-21 | 13F | Raleigh Capital Management Inc. | 0 | 0 | ||||||
| 2026-01-22 | 13F | Trilogy Capital Inc. | 8.498 | 306 | ||||||
| 2026-01-26 | 13F | Kelman-Lazarov, Inc. | 607.762 | 0,38 | 21.916 | 0,10 | ||||
| 2026-01-14 | 13F | Johnson Bixby & Associates, LLC | 533.933 | 23,68 | 19.254 | 23,34 | ||||
| 2026-01-20 | 13F | Maryland Capital Advisors Inc. | 231 | 0,00 | 8 | 0,00 | ||||
| 2025-10-30 | 13F | Parkside Financial Bank & Trust | 0 | -100,00 | 0 | |||||
| 2026-02-12 | 13F | Hm Payson & Co | 2.500 | 90 | ||||||
| 2026-02-10 | 13F | MidAtlantic Capital Management, Inc. | 388 | 14 | ||||||
| 2026-02-04 | 13F | Ameritas Advisory Services, LLC | 0 | -100,00 | 0 | |||||
| 2026-01-05 | 13F | Park Avenue Securities Llc | 23.531 | 19,57 | 1 | |||||
| 2026-01-29 | 13F | Nbc Securities, Inc. | 883 | 32 | ||||||
| 2026-02-19 | 13F | Birchwood Financial Partners, Inc. | 75.746 | 2.731 | ||||||
| 2026-02-11 | 13F | O'shaughnessy Asset Management, Llc | 5.396 | 42,22 | 195 | 41,61 | ||||
| 2025-11-14 | 13F | Empower Advisory Group, LLC | 0 | -100,00 | 0 | |||||
| 2026-02-05 | 13F | AlphaCore Capital LLC | 597.191 | -2,88 | 21.535 | -3,15 | ||||
| 2026-02-13 | 13F | SRS Capital Advisors, Inc. | 3.635 | 131 | ||||||
| 2025-11-07 | 13F | TT Capital Management LLC | 0 | -100,00 | 0 | -100,00 | ||||
| 2026-01-28 | 13F | CAPROCK Group, Inc. | 16.380 | 2,72 | 591 | 7,47 | ||||
| 2026-01-21 | 13F | Paladin Advisory Group, LLC | 24 | 0,00 | 1 | |||||
| 2026-02-05 | 13F | Plante Moran Financial Advisors, LLC | 324 | 0,00 | 12 | 0,00 | ||||
| 2026-02-11 | 13F | Etesian Wealth Advisors, Inc. | 131.928 | 21,89 | 4.757 | 21,57 | ||||
| 2026-01-14 | 13F | Spire Wealth Management | 627 | 13,18 | 23 | 10,00 | ||||
| 2026-02-10 | 13F | Clarity Capital Advisors, LLC | 17.931 | 3,69 | 647 | 3,36 | ||||
| 2026-01-26 | 13F | Merit Financial Group, LLC | 42.482 | -4,31 | 1.532 | -4,61 | ||||
| 2026-02-09 | 13F | Key FInancial Inc | 397 | 0,00 | 14 | 0,00 | ||||
| 2026-02-05 | 13F | Cambridge Investment Research Advisors, Inc. | 493.636 | 4,61 | 18 | 0,00 | ||||
| 2026-01-06 | 13F | WealthCare Investment Partners, LLC | 82.688 | 20,63 | 3.045 | 22,35 | ||||
| 2026-02-14 | 13F | Whipplewood Advisors, LLC | 40.046 | -3,55 | 1.444 | -3,80 | ||||
| 2026-02-06 | 13F | Tortoise Investment Management, LLC | 0 | -100,00 | 0 | |||||
| 2026-02-13 | 13F | Mml Investors Services, Llc | 105.868 | -52,73 | 3.818 | -52,87 | ||||
| 2026-02-12 | 13F | Cowa, Llc | 311.441 | 1,37 | 11.231 | 1,09 | ||||
| 2026-02-17 | 13F | Ancora Advisors, LLC | 4.131 | 972,99 | 149 | 1.038,46 | ||||
| 2026-02-17 | 13F | Mercer Global Advisors Inc /adv | 84.738 | 82,02 | 3.056 | 81,52 | ||||
| 2026-02-13 | 13F | Johnson Investment Counsel Inc | 0 | -100,00 | 0 | |||||
| 2026-02-18 | 13F | Financial Advisory Service, Inc. | 931 | 0,00 | 34 | 0,00 | ||||
| 2025-10-27 | 13F | Klingman & Associates, LLC | 0 | -100,00 | 0 | |||||
| 2026-02-12 | 13F | Strata Wealth Advisors, LLC | 9.508 | 0,00 | 343 | -0,29 | ||||
| 2026-02-11 | 13F | Curio Wealth, Llc | 19 | 0,00 | 1 | |||||
| 2026-01-12 | 13F | Sax Wealth Advisors, Llc | 271.944 | 9,93 | 9.806 | 9,63 | ||||
| 2026-01-23 | 13F | Keener Financial Planning LLC | 0 | -100,00 | 0 | |||||
| 2025-11-14 | 13F | Guardian Wealth Advisors, Llc / Nc | 0 | -100,00 | 0 | |||||
| 2026-02-09 | 13F | Delta Asset Management Llc/tn | 692 | 25 | ||||||
| 2026-01-27 | 13F | Godsey & Gibb Associates | 461 | 0,00 | 17 | 0,00 | ||||
| 2026-02-11 | 13F | Buckingham Strategic Partners | 9.253 | -25,98 | 334 | -27,92 | ||||
| 2026-01-30 | 13F | Bogart Wealth, LLC | 1.854.014 | 4,55 | 66.856 | 4,26 | ||||
| 2026-01-21 | 13F | Warner Financial, Inc | 10.450 | 0,09 | 0 | |||||
| 2026-02-09 | 13F | Bleakley Financial Group, LLC | 66.688 | 2.405 | ||||||
| 2026-02-12 | 13F | Caerus Investment Advisors, LLC | 19.646 | 0,00 | 708 | -0,28 | ||||
| 2026-01-27 | 13F | Brighton Jones Llc | 0 | -100,00 | 0 | |||||
| 2026-02-06 | 13F | Larson Financial Group LLC | 8.782 | -13,66 | 317 | -13,90 | ||||
| 2026-02-11 | 13F | Franklin Resources Inc | 2.800 | 101 | ||||||
| 2026-01-16 | 13F | Perigon Wealth Management, LLC | 37.725 | 5,95 | 1.360 | 5,67 | ||||
| 2026-01-23 | 13F | Avion Wealth | 100 | 0,00 | 0 | |||||
| 2026-02-11 | 13F | Vise Technologies, Inc. | 17.222 | 117,09 | 621 | 117,13 | ||||
| 2026-02-17 | 13F | Private Advisor Group, LLC | 25.068 | 0,87 | 904 | 0,56 | ||||
| 2026-02-03 | 13F | Crossmark Global Holdings, Inc. | 0 | -100,00 | 0 | |||||
| 2026-03-12 | 13F | Nalls Sherbakoff Group, Llc | 3.200 | 0,00 | 115 | 33,72 | ||||
| 2025-11-14 | 13F | Strategic Wealth Partners, Ltd. | 235 | 0,00 | 8 | 14,29 | ||||
| 2026-01-09 | 13F | Cambridge Financial Group, LLC | 53.836 | 3,47 | 1.565 | -16,80 | ||||
| 2026-01-16 | 13F | DiNuzzo Private Wealth, Inc. | 134 | 0,00 | 5 | 0,00 | ||||
| 2026-02-04 | 13F | Drive Wealth Management, Llc | 60.319 | -6,99 | 2.175 | -7,25 | ||||
| 2026-01-29 | 13F | Sanctuary Advisors, LLC | 271.330 | 19,71 | 9.784 | 19,39 | ||||
| 2026-02-12 | 13F | Timmons Wealth Management, LLC | 7.777 | 280 | ||||||
| 2026-01-13 | 13F | Capital Investment Advisors, LLC | 0 | -100,00 | 0 | |||||
| 2026-02-10 | 13F | Murphy & Mullick Capital Management Corp | 1.653 | 0,00 | 60 | 0,00 | ||||
| 2026-02-06 | 13F | Magnolia Private Wealth, LLC | 23.960 | -7,34 | 864 | -7,70 | ||||
| 2026-01-30 | 13F | Kiker Wealth Management, LLC | 0 | -100,00 | 0 | |||||
| 2026-02-12 | 13F | Betterment LLC | 42.814 | 0,82 | 2 | 0,00 | ||||
| 2026-02-19 | 13F | BFI Wealth Solutions, LLC | 78.989 | 2.848 | ||||||
| 2026-02-13 | 13F | Planwiser Financial, Llc | 151.800 | 5.474 | ||||||
| 2026-02-17 | 13F | Aqr Capital Management Llc | 58.308 | 413,41 | 2.103 | 412,68 | ||||
| 2026-02-12 | 13F | Principal Securities, Inc. | 475.659 | 8,88 | 17.152 | 8,58 | ||||
| 2025-11-07 | 13F | Beacon Capital Management, LLC | 0 | -100,00 | 0 | |||||
| 2026-02-02 | 13F | Truist Financial Corp | 7.517 | 17,88 | 271 | 17,83 | ||||
| 2026-02-09 | 13F | Sensible Money, LLC | 88.571 | -0,48 | 3.194 | -0,78 | ||||
| 2026-01-29 | 13F | Almanack Investment Partners, LLC. | 698.754 | 1,24 | 25.197 | 0,96 | ||||
| 2026-02-11 | 13F | Capital Analysts, Inc. | 0 | -100,00 | 0 | |||||
| 2026-02-13 | 13F | Droms Strauss Advisors Inc /mo/ /adv | 359.798 | 12.974 | ||||||
| 2026-01-23 | 13F | Steigerwald, Gordon & Koch Inc. | 1.218 | 0,00 | 44 | -2,27 | ||||
| 2026-02-11 | 13F | Peachtree Investment Partners, LLC | 46 | 4,55 | 2 | 0,00 | ||||
| 2026-02-13 | 13F | Glen Eagle Advisors, LLC | 250 | 9 | ||||||
| 2026-02-06 | 13F | Cullen/frost Bankers, Inc. | 0 | -100,00 | 0 | |||||
| 2026-02-05 | 13F | Allworth Financial LP | 9.261 | 4,18 | 334 | 3,74 | ||||
| 2026-02-12 | 13F | Custom Index Systems, Llc | 69.907 | -43,87 | 2.521 | -44,04 | ||||
| 2026-02-12 | 13F | Commonwealth Equity Services, Llc | 450.713 | 1,27 | 16.253 | 101.475,00 | ||||
| 2026-01-13 | 13F | CoreCap Advisors, LLC | 3.047 | -45,71 | 110 | -46,04 | ||||
| 2026-02-17 | 13F | Van Den Berg Management I, Inc | 4.258 | 83,53 | 154 | 84,34 | ||||
| 2026-01-28 | 13F | REDW Wealth LLC | 10.472 | 22,11 | 378 | 21,61 | ||||
| 2026-02-14 | 13F | Howe & Rusling Inc | 1.513 | 811,45 | 55 | 800,00 | ||||
| 2026-01-26 | 13F | AE Wealth Management LLC | 3.558 | 52,31 | 128 | 52,38 | ||||
| 2026-02-13 | 13F | Asset Allocation Strategies LLC | 69.363 | 6,83 | 2.501 | 6,56 | ||||
| 2026-02-13 | 13F | Veridan Wealth LLC | 0 | -100,00 | 0 | |||||
| 2026-01-28 | 13F | Salomon & Ludwin, LLC | 312 | 0,00 | 12 | 0,00 | ||||
| 2026-02-17 | 13F | Captrust Financial Advisors | 15.786 | 30,16 | 569 | 29,91 | ||||
| 2026-02-04 | 13F | Argos Wealth Advisors, LLC | 12.939 | 467 | ||||||
| 2026-01-16 | 13F | Bangor Savings Bank | 14.054 | -5,37 | 507 | -5,77 | ||||
| 2026-02-17 | 13F | Glenmede Trust Co Na | 1.083 | -80,27 | 39 | -76,92 | ||||
| 2026-02-03 | 13F | Diversify Wealth Management, Llc | 25.348 | 952 | ||||||
| 2026-01-23 | 13F | Laurel Wealth Planning LLC | 157.424 | 2,32 | 5.677 | 2,03 | ||||
| 2026-02-02 | 13F | Miracle Mile Advisors, LLC | 8.581 | 309 | ||||||
| 2026-01-15 | 13F | Westmount Partners, LLC | 25.957 | 0,00 | 936 | -0,64 | ||||
| 2026-02-20 | 13F | Cambient Family Office, Llc | 92 | 3 | ||||||
| 2026-01-29 | 13F | Tumwater Wealth Management, LLC | 15.233 | 0,00 | 549 | -0,18 | ||||
| 2026-02-13 | 13F | Oarsman Capital, Inc. | 7.365 | 0,00 | 266 | -0,38 | ||||
| 2026-02-17 | 13F | Angeles Wealth Management, Llc | 2.800 | 0,00 | 101 | -0,99 | ||||
| 2026-01-20 | 13F | Northland Capital Management LLC | 105.047 | 27,31 | 3.788 | 26,95 | ||||
| 2026-01-08 | 13F | Wedmont Private Capital | 14.608 | 10,99 | 541 | 13,68 | ||||
| 2026-01-16 | 13F | Empirical Financial Services, LLC d.b.a. Empirical Wealth Management | 129.699 | -1,90 | 4.677 | -2,18 | ||||
| 2026-01-26 | 13F | Cwm, Llc | 19.857 | 65,78 | 1 | |||||
| 2026-02-13 | 13F | Graney & King, LLC | 73 | 2,82 | 3 | 0,00 | ||||
| 2026-02-06 | 13F | Financial Synergies Wealth Advisors, Inc. | 7.166 | 1,75 | 258 | 1,57 | ||||
| 2026-02-09 | 13F | Morningstar Investment Management LLC | 700.890 | 7,34 | 25 | 8,70 | ||||
| 2026-02-12 | 13F | IFC & Insurance Marketing, Inc. | 75 | 0 | ||||||
| 2026-01-23 | 13F | Assetmark, Inc | 68.645 | 39,48 | 2.475 | 39,12 |