Grundlæggende statistik
| Institutionelle aktier (lange) | 161.609.099 - 77,69% (ex 13D/G) - change of -52,41MM shares -24,49% MRQ |
| Institutionel værdi (lang) | $ 20.367.298 USD ($1000) |
Institutionelt ejerskab og aktionærer
DTE Energy Company (US:DTE) har 973 institutionelle ejere og aktionærer, der har indsendt 13D/G- eller 13F-formularer til Securities Exchange Commission (SEC). Disse institutioner har i alt 161,609,099 aktier. Største aktionærer omfatter Vanguard Group Inc, BlackRock, Inc., Capital Research Global Investors, State Street Corp, Capital World Investors, Ameriprise Financial Inc, Geode Capital Management, Llc, Janus Henderson Group Plc, Millennium Management Llc, and Clearbridge Investments, LLC .
DTE Energy Company (NYSE:DTE) institutionel ejerskabsstruktur viser aktuelle positioner i virksomheden efter institutioner og fonde, samt seneste ændringer i positionsstørrelse. Større aktionærer kan omfatte individuelle investorer, investeringsforeninger, hedgefonde eller institutioner. Skema 13D angiver, at investoren besidder (eller besidder) mere end 5 % af virksomheden og har til hensigt (eller har til hensigt at) aktivt at forfølge en ændring i forretningsstrategi. Skema 13G indikerer en passiv investering på over 5%.
The share price as of April 10, 2026 is 149,68 / share. Previously, on April 14, 2025, the share price was 133,19 / share. This represents an increase of 12,38% over that period.

Fondens stemningsscore
Fund Sentiment Score (fka Ownership Accumulation Score) finder de aktier, der bliver mest købt af fonde. Det er resultatet af en sofistikeret, multi-faktor kvantitativ model, der identificerer virksomheder med de højeste niveauer af institutionel akkumulering. Scoringsmodellen bruger en kombination af den samlede stigning i oplyste ejere, ændringerne i porteføljeallokeringer i disse ejere og andre målinger. Tallet går fra 0 til 100, hvor højere tal indikerer et højere niveau af akkumulering for sine jævnaldrende, og 50 er gennemsnittet.
Opdateringsfrekvens: Dagligt
Se Ownership Explorer, som giver en liste over højest rangerende virksomheder.
AI+ Ask Fintel’s AI assistant about DTE Energy Company.
Select a question to share a public post with an AI-crafted answer.
Thinking of good questions…
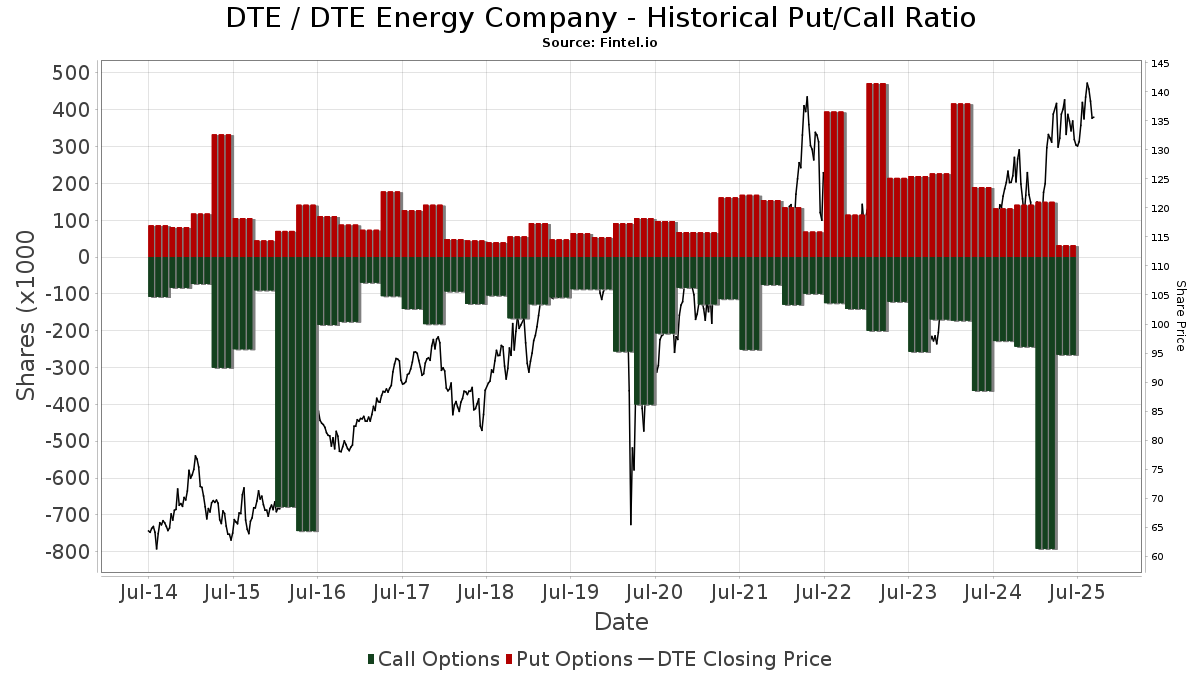
Institutionel Put/Call-forhold
Ud over at indberette standardaktie- og gældsudstedelser skal institutter med mere end 100 mill. aktiver under forvaltning også oplyse deres put- og call-optionsbeholdninger. Da salgsoptioner generelt indikerer negativ stemning, og købsoptioner indikerer positiv stemning, kan vi få en fornemmelse af den overordnede institutionelle stemning ved at plotte forholdet mellem put og kald. Diagrammet til højre viser det historiske put/call-forhold for dette instrument.
Brug af Put/Call Ratio som en indikator for investorernes stemning overvinder en af de vigtigste mangler ved at bruge totalt institutionelt ejerskab, som er, at en betydelig mængde af aktiver under forvaltning investeres passivt for at spore indekser. Passivt forvaltede fonde køber typisk ikke optioner, så indikatoren for put/call-forholdet følger mere nøje følelsen af aktivt forvaltede fonde.
13D/G-arkivering
Vi præsenterer 13D/G ansøgninger separat fra 13F ansøgninger på grund af den forskellige behandling af SEC. 13D/G-ansøgninger kan indgives af grupper af investorer (med én ledende), hvorimod 13F-ansøgninger ikke kan. Dette resulterer i situationer, hvor en investor kan indsende en 13D/G, der rapporterer én værdi for de samlede aktier (der repræsenterer alle de aktier, der ejes af investorgruppen), men derefter indsender en 13F, der rapporterer en anden værdi for de samlede aktier (der udelukkende repræsenterer deres egne) ejendomsret). Det betyder, at aktieejerskab af 13D/G-arkiver og 13F-arkiveringer ofte ikke er direkte sammenlignelige, så vi præsenterer dem separat.
Bemærk: Fra den 16. maj 2021 viser vi ikke længere ejere, der ikke har indsendt en 13D/G inden for det seneste år. Tidligere viste vi den fulde historie af 13D/G-arkiver. Generelt skal enheder, der er forpligtet til at indgive 13D/G-ansøgninger, indgive mindst årligt, før de indsender en afsluttende ansøgning. Dog forlader fonde nogle gange positioner uden at indsende en afsluttende ansøgning (dvs. de afvikler), så visning af den fulde historie resulterede nogle gange i forvirring om det nuværende ejerskab. For at undgå forvirring viser vi nu kun 'aktuelle' ejere - det vil sige - ejere, der har anmeldt inden for det seneste år.
Upgrade to unlock premium data.
| Fil dato | Form | Investor | Forrige Aktier |
Seneste Aktier |
Δ Aktier (Procent) |
Ejendomsret (Procent) |
Δ Ejerskab (Procent) |
|
|---|---|---|---|---|---|---|---|---|
| 2025-08-13 | Capital Research Global Investors | 18,869,428 | 14,134,278 | -25.09 | 6.80 | -25.27 | ||
| 2025-08-11 | STATE STREET CORP | 10,027,911 | 10,559,233 | 5.30 | 5.10 | 4.72 |
13F og NPORT arkivering
Detaljer om 13F-arkivering er gratis. Detaljer om NP-ansøgninger kræver et premium-medlemskab. Grønne rækker angiver nye positioner. Røde rækker angiver lukkede positioner. Klik på linket ikon for at se den fulde transaktionshistorik.
Opgrader
for at låse premium-data op og eksportere til Excel ![]() .
.
Important Note
In an effort to reduce load times for our mobile users, we are testing some ways to deliver lighter pages.
In this first test, we will deliver only the most recent 750 transactions (out of 1155 for this stock). If you are interested in loading *all* the transactions for this company, click the "load all" button below. This is just a test and if you don't like it, please let us know by submitting some gentle feedback via the link at the bottom of this page.
Load All| Fil dato | Kilde | Investor | Type | Gennemsnitlig pris (Øst) |
Aktier | Δ Aktier (%) |
Rapporteret Værdi ($1000) |
Δ Værdi (%) |
Port Alloc (%) |
|
|---|---|---|---|---|---|---|---|---|---|---|
| 2026-02-10 | 13F | Savant Capital, LLC | 6.962 | -6,45 | 898 | -14,73 | ||||
| 2026-02-17 | 13F | Clear Street Markets Llc | 308 | -13,73 | 40 | -22,00 | ||||
| 2026-02-05 | 13F | AlphaCore Capital LLC | 3.732 | 62,12 | 481 | 46,65 | ||||
| 2026-01-26 | 13F | Chicago Capital, LLC | 4.364 | 0,00 | 563 | -8,91 | ||||
| 2026-02-05 | 13F | Dahring | Cusmano Llc | 2.020 | 0,75 | 261 | -8,13 | ||||
| 2026-01-29 | 13F | True Link Financial Advisors, LLC | 1.809 | -44,05 | 233 | -49,02 | ||||
| 2026-01-05 | 13F | GoalVest Advisory LLC | 8.800 | 5.968,97 | 1.135 | 5.575,00 | ||||
| 2026-02-10 | 13F | Winthrop Capital Management, LLC | 2.504 | 0,85 | 0 | |||||
| 2026-02-17 | 13F | Vinva Investment Management Ltd | 48.216 | 1.504,53 | 6.257 | 1.379,20 | ||||
| 2026-04-03 | 13F | Adirondack Trust Co | 1.200 | 0,00 | 175 | 13,64 | ||||
| 2026-02-02 | 13F | Truist Financial Corp | 11.030 | 1,07 | 1.423 | -7,84 | ||||
| 2026-01-23 | 13F | Valley National Advisers Inc | 14 | 0,00 | 0 | |||||
| 2026-02-24 | 13F | SG Trading Solutions, LLC | 15.858 | 2 | ||||||
| 2026-02-13 | 13F | Greenline Wealth Management LLC | 33 | 4 | ||||||
| 2026-01-12 | 13F | Salem Investment Counselors Inc | 0 | -100,00 | 0 | |||||
| 2026-01-23 | 13F | Tectonic Advisors Llc | 5.719 | 2,73 | 738 | -6,35 | ||||
| 2026-02-13 | 13F | Dai-Ichi Life Insurance Company, Ltd | 13.449 | -25,07 | 1.735 | -31,68 | ||||
| 2026-02-02 | 13F | Danske Bank A/s | 3.075 | 6,96 | 397 | -2,46 | ||||
| 2026-02-06 | 13F | Covestor Ltd | 233 | -0,43 | 0 | |||||
| 2026-02-12 | 13F | Eley Financial Management, Inc | 31.492 | 2,56 | 4.062 | -6,47 | ||||
| 2025-11-20 | 13F | Wbi Investments, Inc. | 0 | -100,00 | 0 | |||||
| 2026-02-05 | 13F | Allworth Financial LP | 8.990 | 61,55 | 1.160 | 47,27 | ||||
| 2026-01-27 | 13F | Bayforest Capital Ltd | 377 | -89,95 | 49 | -90,94 | ||||
| 2026-02-05 | 13F | Northwestern Mutual Investment Management Company, Llc | 6.636 | 0,30 | 856 | -8,56 | ||||
| 2026-02-10 | 13F | Intech Investment Management Llc | 7.954 | -29,99 | 1.026 | -36,18 | ||||
| 2026-01-23 | 13F | Altfest L J & Co Inc | 6.059 | 0,31 | 781 | -8,55 | ||||
| 2026-02-06 | 13F | Motco | 200 | 0,00 | 26 | -10,71 | ||||
| 2025-11-26 | 13F | Vermillion & White Wealth Management Group, LLC | 0 | -100,00 | 0 | -100,00 | ||||
| 2026-02-03 | 13F | SBI Securities Co., Ltd. | 25 | 4,17 | 3 | 0,00 | ||||
| 2026-02-17 | 13F | Woodline Partners LP | 35.432 | 29,15 | 4.570 | 17,78 | ||||
| 2026-01-30 | 13F | Folger Nolan Fleming Douglas Capital Management, Inc | 1.738 | 0,00 | 224 | -8,57 | ||||
| 2026-02-17 | 13F | Susquehanna Portfolio Strategies, LLC | 89.933 | -40,90 | 11.600 | -46,11 | ||||
| 2026-04-08 | 13F | Wealth Enhancement Advisory Services, Llc | 19.836 | -69,74 | 2.937 | -65,56 | ||||
| 2026-02-17 | 13F | Summit Global Investments | 53.460 | 37,82 | 7 | 20,00 | ||||
| 2026-02-19 | 13F | Mcguire Capital Advisors Inc | 279 | 36 | ||||||
| 2026-01-20 | 13F | Stratos Wealth Partners, LTD. | 1.896 | -0,21 | 245 | -8,96 | ||||
| 2026-01-29 | 13F | UMA Financial Services, Inc. | 7 | -78,12 | 1 | -100,00 | ||||
| 2026-02-04 | 13F | HighPoint Advisor Group LLC | 15.400 | 1,34 | 1.986 | -7,58 | ||||
| 2026-04-02 | 13F | Ares Financial Consulting, LLC | 21 | 0,00 | 3 | 50,00 | ||||
| 2026-02-10 | 13F | Zhang Financial LLC | 2.271 | 0,44 | 293 | -8,46 | ||||
| 2025-10-30 | 13F | Twin Peaks Wealth Advisors, LLC | 0 | -100,00 | 0 | |||||
| 2026-01-29 | 13F | D.a. Davidson & Co. | 4.941 | 1,44 | 637 | -7,41 | ||||
| 2026-02-10 | 13F | Root Financial Partners, LLC | 178 | 37,98 | 23 | 22,22 | ||||
| 2026-02-17 | 13F | T. Rowe Price Investment Management, Inc. | 27.099 | -99,56 | 3 | -99,66 | ||||
| 2026-04-10 | 13F | Armstrong Advisory Group, Inc | 100 | 0,00 | 15 | 16,67 | ||||
| 2026-02-13 | 13F | Police & Firemen's Retirement System of New Jersey | 31.876 | -4,30 | 4.111 | -12,72 | ||||
| 2026-02-11 | 13F | Group One Trading, L.p. | Put | 100 | 13 | |||||
| 2026-02-17 | 13F | Ameriprise Financial Inc | 5.694.794 | 2,22 | 734.158 | -6,83 | ||||
| 2026-01-09 | 13F | Assenagon Asset Management S.A. | 6.427 | 10,49 | 829 | 0,73 | ||||
| 2026-01-28 | 13F | Cranbrook Wealth Management, LLC | 6.469 | 0,00 | 834 | -8,75 | ||||
| 2026-02-13 | 13F | Level Four Advisory Services, Llc | 2.547 | -31,05 | 329 | -37,16 | ||||
| 2026-02-18 | 13F | Garton & Associates Financial Advisors LLC | 30 | 4 | ||||||
| 2026-01-26 | 13F | JNBA Financial Advisors | 12 | 0,00 | 2 | 0,00 | ||||
| 2026-02-03 | 13F | Redwood Wealth Management Group, LLC | 2.275 | -3,27 | 293 | -11,75 | ||||
| 2026-02-17 | 13F | Tcw Group Inc | 3.242 | 418 | ||||||
| 2026-02-17 | 13F | Snowden Capital Advisors LLC | 1.784 | 0,79 | 232 | -7,94 | ||||
| 2026-01-14 | 13F | Nova Wealth Management, Inc. | 4 | 0,00 | 1 | |||||
| 2026-02-11 | 13F | Metis Global Partners, LLC | 6.596 | -5,38 | 851 | -13,71 | ||||
| 2026-02-13 | 13F | Toroso Investments, LLC | 5.908 | 154,00 | 762 | 132,32 | ||||
| 2026-01-29 | 13F | Comprehensive Financial Consultants Institutional, Inc. | 2.722 | 0,00 | 351 | -8,59 | ||||
| 2026-02-02 | 13F | Fifth Third Bancorp | 7.755 | 1,13 | 1.000 | -7,75 | ||||
| 2026-02-05 | 13F | iA Global Asset Management Inc. | 14.907 | 3,77 | 2 | -50,00 | ||||
| 2026-04-08 | 13F | Quantum Financial Advisors, LLC | 2.674 | -0,04 | 391 | 13,04 | ||||
| 2026-02-10 | 13F | Core Wealth Advisors, Llc | 157 | 20 | ||||||
| 2025-11-14 | 13F | Wealth Preservation Advisors, LLC | 0 | -100,00 | 0 | |||||
| 2026-02-06 | 13F | Twin Capital Management Inc | 4.706 | 0,38 | 607 | -8,60 | ||||
| 2026-02-17 | 13F | Guggenheim Capital Llc | 38.370 | 7,31 | 4.949 | -2,14 | ||||
| 2026-02-17 | 13F | Two Sigma Securities, Llc | 0 | -100,00 | 0 | |||||
| 2026-02-17 | 13F | Energy Income Partners, LLC | 568.407 | -13,58 | 73.313 | -21,19 | ||||
| 2026-01-20 | 13F | Toth Financial Advisory Corp | 489 | 0,00 | 63 | -8,70 | ||||
| 2026-02-13 | 13F | Williams Jones Wealth Management, LLC. | 4.824 | 1,28 | 622 | -7,58 | ||||
| 2026-02-17 | 13F | Maryland State Retirement & Pension System | 10.602 | 0,00 | 1.367 | -8,81 | ||||
| 2026-02-13 | 13F | Kestra Advisory Services, LLC | 0 | -100,00 | 0 | |||||
| 2026-02-17 | 13F | Two Sigma Investments, Lp | 0 | -100,00 | 0 | -100,00 | ||||
| 2026-01-30 | 13F | Activest Wealth Management | 0 | -100,00 | 0 | |||||
| 2026-02-18 | 13F | Mackenzie Financial Corp | 38.135 | 7,19 | 4.939 | -1,83 | ||||
| 2026-02-13 | 13F | Neuberger Berman Group LLC | 129.387 | -68,77 | 16.688 | -71,51 | ||||
| 2026-02-10 | 13F | Principia Wealth Advisory, LLC | 13 | -7,14 | 2 | 0,00 | ||||
| 2025-11-14 | 13F | Mbb Public Markets I Llc | 0 | -100,00 | 0 | |||||
| 2026-01-22 | 13F | City Holding Co | 8.467 | 1,61 | 1.092 | -7,30 | ||||
| 2026-01-23 | 13F | Old North State Wealth Management, LLC | 2.402 | -2,56 | 310 | -11,17 | ||||
| 2026-01-23 | 13F | Halbert Hargrove Global Advisors, Llc | 0 | -100,00 | 0 | |||||
| 2026-02-13 | 13F | Public Employees Retirement Association Of Colorado | 18.965 | 0,00 | 2 | 0,00 | ||||
| 2026-02-17 | 13F | Sagewood Asset Management LP | 2.676 | 345 | ||||||
| 2026-02-13 | 13F | Johnson Investment Counsel Inc | 0 | -100,00 | 0 | |||||
| 2026-02-17 | 13F | Tudor Investment Corp Et Al | 12.329 | 1.590 | ||||||
| 2026-02-17 | 13F | NEOS Investment Management LLC | 29.993 | 19,76 | 3.868 | 9,20 | ||||
| 2025-11-14 | 13F | Binnacle Investments Inc | 85 | 11,84 | 12 | 20,00 | ||||
| 2026-04-02 | 13F | Lvm Capital Management Ltd/mi | 1.508 | 0 | ||||||
| 2026-02-04 | 13F | Asahi Life Asset Management Co., Ltd. | 2.895 | 373 | ||||||
| 2026-02-12 | 13F | Ensign Peak Advisors, Inc | 81.832 | -23,81 | 10.555 | -30,52 | ||||
| 2026-03-11 | 13F | Downshift Financial, LLC | 1.622 | 221 | ||||||
| 2026-02-17 | 13F | Glenmede Trust Co Na | 148.217 | -36,38 | 19.117 | -40,66 | ||||
| 2026-02-09 | 13F | Prospera Financial Services Inc | 6.944 | 15,43 | 896 | 5,29 | ||||
| 2026-02-17 | 13F | Man Group plc | 109.192 | 157,56 | 14.084 | 134,91 | ||||
| 2026-02-17 | 13F | DV Trading LLC | 300 | 39 | ||||||
| 2026-02-10 | 13F | Westpac Banking Corp | 10.319 | 0,00 | 1.331 | -8,84 | ||||
| 2026-01-21 | 13F | Clayton Financial Group LLC | 12 | 2 | ||||||
| 2026-01-14 | 13F | Exchange Traded Concepts, Llc | 9.750 | 16,58 | 1.258 | 6,35 | ||||
| 2026-01-07 | 13F | Sovereign Financial Group, Inc. | 3.359 | -0,21 | 433 | -9,03 | ||||
| 2026-01-23 | 13F | State of Alaska, Department of Revenue | 20.559 | -7,43 | 3 | -33,33 | ||||
| 2026-01-27 | 13F | SageGuard Financial Group, LLC | 2.071 | 267 | ||||||
| 2026-02-03 | 13F | Crossmark Global Holdings, Inc. | 6.161 | 4,73 | 795 | -4,57 | ||||
| 2026-02-02 | 13F | CENTRAL TRUST Co | 3.680 | -8,80 | 475 | -16,84 | ||||
| 2026-01-26 | 13F | Cwm, Llc | 22.077 | -38,49 | 3 | -60,00 | ||||
| 2026-01-29 | 13F | State Of Michigan Retirement System | 54.377 | -3,20 | 7.014 | -11,73 | ||||
| 2026-02-17 | 13F | Voleon Capital Management Lp | 3.800 | 3,43 | 490 | -5,59 | ||||
| 2026-02-13 | 13F | Squarepoint Ops LLC | 5.535 | -0,04 | 714 | -8,94 | ||||
| 2025-11-14 | 13F | Sofos Investments, Inc. | 0 | -100,00 | 0 | |||||
| 2026-01-21 | 13F | Wealthbridge Capital Management, Llc | 7.267 | 3,40 | 937 | -5,64 | ||||
| 2026-02-13 | 13F | State Street Corp | 11.078.346 | 2,52 | 1.441.776 | -6,38 | ||||
| 2026-02-13 | 13F | Ontario Teachers Pension Plan Board | 0 | -100,00 | 0 | |||||
| 2026-02-13 | 13F | Verition Fund Management LLC | 0 | -100,00 | 0 | |||||
| 2026-02-03 | 13F | Mitsubishi UFJ Kokusai Asset Management Co., Ltd. | 434.211 | 4,54 | 56.604 | -3,64 | ||||
| 2026-02-12 | 13F | Logan Capital Management Inc | 0 | -100,00 | 0 | -100,00 | ||||
| 2026-02-03 | 13F | Harel Insurance Investments & Financial Services Ltd. | 227 | 5,09 | 0 | |||||
| 2026-02-17 | 13F | Capital Fund Management S.a. | 10.969 | 1.415 | ||||||
| 2026-02-17 | 13F | Royal Bank Of Canada | 723.006 | 3,02 | 93.254 | -6,05 | ||||
| 2026-04-07 | 13F | Mb, Levis & Associates, Llc | 164 | 0,00 | 24 | 9,52 | ||||
| 2026-01-06 | 13F | Davis Investment Partners, LLC | 0 | -100,00 | 0 | |||||
| 2026-02-11 | 13F | Illinois Municipal Retirement Fund | 4.384 | -88,98 | 565 | -89,96 | ||||
| 2026-02-04 | 13F | GGM Financials LLC | 500 | 0,00 | 64 | -8,57 | ||||
| 2026-01-23 | 13F | Assetmark, Inc | 4.781 | 6,60 | 617 | -2,84 | ||||
| 2025-11-17 | 13F | PharVision Advisers, LLC | 0 | -100,00 | 0 | |||||
| 2026-02-23 | 13F | Virtu Financial LLC | 2.479 | 28,05 | 0 | |||||
| 2026-02-05 | 13F | Mesirow Financial Investment Management, Inc. | 4.003 | -19,29 | 516 | -26,39 | ||||
| 2026-02-13 | 13F | Rafferty Asset Management, LLC | 22.871 | 4,64 | 2.950 | -4,59 | ||||
| 2026-01-28 | 13F | Mowery & Schoenfeld Wealth Management, LLC | 344 | 0,00 | 44 | -8,33 | ||||
| 2026-02-05 | 13F | Triton Wealth Management, PLLC | 1.846 | -1,39 | 251 | -1,18 | ||||
| 2026-01-20 | 13F | SOA Wealth Advisors, LLC. | 1.031 | 0,39 | 133 | -8,28 | ||||
| 2026-02-17 | 13F | Toronto Dominion Bank | 151.216 | 76,90 | 19.504 | 61,33 | ||||
| 2026-01-14 | 13F | Romano Brothers And Company | 2.110 | 0,00 | 272 | -8,72 | ||||
| 2026-02-18 | 13F | State of Tennessee, Treasury Department | 76.108 | -27,91 | 10.227 | -31,50 | ||||
| 2026-02-26 | 13F | Anchor Investment Management, LLC | 169 | 0,00 | 22 | -8,70 | ||||
| 2026-01-14 | 13F | ORG Partners LLC | 56 | -35,63 | 7 | -41,67 | ||||
| 2025-10-24 | 13F | Hemington Wealth Management | 198 | 8,20 | 0 | |||||
| 2026-02-13 | 13F | Martingale Asset Management L P | 174.218 | 1,20 | 22.471 | -7,71 | ||||
| 2026-02-05 | 13F | Applied Finance Capital Management, LLC | 80.746 | -3,85 | 10.415 | -12,31 | ||||
| 2026-02-10 | 13F | Fiduciary Family Office, Llc | 1.791 | -1,54 | 231 | -10,12 | ||||
| 2026-02-17 | 13F | Cresset Asset Management, LLC | 9.751 | 235,20 | 1.269 | 206,28 | ||||
| 2026-02-10 | 13F | Horizon Bancorp Inc /in/ | 110 | -23,08 | 0 | |||||
| 2026-02-05 | 13F | Amalgamated Bank | 38.542 | -4,40 | 5 | -20,00 | ||||
| 2026-02-17 | 13F | Credit Agricole S A | 69.122 | 12,80 | 8.915 | 2,87 | ||||
| 2026-02-17 | 13F | XTX Topco Ltd | 6.046 | 172,59 | 780 | 148,88 | ||||
| 2026-01-26 | 13F | AE Wealth Management LLC | 123.173 | 3,93 | 15.887 | -5,23 | ||||
| 2026-03-13 | 13F/A | Pensionmark Financial Group, Llc | 2.789 | -24,60 | 360 | -31,36 | ||||
| 2026-01-12 | 13F | CVA Family Office, LLC | 228 | -5,39 | 29 | -14,71 | ||||
| 2026-02-17 | 13F | Cape Investment Advisory, Inc. | 1 | 0,00 | 0 | |||||
| 2026-02-12 | 13F | Triumph Capital Management | 9 | 0,00 | 1 | 0,00 | ||||
| 2026-02-17 | 13F | Evergreen Wealth Solutions, LLC | 4.080 | -20,11 | 526 | -27,15 | ||||
| 2026-02-10 | 13F | Mutual Of America Capital Management Llc | 22.295 | -0,90 | 2.876 | -9,62 | ||||
| 2026-02-06 | 13F | McKinley Carter Wealth Services, Inc. | 3.717 | -2,93 | 479 | -11,46 | ||||
| 2026-02-12 | 13F | Dimensional Fund Advisors Lp | 791.477 | 1,36 | 102.091 | -7,55 | ||||
| 2026-02-12 | 13F | Swiss National Bank | 568.800 | -4,91 | 73.364 | -13,29 | ||||
| 2026-02-23 | 13F | Mv Capital Management, Inc. | 295 | 0,00 | 38 | -2,56 | ||||
| 2026-01-13 | 13F | Stephens Consulting, LLC | 8.686 | 0,00 | 1.120 | -8,79 | ||||
| 2026-01-23 | 13F | Optima Capital Llc | 1 | 0 | ||||||
| 2026-01-15 | 13F | Mn Services Vermogensbeheer B.V. | 79.835 | 2,95 | 10 | 0,00 | ||||
| 2026-02-03 | 13F | Sigma Investment Counselors Inc | 7.664 | -3,44 | 988 | -11,94 | ||||
| 2026-02-17 | 13F | Private Advisor Group, LLC | 18.426 | -1,83 | 2.377 | -10,47 | ||||
| 2026-04-07 | 13F | Signaturefd, Llc | 3.246 | 2,30 | 475 | 15,89 | ||||
| 2026-02-10 | 13F | Commonwealth Of Pennsylvania Public School Empls Retrmt Sys | 48.308 | -3,09 | 6.231 | -11,63 | ||||
| 2025-10-31 | 13F | Symphony Financial, Ltd. Co. | 0 | -100,00 | 0 | -100,00 | ||||
| 2026-01-08 | 13F | True Wealth Design, LLC | 76 | -52,50 | 10 | -59,09 | ||||
| 2026-02-17 | 13F | Polymer Capital Management (US) LLC | 58.786 | -2,27 | 7.582 | -10,87 | ||||
| 2026-02-12 | 13F | CIBC Private Wealth Group, LLC | 60.818 | -0,00 | 7.844 | -8,80 | ||||
| 2026-02-17 | 13F | Advisor Group Holdings, Inc. | 93.321 | -12,06 | 12.041 | -18,12 | ||||
| 2026-02-13 | 13F | Jacobi Capital Management LLC | 4.908 | 2,21 | 633 | -6,77 | ||||
| 2026-02-09 | 13F | Smithfield Trust Co | 175 | 0,00 | 0 | |||||
| 2026-02-13 | 13F | Mariner, LLC | 5.557 | -85,74 | 715 | -87,05 | ||||
| 2026-02-17 | 13F | California State Teachers Retirement System | 248.411 | -0,29 | 32.040 | -9,07 | ||||
| 2026-03-16 | 13F | Bank of New Hampshire | 400 | 0,00 | 52 | -8,93 | ||||
| 2026-01-16 | 13F | Crewe Advisors LLC | 509 | 0,00 | 66 | -8,45 | ||||
| 2026-02-17 | 13F | Susquehanna International Group, Llp | 52.174 | 21,28 | 6.729 | 10,60 | ||||
| 2026-02-17 | 13F | Susquehanna International Group, Llp | Put | 9.400 | -1,05 | 1.212 | -9,75 | |||
| 2026-02-12 | 13F | Xponance, Inc. | 34.390 | 6,11 | 4.436 | -3,23 | ||||
| 2026-02-17 | 13F | Susquehanna International Group, Llp | Call | 59.700 | 7,96 | 7.700 | -1,55 | |||
| 2025-11-12 | 13F | Park Square Financial Group, LLC | 0 | -100,00 | 0 | |||||
| 2026-04-08 | 13F | Sapient Capital Llc | 1.724 | 254 | ||||||
| 2026-02-06 | 13F | Advisory Alpha, LLC | 2.274 | 0,13 | 293 | -7,28 | ||||
| 2026-02-11 | 13F | Stonebrook Private Inc. | 4.584 | 591 | ||||||
| 2026-02-04 | 13F | Clark Wealth Partners | 157 | 0,00 | 20 | 0,00 | ||||
| 2026-02-17 | 13F | Banco Bilbao Vizcaya Argentaria, S.a. | 5.904 | 5,43 | 761 | -3,91 | ||||
| 2026-02-17 | 13F | BTG Pactual Asset Management US LLC | 92.354 | 11.912 | ||||||
| 2026-04-06 | 13F | CX Institutional | 4.316 | -6,07 | 1 | |||||
| 2026-02-09 | 13F | Legal & General Group Plc | 1.381.945 | -1,13 | 178.243 | -9,84 | ||||
| 2026-02-12 | 13F | Voya Investment Management Llc | 260.186 | -2,42 | 33.559 | -11,01 | ||||
| 2026-01-20 | 13F | Ntv Asset Management Llc | 1.785 | -2,14 | 230 | -10,51 | ||||
| 2026-02-17 | 13F | Boothbay Fund Management, Llc | 2.273 | 293 | ||||||
| 2026-02-17 | 13F | Nissay Asset Management Corp /japan/ /adv | 26.634 | 1,56 | 3.435 | -7,39 | ||||
| 2026-02-05 | 13F | High Note Wealth, LLC | 2 | 100,00 | 0 | |||||
| 2026-03-05 | 13F | Gunpowder Capital Management, LLC dba Oliver Wealth Management | 514 | 66 | ||||||
| 2026-02-05 | 13F | Bessemer Group Inc | 3.782 | 5,91 | 0 | |||||
| 2026-02-11 | 13F | Commonwealth Retirement Investments LLC | 150 | 19 | ||||||
| 2026-02-05 | 13F | Atria Investments Llc | 13.581 | 15,87 | 1.752 | 5,67 | ||||
| 2026-02-13 | 13F | Essex Investment Management Co Llc | 728 | 0,00 | 94 | -8,82 | ||||
| 2026-02-13 | 13F | Icon Advisers Inc/co | 24.659 | -7,15 | 3.181 | -15,34 | ||||
| 2026-01-27 | 13F | GHP Investment Advisors, Inc. | 1.359 | 0,00 | 175 | -8,85 | ||||
| 2026-02-04 | 13F | Paradigm Asset Management Co Llc | 6.500 | -7,14 | 838 | -15,35 | ||||
| 2026-02-17 | 13F | Equitable Holdings, Inc. | 4.140 | -2,52 | 534 | -11,17 | ||||
| 2026-01-30 | 13F | Jennison Associates Llc | 355.298 | -30,72 | 45.826 | -36,82 | ||||
| 2026-02-04 | 13F | Tsfg, Llc | 236 | 0,00 | 0 | |||||
| 2026-02-13 | 13F | Integrated Wealth Concepts LLC | 4.354 | -31,30 | 562 | -37,39 | ||||
| 2026-01-20 | 13F | Princeton Global Asset Management LLC | 4.395 | 2,09 | 567 | -6,91 | ||||
| 2026-02-09 | 13F | Nicolet Bankshares Inc | 1.750 | 226 | ||||||
| 2025-11-20 | 13F | Maven Securities LTD | Call | 0 | -100,00 | 0 | -100,00 | |||
| 2026-01-16 | 13F | Louisiana State Employees Retirement System | 10.600 | -2,75 | 1.367 | -11,29 | ||||
| 2026-02-06 | 13F | Vestmark Advisory Solutions, Inc. | 7.041 | 32,42 | 908 | 20,91 | ||||
| 2025-11-12 | 13F | Smith, Moore & Co. | 0 | -100,00 | 0 | |||||
| 2026-01-21 | 13F | Newbridge Financial Services Group, Inc. | 106 | 0,95 | 14 | -7,14 | ||||
| 2026-02-13 | 13F | Van Eck Associates Corp | 1.736 | 0 | ||||||
| 2026-02-11 | 13F | Paragon Private Wealth Management, LLC | 2.518 | 1,86 | 325 | -7,16 | ||||
| 2026-01-14 | 13F | Jfs Wealth Advisors, Llc | 379 | 5,57 | 49 | -3,92 | ||||
| 2026-02-11 | 13F | Flagship Wealth Advisors, Llc | 721 | 0,00 | 93 | -8,91 | ||||
| 2026-02-11 | 13F | Simplex Trading, Llc | Call | 6.600 | 135,71 | 851 | ||||
| 2026-01-28 | 13F | White Pine Investment CO | 1.683 | 0,24 | 0 | |||||
| 2025-10-30 | 13F | Ridgewood Investments LLC | 0 | -100,00 | 0 | |||||
| 2026-02-11 | 13F | Simplex Trading, Llc | Put | 200 | -77,78 | 26 | ||||
| 2025-11-13 | 13F/A | Peak6 Llc | 0 | -100,00 | 0 | |||||
| 2026-01-21 | 13F | Sound Income Strategies, LLC | 1.313 | 32,23 | 178 | 27,34 | ||||
| 2026-02-10 | 13F | Lido Advisors, LLC | 65.517 | 0,96 | 8.885 | -3,57 | ||||
| 2026-01-15 | 13F | Fifth Third Wealth Advisors LLC | 2.109 | -6,72 | 272 | -14,73 | ||||
| 2026-02-11 | 13F | Fox Run Management, L.l.c. | 4.025 | 519 | ||||||
| 2026-02-13 | 13F | Bridgewater Associates, LP | 33.254 | 19,18 | 4.289 | 8,69 | ||||
| 2026-02-13 | 13F | Ostrum Asset Management | 3.047 | 214,12 | 393 | 186,86 | ||||
| 2026-01-20 | 13F | Trust Co Of Toledo Na /oh/ | 2.236 | 0,00 | 288 | -8,86 | ||||
| 2026-03-04 | 13F | SHP Wealth Management | 268 | 35 | ||||||
| 2026-02-06 | 13F | Resona Asset Management Co.,Ltd. | 64.120 | -5,22 | 8.277 | -13,43 | ||||
| 2026-02-12 | 13F | MetLife Investment Management, LLC | 49.776 | -3,34 | 6.420 | -11,85 | ||||
| 2026-01-16 | 13F | Tema Etfs Llc | 3.375 | -0,24 | 435 | -9,00 | ||||
| 2026-02-13 | 13F | Schroder Investment Management Group | 54.656 | 17,92 | 7.093 | 8,64 | ||||
| 2025-11-07 | 13F | Atticus Wealth Management, Llc | 0 | -100,00 | 0 | -100,00 | ||||
| 2026-02-11 | 13F | Allianz Asset Management GmbH | 4.072 | -82,51 | 525 | -84,05 | ||||
| 2026-02-10 | 13F | Axq Capital, Lp | 7.952 | 1.026 | ||||||
| 2026-02-05 | 13F | Pinnacle Associates Ltd | 12.231 | 0,02 | 1.578 | -8,79 | ||||
| 2026-04-02 | 13F | NorthAvenue LLC | 1 | 0 | ||||||
| 2026-02-12 | 13F | Mount Yale Investment Advisors, LLC | 9.798 | 145,56 | 1.275 | 124,47 | ||||
| 2026-02-11 | 13F | Zions Bancorporation, National Association /ut/ | 91 | -13,33 | 12 | -21,43 | ||||
| 2026-02-18 | 13F | GWM Advisors LLC | 373.241 | 1,73 | 48.141 | -7,22 | ||||
| 2026-01-13 | 13F | Signal Advisors Wealth, LLC | 4.321 | 557 | ||||||
| 2026-01-30 | 13F | State of New Jersey Common Pension Fund D | 61.052 | -3,39 | 7.874 | -11,89 | ||||
| 2026-02-17 | 13F | Creative Planning | 80.767 | 0,32 | 10.417 | -8,51 | ||||
| 2026-02-12 | 13F | UniSuper Management Pty Ltd | 23.520 | -1,40 | 3.034 | -10,08 | ||||
| 2026-02-05 | 13F | Hills Bank & Trust Co | 800 | 103 | ||||||
| 2026-04-10 | 13F | Finward Bancorp | 6.000 | 0,00 | 877 | 13,45 | ||||
| 2025-10-27 | 13F | PBMares Wealth Management LLC | 2.301 | 0,00 | 325 | 6,91 | ||||
| 2026-01-16 | 13F | Ronald Blue Trust, Inc. | 2.516 | -14,83 | 325 | -22,30 | ||||
| 2026-01-22 | 13F | Personal Cfo Solutions, Llc | 1.643 | -4,48 | 212 | -13,17 | ||||
| 2025-11-14 | 13F | Strategic Wealth Partners, Ltd. | 160 | 0,00 | 23 | 4,76 | ||||
| 2026-01-06 | 13F | Tucker Asset Management Llc | 0 | -100,00 | 0 | |||||
| 2026-01-27 | 13F | Belpointe Asset Management LLC | 2.400 | 28,14 | 310 | 17,05 | ||||
| 2026-02-09 | 13F | Fidelis Capital Partners, LLC | 0 | -100,00 | 0 | -100,00 | ||||
| 2026-02-11 | 13F | Meeder Advisory Services, Inc. | 4.818 | -19,50 | 621 | -26,60 | ||||
| 2026-02-17 | 13F | Millennium Management Llc | 2.729.226 | 227,40 | 352.016 | 198,58 | ||||
| 2025-11-14 | 13F | Financial Network Wealth Management LLC | 0 | -100,00 | 0 | |||||
| 2025-11-14 | 13F | ICONIQ Capital, LLC | 0 | -100,00 | 0 | |||||
| 2026-02-17 | 13F | Freestone Grove Partners LP | 469.260 | 60.525 | ||||||
| 2026-01-21 | 13F | Albion Financial Group /ut | 59 | -13,24 | 8 | -22,22 | ||||
| 2026-02-17 | 13F | Jump Financial, LLC | 3.941 | -58,11 | 508 | -61,80 | ||||
| 2026-02-02 | 13F | FSA Advisors, Inc. | 6.747 | 94,16 | 870 | 77,19 | ||||
| 2025-11-13 | 13F/A | Peak6 Llc | Put | 0 | -100,00 | 0 | ||||
| 2026-01-20 | 13F | AdvisorNet Financial, Inc | 3.013 | 23,69 | 389 | 12,79 | ||||
| 2026-01-30 | 13F | Laurel Wealth Advisors LLC | 195 | 25 | ||||||
| 2026-02-17 | 13F | Shay Capital LLC | 5.000 | 645 | ||||||
| 2026-01-26 | 13F | Mirae Asset Global Investments Co., Ltd. | 34.227 | 23,34 | 4.415 | 12,49 | ||||
| 2026-01-14 | 13F | Pallas Capital Advisors LLC | 37.428 | 8,85 | 4.827 | -0,74 | ||||
| 2026-02-13 | 13F | Mml Investors Services, Llc | 23.304 | 8,52 | 3.006 | -1,05 | ||||
| 2026-01-15 | 13F | Allspring Global Investments Holdings, LLC | 188.845 | 43,99 | 24.618 | 33,93 | ||||
| 2026-02-10 | 13F | Goldman Sachs Group Inc | 1.120.231 | -1,53 | 144.487 | -10,20 | ||||
| 2026-02-13 | 13F | Pinnacle Wealth Planning Services, Inc. | 209 | 27 | ||||||
| 2026-04-10 | 13F | Impact Capital Partners LLC | 8.079 | -0,09 | 1.181 | 13,34 | ||||
| 2026-01-07 | 13F | Massmutual Trust Co Fsb/adv | 3.825 | -2,45 | 493 | -11,01 | ||||
| 2026-02-17 | 13F | Capitolis Liquid Global Markets LLC | 47.000 | 6.062 | ||||||
| 2026-01-21 | 13F | SJS Investment Consulting Inc. | 3.738 | 0,00 | 482 | -8,71 | ||||
| 2026-01-27 | 13F | First Horizon Corp | 259 | 2,78 | 33 | -5,71 | ||||
| 2026-01-27 | 13F | Retirement Income Solutions, Inc | 2.435 | 1,42 | 314 | -7,37 | ||||
| 2026-02-13 | 13F | Bridgefront Capital, LLC | 2.269 | 293 | ||||||
| 2026-01-07 | 13F | Aventura Private Wealth, LLC | 121 | 0,00 | 16 | -11,76 | ||||
| 2026-02-12 | 13F | Bank Of Montreal /can/ | 246.041 | 10,34 | 31.734 | 0,63 | ||||
| 2026-02-13 | 13F | Transamerica Financial Advisors, Inc. | 95 | 12 | ||||||
| 2026-01-14 | 13F | International Private Wealth Advisors LLC | 1.936 | -0,46 | 250 | -9,45 | ||||
| 2026-01-12 | 13F | Rialto Wealth Management, LLC | 3 | 0,00 | 0 | |||||
| 2026-02-02 | 13F | Ashton Thomas Securities, Llc | 0 | -100,00 | 0 | |||||
| 2026-02-10 | 13F | Kentucky Retirement Systems | 13.009 | 0,00 | 1.678 | -8,81 | ||||
| 2026-02-11 | 13F | SOUTH STATE Corp | 38 | 11,76 | 5 | 0,00 | ||||
| 2026-02-06 | 13F | HighTower Advisors, LLC | 74.530 | -18,34 | 9.613 | -25,53 | ||||
| 2026-02-17 | 13F/A | North Capital, Inc. | 0 | -100,00 | 0 | |||||
| 2026-01-30 | 13F | Kohmann Bosshard Financial Services, LLC | 1.000 | 129 | ||||||
| 2026-01-23 | 13F | Rsm Us Wealth Management Llc | 9.008 | -6,87 | 1.169 | -15,17 | ||||
| 2026-01-28 | 13F | Oversea-Chinese Banking CORP Ltd | 5.082 | 655 | ||||||
| 2026-01-27 | 13F | Godsey & Gibb Associates | 400 | 0,00 | 52 | -8,93 | ||||
| 2026-02-17 | 13F | Lakeshore Financial Planning, Inc. | 5.753 | 0,09 | 742 | -8,73 | ||||
| 2026-02-03 | 13F | Farmers & Merchants Investments Inc | 140 | 0,00 | 18 | -5,26 | ||||
| 2026-01-14 | 13F | Centennial Wealth Advisory LLC | 6.678 | 2,19 | 862 | -6,82 | ||||
| 2026-01-20 | 13F | SS&H Financial Advisors, Inc. | 4.600 | 0,00 | 1 | -100,00 | ||||
| 2026-01-28 | 13F | Salomon & Ludwin, LLC | 257 | -15,74 | 33 | -21,43 | ||||
| 2026-02-17 | 13F | Dark Forest Capital Management Lp | 80.633 | 36,25 | 10.400 | 24,25 | ||||
| 2026-02-13 | 13F | PCM Encore, LLC | 2.634 | 340 | ||||||
| 2026-01-26 | 13F | Parcion Private Wealth LLC | 6.050 | -4,24 | 780 | -12,65 | ||||
| 2026-02-11 | 13F | TCTC Holdings, LLC | 604 | 0,00 | 78 | -9,41 | ||||
| 2026-02-17 | 13F | Prosperity Consulting Group, LLC | 6.266 | -8,94 | 808 | -16,96 | ||||
| 2026-02-10 | 13F | Founders Financial Securities Llc | 8.410 | 3,53 | 1.085 | -5,57 | ||||
| 2026-02-13 | 13F | Umb Bank N A/mo | 9.187 | 0,62 | 1.185 | -8,29 | ||||
| 2026-02-13 | 13F | Centiva Capital, LP | 1.636 | 211 | ||||||
| 2026-02-12 | 13F | Chilton Capital Management Llc | 4 | 1 | ||||||
| 2026-02-02 | 13F | Cornerstone Planning Group LLC | 44 | 1.000,00 | 6 | |||||
| 2026-02-11 | 13F | GW&K Investment Management, LLC | 154 | 0 | ||||||
| 2026-02-17 | 13F | Ancora Advisors, LLC | 1.432 | 9,90 | 185 | 0,00 | ||||
| 2026-02-06 | 13F | Csenge Advisory Group | 1.676 | 1,15 | 216 | -7,69 | ||||
| 2026-02-17 | 13F | Bank Of America Corp /de/ | Call | 0 | -100,00 | 0 | ||||
| 2026-02-11 | 13F | Deseret Mutual Benefit Administrators | 283 | 0,00 | 37 | -10,00 | ||||
| 2026-02-05 | 13F | Cambridge Investment Research Advisors, Inc. | 37.518 | 5,09 | 5 | -20,00 | ||||
| 2026-02-02 | 13F | Sandro Wealth Management LLC | 1.601 | 206 | ||||||
| 2026-01-26 | 13F | Private Trust Co Na | 2.025 | -1,36 | 261 | -10,00 | ||||
| 2026-04-01 | 13F | Rowland & Co Investment Counsel/adv | 897 | 0,00 | 131 | 13,91 | ||||
| 2026-01-20 | 13F | Ethos Financial Group, LLC | 3.668 | 0,00 | 473 | -8,69 | ||||
| 2026-02-10 | 13F | Natixis Advisors, L.p. | 137.499 | -7,62 | 18 | -19,05 | ||||
| 2026-01-21 | 13F | Aaron Wealth Advisors LLC | 2.585 | -50,18 | 333 | -54,57 | ||||
| 2026-02-17 | 13F | Price T Rowe Associates Inc /md/ | 1.095.466 | -0,72 | 141 | -9,62 | ||||
| 2026-02-19 | 13F | CI Private Wealth, LLC | 49.206 | 2,77 | 6.092 | -10,03 | ||||
| 2026-02-10 | 13F | Reaves W H & Co Inc | 417.526 | -28,83 | 53.853 | -35,10 | ||||
| 2026-02-04 | 13F | Hartford Investment Management Co | 11.952 | -1,40 | 1.542 | -10,09 | ||||
| 2026-02-09 | 13F | Beck Bode, LLC | 127.692 | 16.470 | ||||||
| 2026-01-28 | 13F | Chicago Partners Investment Group LLC | 3.762 | -24,76 | 505 | -27,65 | ||||
| 2026-02-06 | 13F | Lloyd Advisory Services, LLC. | 3 | 0 | ||||||
| 2026-01-12 | 13F | DAVENPORT & Co LLC | 0 | -100,00 | 0 | -100,00 | ||||
| 2026-01-23 | 13F | Patton Fund Management, Inc. | 1.634 | 0,00 | 211 | -9,09 | ||||
| 2026-02-11 | 13F | First Command Advisory Services, Inc. | 738 | 3,94 | 95 | -5,00 | ||||
| 2026-02-12 | 13F/A | Pinebridge Investments Llc | 9.388 | 1.211 | ||||||
| 2026-02-02 | 13F | Hussman Strategic Advisors, Inc. | 100 | 0,00 | 13 | -14,29 | ||||
| 2026-01-20 | 13F | Savvy Advisors, Inc. | 3.270 | 25,62 | 422 | 14,40 | ||||
| 2026-02-12 | 13F | McMillan Office, Inc. | 3.808 | 491 | ||||||
| 2026-02-05 | 13F | Center for Financial Planning, Inc. | 7.473 | 57,26 | 964 | 43,30 | ||||
| 2026-02-09 | 13F | Geode Capital Management, Llc | 5.592.670 | 2,14 | 718.668 | -6,83 | ||||
| 2026-02-13 | 13F | First Trust Advisors Lp | 746.808 | -7,26 | 96.323 | -15,42 | ||||
| 2026-02-05 | 13F | Blue Water Asset Management | 7.251 | 935 | ||||||
| 2026-01-09 | 13F | Montecito Bank & Trust | 2.931 | 0,00 | 378 | -8,70 | ||||
| 2026-01-14 | 13F | Wolff Wiese Magana Llc | 94 | 0,00 | 12 | -7,69 | ||||
| 2025-10-28 | 13F | Prossimo Advisors, LLC | 0 | -100,00 | 0 | |||||
| 2026-02-17 | 13F | Laird Norton Trust Company, Llc | 6.600 | 859 | ||||||
| 2026-01-30 | 13F | Trifecta Capital Advisors, LLC | 0 | -100,00 | 0 | |||||
| 2026-02-14 | 13F | Howe & Rusling Inc | 77.398 | -2,79 | 9.983 | -11,35 | ||||
| 2026-02-09 | 13F | CBIZ Investment Advisory Services, LLC | 57 | 35,71 | 7 | 40,00 | ||||
| 2025-11-03 | 13F | Oxler Private Wealth LLC | 0 | -100,00 | 0 | |||||
| 2025-10-24 | 13F | Opal Wealth Advisors, LLC | 0 | -100,00 | 0 | -100,00 | ||||
| 2026-02-10 | 13F | Hilltop Partners LLC | 2.304 | 0,00 | 297 | -8,62 | ||||
| 2026-02-11 | 13F | Cedar Mountain Advisors, LLC | 8 | 0,00 | 1 | 0,00 | ||||
| 2026-02-17 | 13F/A | Kovack Advisors, Inc. | 1.567 | 202 | ||||||
| 2026-01-16 | 13F | Standard Life Aberdeen plc | 105.436 | 12,81 | 13.599 | 3,29 | ||||
| 2026-02-11 | 13F | Havemeyer Place LP | 6.571 | 848 | ||||||
| 2026-02-13 | 13F | Barclays Plc | 907.754 | -1,33 | 117.082 | -10,02 | ||||
| 2026-02-03 | 13F | Morse Asset Management, Inc | 21 | 0,00 | 3 | 0,00 | ||||
| 2026-01-28 | 13F | DekaBank Deutsche Girozentrale | 35.613 | 0,00 | 4 | -20,00 | ||||
| 2026-02-17 | 13F | Blair William & Co/il | 10.337 | -1,32 | 1.333 | -9,99 | ||||
| 2026-02-12 | 13F | Great Valley Advisor Group, Inc. | 1.715 | 221 | ||||||
| 2026-02-18 | 13F | Caitlin John, LLC | 100 | 13 | ||||||
| 2026-01-14 | 13F | Wealthcare Advisory Partners LLC | 5.031 | -0,69 | 649 | -9,50 | ||||
| 2026-02-04 | 13F | Sentry Investment Management Llc | 532 | 0,00 | 0 | |||||
| 2026-02-17 | 13F | Janus Henderson Group Plc | 3.044.198 | 2,18 | 392.641 | -6,81 | ||||
| 2026-02-13 | 13F | Cornerstone Financial Management LLC | 13 | 2 | ||||||
| 2025-11-13 | 13F | Quadrature Capital Ltd | 0 | -100,00 | 0 | |||||
| 2026-02-10 | 13F | Foundations Investment Advisors, LLC | 3.129 | -0,64 | 404 | -9,44 | ||||
| 2026-02-10 | 13F | DT Investment Partners, LLC | 199 | 0,00 | 26 | -10,71 | ||||
| 2025-11-14 | 13F | AXA Investment Managers S.A. | 20.259 | 2.865 | ||||||
| 2026-02-13 | 13F | Hudson Bay Capital Management LP | 0 | -100,00 | 0 | |||||
| 2026-02-17 | 13F | Qube Research & Technologies Ltd | 692.514 | 546,75 | 89.320 | 489,84 | ||||
| 2026-02-12 | 13F | APG Asset Management N.V. | 106.256 | -46,31 | 11.669 | -51,01 | ||||
| 2026-04-10 | 13F | Baker Tilly Financial, Llc | 2.066 | -30,44 | 302 | -21,15 | ||||
| 2026-01-20 | 13F | American National Bank | 444 | 0,00 | 57 | -8,06 | ||||
| 2026-02-02 | 13F | TCI Wealth Advisors, Inc. | 2.349 | -0,59 | 303 | -9,58 | ||||
| 2026-02-17 | 13F | Utah Retirement Systems | 34.012 | 0,00 | 4.387 | -8,81 | ||||
| 2026-02-10 | 13F | Bank of New York Mellon Corp | 1.243.926 | -2,73 | 160.442 | -11,30 | ||||
| 2026-02-04 | 13F | Oxbow Advisors, LLC | 24.383 | 3.145 | ||||||
| 2026-02-13 | 13F | Victory Capital Management Inc | 361.403 | -0,24 | 46.614 | -9,02 | ||||
| 2026-02-17 | 13F | Bank Of America Corp /de/ | 1.467.597 | -9,23 | 189.291 | -17,22 | ||||
| 2026-02-13 | 13F | Pathstone Holdings, LLC | 23.709 | -2,01 | 3.061 | -10,63 | ||||
| 2026-02-13 | 13F | Morgan Stanley | 2.468.125 | -0,69 | 318.339 | -9,43 | ||||
| 2026-01-29 | 13F | Vanguard Group Inc | 26.305.533 | 3,00 | 3.392.888 | -6,07 | ||||
| 2026-02-13 | 13F | Wexford Capital Lp | 1.640 | 212 | ||||||
| 2026-02-17 | 13F | Tower Research Capital LLC (TRC) | 8.824 | -15,00 | 1.138 | -22,48 | ||||
| 2026-02-06 | 13F | Global Retirement Partners, LLC | 3.034 | 26,31 | 391 | 15,34 | ||||
| 2026-04-07 | 13F | CoreCap Advisors, LLC | 32.663 | -48,09 | 4.776 | -41,17 | ||||
| 2026-02-17 | 13F | Westwood Holdings Group Inc | 93.654 | -6,17 | 12.079 | -14,43 | ||||
| 2026-02-12 | 13F | Hrt Financial Lp | 24.244 | -70,01 | 3 | -72,73 | ||||
| 2025-11-14 | 13F | Corton Capital Inc. | 0 | -100,00 | 0 | -100,00 | ||||
| 2026-02-11 | 13F | Capital International Inc /ca/ | 118.281 | 14,64 | 15.256 | 4,54 | ||||
| 2026-01-05 | 13F | Foguth Wealth Management, LLC. | 4.965 | 44,29 | 647 | 42,20 | ||||
| 2026-04-09 | 13F | FCG Investment Co | 0 | -100,00 | 0 | |||||
| 2026-02-17 | 13F | Schonfeld Strategic Advisors LLC | 59.743 | 7.706 | ||||||
| 2026-01-30 | 13F | Citizens Financial Group Inc/ri | 2.884 | 12,00 | 372 | 1,92 | ||||
| 2026-01-13 | 13F | Mather Group, Llc. | 1.892 | -7,57 | 244 | -15,92 | ||||
| 2025-11-13 | 13F | Arrowstreet Capital, Limited Partnership | 0 | -100,00 | 0 | |||||
| 2026-04-08 | 13F | Arlington Trust Co LLC | 35 | 5 | ||||||
| 2026-02-10 | 13F | Godfrey Financial Associates, Inc. | 2 | 0 | ||||||
| 2026-02-06 | 13F | Creative Financial Designs Inc /adv | 175 | 0,00 | 23 | -8,33 | ||||
| 2026-02-17 | 13F | Alliancebernstein L.p. | 337.790 | 50,05 | 43.568 | 36,85 | ||||
| 2025-11-14 | 13F | Texas Permanent School Fund | 0 | -100,00 | 0 | -100,00 | ||||
| 2026-02-12 | 13F | Cibc World Markets Corp | 31.061 | 18,95 | 4.006 | 15,85 | ||||
| 2026-02-20 | 13F | Kovitz Investment Group Partners, LLC | 3.436 | -75,90 | 443 | -78,09 | ||||
| 2026-02-13 | 13F | Chevy Chase Trust Holdings, Inc. | 105.295 | -0,70 | 13.581 | -9,44 | ||||
| 2026-01-23 | 13F | Sage Mountain Advisors LLC | 1.559 | -50,32 | 201 | -54,63 | ||||
| 2026-02-13 | 13F | Healthcare Of Ontario Pension Plan Trust Fund | 8.210 | -0,09 | 1.059 | -8,95 | ||||
| 2026-02-17 | 13F | State Of Wisconsin Investment Board | 127.972 | 1,79 | 16.506 | -7,18 | ||||
| 2026-02-17 | 13F | Jain Global LLC | 82.422 | 10.631 | ||||||
| 2026-01-23 | 13F | Pinnacle Wealth Management Group, Inc. | 3.048 | 0,00 | 393 | -8,82 | ||||
| 2026-02-11 | 13F | Inceptionr Llc | 3.623 | -16,60 | 467 | -23,94 | ||||
| 2025-11-05 | 13F | Key FInancial Inc | 0 | -100,00 | 0 | |||||
| 2026-02-12 | 13F | Nuveen, LLC | 441.807 | 3,43 | 56.984 | -5,67 | ||||
| 2026-02-09 | 13F | Rhl Group, Llc | 1.716 | 221 | ||||||
| 2026-01-12 | 13F | Contravisory Investment Management, Inc. | 0 | -100,00 | 0 | -100,00 | ||||
| 2026-01-16 | 13F | Marquette Asset Management, LLC | 0 | -100,00 | 0 | |||||
| 2026-01-29 | 13F | Sanctuary Advisors, LLC | 25.495 | -0,54 | 3.288 | -9,30 | ||||
| 2026-02-17 | 13F | MIRAE ASSET GLOBAL ETFS HOLDINGS Ltd. | 19.419 | 0,68 | 2.505 | -8,18 | ||||
| 2026-01-30 | 13F | Rachor Investment Advisory Services, LLC | 25 | 3 | ||||||
| 2026-02-17 | 13F | Farringdon Capital, Ltd. | 0 | -100,00 | 0 | |||||
| 2026-01-30 | 13F | Oakworth Capital, Inc. | 501 | 0,00 | 65 | -8,57 | ||||
| 2026-02-17 | 13F | ExodusPoint Capital Management, LP | 0 | -100,00 | 0 | -100,00 | ||||
| 2026-02-17 | 13F | WFA of San Diego, LLC | 0 | -100,00 | 0 | |||||
| 2026-01-21 | 13F | Flagship Harbor Advisors, Llc | 64 | 8 | ||||||
| 2025-11-07 | 13F | Sierra Ocean, Llc | 0 | -100,00 | 0 | |||||
| 2026-02-03 | 13F | Ethic Inc. | 10.205 | 7,15 | 1.316 | -2,23 | ||||
| 2026-02-11 | 13F | Tiaa Trust, National Association | 2.267 | -3,00 | 292 | -11,52 | ||||
| 2026-02-13 | 13F | Wells Fargo & Company/mn | 317.248 | 19,36 | 40.919 | 8,85 | ||||
| 2026-02-13 | 13F | Y-Intercept (Hong Kong) Ltd | 5.808 | -77,60 | 749 | -79,57 | ||||
| 2026-02-17 | 13F | Quantinno Capital Management LP | 139.207 | -13,91 | 17.955 | -21,49 | ||||
| 2026-02-12 | 13F | Affinity Investment Advisors, Llc | 1.620 | 0,00 | 209 | -9,17 | ||||
| 2026-02-06 | 13F | Gsa Capital Partners Llp | 17.102 | 2 | ||||||
| 2026-02-17 | 13F | Balyasny Asset Management Llc | 1.080.964 | 139.423 | ||||||
| 2026-01-20 | 13F | J2 Capital Management Inc | 2.597 | 0,00 | 335 | -8,99 | ||||
| 2026-01-22 | 13F | Charter Trust Co | 1.778 | -0,06 | 229 | -8,76 | ||||
| 2026-01-29 | 13F | Inscription Capital, LLC | 4.503 | -29,45 | 581 | -35,70 | ||||
| 2026-02-13 | 13F | Baird Financial Group, Inc. | 33.939 | -8,88 | 4.377 | -16,90 | ||||
| 2026-02-12 | 13F | Colonial Trust Advisors | 145 | 0,00 | 19 | -10,00 | ||||
| 2026-02-11 | 13F | Rise Advisors, LLC | 0 | -100,00 | 0 | |||||
| 2026-02-17 | 13F | Fairscale Capital, LLC | 1.093 | 39,95 | 142 | 27,03 | ||||
| 2026-04-09 | 13F | Park Place Capital Corp | 14 | -22,22 | 2 | 0,00 | ||||
| 2026-02-13 | 13F | Venture Visionary Partners LLC | 4.033 | -1,75 | 520 | -10,34 | ||||
| 2026-02-10 | 13F | CIBC Asset Management Inc | 53.763 | 58,09 | 6.934 | 44,19 | ||||
| 2026-02-11 | 13F | Capital Research Global Investors | 12.447.948 | 3,14 | 1.605.539 | -5,94 | ||||
| 2026-01-21 | 13F | Cidel Asset Management Inc | 0 | -100,00 | 0 | |||||
| 2026-02-11 | 13F | Parallel Advisors, LLC | 2.189 | 4,49 | 282 | -4,73 | ||||
| 2026-02-17 | 13F | Point72 Asset Management, L.P. | 1.150.017 | 148.329 | ||||||
| 2026-02-10 | 13F | Smith Group Asset Management, LLC | 3.000 | 0,00 | 387 | -8,96 | ||||
| 2026-02-05 | 13F | 626 Financial, LLC | 1.822 | 0,05 | 235 | -8,56 | ||||
| 2026-02-13 | 13F | Towarzystwo Funduszy Inwestycyjnych Pzu Sa | 355 | 0,00 | 46 | -10,00 | ||||
| 2026-02-13 | 13F | Sterling Capital Management LLC | 12.818 | -4,00 | 1.653 | -12,45 | ||||
| 2026-02-09 | 13F | Allstate Corp | 15.239 | 99,41 | 1.966 | 81,94 | ||||
| 2026-03-06 | 13F | Hsbc Holdings Plc | 387.409 | 11,09 | 49.983 | 1,39 | ||||
| 2026-04-10 | 13F | Northside Capital Management, LLC | 25.926 | -30,93 | 3.791 | -21,71 | ||||
| 2026-02-13 | 13F | Gen-Wealth Partners Inc | 553 | 0,00 | 71 | -8,97 | ||||
| 2026-01-27 | 13F | Evergreen Capital Management Llc | 2.292 | 7,50 | 297 | -1,98 | ||||
| 2026-01-26 | 13F | KBC Group NV | 19.963 | 7,61 | 3 | 0,00 | ||||
| 2026-02-13 | 13F | Gts Securities Llc | 2.118 | -54,58 | 273 | -58,57 | ||||
| 2026-01-30 | 13F/A | M&t Bank Corp | 7.516 | 37,76 | 969 | 25,68 | ||||
| 2026-02-13 | 13F | USS Investment Management Ltd | 32.394 | 0,00 | 4.178 | -8,76 | ||||
| 2026-02-13 | 13F | Luminist Capital LLC | 75 | 0,00 | 10 | -10,00 | ||||
| 2025-11-14 | 13F | Empower Advisory Group, LLC | 0 | -100,00 | 0 | |||||
| 2026-01-23 | 13F | Gilliland Jeter Wealth Management LLC | 22.425 | 0,00 | 2.892 | -8,80 | ||||
| 2026-01-26 | 13F | Merit Financial Group, LLC | 10.517 | 22,72 | 1.357 | 11,88 | ||||
| 2026-02-17 | 13F | Teza Capital Management LLC | 2.445 | 315 | ||||||
| 2026-02-03 | 13F | Legacy Wealth Managment, LLC/ID | 255 | 0,00 | 33 | -11,11 | ||||
| 2026-01-29 | 13F | S.A. Mason LLC | 1.039 | -0,48 | 134 | -8,84 | ||||
| 2026-02-10 | 13F | Ritter Daniher Financial Advisory LLC / DE | 70 | 0,00 | 9 | -11,11 | ||||
| 2026-02-13 | 13F | Cohen & Steers, Inc. | 973.829 | 126 | ||||||
| 2026-04-09 | 13F | Secure Asset Management, LLC | 4.122 | -14,64 | 603 | -3,22 | ||||
| 2026-01-30 | 13F | Catalytic Wealth RIA, LLC | 0 | -100,00 | 0 | |||||
| 2026-01-27 | 13F | Probity Advisors, Inc. | 6.853 | 3,04 | 884 | -6,06 | ||||
| 2026-02-13 | 13F | GQG Partners LLC | 0 | -100,00 | 0 | -100,00 | ||||
| 2026-02-17 | 13F | Quantitative Investment Management, LLC | 0 | -100,00 | 0 | -100,00 | ||||
| 2026-01-26 | 13F | Reyes Financial Architecture, Inc. | 53 | 0,00 | 7 | -14,29 | ||||
| 2026-02-12 | 13F | Brinker Capital Investments, LLC | 5.001 | -24,38 | 645 | -31,02 | ||||
| 2026-02-13 | 13F | Bank Of Nova Scotia | 32.486 | -5,80 | 4.190 | -14,09 | ||||
| 2026-01-14 | 13F | USA Financial Portformulas Corp | 6 | -99,85 | 1 | -100,00 | ||||
| 2026-02-06 | 13F | EverSource Wealth Advisors, LLC | 1.096 | -19,59 | 141 | -26,56 | ||||
| 2026-01-23 | 13F | Smallwood Wealth Investment Management, LLC | 142 | 0,00 | 18 | -10,00 | ||||
| 2026-02-13 | 13F | Quarry LP | 2.594 | 335 | ||||||
| 2026-02-17 | 13F | Engineers Gate Manager LP | 84.618 | 1.441,59 | 10.914 | 1.306,44 | ||||
| 2026-01-27 | 13F | Morey & Quinn Wealth Partners, LLC | 1.693 | 0,36 | 218 | -8,40 | ||||
| 2026-01-28 | 13F | Gentry Private Wealth, Llc | 2.542 | 328 | ||||||
| 2026-02-17 | 13F | Ameriflex Group, Inc. | 3 | -50,00 | 0 | |||||
| 2026-02-13 | 13F | Palisade Asset Management, LLC | 3.000 | 0,00 | 387 | -8,96 | ||||
| 2026-02-10 | 13F | Strategic Advisors LLC | 48.695 | 0,00 | 6.281 | -8,80 | ||||
| 2026-02-09 | 13F | Hantz Financial Services, Inc. | 96.363 | 88,38 | 8 | 0,00 | ||||
| 2025-11-13 | 13F | Total Investment Management Inc | 0 | -100,00 | 0 | |||||
| 2026-02-05 | 13F | North Dakota State Investment Board | 7.105 | 916 | ||||||
| 2026-02-11 | 13F | Vise Technologies, Inc. | 5.560 | 29,72 | 717 | 18,32 | ||||
| 2026-02-24 | 13F | DGS Capital Management, LLC | 0 | -100,00 | 0 | |||||
| 2026-01-28 | 13F | Confluence Wealth Services, Inc. | 2.332 | 0,00 | 301 | -8,81 | ||||
| 2026-02-10 | 13F | Essex Financial Services, Inc. | 2.656 | -26,85 | 343 | -33,33 | ||||
| 2026-01-08 | 13F | Wedmont Private Capital | 0 | -100,00 | 0 | -100,00 | ||||
| 2025-11-10 | 13F | Everstar Asset Management, LLC | 0 | -100,00 | 0 | |||||
| 2026-02-12 | 13F | Quadrant Capital Group Llc | 8.160 | 0,20 | 1.052 | -8,60 | ||||
| 2026-02-10 | 13F | National Pension Service | 288.374 | 10,67 | 37.194 | 0,93 | ||||
| 2025-11-14 | 13F | WealthTrak Capital Management LLC | 0 | -100,00 | 0 | |||||
| 2026-02-12 | 13F | Penserra Capital Management LLC | 18 | 0,00 | 0 | |||||
| 2026-01-26 | 13F | Patriot Financial Group Insurance Agency, LLC | 1.678 | 0,12 | 216 | -8,86 | ||||
| 2026-02-05 | 13F | Baader Bank INC | 0 | -100,00 | 0 | |||||
| 2026-02-17 | 13F | SageView Advisory Group, LLC | 2.051 | -2,66 | 265 | -11,11 | ||||
| 2026-02-13 | 13F | Quattro Advisors LLC | 4 | 1 | ||||||
| 2025-11-14 | 13F | Brooklands Fund Management Ltd | Call | 0 | -100,00 | 0 | ||||
| 2026-02-13 | 13F | Centerpoint Advisors, LLC | 180 | -1,10 | 0 | |||||
| 2026-02-12 | 13F | Great Lakes Advisors, Llc | 9.059 | -76,93 | 1.168 | -78,97 | ||||
| 2026-01-15 | 13F | Bernard Wealth Management Corp. | 11.286 | 1,91 | 1.456 | -7,09 | ||||
| 2026-04-06 | 13F | GAMMA Investing LLC | 8.592 | 4,79 | 1.256 | 18,83 | ||||
| 2026-02-12 | 13F | Grey Fox Wealth Advisors, LLC | 0 | -100,00 | 0 | |||||
| 2026-02-09 | 13F | New Age Alpha Advisors, LLC | 1.712 | 825,41 | 221 | 746,15 | ||||
| 2026-02-11 | 13F | Winnow Wealth Llc | 6 | 0,00 | 1 | |||||
| 2026-01-26 | 13F | Dakota Community Bank & Trust NA | 400 | 0,00 | 52 | -8,93 | ||||
| 2026-02-17 | 13F | Centennial Bank/AR/ | 350 | 0,00 | 45 | -8,16 | ||||
| 2026-01-22 | 13F | Venturi Wealth Management, LLC | 4.621 | -7,95 | 596 | -15,94 | ||||
| 2026-02-12 | 13F | Alps Advisors Inc | 8.694 | 36,10 | 1.121 | 24,14 | ||||
| 2026-02-13 | 13F | Ieq Capital, Llc | 0 | -100,00 | 0 | |||||
| 2026-01-23 | 13F | Brown, Lisle/cummings, Inc. | 333 | 0,00 | 43 | -10,64 | ||||
| 2026-02-12 | 13F | Beacon Capital Management, Inc. | 260 | 0,00 | 34 | -8,33 | ||||
| 2026-02-13 | 13F | Resources Investment Advisors, LLC. | 4.052 | 2,84 | 523 | -6,28 | ||||
| 2026-02-05 | 13F | Requisite Capital Management, LLC | 0 | -100,00 | 0 | |||||
| 2026-04-07 | 13F | First Financial Corp /in/ | 235 | 0,00 | 34 | 13,33 | ||||
| 2026-02-24 | 13F/A | Pacer Advisors, Inc. | 24.563 | 40,33 | 3.168 | 28,00 | ||||
| 2026-02-03 | 13F | CGC Financial Services, LLC | 101 | 0,00 | 13 | -7,14 | ||||
| 2026-02-13 | 13F | Kayne Anderson Rudnick Investment Management Llc | 15.509 | -8,87 | 2.000 | -16,87 | ||||
| 2026-01-26 | 13F | Whittier Trust Co Of Nevada Inc | 27 | -18,18 | 4 | -25,00 | ||||
| 2026-01-28 | 13F | Columbia Asset Management | 10.316 | -8,49 | 1.331 | -16,56 | ||||
| 2026-01-12 | 13F | Kaydan Wealth Management, Inc. | 2.797 | 0,00 | 361 | -8,86 | ||||
| 2026-02-02 | 13F | Principal Financial Group Inc | 231.162 | -7,53 | 29.815 | -15,67 | ||||
| 2026-02-04 | 13F | Securian Asset Management, Inc | 5.647 | -43,09 | 728 | -48,11 | ||||
| 2026-02-09 | 13F | Kingsview Wealth Management, LLC | 5.978 | 4,75 | 771 | -4,46 | ||||
| 2025-11-13 | 13F | GeoWealth Management, LLC | 0 | -100,00 | 0 | |||||
| 2026-01-12 | 13F | Avanza Fonder AB | 843 | 109 | ||||||
| 2026-02-06 | 13F | Planning Alternatives Ltd /adv | 15.606 | 0,16 | 2.013 | -8,67 | ||||
| 2026-02-05 | 13F | Arbor Trust Wealth Advisors, Llc | 6.759 | 319,29 | 880 | 283,84 | ||||
| 2026-01-12 | 13F | AllSquare Wealth Management LLC | 552 | 0,00 | 78 | 6,85 | ||||
| 2026-02-17 | 13F | Aventail Capital Group, LP | 171.822 | -26,22 | 22.162 | -32,72 | ||||
| 2026-04-07 | 13F | Eastern Bank | 200 | 0,00 | 29 | 16,00 | ||||
| 2026-02-10 | 13F | Kentucky Retirement Systems Insurance Trust Fund | 5.453 | 0,00 | 703 | -8,82 | ||||
| 2025-11-14 | 13F | Decade Renewable Partners Lp | 0 | -100,00 | 0 | |||||
| 2026-01-22 | 13F | Bfsg, Llc | 50 | 0,00 | 6 | -14,29 | ||||
| 2026-01-27 | 13F | Asset Management One Co., Ltd. | 115.774 | 2,10 | 15.008 | -6,41 | ||||
| 2025-10-22 | 13F | Stanley-Laman Group, Ltd. | 0 | -100,00 | 0 | |||||
| 2026-02-13 | 13F | Royal London Asset Management Ltd | 26.268 | -3,88 | 3.388 | -12,34 | ||||
| 2026-02-05 | 13F | Dana Investment Advisors, Inc. | 8.141 | -3,96 | 1.050 | -12,35 | ||||
| 2026-01-29 | 13F | Advisors Capital Management, LLC | 1.838 | 7,93 | 237 | -1,25 | ||||
| 2026-01-29 | 13F | Teachers Retirement System Of The State Of Kentucky | 16.249 | 0,00 | 2 | 0,00 | ||||
| 2026-02-09 | 13F | Cary Street Partners Financial Llc | 3.351 | 6,35 | 432 | -2,92 | ||||
| 2026-02-10 | 13F | Td Asset Management Inc | 230.992 | -4,03 | 29.793 | -12,48 | ||||
| 2026-01-26 | 13F | Paradigm Financial Partners, Llc | 6.109 | -5,46 | 788 | -13,80 | ||||
| 2026-02-13 | 13F | National Bank Of Canada /fi/ | 171.657 | -64,84 | 22.139 | -67,94 | ||||
| 2026-02-23 | 13F | Beaird Harris Wealth Management, LLC | 100 | 0,00 | 13 | -14,29 | ||||
| 2026-02-10 | 13F | Envestnet Asset Management Inc | 124.979 | -25,63 | 16.120 | -32,18 | ||||
| 2026-02-04 | 13F | Fourth Dimension Wealth, LLC | 50 | 0,00 | 6 | -14,29 | ||||
| 2026-01-16 | 13F | Trust Co Of Vermont | 100 | 0,00 | 13 | -14,29 | ||||
| 2026-02-17 | 13F | Tortoise Capital Advisors, L.l.c. | 122.111 | 12,38 | 15.750 | 2,49 | ||||
| 2026-02-06 | 13F | Banque Cantonale Vaudoise | 6.419 | -2,65 | 827 | |||||
| 2026-02-10 | 13F | Acorn Wealth Advisors, LLC | 5.402 | -1,44 | 697 | -10,19 | ||||
| 2026-02-13 | 13F | Barclays Plc | Call | 0 | -100,00 | 0 | -100,00 | |||
| 2026-01-27 | 13F | Meritage Portfolio Management | 21.640 | 2.791 | ||||||
| 2026-02-09 | 13F | Hartland & Co., LLC | 1.858 | -33,17 | 240 | -39,19 | ||||
| 2026-02-12 | 13F | Teilinger Capital Ltd. | 240.000 | 30.955 | ||||||
| 2026-04-06 | 13F | Old Port Advisors | 1.400 | 205 | ||||||
| 2026-02-05 | 13F | New York Life Investment Management Llc | 28.379 | 1,18 | 3.660 | -7,72 | ||||
| 2026-01-28 | 13F | Arizona State Retirement System | 56.903 | -7,01 | 7.339 | -15,20 | ||||
| 2026-02-18 | 13F | EP Wealth Advisors, Inc. | 3.612 | -2,38 | 466 | -5,10 | ||||
| 2025-10-20 | 13F | Sivia Capital Partners, LLC | 0 | -100,00 | 0 | |||||
| 2026-04-01 | 13F | Burkett Financial Services, Llc | 1.164 | 0,00 | 170 | 13,33 | ||||
| 2026-01-23 | 13F | Deprince Race & Zollo Inc | 203.303 | 70,69 | 26.222 | 55,67 | ||||
| 2026-02-13 | 13F | American Century Companies Inc | 136.078 | 1,10 | 17.552 | -7,81 | ||||
| 2026-02-17 | 13F | MGB Wealth Management, LLC | 0 | -100,00 | 0 | -100,00 | ||||
| 2026-04-09 | 13F | Sculati Wealth Management, LLC | 11.345 | 0,00 | 1.659 | 13,33 | ||||
| 2026-02-11 | 13F | RWC Asset Management LLP | 67.751 | -7,99 | 8.739 | -16,09 | ||||
| 2026-01-20 | 13F | Cigna Investments Inc /new | 2.015 | 0,00 | 0 | |||||
| 2026-01-13 | 13F | Capital Investment Advisors, LLC | 6.526 | -0,08 | 842 | -8,88 | ||||
| 2026-01-22 | 13F | Bartlett & Co. Wealth Management Llc | 72 | 0,00 | 9 | -10,00 | ||||
| 2026-02-17 | 13F | Jones Financial Companies Lllp | 19.972 | 11,98 | 2.576 | 3,62 | ||||
| 2026-01-22 | 13F | Massachusetts Financial Services Co /ma/ | 1.213.915 | -6,69 | 156.571 | -14,91 | ||||
| 2026-02-02 | 13F | Sachetta, LLC | 39 | 0,00 | 5 | 0,00 | ||||
| 2026-04-10 | 13F | Summit Financial Consulting LLC | 2.433 | 3,66 | 356 | 17,55 | ||||
| 2026-02-10 | 13F | Daiwa Securities Group Inc. | 40.723 | -39,60 | 5 | -44,44 | ||||
| 2026-01-28 | 13F | Turtle Creek Wealth Advisors, LLC | 0 | -100,00 | 0 | |||||
| 2026-02-13 | 13F | Baltimore-Washington Financial Advisors, Inc. | 2.200 | 284 | ||||||
| 2026-02-13 | 13F | Aptus Capital Advisors, LLC | 2.269 | -21,76 | 293 | -28,78 | ||||
| 2026-02-12 | 13F | Jane Street Group, Llc | 146.282 | -25,42 | 18.867 | -31,98 | ||||
| 2026-02-17 | 13F | Howard Hughes Medical Institute | 44 | 0,00 | 6 | -16,67 | ||||
| 2026-02-12 | 13F | Jane Street Group, Llc | Call | 77.500 | 191,35 | 9.996 | 165,68 | |||
| 2026-02-17 | 13F | Redwood Park Advisors LLC | 1 | 0,00 | 0 | |||||
| 2026-02-12 | 13F | Mason Investment Advisory Services, Inc. | 0 | -100,00 | 0 | |||||
| 2026-02-17 | 13F | LMR Partners LLP | 3.048 | -16,38 | 393 | -23,69 | ||||
| 2026-01-08 | 13F | Sound View Wealth Advisors Group, LLC | 0 | -100,00 | 0 | |||||
| 2026-02-13 | 13F | Entropy Technologies, LP | 64.342 | 8.299 | ||||||
| 2025-11-05 | 13F | Optimize Financial Inc | 0 | -100,00 | 0 | -100,00 | ||||
| 2026-02-12 | 13F | Brown Brothers Harriman & Co | 1.378 | -3,97 | 178 | -12,38 | ||||
| 2026-01-30 | 13F | Caldwell Securities, Inc | 325 | 0,00 | 42 | -8,89 | ||||
| 2026-02-17 | 13F | CWM Advisors, LLC | 8 | 1 | ||||||
| 2026-01-12 | 13F | Arbor Wealth Advisors LLC | 3.808 | 0,00 | 491 | -8,74 | ||||
| 2025-11-14 | 13F | WNY Asset Management, LLC | 14.119 | 0,00 | 1.997 | 6,74 | ||||
| 2026-01-20 | 13F | Investment Research & Advisory Group, Inc. | 43 | 6 | ||||||
| 2026-04-01 | 13F | Neville Rodie & Shaw Inc | 1.386 | 0 | ||||||
| 2026-02-06 | 13F | Cullen/frost Bankers, Inc. | 229 | 5,53 | 30 | -3,33 | ||||
| 2026-02-17 | 13F | Graham Capital Management, L.P. | 23.193 | 145,17 | 2.991 | 123,71 | ||||
| 2026-02-12 | 13F | Virtue Capital Management, LLC | 979 | -94,02 | 210 | -33,23 | ||||
| 2026-01-23 | 13F | Transcend Wealth Collective, Llc | 0 | -100,00 | 0 | -100,00 | ||||
| 2026-04-02 | 13F | Hilltop National Bank | 456 | 0,00 | 67 | 13,79 | ||||
| 2026-01-27 | 13F | Financial Advisory Corp | 1.710 | 0,00 | 221 | -8,71 | ||||
| 2026-02-17 | 13F | Brevan Howard Capital Management LP | 0 | -100,00 | 0 | |||||
| 2026-01-30 | 13F | Torren Management, LLC | 204 | 26 | ||||||
| 2025-11-17 | 13F | Jacobs Levy Equity Management, Inc | 0 | -100,00 | 0 | -100,00 | ||||
| 2026-02-03 | 13F | Everence Capital Management Inc | 4.300 | 0,00 | 1 | |||||
| 2026-02-17 | 13F | Armistice Capital, Llc | 2.317 | 299 | ||||||
| 2026-01-28 | 13F | Geneos Wealth Management Inc. | 2.009 | -0,30 | 259 | -8,80 | ||||
| 2026-02-17 | 13F | Investment Management Corp of Ontario | 14.049 | 44,02 | 1.812 | 31,40 | ||||
| 2026-01-30 | 13F | Wealthfront Advisers Llc | 27.415 | 6,11 | 3.536 | -3,23 | ||||
| 2026-01-29 | 13F | Comerica Bank | 70.479 | -0,51 | 9.090 | -9,26 | ||||
| 2026-02-06 | 13F | Intrust Bank Na | 8.915 | -4,53 | 1.150 | -12,95 | ||||
| 2026-02-13 | 13F | SRS Capital Advisors, Inc. | 6.951 | -69,02 | 897 | -71,75 | ||||
| 2026-02-11 | 13F | LPL Financial LLC | 212.591 | -17,58 | 27.420 | -24,84 | ||||
| 2026-02-05 | 13F | Canada Post Corp Registered Pension Plan | 5.377 | -35,96 | 694 | -36,83 | ||||
| 2026-02-10 | 13F/A | Northwestern Mutual Wealth Management Co | 6.932 | -3,57 | 894 | -12,01 | ||||
| 2026-01-29 | 13F | St Germain D J Co Inc | 75 | 0,00 | 10 | -10,00 | ||||
| 2026-02-11 | 13F | J.Safra Asset Management Corp | 30 | 4 | ||||||
| 2026-02-12 | 13F | IFM Investors Pty Ltd | 30.864 | 0,55 | 4 | -99,93 | ||||
| 2026-02-12 | 13F | Johnson Financial Group, Inc. | 417 | -96,23 | 54 | -96,58 | ||||
| 2026-02-05 | 13F | Leeward Investments, LLC - MA | 91.611 | -4,88 | 11.816 | -13,26 | ||||
| 2026-02-12 | 13F | Mark Sheptoff Financial Planning, Llc | 77 | 0,00 | 10 | -10,00 | ||||
| 2026-02-13 | 13F | Atlas Capital Advisors Llc | 5 | 0,00 | 1 | |||||
| 2026-02-02 | 13F | Horizon Investments, LLC | 16.314 | 14,29 | 2.104 | 4,26 | ||||
| 2026-01-26 | 13F | Asset Dedication, LLC | 141 | -38,16 | 18 | -43,75 | ||||
| 2026-02-05 | 13F | Gabelli Funds Llc | 34.900 | -0,29 | 4.501 | -9,07 | ||||
| 2026-02-05 | 13F | Dougherty & Associates, LLC | 3.224 | 416 | ||||||
| 2026-02-04 | 13F | KLCM Advisors, Inc. | 1.706 | 220 | ||||||
| 2026-01-26 | 13F | Duff & Phelps Investment Management Co | 792.446 | 8,92 | 102.210 | -0,67 | ||||
| 2026-02-10 | 13F | Rothschild Investment Llc | 1.527 | -6,26 | 197 | -14,78 | ||||
| 2025-11-14 | 13F | Holocene Advisors, LP | 0 | -100,00 | 0 | |||||
| 2026-01-30 | 13F | Valued Wealth Advisors LLC | 16 | 0,00 | 2 | 0,00 | ||||
| 2026-02-19 | 13F | Claris Financial LLC | 2.859 | 0,74 | 369 | -8,23 | ||||
| 2026-02-09 | 13F | Arvest Bank Trust Division | 14.623 | -5,86 | 1.886 | -14,12 | ||||
| 2026-02-17 | 13F | Quantessence Capital LLC | 0 | -100,00 | 0 | |||||
| 2026-02-12 | 13F | Skopos Labs, Inc. | 4.504 | 194,19 | 584 | 190,05 | ||||
| 2026-01-29 | 13F | Pictet Asset Management Holding SA | 595.971 | -5,99 | 76.868 | -14,26 | ||||
| 2026-01-23 | 13F | Avion Wealth | 29 | -12,12 | 0 | |||||
| 2026-02-05 | 13F | Qsemble Capital Management, LP | 30.259 | 181,14 | 3.903 | 156,37 | ||||
| 2026-01-29 | 13F | Concurrent Investment Advisors, LLC | 7.445 | 36,58 | 960 | 24,68 | ||||
| 2026-02-17 | 13F | Russell Investments Group, Ltd. | 109.102 | -39,66 | 14.072 | -44,97 | ||||
| 2025-11-26 | 13F/A | Jpmorgan Chase & Co | Call | 0 | -100,00 | 0 | -100,00 | |||
| 2026-02-04 | 13F | Independent Advisor Alliance | 13.970 | 38,48 | 1.802 | 26,30 | ||||
| 2026-02-10 | 13F | Hazlett, Burt & Watson, Inc. | 15 | 0 | ||||||
| 2026-02-17 | 13F | Rakuten Investment Management, Inc. | 27.317 | -55,48 | 3.541 | -78,82 | ||||
| 2026-02-11 | 13F | Capital International Sarl | 9.984 | 47,80 | 1.288 | 34,76 | ||||
| 2026-01-22 | 13F | Premier Path Wealth Partners, LLC | 0 | -100,00 | 0 | |||||
| 2026-02-04 | 13F | Ameritas Advisory Services, LLC | 4.100 | 5.366,67 | 529 | 5.180,00 | ||||
| 2026-02-11 | 13F | IMA Wealth, Inc. | 2 | 0,00 | 0 | |||||
| 2026-02-12 | 13F | Sit Investment Associates Inc | 0 | -100,00 | 0 | |||||
| 2026-04-08 | 13F | Hummer Financial Advisory Services Inc | 4.413 | 4,75 | 650 | 18,61 | ||||
| 2026-01-21 | 13F | Crews Bank & Trust | 1.171 | 0,00 | 151 | -8,48 | ||||
| 2026-01-30 | 13F | Bogart Wealth, LLC | 54.088 | -0,23 | 6.976 | -9,00 | ||||
| 2026-02-12 | 13F | Azimuth Capital Investment Management LLC | 8.174 | -1,30 | 1.054 | -9,99 | ||||
| 2026-02-12 | 13F | Renaissance Technologies Llc | 274.800 | -15,34 | 35.444 | -22,80 | ||||
| 2026-04-03 | 13F | Coastline Trust Co | 300 | 0,00 | 44 | 13,16 | ||||
| 2026-02-10 | 13F | Sittner & Nelson, Llc | 363 | 0,00 | 49 | -5,88 | ||||
| 2026-02-17 | 13F | Strategic Investment Advisors / MI | 7.288 | 0,51 | 940 | -8,39 | ||||
| 2026-02-09 | 13F | Harbour Investments, Inc. | 4.629 | 8,87 | 597 | -0,67 | ||||
| 2026-02-11 | 13F | Atlanta Consulting Group Advisors, LLC | 1.833 | 0,16 | 239 | -8,46 | ||||
| 2026-02-06 | 13F | Pnc Financial Services Group, Inc. | 60.250 | 12,57 | 7.771 | 2,67 | ||||
| 2026-02-11 | 13F | Empowered Funds, LLC | 10.234 | 68,68 | 1.320 | 53,73 | ||||
| 2026-02-11 | 13F | J.w. Cole Advisors, Inc. | 20.420 | -2,36 | 2.632 | -10,99 | ||||
| 2026-02-17 | 13F | Regal Investment Advisors LLC | 2.318 | -4,73 | 299 | -13,37 | ||||
| 2026-01-30 | 13F | United Community Bank | 144 | -68,28 | 19 | -71,87 | ||||
| 2026-01-23 | 13F | Nbt Bank N A /ny | 2.684 | 0,00 | 346 | -8,71 | ||||
| 2026-02-09 | 13F | Annis Gardner Whiting Capital Advisors, LLC | 785 | -0,13 | 101 | -9,01 | ||||
| 2026-02-03 | 13F | International Assets Investment Management, Llc | 7.053 | -10,43 | 910 | -12,76 | ||||
| 2026-02-17 | 13F | Pinnacle Financial Partners, Inc. | 1.684 | 218 | ||||||
| 2026-02-17 | 13F | Agf Management Ltd | 2.946 | 380 | ||||||
| 2026-01-20 | 13F | Thurston, Springer, Miller, Herd & Titak, Inc. | 15 | 2 | ||||||
| 2026-02-04 | 13F | LRI Investments, LLC | 569 | -26,86 | 73 | -33,03 | ||||
| 2026-01-07 | 13F | Holistic Financial Partners | 2.043 | -0,49 | 264 | -9,31 | ||||
| 2026-01-26 | 13F | Consolidated Portfolio Review Corp | 0 | -100,00 | 0 | -100,00 | ||||
| 2026-02-13 | 13F | 1 North Wealth Services Llc | 25 | 0,00 | 3 | 0,00 | ||||
| 2026-01-21 | 13F | Prime Capital Investment Advisors, LLC | 2.682 | 14,13 | 346 | 3,92 | ||||
| 2026-01-08 | 13F | NorthCrest Asset Manangement, LLC | 0 | -100,00 | 0 | |||||
| 2026-02-06 | 13F | Tortoise Investment Management, LLC | 0 | -100,00 | 0 | |||||
| 2026-02-13 | 13F | Manufacturers Life Insurance Company, The | 0 | -100,00 | 0 | |||||
| 2026-02-13 | 13F | Stifel Financial Corp | 97.686 | -4,19 | 12.600 | -12,62 | ||||
| 2026-02-13 | 13F | Brown Advisory Inc | 1.756 | -58,85 | 227 | -62,52 | ||||
| 2026-02-05 | 13F | L & S Advisors Inc | 0 | -100,00 | 0 | |||||
| 2026-02-17 | 13F | Amundi | 715.240 | 123,44 | 92.252 | 103,29 | ||||
| 2026-01-22 | 13F | Financial Consulate, Inc | 0 | -100,00 | 0 | |||||
| 2026-02-17 | 13F | Prelude Capital Management, Llc | 2.002 | 258 | ||||||
| 2026-01-29 | 13F | Kestra Private Wealth Services, Llc | 6.551 | 3,39 | 845 | -5,80 | ||||
| 2026-01-22 | 13F | Quotient Wealth Partners, LLC | 0 | -100,00 | 0 | |||||
| 2026-01-30 | 13F | BancorpSouth Bank | 9.711 | 4,64 | 1.253 | -4,57 | ||||
| 2026-02-12 | 13F | New York State Common Retirement Fund | 102.915 | 0,00 | 13.274 | -8,81 | ||||
| 2026-01-22 | 13F | Apollon Wealth Management, LLC | 2.549 | -2,19 | 329 | -10,87 | ||||
| 2026-01-30 | 13F | New York State Teachers Retirement System | 149.248 | -12,33 | 19 | -20,83 | ||||
| 2026-02-11 | 13F | Group One Trading, L.p. | Call | 0 | -100,00 | 0 | -100,00 | |||
| 2026-02-12 | 13F | Aviva Plc | 3.463 | 0,00 | 447 | -8,79 | ||||
| 2026-02-13 | 13F | Change Path, LLC | 1.955 | 9,16 | 252 | -0,40 | ||||
| 2026-02-11 | 13F | Nemes Rush Group LLC | 4.044 | 3,51 | 522 | -5,62 | ||||
| 2026-02-12 | 13F | Callan Family Office, LLC | 6.310 | 25,57 | 814 | 14,51 | ||||
| 2026-02-17 | 13F | Twinbeech Capital Lp | 90.503 | 11.673 | ||||||
| 2026-02-12 | 13F | BRYN MAWR TRUST Co | 0 | -100,00 | 0 | |||||
| 2025-11-14 | 13F | Ossiam | 0 | -100,00 | 0 | |||||
| 2026-02-11 | 13F | Ameritas Investment Partners, Inc. | 11.823 | 1.525 | ||||||
| 2026-02-12 | 13F | M1 Capital Management LLC | 7.720 | 0,19 | 996 | -8,63 | ||||
| 2026-02-13 | 13F | Icon Wealth Advisors, LLC | 2.662 | -2,17 | 343 | -10,68 | ||||
| 2025-11-14 | 13F | Wolverine Trading, Llc | Call | 24.100 | 17,56 | 3.395 | 25,80 | |||
| 2026-01-30 | 13F | Citizens National Bank Trust Department | 2.216 | 286 | ||||||
| 2025-11-14 | 13F | Wolverine Trading, Llc | Put | 4.700 | 662 | |||||
| 2026-02-09 | 13F | Atlantic Trust, LLC | 0 | -100,00 | 0 | |||||
| 2026-02-13 | 13F | Prudential Financial Inc | 253.828 | -48,83 | 32.739 | -53,33 | ||||
| 2026-02-12 | 13F | Cloud Capital Management, LLC | 0 | -100,00 | 0 | |||||
| 2026-02-11 | 13F | Prestige Wealth Management Group LLC | 53 | 112,00 | 7 | 100,00 | ||||
| 2026-02-03 | 13F | Manning & Napier Advisors Llc | 69 | 9 | ||||||
| 2025-11-14 | 13F | Quadcap Wealth Management, LLC | 0 | -100,00 | 0 | |||||
| 2026-04-06 | 13F | Washington Trust Advisors, Inc. | 941 | -8,73 | 138 | 3,79 | ||||
| 2026-04-03 | 13F | Global Wealth Strategies & Associates | 200 | 0,00 | 29 | 16,00 | ||||
| 2026-02-17 | 13F | Summit Trail Advisors, Llc | 9.601 | -5,39 | 1.250 | -13,50 | ||||
| 2026-02-13 | 13F | Citigroup Inc | 218.277 | 0,74 | 28.153 | -8,13 | ||||
| 2026-02-09 | 13F | Avalon Trust Co | 0 | -100,00 | 0 | |||||
| 2026-01-28 | 13F | Financial Perspectives, Inc | 1.369 | 0,44 | 177 | -8,33 | ||||
| 2026-01-26 | 13F | Discipline Wealth Solutions, LLC | 2.192 | 0,09 | 283 | -8,74 | ||||
| 2026-01-30 | 13F | North Star Investment Management Corp. | 5.809 | 0,31 | 749 | -8,55 | ||||
| 2026-02-10 | 13F | Bruce G. Allen Investments, LLC | 62 | 0,00 | 8 | -12,50 | ||||
| 2026-02-12 | 13F | Commonwealth Equity Services, Llc | 57.926 | -13,40 | 7.471 | 82.911,11 | ||||
| 2026-02-13 | 13F | BRITISH COLUMBIA INVESTMENT MANAGEMENT Corp | 36.764 | 23,27 | 4.742 | 12,43 | ||||
| 2026-02-05 | 13F | Thrivent Financial For Lutherans | 50.300 | -0,13 | 6 | -14,29 | ||||
| 2026-02-05 | 13F | HFM Investment Advisors, LLC | 4 | 0,00 | 1 | |||||
| 2026-02-10 | 13F | New Mexico Educational Retirement Board | 9.596 | 2,13 | 1 | 0,00 | ||||
| 2026-02-17 | 13F | Hancock Whitney Corp | 2.260 | -80,21 | 292 | -81,98 | ||||
| 2026-01-29 | 13F | Golden State Equity Partners | 1.812 | -5,92 | 234 | -14,34 | ||||
| 2026-02-05 | 13F | Stephens Inc /ar/ | 4.643 | 0,96 | 599 | -8,00 | ||||
| 2026-02-17 | 13F | Aquatic Capital Management LLC | 36.498 | 4.708 | ||||||
| 2026-02-17 | 13F | Zacks Investment Management | 3.748 | -34,30 | 483 | -40,07 | ||||
| 2026-04-08 | 13F | E Fund Management (Hong Kong) Co., Ltd. | 71 | 10 | ||||||
| 2026-02-13 | 13F | Clarity Asset Management, Inc. | 0 | -100,00 | 0 | |||||
| 2025-10-15 | 13F | Chesapeake Asset Management Llc | 0 | -100,00 | 0 | |||||
| 2026-01-29 | 13F | Segment Wealth Management, LLC | 1.744 | 4,56 | 225 | -4,68 | ||||
| 2026-02-18 | 13F | Beacon Pointe Advisors, LLC | 7.013 | 8,91 | 905 | -0,66 | ||||
| 2026-01-23 | 13F | Diversify Advisory Services, LLC | 2.728 | -34,34 | 370 | -33,63 | ||||
| 2026-02-03 | 13F | We Are One Seven, LLC | 8.393 | -12,25 | 1.083 | -19,97 | ||||
| 2026-02-05 | 13F | Stoneridge Investment Partners Llc | 4.698 | 1 | ||||||
| 2026-02-13 | 13F | Cozad Asset Management Inc | 0 | -100,00 | 0 | |||||
| 2026-02-12 | 13F | DRW Securities, LLC | 1.566 | 202 | ||||||
| 2026-02-13 | 13F | Caitong International Asset Management Co., Ltd | 0 | -100,00 | 0 | |||||
| 2026-02-12 | 13F | Advisors Asset Management, Inc. | 3.508 | -26,89 | 452 | -33,33 | ||||
| 2026-02-13 | 13F | HITE Hedge Asset Management LLC | 471.367 | -47,87 | 60.797 | -52,46 | ||||
| 2026-02-06 | 13F | Profund Advisors Llc | 10.311 | -4,99 | 1.330 | -13,36 | ||||
| 2026-02-13 | 13F | Commerce Bank | 22.076 | -1,13 | 2.847 | -9,82 | ||||
| 2026-02-13 | 13F | Vontobel Holding Ltd. | 2.156 | 0,00 | 278 | -8,55 | ||||
| 2026-02-04 | 13F | Dogwood Wealth Management LLC | 11 | -21,43 | 1 | 0,00 | ||||
| 2026-02-10 | 13F | Gulf International Bank (UK) Ltd | 10.097 | 0,00 | 1 | 0,00 | ||||
| 2025-11-14 | 13F | Scientech Research LLC | 0 | -100,00 | 0 | -100,00 | ||||
| 2026-02-13 | 13F | Ubs Asset Management Americas Inc | 799.197 | -5,14 | 103.080 | -13,49 | ||||
| 2026-02-17 | 13F | Raymond James Financial Inc | 388.198 | -60,45 | 50.070 | -63,93 |