Grundlæggende statistik
| Institutionelle aktier (lange) | 324.356.694 - 67,30% (ex 13D/G) - change of -50,64MM shares -13,50% MRQ |
| Institutionel værdi (lang) | $ 15.320.946 USD ($1000) |
Institutionelt ejerskab og aktionærer
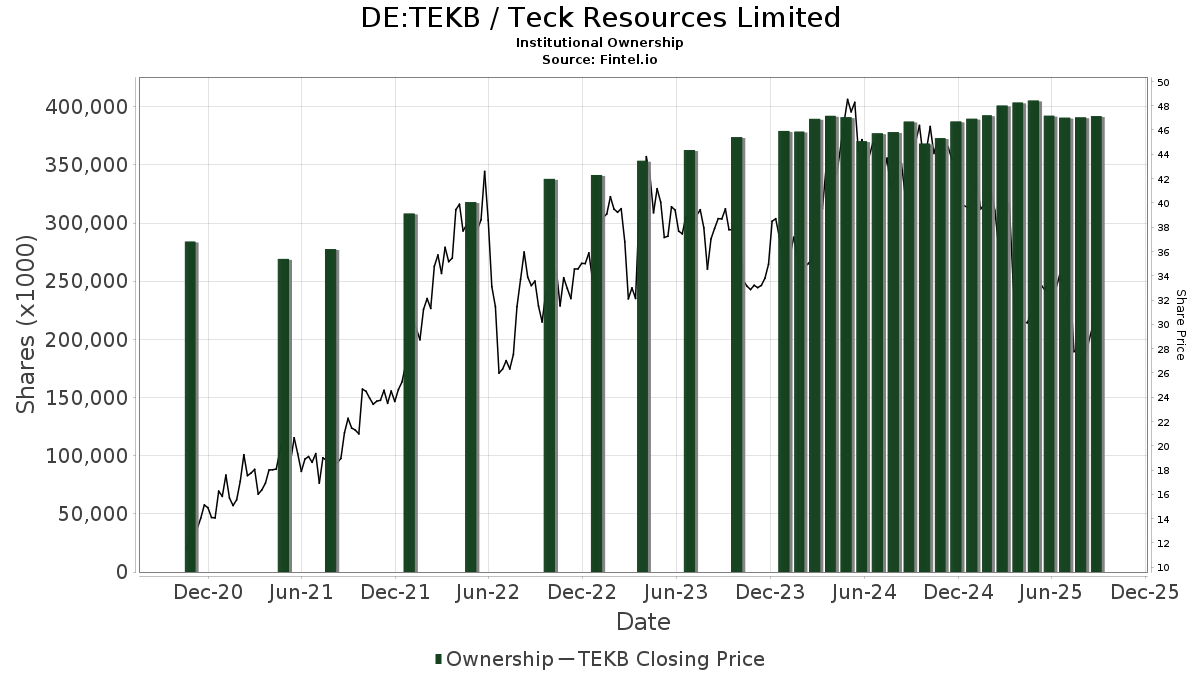
Teck Resources Limited (DE:TEKB) har 478 institutionelle ejere og aktionærer, der har indsendt 13D/G- eller 13F-formularer til Securities Exchange Commission (SEC). Disse institutioner har i alt 324,356,694 aktier. Største aktionærer omfatter Vanguard Group Inc, Principal Financial Group Inc, Royal Bank Of Canada, BlackRock, Inc., Davis Selected Advisers, Hancock Prospecting Pty Ltd, Norges Bank, Mackenzie Financial Corp, Goldman Sachs Group Inc, and UBS Group AG .
Teck Resources Limited (DB:TEKB) institutionel ejerskabsstruktur viser aktuelle positioner i virksomheden efter institutioner og fonde, samt seneste ændringer i positionsstørrelse. Større aktionærer kan omfatte individuelle investorer, investeringsforeninger, hedgefonde eller institutioner. Skema 13D angiver, at investoren besidder (eller besidder) mere end 5 % af virksomheden og har til hensigt (eller har til hensigt at) aktivt at forfølge en ændring i forretningsstrategi. Skema 13G indikerer en passiv investering på over 5%.
The share price as of April 24, 2026 is 51,74 / share. Previously, on April 28, 2025, the share price was 31,22 / share. This represents an increase of 65,73% over that period.
Fondens stemningsscore
Fund Sentiment Score (fka Ownership Accumulation Score) finder de aktier, der bliver mest købt af fonde. Det er resultatet af en sofistikeret, multi-faktor kvantitativ model, der identificerer virksomheder med de højeste niveauer af institutionel akkumulering. Scoringsmodellen bruger en kombination af den samlede stigning i oplyste ejere, ændringerne i porteføljeallokeringer i disse ejere og andre målinger. Tallet går fra 0 til 100, hvor højere tal indikerer et højere niveau af akkumulering for sine jævnaldrende, og 50 er gennemsnittet.
Opdateringsfrekvens: Dagligt
Se Ownership Explorer, som giver en liste over højest rangerende virksomheder.
AI+ Ask Fintel’s AI assistant about Teck Resources Limited.
Select a question to share a public post with an AI-crafted answer.
Thinking of good questions…
13F og NPORT arkivering
Detaljer om 13F-arkivering er gratis. Detaljer om NP-ansøgninger kræver et premium-medlemskab. Grønne rækker angiver nye positioner. Røde rækker angiver lukkede positioner. Klik på linket ikon for at se den fulde transaktionshistorik.
Opgrader
for at låse premium-data op og eksportere til Excel ![]() .
.
| Fil dato | Kilde | Investor | Type | Gennemsnitlig pris (Øst) |
Aktier | Δ Aktier (%) |
Rapporteret Værdi ($1000) |
Δ Værdi (%) |
Port Alloc (%) |
|
|---|---|---|---|---|---|---|---|---|---|---|
| 2026-02-17 | 13F | Governors Lane LP | 127.151 | 6.089 | ||||||
| 2026-02-12 | 13F | DJE Kapital AG | 80.021 | 3.870 | ||||||
| 2026-02-06 | 13F/A | Rathbone Brothers plc | 4.783 | 229 | ||||||
| 2026-01-13 | 13F | Synergy Financial Management, LLC | 6.194 | 0,00 | 297 | 9,23 | ||||
| 2026-01-26 | 13F | Cwm, Llc | 2.157 | 3,80 | 0 | |||||
| 2026-02-13 | 13F | National Bank Of Canada /fi/ | 3.792.169 | -11,66 | 181.291 | -3,62 | ||||
| 2026-02-11 | 13F | Picton Mahoney Asset Management | Call | 0 | -100,00 | 0 | -100,00 | |||
| 2026-02-13 | 13F | Vontobel Holding Ltd. | 117.703 | 0,00 | 5.635 | 9,16 | ||||
| 2026-02-12 | 13F | JPL Wealth Management, LLC | 0 | -100,00 | 0 | |||||
| 2026-02-17 | 13F | Laird Norton Trust Company, Llc | 42.465 | 2.034 | ||||||
| 2026-02-13 | 13F | Natixis | 7.763 | -20,63 | 372 | -13,52 | ||||
| 2026-02-17 | 13F | Clear Street Markets Llc | Put | 0 | -100,00 | 0 | ||||
| 2026-02-17 | 13F | SIG North Trading, ULC | Call | 340.900 | 5,67 | 16.326 | 15,31 | |||
| 2025-11-14 | 13F | Black Maple Capital Management LP | Call | 0 | -100,00 | 0 | -100,00 | |||
| 2026-02-17 | 13F | SIG North Trading, ULC | Put | 308.500 | 58,86 | 14.774 | 73,34 | |||
| 2026-02-17 | 13F | Bank Of America Corp /de/ | Call | 0 | -100,00 | 0 | ||||
| 2026-02-13 | 13F | Aviso Financial Inc. | 0 | -100,00 | 0 | |||||
| 2026-02-13 | 13F | Sei Investments Co | 39.717 | -29,96 | 1.902 | -23,55 | ||||
| 2026-02-13 | 13F | Wealth Alliance | 4.339 | 208 | ||||||
| 2025-11-14 | 13F | Two Sigma Securities, Llc | 0 | -100,00 | 0 | -100,00 | ||||
| 2026-02-10 | 13F | Goldman Sachs Group Inc | Call | 0 | -100,00 | 0 | -100,00 | |||
| 2026-04-07 | 13F | U.S. Capital Wealth Advisors, LLC | 12.904 | 0,58 | 668 | 8,63 | ||||
| 2025-10-27 | 13F | Fractal Investments LLC | 0 | -100,00 | 0 | |||||
| 2025-11-10 | 13F | Waratah Capital Advisors Ltd. | Call | 0 | -100,00 | 0 | ||||
| 2026-02-17 | 13F | Guardian Partners Inc. | 0 | -100,00 | 0 | |||||
| 2025-11-14 | 13F | Walleye Trading LLC | 0 | -100,00 | 0 | -100,00 | ||||
| 2026-02-13 | 13F | Independent Family Office, LLC | 0 | -100,00 | 0 | |||||
| 2026-02-13 | 13F | Cohen & Steers, Inc. | 26.282 | -92,32 | 1 | -93,33 | ||||
| 2025-11-14 | 13F | Sagefield Capital LP | 0 | -100,00 | 0 | |||||
| 2026-02-13 | 13F | Mml Investors Services, Llc | 18.485 | 46,90 | 885 | 60,33 | ||||
| 2026-04-24 | 13F | Essex Financial Services, Inc. | 4.516 | 0,89 | 234 | 8,88 | ||||
| 2026-02-05 | 13F | New York Life Investment Management Llc | 229.979 | 11.014 | ||||||
| 2025-11-14 | 13F | Point72 Europe (London) LLP | 75.109 | -70,66 | 3.297 | -68,11 | ||||
| 2026-02-11 | 13F | Capital Analysts, Inc. | 411 | -26,08 | 0 | |||||
| 2026-02-17 | 13F | Clear Street Markets Llc | Call | 0 | -100,00 | 0 | ||||
| 2026-02-18 | 13F | Vident Advisory, LLC | 69.782 | 1.245,07 | 3.342 | 1.371,81 | ||||
| 2026-02-17 | 13F | XTX Topco Ltd | 18.999 | 116,96 | 910 | 136,72 | ||||
| 2026-02-20 | 13F | Sunbelt Securities, Inc. | 121 | 476,19 | 6 | |||||
| 2026-02-11 | 13F | Erste Asset Management GmbH | 0 | 0 | ||||||
| 2026-01-30 | 13F | Levin Capital Strategies, L.p. | 270.133 | -5,00 | 12.937 | 3,65 | ||||
| 2026-02-13 | 13F | SRS Capital Advisors, Inc. | 19.321 | -45,98 | 925 | -41,05 | ||||
| 2026-02-13 | 13F | First Trust Advisors Lp | 8.834 | 73,90 | 423 | 90,54 | ||||
| 2026-02-17 | 13F | Taconic Capital Advisors LP | Put | 0 | -100,00 | 0 | ||||
| 2026-02-17 | 13F | Ancora Advisors, LLC | 604 | 20,80 | 29 | 33,33 | ||||
| 2025-11-14 | 13F | Strategic Wealth Partners, Ltd. | 170 | 0,00 | 7 | 16,67 | ||||
| 2026-01-26 | 13F | Mirae Asset Global Investments Co., Ltd. | 1.036 | -40,49 | 50 | -35,53 | ||||
| 2026-01-28 | 13F | Geneos Wealth Management Inc. | 258 | 0,00 | 12 | 9,09 | ||||
| 2026-02-17 | 13F | One Fin Capital Management LP | 0 | -100,00 | 0 | |||||
| 2026-02-13 | 13F | 1832 Asset Management L.P. | 1.730.380 | -73,15 | 82.868 | -70,71 | ||||
| 2026-02-17 | 13F | Advisory Services Network, LLC | 0 | -100,00 | 0 | |||||
| 2026-02-12 | 13F | Principal Securities, Inc. | 0 | -100,00 | 0 | -100,00 | ||||
| 2026-02-09 | 13F | Investors Portfolio Services LLC | 49 | 2 | ||||||
| 2026-02-13 | 13F | Arete Wealth Advisors, LLC | 5.914 | 0 | ||||||
| 2025-11-05 | 13F | SPC Financial, Inc. | 4.800 | 211 | ||||||
| 2026-04-15 | 13F | FNY Investment Advisers, LLC | 0 | -100,00 | 0 | |||||
| 2025-11-13 | 13F | Lord, Abbett & Co. Llc | 0 | -100,00 | 0 | -100,00 | ||||
| 2026-02-13 | 13F | Arrowstreet Capital, Limited Partnership | 3.550.320 | 169.999 | ||||||
| 2026-02-13 | 13F | Korea Investment CORP | 595.867 | 163,59 | 28.564 | 188,00 | ||||
| 2026-02-18 | 13F | Garton & Associates Financial Advisors LLC | 114 | 5 | ||||||
| 2025-11-06 | 13F | Blume Capital Management, Inc. | 0 | -100,00 | 0 | |||||
| 2026-02-13 | 13F | State Street Corp | 0 | -100,00 | 0 | -100,00 | ||||
| 2026-02-13 | 13F | Royal London Asset Management Ltd | 19.772 | -20,63 | 947 | -13,45 | ||||
| 2026-01-29 | 13F | Sanctuary Advisors, LLC | 50.889 | -0,55 | 2.437 | 8,55 | ||||
| 2026-01-16 | 13F | Crewe Advisors LLC | 53 | 0,00 | 3 | 0,00 | ||||
| 2026-02-10 | 13F | NS Partners Ltd | 6.800 | 326 | ||||||
| 2026-02-09 | 13F | Geode Capital Management, Llc | 4.141.019 | 4,60 | 197.326 | 14,35 | ||||
| 2026-02-11 | 13F | Franklin Resources Inc | 415.411 | 1,80 | 19.891 | 11,10 | ||||
| 2026-01-27 | 13F | First Horizon Corp | 26 | 1 | ||||||
| 2026-04-23 | 13F | Merrion Investment Management Co, LLC | 13.154 | 0,00 | 681 | 8,11 | ||||
| 2026-02-06 | 13F | Vestmark Advisory Solutions, Inc. | 5.254 | 252 | ||||||
| 2026-02-13 | 13F | Ossiam | 0 | -100,00 | 0 | -100,00 | ||||
| 2026-02-13 | 13F | Recurrent Investment Advisors LLC | 39.294 | -16,71 | 2.321 | -6,90 | ||||
| 2026-02-02 | 13F | Davis Selected Advisers | 12.019.609 | 9,03 | 575.620 | 18,97 | ||||
| 2026-02-13 | 13F | Dodge & Cox | 0 | -100,00 | 0 | |||||
| 2026-02-13 | 13F | Westchester Capital Management, LLC | 1.566.212 | -15,96 | 75.006 | -8,30 | ||||
| 2026-02-13 | 13F | Westchester Capital Management, LLC | Put | 1.278.900 | -22,71 | 61.247 | -15,67 | |||
| 2026-02-17 | 13F | Credit Agricole S A | 7.755 | 0,36 | 371 | 9,44 | ||||
| 2026-04-23 | 13F | Oppenheimer Asset Management Inc. | 12.261 | 1,73 | 635 | 9,88 | ||||
| 2026-02-17 | 13F | Graham Capital Management, L.P. | 0 | -100,00 | 0 | |||||
| 2025-11-13 | 13F | Menora Mivtachim Holdings Ltd. | 0 | -100,00 | 0 | -100,00 | ||||
| 2026-02-13 | 13F | Alberta Investment Management Corp | 992.300 | -12,67 | 47.508 | -4,66 | ||||
| 2026-02-10 | 13F | Anchor Capital Advisors Llc | 632.750 | 14,62 | 30.302 | 25,07 | ||||
| 2026-02-11 | 13F | O'shaughnessy Asset Management, Llc | 30.148 | -0,45 | 1.444 | 8,58 | ||||
| 2026-02-05 | 13F | Cambridge Investment Research Advisors, Inc. | 8.585 | -37,71 | 0 | |||||
| 2026-02-12 | 13F | DRW Securities, LLC | 95.205 | -18,84 | 4.559 | -11,37 | ||||
| 2026-02-12 | 13F | Hrt Financial Lp | 263.100 | 13 | ||||||
| 2026-02-12 | 13F | CoreCommodity Management, LLC | 50.785 | -48,59 | 2.432 | -43,90 | ||||
| 2025-11-10 | 13F | Waratah Capital Advisors Ltd. | 0 | -100,00 | 0 | |||||
| 2026-02-11 | 13F | Clearbridge Investments, LLC | 3.904.683 | -6,80 | 186.995 | 1,70 | ||||
| 2026-02-23 | 13F | Mv Capital Management, Inc. | 5 | 0 | ||||||
| 2026-02-17 | 13F | Russell Investments Group, Ltd. | 296.877 | 23,22 | 14.229 | 34,60 | ||||
| 2026-02-17 | 13F | Utah Retirement Systems | 53.932 | 0,00 | 2.585 | 9,26 | ||||
| 2026-02-12 | 13F | Commonwealth Equity Services, Llc | 7.705 | -19,96 | 369 | |||||
| 2026-02-17 | 13F | Parallax Volatility Advisers, L.P. | Call | 0 | -100,00 | 0 | ||||
| 2026-02-17 | 13F | Parallax Volatility Advisers, L.P. | Put | 0 | -100,00 | 0 | ||||
| 2026-02-13 | 13F | Van Eck Associates Corp | 436.186 | -42,38 | 21 | -39,39 | ||||
| 2025-11-14 | 13F | AXA Investment Managers S.A. | 8.076 | 354 | ||||||
| 2026-04-07 | 13F | Central Pacific Bank - Trust Division | 385 | 0,00 | 20 | 5,56 | ||||
| 2026-01-15 | 13F | Nisa Investment Advisors, Llc | 65 | 3 | ||||||
| 2026-02-17 | 13F | Aqr Capital Management Llc | 82.400 | 71,34 | 3.946 | 86,97 | ||||
| 2025-10-30 | 13F | Twin Peaks Wealth Advisors, LLC | 0 | -100,00 | 0 | |||||
| 2026-02-17 | 13F | FIL Ltd | 7.743.160 | -26,77 | 370.704 | -20,08 | ||||
| 2026-02-17 | 13F | State Of Wisconsin Investment Board | 161.568 | 7.745 | ||||||
| 2025-11-14 | 13F | Nekton Capital Ltd. | 62.315 | -58,32 | 2.735 | -54,70 | ||||
| 2026-04-14 | 13F | Nbc Securities, Inc. | 364 | 66,21 | 19 | 80,00 | ||||
| 2025-11-13 | 13F | Altshuler Shaham Ltd | 0 | -100,00 | 0 | -100,00 | ||||
| 2026-02-06 | 13F | Mizuho Markets Cayman LP | 0 | -100,00 | 0 | -100,00 | ||||
| 2026-02-17 | 13F | Moore Capital Management, Lp | 517.729 | 24.794 | ||||||
| 2026-02-05 | 13F | Sequent Planning LLC | 0 | -100,00 | 0 | |||||
| 2025-11-14 | 13F | Maverick Capital Ltd | 0 | -100,00 | 0 | |||||
| 2026-04-13 | 13F | IFP Advisors, Inc | 179 | 2,29 | 9 | 12,50 | ||||
| 2025-11-14 | 13F | Skopos Labs, Inc. | 0 | -100,00 | 0 | |||||
| 2025-11-05 | 13F | Bessemer Group Inc | 0 | -100,00 | 0 | |||||
| 2026-02-11 | 13F | Prestige Wealth Management Group LLC | 240 | 0,00 | 11 | 10,00 | ||||
| 2026-02-17 | 13F | Silvercrest Asset Management Group Llc | 4.371 | 209 | ||||||
| 2026-02-10 | 13F | Goldman Sachs Group Inc | 7.939.413 | 16,20 | 380.218 | 26,79 | ||||
| 2025-11-12 | 13F | Simplex Trading, Llc | 0 | -100,00 | 0 | -100,00 | ||||
| 2025-11-14 | 13F | Polymer Capital Management (US) LLC | Put | 0 | -100,00 | 0 | -100,00 | |||
| 2026-04-15 | 13F | Journey Strategic Wealth Llc | 3.995 | -39,96 | 207 | -35,22 | ||||
| 2025-11-12 | 13F | Headlands Technologies LLC | 0 | -100,00 | 0 | |||||
| 2026-02-17 | 13F | Polymer Capital Management (US) LLC | Call | 0 | -100,00 | 0 | ||||
| 2026-03-06 | 13F | Hsbc Holdings Plc | 0 | -100,00 | 0 | |||||
| 2026-04-15 | 13F | Douglas Lane & Associates, LLC | 1.155.685 | -0,88 | 59.807 | 7,11 | ||||
| 2026-02-17 | 13F | Bank Of America Corp /de/ | 3.702.241 | -9,44 | 177.300 | -1,19 | ||||
| 2026-02-05 | 13F | AlphaCore Capital LLC | 7.336 | 351 | ||||||
| 2026-02-17 | 13F | Susquehanna Advisors Group, Inc. | 0 | -100,00 | 0 | |||||
| 2026-01-23 | 13F | Assetmark, Inc | 70.918 | 2,80 | 3.396 | 12,19 | ||||
| 2026-02-17 | 13F | Engineers Gate Manager LP | 772.818 | 73,35 | 37.010 | 89,14 | ||||
| 2026-02-05 | 13F | Mission Wealth Management, Lp | 4.322 | 207 | ||||||
| 2026-04-10 | 13F | Henry James International Management Inc. | 24.003 | 0,00 | 1.242 | 8,09 | ||||
| 2026-02-11 | 13F | Vestcor Inc | 30.800 | 0,00 | 1 | 0,00 | ||||
| 2025-11-14 | 13F | ExodusPoint Capital Management, LP | 112.292 | 4.928 | ||||||
| 2026-04-02 | 13F | Ares Financial Consulting, LLC | 475 | 25 | ||||||
| 2026-02-13 | 13F | Boston Partners | 2.638.310 | -22,93 | 166.449 | -18,30 | ||||
| 2026-03-02 | 13F | Tobam | 419 | -79,16 | 0 | |||||
| 2026-01-28 | 13F | Eagle Global Advisors Llc | 5.700 | 0,00 | 273 | 8,80 | ||||
| 2026-02-17 | 13F | Css Llc/il | 20.093 | 48,84 | 962 | 62,50 | ||||
| 2026-02-17 | 13F | Polygon Management Ltd. | 0 | -100,00 | 0 | |||||
| 2026-02-12 | 13F | M&G Plc | 716.307 | 9,38 | 34.383 | 19,32 | ||||
| 2026-02-10 | 13F | Intech Investment Management Llc | 8.166 | 0,00 | 391 | 9,22 | ||||
| 2026-02-17 | 13F | Amundi | 833.106 | -0,14 | 39.897 | 11,11 | ||||
| 2026-04-22 | 13F | Janney Montgomery Scott LLC | 0 | -100,00 | 0 | |||||
| 2026-02-06 | 13F | Larson Financial Group LLC | 0 | -100,00 | 0 | |||||
| 2026-02-09 | 13F/A | Swedbank AB | 3.243.000 | 45,88 | 155.307 | 59,18 | ||||
| 2025-10-31 | 13F | Whittier Trust Co Of Nevada Inc | 0 | -100,00 | 0 | |||||
| 2026-04-24 | 13F | Yousif Capital Management, Llc | 6.063 | 0,00 | 314 | 2,96 | ||||
| 2025-10-28 | 13F | BRYN MAWR TRUST Co | 618 | 0,00 | 27 | 12,50 | ||||
| 2026-01-14 | 13F | Klein Pavlis & Peasley Financial, Inc. | 0 | -100,00 | 0 | |||||
| 2025-11-14 | 13F | Wealth Preservation Advisors, LLC | 0 | -100,00 | 0 | -100,00 | ||||
| 2025-11-12 | 13F | HAP Trading, LLC | Call | 552.200 | 3.215 | |||||
| 2026-02-11 | 13F | Simplex Trading, Llc | Call | 162.200 | -33,50 | 7.768 | 77.570,00 | |||
| 2026-02-11 | 13F | Simplex Trading, Llc | Put | 62.100 | -86,08 | 2.974 | 15.547,37 | |||
| 2026-04-09 | 13F | Pacifica Partners Inc. | 26.768 | -0,09 | 1.385 | 7,70 | ||||
| 2026-02-13 | 13F | Verition Fund Management LLC | Call | 0 | -100,00 | 0 | -100,00 | |||
| 2026-02-13 | 13F | JustInvest LLC | 26.166 | 4,95 | 1.253 | 14,53 | ||||
| 2026-01-20 | 13F | Cigna Investments Inc /new | 8.142 | -2,30 | 0 | |||||
| 2026-02-17 | 13F | Guggenheim Capital Llc | 8.968 | -2,17 | 429 | 6,72 | ||||
| 2026-02-17 | 13F | LMR Partners LLP | 770.000 | 165,52 | 36.875 | 189,72 | ||||
| 2026-02-19 | 13F | Mcguire Capital Advisors Inc | 44 | 2 | ||||||
| 2026-02-17 | 13F | Tudor Investment Corp Et Al | Call | 11.700 | -95,77 | 560 | -95,39 | |||
| 2026-02-17 | 13F | LMR Partners LLP | Call | 50.500 | -77,19 | 2.418 | -75,12 | |||
| 2026-02-17 | 13F | Tudor Investment Corp Et Al | Put | 18.700 | -84,52 | 896 | -83,12 | |||
| 2025-11-10 | 13F | Baldwin Investment Management, LLC | 0 | -100,00 | 0 | |||||
| 2026-01-28 | 13F | Ruffer LLP | 447.145 | -11,03 | 21.447 | -2,77 | ||||
| 2026-02-13 | 13F | Kestra Advisory Services, LLC | 4.178 | 200 | ||||||
| 2026-02-13 | 13F | Arkadios Wealth Advisors | 13.506 | 37,17 | 647 | 49,54 | ||||
| 2025-11-13 | 13F | Eisler Capital Management Ltd. | 0 | -100,00 | 0 | -100,00 | ||||
| 2026-04-17 | 13F | HHM Wealth Advisors, LLC | 600 | -14,29 | 31 | -6,06 | ||||
| 2026-02-02 | 13F | Principal Financial Group Inc | 18.832.299 | 11,57 | 902.769 | 21,90 | ||||
| 2026-02-12 | 13F | Voya Investment Management Llc | 12.415 | 148,40 | 595 | 171,69 | ||||
| 2026-01-23 | 13F | Sumitomo Mitsui Trust Holdings, Inc. | 49.893 | -3,77 | 2.389 | 5,01 | ||||
| 2026-02-11 | 13F | Zions Bancorporation, National Association /ut/ | 464 | 0,00 | 22 | 10,00 | ||||
| 2026-02-13 | 13F | PSquared Asset Management AG | 0 | -100,00 | 0 | |||||
| 2026-02-10 | 13F | Bank of New York Mellon Corp | 1.064.344 | -38,16 | 50.971 | -32,52 | ||||
| 2026-04-22 | 13F | Stone House Investment Management, LLC | 52 | 4,00 | 3 | 0,00 | ||||
| 2026-02-12 | 13F | Penserra Capital Management LLC | 30 | -28,57 | 0 | |||||
| 2026-02-12 | 13F | Scotia Capital Inc. | 417.430 | -2,39 | 19.956 | 6,47 | ||||
| 2026-02-12 | 13F | CIBC Private Wealth Group, LLC | 0 | -100,00 | 0 | |||||
| 2026-02-17 | 13F | Captrust Financial Advisors | 55.810 | 2.673 | ||||||
| 2025-11-14 | 13F | Horizon Investments, LLC | 0 | -100,00 | 0 | |||||
| 2026-02-13 | 13F | Verition Fund Management LLC | 127.700 | 580,27 | 6.116 | 643,01 | ||||
| 2026-02-13 | 13F | Morgan Stanley | 3.284.839 | 44,79 | 157.311 | 57,99 | ||||
| 2026-02-13 | 13F | Macquarie Group Ltd | 129.120 | -7,42 | 6.184 | 1,03 | ||||
| 2026-02-13 | 13F | Itau Unibanco Holding S.A. | 0 | -100,00 | 0 | |||||
| 2026-02-12 | 13F | Logan Capital Management Inc | 0 | -100,00 | 0 | -100,00 | ||||
| 2026-02-17 | 13F | Boreal Capital Management LLC | 257 | 0,00 | 12 | 9,09 | ||||
| 2026-02-13 | 13F | Acasta Partners UK LLP | 18.068 | 865 | ||||||
| 2026-02-11 | 13F | Group One Trading, L.p. | Call | 224.900 | -66,21 | 10.770 | -63,13 | |||
| 2026-02-10 | 13F | Td Asset Management Inc | 2.529.596 | -51,03 | 121.262 | -46,50 | ||||
| 2026-02-11 | 13F | Group One Trading, L.p. | Put | 248.200 | -63,25 | 11.886 | -59,90 | |||
| 2026-02-12 | 13F | Summit Financial, LLC | 4.191 | 201 | ||||||
| 2026-02-13 | 13F | Colony Group, LLC | 101.290 | 1.780,27 | 4.851 | 1.955,08 | ||||
| 2026-02-11 | 13F | Group One Trading, L.p. | 72.612 | 1.210,45 | 3.477 | 1.330,86 | ||||
| 2026-02-13 | 13F | Cloverfields Capital Group, Lp | 8.593 | -92,08 | 412 | -91,36 | ||||
| 2026-02-12 | 13F | Bank Of Montreal /can/ | Call | 36.500 | -90,50 | 1.747 | -89,64 | |||
| 2026-02-12 | 13F | Bank Of Montreal /can/ | 5.534.212 | -3,78 | 264.952 | 4,96 | ||||
| 2026-03-12 | 13F/A | Peak6 Llc | Call | 25.100 | -71,02 | 1.202 | -68,37 | |||
| 2025-11-14 | 13F | Cubist Systematic Strategies, LLC | Call | 0 | -100,00 | 0 | -100,00 | |||
| 2026-03-12 | 13F/A | Peak6 Llc | 15.495 | 742 | ||||||
| 2025-11-13 | 13F | Private Advisor Group, LLC | 0 | -100,00 | 0 | -100,00 | ||||
| 2026-04-16 | 13F | SG Americas Securities, LLC | 8.786 | 0 | ||||||
| 2026-02-13 | 13F | National Bank Of Canada /fi/ | Put | 792 | -18,01 | 3.791 | -10,53 | |||
| 2026-01-30 | 13F | Pekin Hardy Strauss, Inc. | 42.949 | -0,23 | 2.057 | 8,84 | ||||
| 2026-02-12 | 13F | Jane Street Group, Llc | Call | 373.600 | -30,36 | 17.892 | -24,02 | |||
| 2026-02-17 | 13F | Water Island Capital Llc | Put | 292.100 | 39,36 | 13.989 | 52,06 | |||
| 2026-02-12 | 13F | Jane Street Group, Llc | 53.575 | -36,06 | 2.566 | -30,24 | ||||
| 2026-04-23 | 13F | Harbor Investment Advisory, Llc | 22 | 1 | ||||||
| 2026-02-12 | 13F | Jane Street Group, Llc | Put | 27.800 | -84,51 | 1.331 | -83,10 | |||
| 2026-02-06 | 13F | Berbice Capital Management LLC | 300 | 0,00 | 14 | 7,69 | ||||
| 2026-02-13 | 13F | Golden State Wealth Management, LLC | 36 | -35,71 | 2 | -50,00 | ||||
| 2026-04-22 | 13F | Pictet Asset Management Holding SA | 199.738 | -12,15 | 10.319 | -5,30 | ||||
| 2026-02-09 | 13F | Employees Retirement System of Texas | 43.477 | 2 | ||||||
| 2026-02-13 | 13F | Candriam Luxembourg S.C.A. | 13.215 | 2,02 | 634 | 11,44 | ||||
| 2025-11-14 | 13F | Cubist Systematic Strategies, LLC | Put | 23.200 | 1.018 | |||||
| 2026-02-17 | 13F | Royal Bank Of Canada | Call | 456.000 | -75,29 | 21.838 | -73,03 | |||
| 2026-02-17 | 13F | Royal Bank Of Canada | 15.675.939 | -8,61 | 750.722 | -0,28 | ||||
| 2026-02-13 | 13F | BNP Paribas Asset Management Holding S.A. | 14.344 | 1 | ||||||
| 2026-01-29 | 13F | Calamos Advisors LLC | 0 | -100,00 | 0 | |||||
| 2026-02-11 | 13F | MCF Advisors LLC | 25 | 0,00 | 1 | 0,00 | ||||
| 2026-02-13 | 13F | Slotnik Capital, LLC | 0 | -100,00 | 0 | -100,00 | ||||
| 2026-02-13 | 13F | Cornerstone Financial Management LLC | 28 | 1 | ||||||
| 2026-02-13 | 13F | Slotnik Capital, LLC | Call | 0 | -100,00 | 0 | -100,00 | |||
| 2026-02-17 | 13F | Royal Bank Of Canada | Put | 250.000 | -45,68 | 11.973 | -40,72 | |||
| 2026-02-11 | 13F | Cerity Partners LLC | 67.042 | 6,59 | 3.211 | 16,30 | ||||
| 2026-02-17 | 13F | Two Sigma Investments, Lp | 0 | -100,00 | 0 | |||||
| 2026-02-18 | 13F | Guardian Capital Lp | 900.873 | -2,70 | 43.208 | 6,36 | ||||
| 2026-02-11 | 13F | Letko, Brosseau & Associates Inc | 1.216.592 | -15,42 | 58.320 | -7,59 | ||||
| 2026-02-12 | 13F | Northwest & Ethical Investments L.P. | 121.487 | -6,97 | 5.815 | 1,27 | ||||
| 2026-02-13 | 13F | P Schoenfeld Asset Management Lp | 31.438 | -19,67 | 1.506 | -12,35 | ||||
| 2026-02-17 | 13F | Sig Brokerage, Lp | Call | 50.000 | 2.394 | |||||
| 2026-01-29 | 13F | IMC-Chicago, LLC | Put | 193.100 | -36,33 | 9.248 | -30,53 | |||
| 2026-02-11 | 13F | Nikko Asset Management Americas, Inc. | 49.893 | 2.389 | ||||||
| 2026-01-29 | 13F | IMC-Chicago, LLC | Call | 411.900 | 38,83 | 19.726 | 51,47 | |||
| 2026-04-23 | 13F | Global Trust Asset Management, LLC | 659 | 0,00 | 34 | 9,68 | ||||
| 2026-02-12 | 13F | Barings Llc | 129.609 | 35,60 | 6.207 | 47,94 | ||||
| 2026-02-17 | 13F | Jones Financial Companies Lllp | 11.434 | 7,97 | 548 | 24,60 | ||||
| 2025-11-12 | 13F | Catalyst Funds Management Pty Ltd | 0 | -100,00 | 0 | |||||
| 2026-04-22 | 13F | Canoe Financial LP | 1.680.741 | -49,57 | 87.081 | -45,42 | ||||
| 2026-02-17 | 13F | Millennium Management Llc | Put | 0 | -100,00 | 0 | ||||
| 2026-01-16 | 13F | First Pacific Financial | 0 | -100,00 | 0 | |||||
| 2026-02-10 | 13F | BW Gestao de Investimentos Ltda. | 0 | -100,00 | 0 | |||||
| 2026-02-13 | 13F | National Bank Of Canada /fi/ | Call | 2.290 | 156,73 | 10.962 | 180,14 | |||
| 2026-02-13 | 13F | Manufacturers Life Insurance Company, The | 0 | -100,00 | 0 | |||||
| 2026-02-13 | 13F | Smartleaf Asset Management LLC | 958 | 14,59 | 46 | 25,00 | ||||
| 2025-11-07 | 13F | Sierra Ocean, Llc | 0 | -100,00 | 0 | |||||
| 2026-01-28 | 13F | U S Global Investors Inc | 5.000 | 0,00 | 239 | 9,13 | ||||
| 2026-02-11 | 13F | Allianz Asset Management GmbH | 378.981 | -16,72 | 18.192 | -8,89 | ||||
| 2026-04-14 | 13F | Thurston, Springer, Miller, Herd & Titak, Inc. | 80 | 0,00 | 4 | 33,33 | ||||
| 2026-02-13 | 13F | Towarzystwo Funduszy Inwestycyjnych Pzu Sa | 0 | -100,00 | 0 | |||||
| 2026-04-13 | 13F | Mather Group, Llc. | 3 | 0 | ||||||
| 2025-11-14 | 13F | Slate Path Capital LP | 0 | -100,00 | 0 | -100,00 | ||||
| 2026-02-11 | 13F | Twin Tree Management, LP | 44.006 | -50,12 | 2.107 | -45,58 | ||||
| 2026-02-17 | 13F | Northern Trust Corp | 408.176 | 3,60 | 19.548 | 13,03 | ||||
| 2026-02-13 | 13F | Parkside Financial Bank & Trust | 49 | 0,00 | 2 | 0,00 | ||||
| 2026-02-06 | 13F | Carrhae Capital LLP | 2.063.912 | 98.841 | ||||||
| 2026-01-30 | 13F | Citizens National Bank Trust Department | 0 | -100,00 | 0 | |||||
| 2025-11-04 | 13F | Independent Advisor Alliance | 0 | -100,00 | 0 | |||||
| 2026-04-08 | 13F | Wealth Enhancement Advisory Services, Llc | 4.519 | -27,95 | 239 | -26,09 | ||||
| 2026-02-12 | 13F | Dimensional Fund Advisors Lp | 5.156.818 | 0,74 | 246.962 | 9,92 | ||||
| 2026-04-22 | 13F | Apollon Wealth Management, LLC | 0 | -100,00 | 0 | |||||
| 2026-01-28 | 13F | DekaBank Deutsche Girozentrale | 661.708 | 0,00 | 37 | 24,14 | ||||
| 2026-01-02 | 13F | Global Wealth Strategies & Associates | 0 | -100,00 | 0 | |||||
| 2026-02-03 | 13F | SBI Securities Co., Ltd. | 363 | -2,16 | 17 | 6,25 | ||||
| 2025-11-14 | 13F | Wetherby Asset Management Inc | 34.148 | -13,87 | 1.499 | -6,37 | ||||
| 2026-02-13 | 13F | Squarepoint Ops LLC | Call | 29.300 | -77,00 | 1.403 | -74,91 | |||
| 2026-04-08 | 13F | Ervin Investment Management, LLC | 8.855 | 0,00 | 458 | 8,02 | ||||
| 2026-02-13 | 13F | Absolute Gestao de Investimentos Ltda. | 0 | -100,00 | 0 | |||||
| 2026-02-17 | 13F | Point72 Asset Management, L.P. | 120.374 | 5.765 | ||||||
| 2026-02-17 | 13F | Point72 Asset Management, L.P. | Call | 28.000 | 1.341 | |||||
| 2026-02-12 | 13F | Xponance, Inc. | 8.026 | 385 | ||||||
| 2026-02-17 | 13F | Alliancebernstein L.p. | 1.955.615 | -19,27 | 93.654 | -11,91 | ||||
| 2026-01-22 | 13F | Massachusetts Financial Services Co /ma/ | 1.229.686 | -34,40 | 58.890 | -28,42 | ||||
| 2026-02-17 | 13F | Mbb Public Markets I Llc | 563.228 | 0,00 | 26.973 | 9,11 | ||||
| 2025-11-14 | 13F | DME Capital Management, LP | 0 | -100,00 | 0 | |||||
| 2026-04-10 | 13F | Affinity Wealth Management Llc | 4.173 | 216 | ||||||
| 2026-04-14 | 13F | Perpetual Ltd | 487.004 | -13,10 | 25.202 | -6,09 | ||||
| 2026-04-22 | 13F | Gold Investment Management Ltd. | 2.615 | 0,04 | 135 | 8,00 | ||||
| 2026-02-13 | 13F | Lansdowne Partners (uk) Llp | 1.805.666 | 150,07 | 86.473 | 172,87 | ||||
| 2026-02-13 | 13F | Y-Intercept (Hong Kong) Ltd | 25.036 | 1.199 | ||||||
| 2026-02-17 | 13F | Quantinno Capital Management LP | 46.402 | 25,32 | 2.222 | 36,74 | ||||
| 2026-02-09 | 13F | Morningstar Investment Management LLC | 0 | -100,00 | 0 | |||||
| 2026-02-13 | 13F | Healthcare Of Ontario Pension Plan Trust Fund | 338.764 | 16.223 | ||||||
| 2026-02-17 | 13F | Pentwater Capital Management LP | 6.500.000 | 124,14 | 311.285 | 144,57 | ||||
| 2026-02-17 | 13F | FIL Ltd | Call | 0 | -100,00 | 0 | ||||
| 2026-02-17 | 13F | CastleKnight Management LP | 27.500 | 0,00 | 1.317 | 9,12 | ||||
| 2026-02-17 | 13F | Shelton Capital Management | 11.500 | 0,00 | 551 | 9,13 | ||||
| 2026-04-17 | 13F | CENTRAL TRUST Co | 16.120 | -2,12 | 834 | 5,84 | ||||
| 2026-02-13 | 13F | Charles Schwab Investment Management Inc | 1.736.925 | 5,65 | 83.263 | 15,43 | ||||
| 2026-02-13 | 13F | American Century Companies Inc | 295.212 | -66,44 | 14.133 | -63,38 | ||||
| 2026-02-17 | 13F | Point72 Asset Management, L.P. | Put | 59.900 | 128,63 | 2.869 | 149,61 | |||
| 2026-02-17 | 13F | Jump Financial, LLC | 591.518 | 43,82 | 28.328 | 56,93 | ||||
| 2026-02-09 | 13F | Legal & General Group Plc | 3.522.466 | 0,74 | 168.857 | 10,06 | ||||
| 2026-02-17 | 13F | Lighthouse Investment Partners, LLC | 370.955 | 82,10 | 17.765 | 98,69 | ||||
| 2026-01-14 | 13F | ORG Partners LLC | 20 | 1 | ||||||
| 2026-02-13 | 13F | Neuberger Berman Group LLC | 48.459 | -4,22 | 2.323 | 4,64 | ||||
| 2026-02-13 | 13F | Dynamic Technology Lab Private Ltd | 0 | -100,00 | 0 | |||||
| 2026-02-12 | 13F | Groupe la Francaise | 0 | -100,00 | 0 | |||||
| 2026-02-12 | 13F | Nuveen, LLC | 486.793 | -1,07 | 23.336 | 8,09 | ||||
| 2026-02-13 | 13F | Ubs Asset Management Americas Inc | 441 | 21 | ||||||
| 2026-02-13 | 13F | Entropy Technologies, LP | 0 | -100,00 | 0 | |||||
| 2026-02-06 | 13F | Addison Advisors LLC | 432 | 0,00 | 21 | 11,11 | ||||
| 2026-04-22 | 13F | Avantra Family Wealth, Inc. | 10.414 | 21,92 | 539 | 31,54 | ||||
| 2025-11-14 | 13F | Delta Global Management LP | 0 | -100,00 | 0 | |||||
| 2026-02-10 | 13F | PCJ Investment Counsel Ltd. | 29.700 | -18,92 | 1.422 | -11,52 | ||||
| 2026-01-30 | 13F | R Squared Ltd | 0 | -100,00 | 0 | |||||
| 2026-04-22 | 13F | Bravera Wealth | 120 | 0,00 | 6 | 20,00 | ||||
| 2026-02-10 | 13F | Bruce G. Allen Investments, LLC | 1.448 | 0,00 | 69 | 9,52 | ||||
| 2026-02-17 | 13F | D. E. Shaw & Co., Inc. | Call | 150.000 | 7.184 | |||||
| 2026-02-17 | 13F | Man Group plc | 526.707 | -1,12 | 25.224 | 7,89 | ||||
| 2026-02-17 | 13F | D. E. Shaw & Co., Inc. | 3.069.596 | 26,72 | 146.994 | 38,30 | ||||
| 2026-02-17 | 13F | D. E. Shaw & Co., Inc. | Put | 51.400 | 0,00 | 2.462 | 9,14 | |||
| 2026-02-17 | 13F | Alphadyne Asset Management, LLC | Call | 82.800 | 3.965 | |||||
| 2026-04-17 | 13F | Bell Investment Advisors, Inc | 186 | 0,00 | 10 | 12,50 | ||||
| 2026-01-30 | 13F | Us Bancorp \de\ | 15.672 | -1,17 | 751 | 7,91 | ||||
| 2026-02-17 | 13F | Alphadyne Asset Management, LLC | Put | 87.300 | 4.181 | |||||
| 2026-02-17 | 13F | Voloridge Investment Management, Llc | 84.163 | -43,96 | 4.031 | -38,86 | ||||
| 2026-02-19 | 13F | Atomi Financial Group, Inc. | 32.266 | 1,04 | 1.545 | 10,28 | ||||
| 2026-01-27 | 13F | CenterStar Asset Management, LLC | Call | 18.400 | 881 | |||||
| 2026-03-04 | 13F | SHP Wealth Management | 34 | 2 | ||||||
| 2026-01-27 | 13F | CenterStar Asset Management, LLC | Put | 23.100 | 22,22 | 1.106 | 33,41 | |||
| 2026-02-17 | 13F | Capital Fund Management S.a. | Put | 83.400 | -47,97 | 3.994 | -43,23 | |||
| 2026-02-17 | 13F | Capital Fund Management S.a. | Call | 84.400 | -46,78 | 4.042 | -41,94 | |||
| 2026-02-17 | 13F | Creative Planning | 94.151 | 14,75 | 4.509 | 25,22 | ||||
| 2026-02-05 | 13F | Allworth Financial LP | 2.177 | -12,61 | 104 | -4,59 | ||||
| 2026-02-13 | 13F | Marshall Wace, Llp | 0 | -100,00 | 0 | |||||
| 2026-02-17 | 13F | Black Maple Capital Management LP | 5.700 | -25,97 | 273 | -19,29 | ||||
| 2025-11-14 | 13F | Socorro Asset Management LP | 0 | -100,00 | 0 | -100,00 | ||||
| 2026-02-13 | 13F | LGT Financial Advisors LLC | 43 | 0,00 | 2 | 100,00 | ||||
| 2026-02-17 | 13F | Public Employees Retirement System Of Ohio | 472.064 | 1.625,88 | 22.660 | 1.788,25 | ||||
| 2026-02-13 | 13F | Toroso Investments, LLC | 88.842 | 49,62 | 4.255 | 63,24 | ||||
| 2026-02-19 | 13F | CI Private Wealth, LLC | 41.022 | 15,33 | 1.965 | 25,82 | ||||
| 2026-02-17 | 13F | Cape Investment Advisory, Inc. | 584 | 178,10 | 28 | 200,00 | ||||
| 2026-04-15 | 13F | Addenda Capital Inc. | 168.202 | -0,53 | 12.127 | 9,14 | ||||
| 2026-02-13 | 13F | Kilter Group LLC | 65 | 282,35 | 3 | |||||
| 2026-02-13 | 13F | Public Sector Pension Investment Board | 0 | -100,00 | 0 | |||||
| 2025-11-13 | 13F | Hudson Bay Capital Management LP | 0 | -100,00 | 0 | |||||
| 2026-04-20 | 13F | Ronald Blue Trust, Inc. | 563 | 411,82 | 29 | 480,00 | ||||
| 2026-01-30 | 13F | Richardson Capital Management LLC | 215 | 0,00 | 10 | 11,11 | ||||
| 2025-11-14 | 13F | Capstone Investment Advisors, Llc | 0 | -100,00 | 0 | -100,00 | ||||
| 2026-02-13 | 13F | CDC Financial, Inc. | 3.550 | 170 | ||||||
| 2026-02-11 | 13F | Syon Capital Llc | 14.779 | 708 | ||||||
| 2025-11-14 | 13F | VestGen Advisors, LLC | 0 | -100,00 | 0 | -100,00 | ||||
| 2026-04-07 | 13F | Park Avenue Securities Llc | 0 | -100,00 | 0 | |||||
| 2026-02-13 | 13F | Schroder Investment Management Group | 0 | -100,00 | 0 | |||||
| 2026-02-13 | 13F | Capula Management Ltd | Call | 123.300 | 5.905 | |||||
| 2026-04-13 | 13F | JCIC Asset Management Inc. | 0 | -100,00 | 0 | |||||
| 2026-02-05 | 13F | Stephens Inc /ar/ | 5.541 | -21,81 | 265 | -14,79 | ||||
| 2026-02-17 | 13F | Empyrean Capital Partners, LP | 0 | -100,00 | 0 | |||||
| 2026-03-18 | 13F | Employees Provident Fund Board | 0 | -100,00 | 0 | -100,00 | ||||
| 2025-10-28 | 13F | CarsonAllaria Wealth Management, Ltd. | 0 | -100,00 | 0 | -100,00 | ||||
| 2026-02-17 | 13F | Millennium Management Llc | Call | 0 | -100,00 | 0 | ||||
| 2026-02-13 | 13F | Capula Management Ltd | 16.439 | 23,66 | 1.076 | 34,04 | ||||
| 2026-02-17 | 13F | Canada Pension Plan Investment Board | 4.448.773 | 24,21 | 212.987 | 35,59 | ||||
| 2026-02-12 | 13F | Wealthspire Advisors, LLC | 0 | -100,00 | 0 | |||||
| 2026-02-17 | 13F | MIRAE ASSET GLOBAL ETFS HOLDINGS Ltd. | 4.828.524 | 79,21 | 231.467 | 95,80 | ||||
| 2026-03-12 | 13F/A | Peak6 Llc | Put | 0 | -100,00 | 0 | -100,00 | |||
| 2026-04-15 | 13F | Myriad Asset Management US LP | 10.917 | 12,12 | 565 | 21,24 | ||||
| 2025-11-14 | 13F | Lombard Odier Asset Management (USA) Corp | 0 | -100,00 | 0 | -100,00 | ||||
| 2026-02-10 | 13F | Scheer, Rowlett & Associates Investment Management Ltd. | 288.130 | -13,27 | 13.794 | -5,33 | ||||
| 2026-02-13 | 13F | Victory Capital Management Inc | 249.774 | -81,17 | 12.386 | -78,73 | ||||
| 2026-02-17 | 13F | Citadel Advisors Llc | 761.934 | -13,77 | 36.489 | -5,91 | ||||
| 2026-02-17 | 13F | Citadel Advisors Llc | Put | 413.400 | -33,12 | 19.798 | -27,02 | |||
| 2026-02-17 | 13F | Citadel Advisors Llc | Call | 774.500 | -28,81 | 37.091 | -22,33 | |||
| 2026-02-17 | 13F | Nearwater Capital Markets, Ltd | 0 | -100,00 | 0 | |||||
| 2026-01-28 | 13F | Kapitalo Investimentos Ltda | 302.859 | 0,00 | 14.504 | 9,11 | ||||
| 2026-02-17 | 13F | Prelude Capital Management, Llc | 12.147 | 582 | ||||||
| 2026-02-05 | 13F | Td Private Client Wealth Llc | 29.543 | 4,70 | 1.415 | 14,22 | ||||
| 2026-04-15 | 13F | Financial Management Professionals, Inc. | 1.000 | 0,00 | 52 | 8,51 | ||||
| 2025-11-14 | 13F | Sandler Capital Management | 0 | -100,00 | 0 | -100,00 | ||||
| 2026-02-03 | 13F | Costello Asset Management, INC | 600 | 0,00 | 29 | 7,69 | ||||
| 2026-02-17 | 13F | Sig Brokerage, Lp | Put | 0 | -100,00 | 0 | ||||
| 2026-04-23 | 13F | Oppenheimer & Co Inc | 0 | -100,00 | 0 | |||||
| 2026-02-03 | 13F | Crossmark Global Holdings, Inc. | 7.784 | -41,09 | 373 | -35,75 | ||||
| 2026-02-02 | 13F | Cornerstone Planning Group LLC | 21 | 1 | ||||||
| 2026-02-11 | 13F | SOUTH STATE Corp | 20 | -98,26 | 1 | -100,00 | ||||
| 2026-02-12 | 13F | Qtron Investments LLC | 12.598 | 604 | ||||||
| 2026-02-10 | 13F | Gulf International Bank (UK) Ltd | 22.649 | 0,00 | 1 | 0,00 | ||||
| 2026-04-21 | 13F | Vise Technologies, Inc. | 6.283 | 0,00 | 301 | 0,00 | ||||
| 2026-04-16 | 13F | SG Americas Securities, LLC | Call | 0 | -100,00 | 0 | ||||
| 2026-04-22 | 13F | Quattro Financial Advisors Llc | 36.770 | 0,00 | 1.903 | 8,07 | ||||
| 2026-02-17 | 13F | Sona Asset Management (us) Llc | Call | 0 | -100,00 | 0 | ||||
| 2026-04-08 | 13F | Community Financial Services Group, LLC | 480 | 26 | ||||||
| 2026-01-30 | 13F | Laurel Wealth Advisors LLC | 120 | 6 | ||||||
| 2026-02-11 | 13F | Westerkirk Capital Inc. | 1.280 | -93,11 | 61 | -92,52 | ||||
| 2026-02-17 | 13F | Highland Capital Management Fund Advisors, L.p. | 16.850 | 0,00 | 807 | 9,07 | ||||
| 2026-02-27 | 13F | Groupama Asset Managment | Call | 25.000 | 0,00 | 238 | 30,22 | |||
| 2026-02-06 | 13F | EverSource Wealth Advisors, LLC | 1.961 | -11,55 | 94 | -4,12 | ||||
| 2026-02-12 | 13F | Marex Group plc | 152.311 | -5,67 | 7.294 | 2,94 | ||||
| 2026-02-12 | 13F | Swiss National Bank | 1.211.979 | -9,58 | 58.141 | -1,16 | ||||
| 2026-02-17 | 13F | Nomura Holdings Inc | Call | 63.900 | 3.060 | |||||
| 2026-04-13 | 13F | Hm Payson & Co | 318 | 0,00 | 16 | 6,67 | ||||
| 2026-04-09 | 13F | Chemistry Wealth Management LLC | 13.039 | -11,27 | 675 | -4,13 | ||||
| 2026-01-20 | 13F | Savvy Advisors, Inc. | 7.318 | 350 | ||||||
| 2025-11-12 | 13F | Creekmur Asset Management LLC | 71 | 0,00 | 3 | 50,00 | ||||
| 2026-02-12 | 13F | Mount Yale Investment Advisors, LLC | 5.254 | -6,41 | 252 | 2,03 | ||||
| 2026-04-16 | 13F | SG Americas Securities, LLC | Put | 0 | -100,00 | 0 | ||||
| 2026-02-06 | 13F | Leonteq Securities AG | 9.077 | -0,10 | 435 | 9,05 | ||||
| 2025-11-14 | 13F | Concentric Capital Strategies, LP | 0 | -100,00 | 0 | |||||
| 2026-04-17 | 13F | AdvisorNet Financial, Inc | 271 | 0,00 | 14 | 16,67 | ||||
| 2026-01-30 | 13F | Caldwell Securities, Inc | 646 | 0,00 | 31 | 7,14 | ||||
| 2026-02-17 | 13F | Zurich Insurance Group Ltd/FI | 106.305 | -69,58 | 5.101 | -66,70 | ||||
| 2026-01-28 | 13F | Evergreen Private Wealth LLC | 0 | -100,00 | 0 | |||||
| 2026-02-06 | 13F | Alan B. Lancz & Associates, Inc. | 9.550 | 0,00 | 457 | 9,07 | ||||
| 2025-11-12 | 13F | Bellwether Advisors, LLC | 0 | -100,00 | 0 | |||||
| 2026-04-23 | 13F | Lansforsakringar Fondforvaltning AB (publ) | 109.352 | -8,24 | 5.650 | -1,10 | ||||
| 2026-02-13 | 13F | Centiva Capital, LP | 0 | -100,00 | 0 | |||||
| 2026-02-17 | 13F | Toronto Dominion Bank | Put | 1.000 | 0,00 | 48 | 9,30 | |||
| 2026-02-17 | 13F | Qube Research & Technologies Ltd | 494.212 | 641,88 | 23.667 | 710,24 | ||||
| 2026-03-04 | 13F/A | Savant Capital, LLC | 0 | -100,00 | 0 | -100,00 | ||||
| 2026-02-10 | 13F | CIBC Asset Management Inc | 5.646.656 | 3,50 | 271.828 | 13,08 | ||||
| 2026-02-13 | 13F | Atlas Capital Advisors Llc | 473 | 0,00 | 23 | 15,79 | ||||
| 2026-02-17 | 13F | Toronto Dominion Bank | Call | 8.500 | -73,44 | 407 | -71,08 | |||
| 2026-02-26 | 13F | TD Capital Management LLC | 322 | 0,00 | 15 | 7,14 | ||||
| 2026-02-02 | 13F | Fifth Third Bancorp | 8.315 | -0,94 | 398 | 8,15 | ||||
| 2026-02-17 | 13F | Toronto Dominion Bank | 1.163.052 | 18,44 | 55.682 | 29,28 | ||||
| 2026-02-17 | 13F | Schonfeld Strategic Advisors LLC | 24.562 | 10,04 | 1.176 | 20,12 | ||||
| 2026-02-09 | 13F | Themes Management Co LLC | 4.957 | 237 | ||||||
| 2026-04-24 | 13F | Black Swift Group, LLC | 70.500 | 3.648 | ||||||
| 2025-11-14 | 13F | Lombard Odier Asset Management (Europe) Ltd | 0 | -100,00 | 0 | |||||
| 2026-02-13 | 13F | Barclays Plc | 206.144 | 185,58 | 9.872 | 211,62 | ||||
| 2026-02-13 | 13F | Osmosis Investment Management UK Ltd | 4.838 | 232 | ||||||
| 2026-01-30 | 13F | AMG National Trust Bank | 4.891 | 234 | ||||||
| 2026-02-10 | 13F | Quantbot Technologies LP | 45.793 | -1,27 | 2.193 | 7,76 | ||||
| 2025-11-14 | 13F | Axa S.a. | 0 | -100,00 | 0 | |||||
| 2026-02-13 | 13F | Dixon Mitchell Investment Counsel Inc. | 3.156 | 151 | ||||||
| 2026-02-04 | 13F | Swiss Life Asset Management Ltd | 77.161 | 72,75 | 3.695 | 88,37 | ||||
| 2026-02-06 | 13F | Global Retirement Partners, LLC | 3.306 | 105,47 | 158 | 125,71 | ||||
| 2026-02-10 | 13F | Natixis Advisors, L.p. | 686.867 | 5,98 | 33 | 14,29 | ||||
| 2026-02-06 | 13F | ProShare Advisors LLC | 7.430 | 2,21 | 356 | 11,64 | ||||
| 2026-02-17 | 13F | Balyasny Asset Management Llc | 0 | -100,00 | 0 | |||||
| 2026-02-12 | 13F | Alps Advisors Inc | 370.474 | 122,73 | 17.742 | 143,04 | ||||
| 2026-01-23 | 13F | Tectonic Advisors Llc | 0 | -100,00 | 0 | |||||
| 2026-02-03 | 13F | Chesapeake Capital Corp /il/ | 8.080 | 387 | ||||||
| 2026-02-04 | 13F | BCJ Capital Management, LLC | 0 | -100,00 | 0 | |||||
| 2026-02-06 | 13F | Pathway Financial Advisers, LLC | 0 | -100,00 | 0 | -100,00 | ||||
| 2026-02-05 | 13F | Atria Investments Llc | 36.865 | 16,29 | 1.765 | 26,89 | ||||
| 2026-02-17 | 13F | Wellington Management Group Llp | 6.162.993 | 6,61 | 295.243 | 16,38 | ||||
| 2026-02-17 | 13F | Millennium Management Llc | 2.391.255 | -31,24 | 114.517 | -24,97 | ||||
| 2026-01-07 | 13F | Permanent Capital Management, LP | 32.270 | 0,00 | 1.545 | 9,11 | ||||
| 2026-02-17 | 13F | Hancock Prospecting Pty Ltd | 10.298.293 | 31,68 | 493.185 | 43,68 | ||||
| 2026-02-13 | 13F | Palliser Capital (UK) Ltd | 281.293 | 153,79 | 13.471 | 176,95 | ||||
| 2026-02-18 | 13F | VGI Partners Ltd | 3.521.364 | 1,14 | 168.638 | 10,35 | ||||
| 2026-02-06 | 13F | Pnc Financial Services Group, Inc. | 14.021 | -11,84 | 671 | -3,87 | ||||
| 2026-02-06 | 13F | Gsa Capital Partners Llp | 35.425 | -13,47 | 2 | 0,00 | ||||
| 2026-02-10 | 13F | Nomura Asset Management Co Ltd | 0 | 0 | ||||||
| 2026-04-15 | 13F | Avanza Fonder AB | 29.129 | 0,00 | 2.100 | 9,72 | ||||
| 2026-02-12 | 13F | Federation des caisses Desjardins du Quebec | 1.299.638 | -43,90 | 62.158 | -38,81 | ||||
| 2026-02-11 | 13F | Picton Mahoney Asset Management | 995.750 | -11,29 | 47.738 | 97.324,49 | ||||
| 2026-04-21 | 13F | Vanguard Capital Wealth Advisors This fund is a listed as child fund of Vanguard Group Inc and if that institution has disclosed ownership in this security, then these positions will not be double counted when calculating total shares and total value | 0 | -100,00 | 0 | |||||
| 2026-02-10 | 13F | Forsta Ap-fonden | 80.200 | -8,03 | 3.845 | 0,47 | ||||
| 2026-02-18 | 13F | Mackenzie Financial Corp | 8.258.250 | 6,95 | 395.101 | 16,66 | ||||
| 2026-02-06 | 13F | Copia Wealth Management | 125 | 0,00 | 6 | 0,00 | ||||
| 2026-04-24 | 13F | Ninety One SA (PTY) Ltd | 0 | -100,00 | 0 | |||||
| 2025-11-14 | 13F | SIG North Trading, ULC | 0 | -100,00 | 0 | -100,00 | ||||
| 2026-03-11 | 13F | Leonteq Securities AG | Put | 0 | -100,00 | 0 | ||||
| 2026-02-13 | 13F | Mariner, LLC | 17.467 | 5,94 | 837 | 15,63 | ||||
| 2026-02-17 | 13F | Fmr Llc | 3.935.824 | 27,63 | 188.434 | 39,28 | ||||
| 2026-01-29 | 13F | Vanguard Group Inc | 20.185.694 | 1,40 | 966.370 | 10,66 | ||||
| 2026-02-12 | 13F | Colonial Trust Co / SC | 182 | 0,00 | 9 | 0,00 | ||||
| 2026-04-24 | 13F | Root Financial Partners, LLC | 8 | 0 | ||||||
| 2026-02-17 | 13F | Ameriflex Group, Inc. | 719 | -76,38 | 34 | -74,44 | ||||
| 2026-04-24 | 13F | UMA Financial Services, Inc. | 162 | 0,00 | 8 | 14,29 | ||||
| 2026-04-06 | 13F | GAMMA Investing LLC | 45 | 0,00 | 2 | 0,00 | ||||
| 2026-04-13 | 13F | Chesley Taft & Associates LLC | 4.911 | 2,65 | 254 | 10,92 | ||||
| 2026-02-17 | 13F | DZ BANK AG Deutsche Zentral Genossenschafts Bank, Frankfurt am Main | 5.600 | 0,00 | 268 | 9,39 | ||||
| 2026-02-17 | 13F | Edmond De Rothschild Holding S.a. | 2.784 | 0,00 | 133 | 9,02 | ||||
| 2026-02-12 | 13F | Brown Brothers Harriman & Co | 530 | 25 | ||||||
| 2026-02-17 | 13F | Raymond James Financial Inc | 547.835 | 2,25 | 26.236 | 11,57 | ||||
| 2026-02-06 | 13F | Cullen/frost Bankers, Inc. | 120 | 0,00 | 6 | 0,00 | ||||
| 2026-02-05 | 13F | Heathbridge Capital Management Ltd. | 232.300 | -0,75 | 11.137 | 8,53 | ||||
| 2026-04-24 | 13F | Medallion Wealth Advisors, LLC | 160 | 0,00 | 8 | 14,29 | ||||
| 2026-02-06 | 13F | HighTower Advisors, LLC | 109.434 | 23,63 | 5.241 | 34,88 | ||||
| 2026-02-17 | 13F | Magnetar Financial LLC | 1.881.954 | 126,38 | 90.127 | 147,02 | ||||
| 2026-02-17 | 13F | Bank Of America Corp /de/ | Put | 0 | -100,00 | 0 | ||||
| 2026-02-06 | 13F | Nano Cap New Millennium Growth Fund L P | 7.500 | 359 | ||||||
| 2026-02-10 | 13F | Connor, Clark & Lunn Investment Management Ltd. | 322.747 | -83,16 | 15.452 | -81,62 | ||||
| 2025-11-14 | 13F | Nomura Holdings Inc | 0 | -100,00 | 0 | -100,00 | ||||
| 2025-11-12 | 13F | Impala Asset Management LLC | 0 | -100,00 | 0 | |||||
| 2026-02-10 | 13F | Goldman Sachs Group Inc | Put | 0 | -100,00 | 0 | -100,00 | |||
| 2026-02-13 | 13F | Barclays Plc | Call | 0 | -100,00 | 0 | -100,00 | |||
| 2026-02-11 | 13F | Cedar Mountain Advisors, LLC | 322 | 0,00 | 15 | 7,14 | ||||
| 2025-11-14 | 13F | Nomura Holdings Inc | Put | 0 | -100,00 | 0 | -100,00 | |||
| 2026-02-17 | 13F | Optiver Holding B.V. | 68 | 6.700,00 | 3 | |||||
| 2026-02-17 | 13F | Shay Capital LLC | Call | 13.400 | -74,91 | 642 | -72,64 | |||
| 2025-11-14 | 13F | Ulysses Management LLC | 0 | -100,00 | 0 | |||||
| 2026-02-12 | 13F | Steward Partners Investment Advisory, Llc | 4.096 | 0,17 | 196 | 9,50 | ||||
| 2026-02-13 | 13F | Bank Of Nova Scotia | 1.110.085 | -17,11 | 53.143 | -9,57 | ||||
| 2026-02-17 | 13F | TIG Advisors, LLC | 503.569 | 105,09 | 24.116 | 123,78 | ||||
| 2025-11-13 | 13F | LGT Group Foundation | 0 | -100,00 | 0 | |||||
| 2026-02-06 | 13F | Abn Amro Investment Solutions | 510.989 | 156,40 | 24.471 | 179,76 | ||||
| 2026-02-12 | 13F | Rossby Financial, LCC | 69 | 0,00 | 3 | 0,00 | ||||
| 2026-02-17 | 13F | DSC Meridian Capital LP | 297.440 | -42,88 | 14.244 | -37,68 | ||||
| 2026-01-15 | 13F | J. Safra Sarasin Holding AG | 56.307 | 16,50 | 2.699 | 27,31 | ||||
| 2025-10-31 | 13F | AMF Pensionsforsakring AB | 0 | -100,00 | 0 | |||||
| 2026-02-11 | 13F | Metis Global Partners, LLC | 48.563 | -12,85 | 2.325 | -4,91 | ||||
| 2026-04-03 | 13F | Adirondack Trust Co | 97 | 0,00 | 5 | 25,00 | ||||
| 2026-02-12 | 13F | Aviva Plc | 394.452 | 5,47 | 18.899 | 15,30 | ||||
| 2026-02-13 | 13F | Senator Investment Group LP | 1.659.442 | -16,51 | 79.471 | -8,90 | ||||
| 2026-04-15 | 13F | City Holding Co | 381 | 0,00 | 20 | 5,56 | ||||
| 2026-02-11 | 13F | Fiera Capital Corp | 6.488 | -1,70 | 311 | 7,61 | ||||
| 2025-11-14 | 13F | Wolverine Trading, Llc | 64.247 | 88,93 | 2.833 | 105,59 | ||||
| 2026-02-17 | 13F | National Asset Management, Inc. | 6.023 | 25,11 | 288 | 36,49 | ||||
| 2025-11-14 | 13F | Wolverine Trading, Llc | Call | 302.000 | -0,26 | 13.318 | 8,52 | |||
| 2025-11-14 | 13F | Wolverine Trading, Llc | Put | 185.000 | 34,25 | 8.158 | 46,07 | |||
| 2026-04-15 | 13F | Compagnie Lombard Odier SCmA | 1.300 | 0,00 | 67 | 8,06 | ||||
| 2026-02-12 | 13F | Aldebaran Capital, Llc | 0 | -100,00 | 0 | -100,00 | ||||
| 2026-02-17 | 13F | Wealth Architects, LLC | 4.670 | -1,41 | 224 | 7,73 | ||||
| 2026-02-13 | 13F | Caitong International Asset Management Co., Ltd | 213 | 33,96 | 10 | 66,67 | ||||
| 2026-04-22 | 13F | Braun Stacey Associates Inc | 355.317 | -0,45 | 18.388 | 7,58 | ||||
| 2026-02-04 | 13F | HighPoint Advisor Group LLC | 11.905 | 8,63 | 570 | 18,75 | ||||
| 2026-01-22 | 13F | Bartlett & Co. Wealth Management Llc | 2.000 | 0,00 | 96 | 9,20 | ||||
| 2026-02-17 | 13F | Investment Management Corp of Ontario | 131.049 | 28,82 | 6.276 | 40,57 | ||||
| 2026-02-17 | 13F | Limestone Investment Advisors LP | Call | 0 | -100,00 | 0 | ||||
| 2026-04-14 | 13F | Banque Pictet & Cie Sa | 0 | -100,00 | 0 | -100,00 | ||||
| 2026-02-11 | 13F | Deutsche Bank Ag\ | 1.093.749 | -19,71 | 52.380 | -12,39 | ||||
| 2026-02-17 | 13F | Two Sigma Advisers, Lp | 0 | -100,00 | 0 | |||||
| 2026-01-26 | 13F | Private Trust Co Na | 0 | -100,00 | 0 | |||||
| 2026-02-11 | 13F | Fosun International Ltd | 5.066 | 0,00 | 243 | 9,01 | ||||
| 2026-02-27 | 13F | Groupama Asset Managment | 2.109.053 | 3,81 | 101.453 | 13,24 | ||||
| 2026-02-17 | 13F | Susquehanna International Group, Llp | Call | 1.174.200 | -7,30 | 56.232 | 1,15 | |||
| 2026-01-13 | 13F | CoreCap Advisors, LLC | 0 | -100,00 | 0 | -100,00 | ||||
| 2026-02-11 | 13F | Sunrise Financial Services, LLC | 50 | 2 | ||||||
| 2026-02-17 | 13F | Price T Rowe Associates Inc /md/ | 2.854.516 | -38,76 | 137 | -33,33 | ||||
| 2026-02-17 | 13F | Susquehanna International Group, Llp | 31.027 | 143,44 | 1.486 | 165,65 | ||||
| 2026-02-17 | 13F | Susquehanna International Group, Llp | Put | 630.000 | -4,28 | 30.171 | 4,44 | |||
| 2026-02-10 | 13F | Envestnet Asset Management Inc | 541.045 | 5,56 | 25.911 | 15,18 | ||||
| 2026-02-13 | 13F | Squarepoint Ops LLC | Put | 0 | -100,00 | 0 | -100,00 | |||
| 2026-02-10 | 13F | Private Wealth Asset Management, LLC | 17 | 0,00 | 1 | |||||
| 2026-04-07 | 13F | Signaturefd, Llc | 19.642 | 0,95 | 1.016 | 9,13 | ||||
| 2025-11-14 | 13F | Caption Management, LLC | Call | 0 | -100,00 | 0 | -100,00 | |||
| 2026-02-11 | 13F | Myriad Asset Management Advisors LLC | 64.347 | 3.082 | ||||||
| 2026-04-06 | 13F | Versant Capital Management, Inc | 851 | 14,54 | 44 | 25,71 | ||||
| 2026-02-17 | 13F | Water Island Capital Llc | 0 | -100,00 | 0 | |||||
| 2025-11-14 | 13F | Wood Tarver Financial Group, LLC | 0 | -100,00 | 0 | |||||
| 2026-04-22 | 13F | Union Bancaire Privee, UBP SA | 32.096 | 36,23 | 1.386 | 39,62 | ||||
| 2026-02-12 | 13F | Skandinaviska Enskilda Banken AB (publ) | 24.506 | -58,81 | 1.612 | -55,62 | ||||
| 2025-11-04 | 13F | Umb Bank N A/mo | 0 | -100,00 | 0 | |||||
| 2026-02-17 | 13F | Janus Henderson Group Plc | 3.564.732 | -50,95 | 170.871 | -46,41 | ||||
| 2026-02-10 | 13F | Bnp Paribas Arbitrage, Sa | Call | 281 | -90,41 | 1.346 | -89,54 | |||
| 2026-01-21 | 13F | Flagship Harbor Advisors, Llc | 2.147 | 103 | ||||||
| 2026-02-10 | 13F | Bnp Paribas Arbitrage, Sa | 171.731 | 14,15 | 8.224 | 24,55 | ||||
| 2026-02-13 | 13F | Great West Life Assurance Co /can/ | 322.141 | -1,79 | 15 | 7,14 | ||||
| 2026-02-17 | 13F | Lombard Odier Asset Management (Switzerland) SA | 41.872 | 2.007 | ||||||
| 2026-01-21 | 13F | Drummond Knight Asset Management Pty Ltd | 445.923 | -49,33 | 21.355 | -44,71 | ||||
| 2026-02-13 | 13F | PCM Encore, LLC | 12.636 | 605 | ||||||
| 2026-02-10 | 13F | Bnp Paribas Arbitrage, Sa | Put | 187 | 896 | |||||
| 2026-04-13 | 13F | True Wealth Design, LLC | 45 | 25,00 | 2 | 100,00 | ||||
| 2026-02-02 | 13F | Truist Financial Corp | 16.999 | -9,00 | 814 | -0,61 | ||||
| 2026-02-12 | 13F | Quadrant Capital Group Llc | 18.161 | 0,13 | 870 | 9,17 | ||||
| 2026-04-14 | 13F | Tradewinds Capital Management, LLC | 2.500 | 0,00 | 129 | 8,40 | ||||
| 2026-04-21 | 13F | Alpine Associates Management Inc. | Call | 0 | -100,00 | 0 | ||||
| 2026-02-12 | 13F | BlackRock, Inc. | 12.650.257 | -1,34 | 605.821 | 7,66 | ||||
| 2025-12-19 | 13F | Finivi Inc. | 0 | -100,00 | 0 | -100,00 | ||||
| 2026-02-18 | 13F | State of Tennessee, Treasury Department | 255.923 | 7,40 | 13.812 | 32,11 | ||||
| 2025-11-06 | 13F | CAPROCK Group, Inc. | 0 | -100,00 | 0 | |||||
| 2026-02-17 | 13F | Mercer Global Advisors Inc /adv | 5.899 | 2,52 | 283 | 11,90 | ||||
| 2026-02-10 | 13F | Norges Bank | 8.456.934 | 404.880 | ||||||
| 2026-04-10 | 13F | Ipswich Investment Management Co., Inc. | 11.050 | -1,78 | 572 | 6,13 | ||||
| 2026-04-21 | 13F | Foundation Resource Management Inc | 913.219 | -0,84 | 47.259 | 7,15 | ||||
| 2026-04-17 | 13F | Vermillion Wealth Management, Inc. | 39 | 2 | ||||||
| 2025-11-13 | 13F | Total Investment Management Inc | 0 | -100,00 | 0 | |||||
| 2026-02-18 | 13F | GWM Advisors LLC | 19.350 | 124,09 | 927 | 144,33 | ||||
| 2026-02-09 | 13F | 44 Wealth Management Llc | 31.488 | 1,32 | 1.508 | 10,56 | ||||
| 2026-02-13 | 13F | BRITISH COLUMBIA INVESTMENT MANAGEMENT Corp | 1.033.875 | 133,81 | 49.497 | 155,23 | ||||
| 2026-02-05 | 13F | O'Brien Greene & Co. Inc | 16.460 | 0,00 | 788 | 9,14 | ||||
| 2026-02-13 | 13F | Fourth Sail Capital LP | 148.500 | 7.112 | ||||||
| 2026-02-17 | 13F | Temasek Holdings (Private) Ltd | 5.307.384 | 1,09 | 254.171 | 10,31 | ||||
| 2025-11-14 | 13F | Jain Global LLC | 0 | -100,00 | 0 | |||||
| 2026-01-29 | 13F | UBS Group AG | Put | 669.600 | -7,06 | 32.067 | 1,41 | |||
| 2026-02-13 | 13F | Integrated Wealth Concepts LLC | 0 | -100,00 | 0 | |||||
| 2026-02-17 | 13F | Ameriprise Financial Inc | 1.441.091 | 52,81 | 69.030 | 66,77 | ||||
| 2026-04-17 | 13F | PKO Investment Management Joint-Stock Co | 16.182 | -14,49 | 837 | -7,83 | ||||
| 2026-01-29 | 13F | UBS Group AG | Call | 694.300 | 63,98 | 33.250 | 78,93 | |||
| 2026-02-13 | 13F | Ingalls & Snyder Llc | 412.061 | -2,38 | 20 | 5,56 | ||||
| 2026-02-17 | 13F | Polar Asset Management Partners Inc. | Call | 0 | -100,00 | 0 | ||||
| 2026-01-29 | 13F | UBS Group AG | 7.889.173 | 88,54 | 377.812 | 105,72 | ||||
| 2026-02-13 | 13F | Gen-Wealth Partners Inc | 400 | 0,00 | 19 | 11,76 | ||||
| 2026-02-17 | 13F | Polar Asset Management Partners Inc. | 0 | -100,00 | 0 | |||||
| 2026-02-02 | 13F | Danske Bank A/s | 0 | -100,00 | 0 | |||||
| 2026-02-10 | 13F | MidAtlantic Capital Management, Inc. | 403 | 19 | ||||||
| 2026-02-13 | 13F | Clal Insurance Enterprises Holdings Ltd | 289 | -39,79 | 0 | |||||
| 2026-02-13 | 13F | Citigroup Inc | 2.685.967 | 865,91 | 128.758 | 955,39 | ||||
| 2026-02-13 | 13F | Caxton Associates Llp | 2.822.926 | 318,21 | 135.190 | 356,33 | ||||
| 2026-02-13 | 13F | Citigroup Inc | Call | 100.000 | 0,00 | 4.794 | 9,25 | |||
| 2026-02-17 | 13F | Caisse De Depot Et Placement Du Quebec | 657.000 | 8,43 | 31.495 | 18,46 | ||||
| 2026-02-13 | 13F | Estabrook Capital Management | 0 | -100,00 | 0 | |||||
| 2026-02-13 | 13F | MAI Capital Management | 9.001 | 0,06 | 431 | 9,39 | ||||
| 2026-02-17 | 13F | Blackstone Group Inc | 0 | -100,00 | 0 | -100,00 | ||||
| 2026-02-13 | 13F | Quarry LP | 143 | 7 | ||||||
| 2026-01-05 | 13F | Rosenberg Matthew Hamilton | 0 | -100,00 | 0 | |||||
| 2026-02-11 | 13F | Parallel Advisors, LLC | 1.155 | 11,49 | 55 | 22,22 | ||||
| 2026-02-17 | 13F | Anson Funds Management LP | Put | 0 | -100,00 | 0 | ||||
| 2025-11-14 | 13F | Susquehanna Portfolio Strategies, LLC | 0 | -100,00 | 0 | -100,00 | ||||
| 2026-01-21 | 13F | Westfuller Advisors, LLC | 11 | 0,00 | 1 | |||||
| 2026-01-27 | 13F | TD Waterhouse Canada Inc. | 1.858.869 | -5,30 | 88.850 | 2,90 | ||||
| 2026-02-10 | 13F | Hillsdale Investment Management Inc. | 700 | 0,00 | 34 | 10,00 | ||||
| 2026-02-12 | 13F | Northwest & Ethical Investments L.P. | Put | 0 | -100,00 | 0 | ||||
| 2026-04-20 | 13F | Kestra Private Wealth Services, Llc | 7.689 | -45,02 | 398 | -40,66 | ||||
| 2026-04-09 | 13F | Park Place Capital Corp | 68 | 0,00 | 4 | 0,00 | ||||
| 2026-02-17 | 13F | Snowden Capital Advisors LLC | 4.835 | 232 | ||||||
| 2026-04-20 | 13F | Jfs Wealth Advisors, Llc | 118 | -7,81 | 6 | 0,00 | ||||
| 2025-11-14 | 13F | SummitTX Capital, L.P. | 0 | -100,00 | 0 | |||||
| 2026-02-11 | 13F | RWC Asset Management LLP | 213.497 | -37,55 | 10.224 | -31,86 | ||||
| 2026-01-16 | 13F | Empirical Financial Services, LLC d.b.a. Empirical Wealth Management | 6.950 | 0,00 | 333 | 8,85 | ||||
| 2026-02-17 | 13F | Yaupon Capital Management LP | 360.905 | 17.284 | ||||||
| 2025-10-29 | 13F | Dynasty Wealth Management, Llc | 0 | -100,00 | 0 | |||||
| 2026-02-10 | 13F/A | Northwestern Mutual Wealth Management Co | 7.314 | -1,55 | 350 | 7,36 | ||||
| 2026-02-13 | 13F | Walleye Trading LLC | Call | 1.373.900 | 2,59 | 65.796 | 11,94 | |||
| 2026-02-09 | 13F | MSH Capital Advisors LLC | 5.270 | 0,00 | 252 | 9,09 | ||||
| 2026-02-13 | 13F | Silicon Valley Capital Partners | 235 | 0,00 | 11 | 10,00 | ||||
| 2025-11-14 | 13F | Ripple Effect Asset Management LP | 0 | -100,00 | 0 | |||||
| 2026-02-03 | 13F | Strengthening Families & Communities, LLC | 0 | -100,00 | 0 | |||||
| 2026-02-13 | 13F | Walleye Trading LLC | Put | 840.200 | -15,78 | 40.237 | -8,10 | |||
| 2026-02-17 | 13F | Covalis Capital Llp | 160.321 | 7.678 | ||||||
| 2025-11-14 | 13F | Ripple Effect Asset Management LP | Put | 0 | -100,00 | 0 | ||||
| 2026-02-13 | 13F | Walleye Capital LLC | Put | 11.900 | -73,50 | 570 | -71,12 | |||
| 2026-04-22 | 13F | Louisbourg Investments Inc. | 175.850 | 10,28 | 9.096 | 18,97 | ||||
| 2026-02-13 | 13F | Walleye Capital LLC | 75 | -95,08 | 4 | -95,45 | ||||
| 2026-02-13 | 13F | Walleye Capital LLC | Call | 22.600 | -20,14 | 1.082 | -12,88 | |||
| 2026-02-13 | 13F | Pathstone Holdings, LLC | 12.729 | 6,39 | 610 | 16,00 | ||||
| 2026-02-11 | 13F | Jpmorgan Chase & Co | Call | 86.400 | 11,34 | 4.138 | 21,50 | |||
| 2026-02-11 | 13F | Jpmorgan Chase & Co | Put | 24.400 | -80,39 | 1.169 | -78,60 | |||
| 2026-02-11 | 13F | Jpmorgan Chase & Co | 4.773.981 | 121,78 | 228.626 | 142,00 | ||||
| 2026-02-17 | 13F | Corsair Capital Management, L.p. | 10.489 | -0,03 | 502 | 9,13 | ||||
| 2026-02-17 | 13F | Maryland State Retirement & Pension System | 86.331 | 2,25 | 4.141 | 11,83 | ||||
| 2026-02-13 | 13F | Police & Firemen's Retirement System of New Jersey | 62.617 | -7,98 | 3.002 | 0,54 | ||||
| 2026-02-03 | 13F | Anfield Capital Management, LLC | 1 | -50,00 | 0 | |||||
| 2026-02-02 | 13F | Robertson Stephens Wealth Management, LLC | 12.637 | 8,59 | 605 | 18,63 | ||||
| 2026-02-09 | 13F | Huntington National Bank | 1 | 0,00 | 0 | |||||
| 2025-11-13 | 13F | Moerus Capital Management LLC | 0 | -100,00 | 0 | -100,00 | ||||
| 2026-02-17 | 13F | Holocene Advisors, LP | 990.694 | 47.444 | ||||||
| 2026-04-21 | 13F | Welch Group, LLC | 6.266 | 6,22 | 324 | 14,89 | ||||
| 2026-04-22 | 13F | RBA Wealth Management, LLC | 0 | -100,00 | 0 | |||||
| 2025-11-14 | 13F | Aigen Investment Management, Lp | 0 | -100,00 | 0 | |||||
| 2026-02-17 | 13F | Mirabella Financial Services Llp | 42.938 | 9,99 | 2.056 | 20,02 | ||||
| 2026-01-28 | 13F | Kingswood Wealth Advisors, Llc | 0 | -100,00 | 0 | -100,00 | ||||
| 2026-02-17 | 13F | Limestone Investment Advisors LP | Put | 0 | -100,00 | 0 | ||||
| 2026-02-12 | 13F | Insigneo Advisory Services, Llc | 5.065 | -8,84 | 243 | -0,41 | ||||
| 2026-03-16 | 13F/A | Rockefeller Capital Management L.P. | 11.602 | 82,68 | 556 | 99,64 | ||||
| 2025-11-14 | 13F | Ubs Oconnor Llc | 0 | -100,00 | 0 | -100,00 | ||||
| 2026-04-07 | 13F | Farther Finance Advisors, LLC | 6.958 | 8,40 | 370 | 20,52 | ||||
| 2026-02-03 | 13F | Sequoia Financial Advisors, LLC | 13.377 | 7,77 | 641 | 17,65 | ||||
| 2026-01-14 | 13F | Net Worth Advisory Group | 9.126 | -2,28 | 437 | 6,85 | ||||
| 2025-11-14 | 13F | Numerai GP LLC | 0 | -100,00 | 0 | |||||
| 2026-02-17 | 13F | Tower Research Capital LLC (TRC) | 0 | -100,00 | 0 | |||||
| 2026-02-10 | 13F | Measured Wealth Private Client Group, LLC | 196 | 0,00 | 9 | 12,50 | ||||
| 2026-02-12 | 13F | Federated Hermes, Inc. | 56.157 | -41,90 | 2.689 | -36,61 | ||||
| 2026-02-10 | 13F | CIBC World Markets Inc. | 4.043.538 | 20,16 | 193.605 | 31,09 | ||||
| 2025-11-26 | 13F/A | Evelyn Partners Investment Management Services Ltd | 0 | -100,00 | 0 | -100,00 | ||||
| 2026-02-13 | 13F | Pinnacle Wealth Planning Services, Inc. | 478 | 23 | ||||||
| 2026-03-30 | 13F/A | Barclays Plc | Put | 0 | -100,00 | 0 | -100,00 | |||
| 2026-04-13 | 13F | Leibman Financial Services, Inc. | 82.738 | -16,51 | 4.282 | -9,78 | ||||
| 2026-02-10 | 13F | CIBC World Markets Inc. | Call | 50.000 | 2.394 | |||||
| 2026-02-17 | 13F | Cnh Partners Llc | 2.366.021 | 812,98 | 113.309 | 896,20 | ||||
| 2025-11-13 | 13F | Hartree Partners, LP | 0 | -100,00 | 0 | |||||
| 2026-04-20 | 13F | Banque Cantonale Vaudoise | 5.200 | 33,33 | 269 | 43,85 | ||||
| 2026-02-13 | 13F | Rhumbline Advisers | 61 | -14,08 | 3 | -33,33 | ||||
| 2026-02-17 | 13F | Beaconlight Capital, Llc | 191.235 | -18,16 | 9.158 | -10,71 | ||||
| 2026-02-11 | 13F | Signet Private Wealth LLC | 8.785 | 421 | ||||||
| 2026-02-04 | 13F | Ameritas Advisory Services, LLC | 0 | -100,00 | 0 | |||||
| 2026-02-17 | 13F | Maple Rock Capital Partners Inc. | 1.393.516 | -30,97 | 66.735 | -24,68 | ||||
| 2025-11-14 | 13F | Progeny 3, Inc. | 0 | -100,00 | 0 | |||||
| 2026-04-20 | 13F | Assenagon Asset Management S.A. | 13.997 | 23,68 | 722 | 32,78 | ||||
| 2026-02-06 | 13F | Entrust Financial Llc | 216 | 10 | ||||||
| 2025-11-07 | 13F | Shell Asset Management Co | 8.349 | -33,99 | 0 | |||||
| 2026-02-19 | 13F | Invesco Ltd. | 5.618.309 | -0,73 | 269.061 | 8,32 | ||||
| 2026-02-13 | 13F | Stifel Financial Corp | 192.407 | 0,30 | 9.214 | 9,44 | ||||
| 2026-02-12 | 13F | APG Asset Management N.V. | 241.383 | -7,31 | 9.852 | 1,32 | ||||
| 2026-02-11 | 13F | LPL Financial LLC | 135.706 | 31,88 | 6.499 | 43,89 | ||||
| 2025-11-13 | 13F | Twin Tree Management, LP | Put | 0 | -100,00 | 0 | -100,00 | |||
| 2025-11-13 | 13F | Twin Tree Management, LP | Call | 0 | -100,00 | 0 | -100,00 | |||
| 2026-02-02 | 13F | Intact Investment Management Inc. | 13.800 | -79,95 | 661 | -78,15 | ||||
| 2026-02-12 | 13F | UniSuper Management Pty Ltd | 8.100 | 0,00 | 532 | 7,69 | ||||
| 2026-04-24 | 13F | Ninety One UK Ltd | 26 | -100,00 | 1 | -100,00 | ||||
| 2026-02-17 | 13F | Fullerton Fund Management Co Ltd | 0 | -100,00 | 0 | |||||
| 2026-02-17 | 13F | Quantitative Investment Management, LLC | 4.282 | -81,50 | 0 | -100,00 | ||||
| 2026-02-12 | 13F | Bank Of Nova Scotia Trust Co | 45.524 | -13,47 | 2.180 | -5,59 | ||||
| 2026-02-19 | 13F | Birchwood Financial Partners, Inc. | 61 | 3 | ||||||
| 2026-04-03 | 13F | Hickory Point Bank & Trust | 600 | 31 | ||||||
| 2026-02-12 | 13F | Robotti Robert | 100.000 | 0,00 | 4.789 | 9,11 | ||||
| 2026-02-17 | 13F | Incision Capital Management LP | 475.000 | 22.748 | ||||||
| 2026-02-13 | 13F | Bornite Capital Management LP | 500.000 | 23.945 | ||||||
| 2026-02-11 | 13F | Tacita Capital Inc | 517 | 3,40 | 25 | 14,29 | ||||
| 2026-02-17 | 13F | Advisor Group Holdings, Inc. | 11.824 | -20,15 | 566 | -4,24 | ||||
| 2026-02-17 | 13F | Cetera Investment Advisers | 65.070 | -2,35 | 3.116 | 6,57 | ||||
| 2026-04-24 | 13F | USS Investment Management Ltd | 11.717 | 0,00 | 606 | 8,21 | ||||
| 2026-01-27 | 13F | Zurcher Kantonalbank (Zurich Cantonalbank) | 173.538 | 1,12 | 8.319 | 10,48 | ||||
| 2026-02-13 | 13F | Wells Fargo & Company/mn | 841.809 | -1,34 | 40.314 | 7,65 | ||||
| 2026-02-10 | 13F | CIBC World Markets Inc. | Put | 0 | -100,00 | 0 | -100,00 | |||
| 2026-02-10 | 13F | One Capital Management, LLC | 7.454 | 357 | ||||||
| 2026-02-13 | 13F | Wells Fargo & Company/mn | Put | 150.100 | -14,08 | 7.188 | -6,25 | |||
| 2026-02-13 | 13F | Mufg Securities (canada), Ltd. | 680.583 | -8,45 | 32.590 | -0,05 | ||||
| 2026-02-13 | 13F | Wells Fargo & Company/mn | Call | 300.200 | 71,84 | 14.377 | 87,50 | |||
| 2026-01-27 | 13F | Evergreen Capital Management Llc | 9.519 | 456 | ||||||
| 2026-02-03 | 13F | K.J. Harrison & Partners Inc | 84.520 | -2,87 | 4.052 | 7,42 | ||||
| 2026-02-03 | 13F | ASR Vermogensbeheer N.V. | 16.721 | 0,00 | 802 | 9,28 | ||||
| 2026-01-15 | 13F | Frank, Rimerman Advisors LLC | 104.726 | -0,00 | 5.015 | 9,12 | ||||
| 2026-02-17 | 13F | Southpoint Capital Advisors LP | 0 | -100,00 | 0 | |||||
| 2026-02-17 | 13F | Gotham Asset Management, LLC | 18.534 | -8,37 | 888 | 0,00 | ||||
| 2026-04-20 | 13F | Cardinal Point Capital Management, ULC | 7.900 | 0,00 | 409 | 7,94 | ||||
| 2026-01-26 | 13F | Asset Dedication, LLC | 86 | 0,00 | 4 | 33,33 | ||||
| 2026-02-13 | 13F | Gemsstock Ltd. | 274.270 | -3,72 | 13.135 | 5,06 | ||||
| 2026-04-13 | 13F | Massmutual Trust Co Fsb/adv | 1.356 | -6,48 | 70 | 1,45 | ||||
| 2026-02-17 | 13F | Adage Capital Partners Gp, L.l.c. | 846.169 | 40.523 | ||||||
| 2025-11-03 | 13F | Stonegate Investment Group, LLC | 11.086 | 101,27 | 487 | 118,92 | ||||
| 2026-02-17 | 13F | Wiley Bros.-aintree Capital, Llc | 26.704 | 25,23 | 1.279 | 35,81 | ||||
| 2026-02-17 | 13F | Balyasny Asset Management Llc | Put | 0 | -100,00 | 0 |