Grundlæggende statistik
| Institutionelle aktier (lange) | 250.339.528 - 59,34% (ex 13D/G) - change of -65,48MM shares -20,73% MRQ |
| Institutionel værdi (lang) | $ 10.176.606 USD ($1000) |
Institutionelt ejerskab og aktionærer
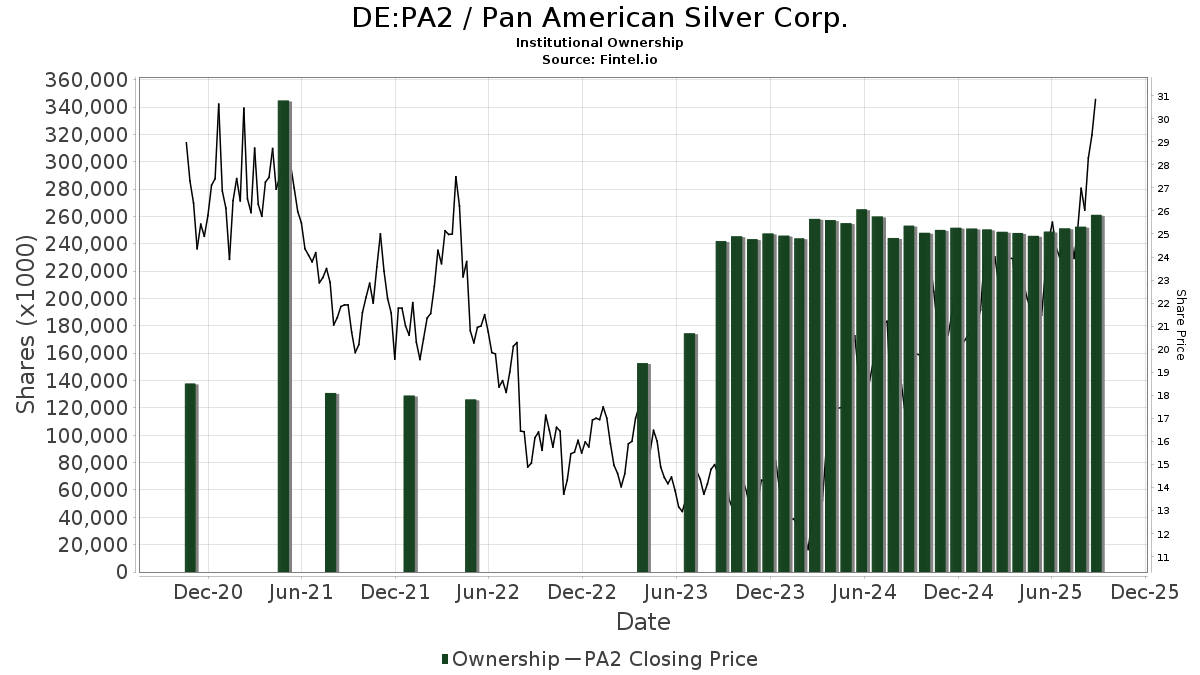
Pan American Silver Corp. (DE:PA2) har 579 institutionelle ejere og aktionærer, der har indsendt 13D/G- eller 13F-formularer til Securities Exchange Commission (SEC). Disse institutioner har i alt 250,339,528 aktier. Største aktionærer omfatter Van Eck Associates Corp, Vanguard Group Inc, MIRAE ASSET GLOBAL ETFS HOLDINGS Ltd., BlackRock, Inc., SIL - Global X Silver Miners ETF, FIL Ltd, Fmr Llc, Invesco Ltd., Norges Bank, and Arrowstreet Capital, Limited Partnership .
Pan American Silver Corp. (DB:PA2) institutionel ejerskabsstruktur viser aktuelle positioner i virksomheden efter institutioner og fonde, samt seneste ændringer i positionsstørrelse. Større aktionærer kan omfatte individuelle investorer, investeringsforeninger, hedgefonde eller institutioner. Skema 13D angiver, at investoren besidder (eller besidder) mere end 5 % af virksomheden og har til hensigt (eller har til hensigt at) aktivt at forfølge en ændring i forretningsstrategi. Skema 13G indikerer en passiv investering på over 5%.
The share price as of March 27, 2026 is 44,93 / share. Previously, on March 31, 2025, the share price was 23,75 / share. This represents an increase of 89,18% over that period.
Fondens stemningsscore
Fund Sentiment Score (fka Ownership Accumulation Score) finder de aktier, der bliver mest købt af fonde. Det er resultatet af en sofistikeret, multi-faktor kvantitativ model, der identificerer virksomheder med de højeste niveauer af institutionel akkumulering. Scoringsmodellen bruger en kombination af den samlede stigning i oplyste ejere, ændringerne i porteføljeallokeringer i disse ejere og andre målinger. Tallet går fra 0 til 100, hvor højere tal indikerer et højere niveau af akkumulering for sine jævnaldrende, og 50 er gennemsnittet.
Opdateringsfrekvens: Dagligt
Se Ownership Explorer, som giver en liste over højest rangerende virksomheder.
AI+ Ask Fintel’s AI assistant about Pan American Silver Corp..
Select a question to share a public post with an AI-crafted answer.
Thinking of good questions…
13F og NPORT arkivering
Detaljer om 13F-arkivering er gratis. Detaljer om NP-ansøgninger kræver et premium-medlemskab. Grønne rækker angiver nye positioner. Røde rækker angiver lukkede positioner. Klik på linket ikon for at se den fulde transaktionshistorik.
Opgrader
for at låse premium-data op og eksportere til Excel ![]() .
.
Important Note
In an effort to reduce load times for our mobile users, we are testing some ways to deliver lighter pages.
In this first test, we will deliver only the most recent 750 transactions (out of 754 for this stock). If you are interested in loading *all* the transactions for this company, click the "load all" button below. This is just a test and if you don't like it, please let us know by submitting some gentle feedback via the link at the bottom of this page.
Load All| Fil dato | Kilde | Investor | Type | Gennemsnitlig pris (Øst) |
Aktier | Δ Aktier (%) |
Rapporteret Værdi ($1000) |
Δ Værdi (%) |
Port Alloc (%) |
|
|---|---|---|---|---|---|---|---|---|---|---|
| 2026-01-28 | 13F | DekaBank Deutsche Girozentrale | 215.636 | 0,00 | 5 | -50,00 | ||||
| 2026-02-12 | 13F | Sprott Inc. | 781.084 | -47,68 | 40.469 | -30,01 | ||||
| 2026-02-12 | 13F | Wedbush Securities Inc | 4.415 | 0 | ||||||
| 2026-01-21 | 13F | Stock Yards Bank & Trust Co | 9.142 | 1,58 | 474 | 35,92 | ||||
| 2026-02-12 | 13F | Bank Of Montreal /can/ | Call | 0 | -100,00 | 0 | -100,00 | |||
| 2026-02-11 | 13F | Twin Tree Management, LP | Call | 271.800 | -41,51 | 14.082 | -21,76 | |||
| 2026-02-11 | 13F | Twin Tree Management, LP | Put | 439.900 | -60,64 | 22.791 | -47,35 | |||
| 2026-02-11 | 13F | Twin Tree Management, LP | 280.215 | 61,15 | 14.518 | 115,58 | ||||
| 2026-01-22 | 13F | V-Square Quantitative Management LLC | 5.653 | 293 | ||||||
| 2026-02-12 | 13F | DJE Kapital AG | 148.802 | 0,00 | 7.814 | 89,02 | ||||
| 2026-02-12 | 13F | Intesa Sanpaolo Wealth Management | 15.288 | 794 | ||||||
| 2026-02-13 | 13F | MAI Capital Management | 2.431 | 0,00 | 126 | 32,98 | ||||
| 2026-02-19 | 13F | Invesco Ltd. | 5.989.873 | -39,49 | 310.335 | -19,05 | ||||
| 2026-01-16 | 13F | Genesis Financial Group, LLC | 12.132 | 629 | ||||||
| 2026-02-17 | 13F | XTX Topco Ltd | 0 | -100,00 | 0 | |||||
| 2026-01-26 | 13F | Cwm, Llc | 6.317 | -5,97 | 0 | |||||
| 2026-02-17 | 13F | Cresset Asset Management, LLC | 24.285 | -0,44 | 1.258 | 33,26 | ||||
| 2026-02-17 | 13F | SIG North Trading, ULC | Put | 75.800 | -40,17 | 3.927 | -19,97 | |||
| 2026-02-17 | 13F | SIG North Trading, ULC | Call | 317.900 | 75,34 | 16.470 | 134,58 | |||
| 2026-02-11 | 13F | J.w. Cole Advisors, Inc. | 7.346 | 28,11 | 381 | 71,17 | ||||
| 2026-02-13 | 13F | Mariner, LLC | 46.515 | 14,52 | 2.411 | 53,27 | ||||
| 2026-02-17 | 13F | Advisory Services Network, LLC | 5.664 | -52,53 | 293 | -36,58 | ||||
| 2026-01-23 | 13F | Westside Investment Management, Inc. | 614 | 0,00 | 32 | 34,78 | ||||
| 2026-02-13 | 13F | USS Investment Management Ltd | 106.921 | -0,29 | 5.543 | 33,64 | ||||
| 2026-02-17 | 13F | SIG North Trading, ULC | 220.295 | 196,95 | 11.413 | 297,25 | ||||
| 2026-02-17 | 13F | Lombard Odier Asset Management (Europe) Ltd | 237.693 | -70,49 | 12.315 | -26,43 | ||||
| 2026-02-10 | 13F | Essex Financial Services, Inc. | 5.255 | -7,06 | 272 | 24,77 | ||||
| 2026-02-13 | 13F | FORA Capital, LLC | 38.440 | 201,56 | 1.992 | 303,85 | ||||
| 2026-02-13 | 13F | Golden State Wealth Management, LLC | 820 | 173,33 | 42 | 281,82 | ||||
| 2026-01-09 | 13F | Post Resch Tallon Group Inc. | 4.200 | 218 | ||||||
| 2026-01-22 | 13F | Financial Consulate, Inc | 300 | 500,00 | 16 | 1.400,00 | ||||
| 2026-02-06 | 13F | BOK Financial Private Wealth, Inc. | 1.658 | 86 | ||||||
| 2025-11-14 | 13F | Bnp Paribas | 0 | -100,00 | 0 | |||||
| 2026-02-03 | 13F | Cheviot Value Management, LLC | 142.308 | -20,90 | 9.381 | 47,95 | ||||
| 2026-02-09 | 13F | Wellington Shields Capital Management, LLC | 5.000 | 259 | ||||||
| 2026-02-06 | 13F | Kingdom Financial Group LLC. | 159 | 8 | ||||||
| 2026-02-06 | 13F | Gsa Capital Partners Llp | 0 | -100,00 | 0 | |||||
| 2025-11-14 | 13F | D. E. Shaw & Co., Inc. | Put | 0 | -100,00 | 0 | -100,00 | |||
| 2026-02-13 | 13F | Ieq Capital, Llc | 11.329 | 2,34 | 587 | 36,92 | ||||
| 2026-01-29 | 13F | Beirne Wealth Consulting Services, LLC | 52.182 | 0,08 | 2.704 | 33,88 | ||||
| 2026-01-22 | 13F | True North Advisors, LLC | 15.980 | 0,00 | 828 | 33,82 | ||||
| 2026-01-14 | 13F | Generali Investments CEE, investicni spolecnost, a.s. | 14.777 | 0,00 | 766 | 33,74 | ||||
| 2026-02-10 | 13F | Bruce G. Allen Investments, LLC | 35 | -67,59 | 2 | -75,00 | ||||
| 2026-01-27 | 13F | GHP Investment Advisors, Inc. | 559 | 0,00 | 29 | 33,33 | ||||
| 2026-02-17 | 13F | Dv Equities, Llc | 432 | 22 | ||||||
| 2026-01-22 | 13F | Maseco Llp | 63 | 3 | ||||||
| 2026-02-13 | 13F | Centiva Capital, LP | Put | 140.600 | 7.284 | |||||
| 2025-09-29 | NP | SIL - Global X Silver Miners ETF This fund is a listed as child fund of Mirae Asset Global Investments Co., Ltd. and if that institution has disclosed ownership in this security, then these positions will not be double counted when calculating total shares and total value | 9.661.183 | 15,63 | 261.045 | 24,08 | ||||
| 2026-02-10 | 13F/A | Northwestern Mutual Wealth Management Co | 704 | -77,30 | 36 | -70,00 | ||||
| 2026-02-13 | 13F | Wexford Capital Lp | 4.896 | 10,89 | 254 | 48,82 | ||||
| 2026-02-17 | 13F | Shaolin Capital Management LLC | Put | 1.000.000 | 300,00 | 51.810 | 435,12 | |||
| 2026-02-13 | 13F | Centiva Capital, LP | 27.536 | 4,08 | 1.427 | 39,26 | ||||
| 2026-02-17 | 13F | State Of Wisconsin Investment Board | 169.775 | 8.814 | ||||||
| 2026-01-23 | 13F | LOM Asset Management Ltd | 1.438 | 102 | ||||||
| 2025-10-08 | 13F | Sheets Smith Investment Management | 58.932 | -0,04 | 2.282 | 36,32 | ||||
| 2026-02-02 | 13F | Miracle Mile Advisors, LLC | 6.296 | 0,18 | 326 | 34,16 | ||||
| 2026-02-05 | 13F | Gamco Investors, Inc. Et Al | 36.940 | 1,65 | 1.914 | 35,96 | ||||
| 2026-02-13 | 13F | Cornerstone Financial Management LLC | 15 | 1 | ||||||
| 2026-02-11 | 13F | Comprehensive Financial Planning, Inc./PA | 1.336 | 0,00 | 69 | 35,29 | ||||
| 2025-10-31 | 13F | PFG Investments, LLC | 0 | -100,00 | 0 | |||||
| 2026-01-30 | 13F | Delta Investment Management, LLC | 54.707 | 2.834 | ||||||
| 2026-01-28 | 13F | Geneos Wealth Management Inc. | 6.593 | 1.032,82 | 342 | 1.450,00 | ||||
| 2026-02-10 | 13F | Acadian Asset Management Llc | 220.588 | -32,33 | 11 | -8,33 | ||||
| 2026-02-03 | 13F | We Are One Seven, LLC | 4.541 | 235 | ||||||
| 2025-11-14 | 13F | Worldquant Millennium Advisors Llc | 0 | -100,00 | 0 | |||||
| 2026-02-06 | 13F | Harvest Portfolios Group Inc. | 44.087 | 21,65 | 2.286 | 62,75 | ||||
| 2026-01-22 | 13F | Bfsg, Llc | 116.508 | -1,97 | 6.036 | 31,16 | ||||
| 2026-02-13 | 13F | Walleye Trading LLC | 103.226 | 36,57 | 5.348 | 82,71 | ||||
| 2026-02-11 | 13F | Capital Analysts, Inc. | 148 | 0,00 | 0 | |||||
| 2026-02-13 | 13F | Walleye Trading LLC | Put | 347.500 | 17,84 | 18.004 | 57,63 | |||
| 2026-02-13 | 13F | Walleye Trading LLC | Call | 511.400 | 16,84 | 26.496 | 56,29 | |||
| 2026-02-13 | 13F | Aviso Financial Inc. | 0 | -100,00 | 0 | |||||
| 2026-02-13 | 13F | Panagora Asset Management Inc | 289.839 | 15.017 | ||||||
| 2026-01-28 | 13F | Retirement Planning Co of New England, Inc. | 21.351 | -4,44 | 1.106 | 27,86 | ||||
| 2026-02-17 | 13F | Public Employees Retirement System Of Ohio | 66.305 | -33,81 | 3.438 | -11,44 | ||||
| 2026-02-12 | 13F | Cibc World Markets Corp | Call | 25.000 | -87,46 | 1.295 | -77,13 | |||
| 2026-02-17 | 13F | Knoll Capital Management, LLC | 100.035 | 0,00 | 5.183 | 33,76 | ||||
| 2025-10-20 | 13F | CenterStar Asset Management, LLC | Call | 0 | -100,00 | 0 | ||||
| 2026-02-04 | 13F | Asahi Life Asset Management Co., Ltd. | 5.335 | 277 | ||||||
| 2026-02-11 | 13F | Capital International Investors | 4.159.115 | 215.484 | ||||||
| 2026-01-14 | 13F | Jfs Wealth Advisors, Llc | 142 | 0,00 | 7 | 40,00 | ||||
| 2026-02-05 | 13F | Bank Julius Baer & Co. Ltd, Zurich | 2.167 | -12,94 | 112 | 16,67 | ||||
| 2025-11-06 | 13F | Claudia M.p. Batlle, Crp (r) Llc | 0 | -100,00 | 0 | |||||
| 2026-02-17 | 13F | Fearnley Asset Management As | 5.718 | 3.259 | ||||||
| 2026-02-18 | 13F | Beacon Pointe Advisors, LLC | 92.761 | -11,16 | 4.806 | 18,85 | ||||
| 2026-01-30 | 13F | Mitsubishi UFJ Trust & Banking Corp | 19.100 | -60,94 | 978 | -48,36 | ||||
| 2026-02-13 | 13F | De Lisle Partners LLP | 57.764 | -10,81 | 2.992 | 19,35 | ||||
| 2026-02-18 | 13F | Beacon Pointe Advisors, LLC | Call | 17.700 | 0,00 | 917 | 33,87 | |||
| 2025-11-07 | 13F | Wealthcare Advisory Partners LLC | 0 | -100,00 | 0 | |||||
| 2026-01-29 | 13F | UBS Group AG | 1.065.578 | -55,33 | 55.208 | -40,25 | ||||
| 2026-01-15 | 13F | Allspring Global Investments Holdings, LLC | 747.727 | 0,00 | 38.747 | 33,79 | ||||
| 2025-11-14 | 13F | Maverick Capital Ltd | 0 | -100,00 | 0 | |||||
| 2026-01-20 | 13F | Cromwell Holdings LLC | 2.343 | 0,00 | 121 | 34,44 | ||||
| 2026-02-06 | 13F | EverSource Wealth Advisors, LLC | 842 | -18,09 | 44 | 10,26 | ||||
| 2026-02-17 | 13F/A | United Capital Management of KS, Inc. | 40.629 | 2.105 | ||||||
| 2026-02-05 | 13F | Freemont Management S.A. | 12.500 | 197,62 | 648 | 299,38 | ||||
| 2025-10-27 | 13F | Kiker Wealth Management, LLC | 0 | -100,00 | 0 | |||||
| 2026-02-17 | 13F | J. Goldman & Co LP | Call | 5.000 | 259 | |||||
| 2026-02-17 | 13F/A | Sentinus, LLC | 4.829 | 250 | ||||||
| 2026-01-05 | 13F | Burkett Financial Services, Llc | 416 | 22 | ||||||
| 2026-02-17 | 13F | Wealth Watch Advisors, INC | 0 | -100,00 | 0 | |||||
| 2026-01-05 | 13F | Rosenberg Matthew Hamilton | 475 | 0,00 | 25 | 33,33 | ||||
| 2026-02-06 | 13F | Cadence Wealth Management LLC | 28.774 | -4,82 | 1.491 | 27,35 | ||||
| 2026-01-14 | 13F | Wolff Wiese Magana Llc | 300 | 16 | ||||||
| 2026-02-11 | 13F | Allianz Asset Management GmbH | 494.973 | 365,27 | 25.695 | 523,21 | ||||
| 2026-02-02 | 13F | Montag A & Associates Inc | 600 | 0,00 | 31 | 34,78 | ||||
| 2026-02-17 | 13F | Boothbay Fund Management, Llc | 12.160 | 103,21 | 630 | 172,73 | ||||
| 2026-02-13 | 13F | Transamerica Financial Advisors, Inc. | 41 | 2 | ||||||
| 2025-11-14 | 13F | Mount Yale Investment Advisors, LLC | 0 | -100,00 | 0 | |||||
| 2026-01-30 | 13F | North Star Investment Management Corp. | 3.200 | 0,00 | 166 | 34,15 | ||||
| 2026-02-05 | 13F | Qsemble Capital Management, LP | 0 | -100,00 | 0 | |||||
| 2026-01-22 | 13F | Vision Financial Markets Llc | 47 | 0,00 | 2 | 100,00 | ||||
| 2026-01-30 | 13F | American Capital Advisory, LLC | 30.764 | 1,56 | 1.594 | 35,81 | ||||
| 2026-02-19 | 13F | Atomi Financial Group, Inc. | 16.776 | 26,96 | 869 | 70,06 | ||||
| 2026-01-26 | 13F | Old Point Trust & Financial Services N A | 21.000 | 0,00 | 1.088 | 33,83 | ||||
| 2026-02-12 | 13F | Voya Investment Management Llc | 6.653 | -31,86 | 345 | -8,73 | ||||
| 2026-02-04 | 13F | Plato Investment Management Ltd | 0 | -100,00 | 0 | |||||
| 2026-02-12 | 13F | Quadrant Capital Group Llc | 849 | 0,00 | 44 | 34,38 | ||||
| 2026-02-13 | 13F | Public Sector Pension Investment Board | 0 | -100,00 | 0 | |||||
| 2026-02-13 | 13F | Aigen Investment Management, Lp | 0 | -100,00 | 0 | |||||
| 2026-02-05 | 13F | Abacus Wealth Partners, LLC | 4.815 | 249 | ||||||
| 2026-02-09 | 13F | Huntington National Bank | 1.498 | 0,00 | 78 | 32,76 | ||||
| 2026-02-17 | 13F | Cetera Investment Advisers | 217.390 | -16,94 | 11.263 | 11,12 | ||||
| 2026-01-14 | 13F | Clarius Group, LLC | 6.463 | 0,00 | 335 | 33,60 | ||||
| 2026-02-02 | 13F | Triasima Portfolio Management inc. | 252.950 | 4,52 | 13.131 | 40,00 | ||||
| 2026-02-17 | 13F | Spears Abacus Advisors LLC | 150.836 | 0,00 | 7.815 | 33,78 | ||||
| 2025-11-21 | 13F/A | CIBC Bancorp USA Inc. | Call | 164.400 | 6.367 | |||||
| 2026-02-13 | 13F | Rhumbline Advisers | 2.615 | -37,75 | 135 | -16,67 | ||||
| 2026-02-17 | 13F | Citadel Advisors Llc | Put | 1.485.456 | 23,54 | 76.961 | 65,27 | |||
| 2026-02-06 | 13F/A | Rathbone Brothers plc | 62.578 | -6,75 | 3.243 | 24,78 | ||||
| 2026-02-10 | 13F | Verus Capital Partners, Llc | 11.082 | 3,53 | 574 | 38,65 | ||||
| 2026-01-21 | 13F | Yousif Capital Management, Llc | 4.208 | 247 | ||||||
| 2026-01-27 | 13F | Ninety One UK Ltd | 2.225.237 | 3,25 | 115.290 | 38,12 | ||||
| 2026-02-12 | 13F | North of South Capital LLP | 2.147.562 | -28,42 | 111.265 | -4,24 | ||||
| 2026-02-12 | 13F | Hollencrest Capital Management | 121.233 | -0,33 | 6.281 | 33,35 | ||||
| 2026-02-13 | 13F | Victory Capital Management Inc | 114.409 | 14,74 | 5.928 | 53,51 | ||||
| 2026-01-16 | 13F | Ronald Blue Trust, Inc. | 13.982 | 3,69 | 724 | 38,70 | ||||
| 2026-02-02 | 13F | PKO Investment Management Joint-Stock Co | 230.774 | 63,41 | 11.986 | 118,92 | ||||
| 2026-02-09 | 13F | Royal Palms Capital LLC | 41.880 | 2.170 | ||||||
| 2026-01-30 | 13F | Kohmann Bosshard Financial Services, LLC | 1.500 | 78 | ||||||
| 2025-11-14 | 13F | AXA Investment Managers S.A. | 230.231 | 8.917 | ||||||
| 2026-02-12 | 13F | CoreCommodity Management, LLC | 26.523 | -12,81 | 1.374 | 16,64 | ||||
| 2026-02-11 | 13F | Erste Asset Management GmbH | 37.121 | 1.936 | ||||||
| 2026-01-28 | 13F | Mountain Capital Investment Advisors, Inc | 3.834 | 247 | ||||||
| 2025-11-14 | 13F | Graham Capital Management, L.P. | 0 | -100,00 | 0 | |||||
| 2026-02-13 | 13F | Walleye Capital LLC | 7.836 | -81,91 | 406 | -75,86 | ||||
| 2026-01-28 | 13F | Ruffer LLP | 608.328 | -32,54 | 31.567 | -9,62 | ||||
| 2026-02-11 | 13F | Group One Trading, L.p. | Put | 305.300 | 3,84 | 15.818 | 38,92 | |||
| 2026-02-13 | 13F | Natixis | 7.913 | -1,60 | 410 | 31,51 | ||||
| 2026-02-11 | 13F | Group One Trading, L.p. | Call | 996.900 | 7,23 | 51.649 | 43,44 | |||
| 2025-09-29 | NP | AIM SECTOR FUNDS (INVESCO SECTOR FUNDS) - Invesco Oppenheimer Gold & Special Minerals Fund Class C | 2.497.405 | 1.180,72 | 67.480 | 1.274,32 | ||||
| 2026-02-11 | 13F | Group One Trading, L.p. | 449.526 | 49,23 | 23.290 | 99,63 | ||||
| 2025-10-23 | 13F | Evolution Wealth Management Inc. | 0 | -100,00 | 0 | |||||
| 2026-02-13 | 13F | Royal London Asset Management Ltd | 20.522 | 4,12 | 1.063 | 39,32 | ||||
| 2026-02-13 | 13F | Walleye Capital LLC | Call | 149.400 | 351,36 | 7.740 | 504,22 | |||
| 2026-02-17 | 13F | Capital Fund Management S.a. | Put | 462.000 | 10,16 | 23.936 | 47,36 | |||
| 2026-02-23 | 13F | Beaird Harris Wealth Management, LLC | 91 | 0,00 | 5 | 33,33 | ||||
| 2026-02-13 | 13F | Walleye Capital LLC | Put | 255.200 | 234,03 | 13.222 | 346,96 | |||
| 2026-02-17 | 13F | Capital Fund Management S.a. | Call | 277.900 | 21,83 | 14.398 | 62,97 | |||
| 2025-11-14 | 13F | Skopos Labs, Inc. | 0 | -100,00 | 0 | |||||
| 2026-02-17 | 13F | Citadel Advisors Llc | Call | 1.435.990 | 16,21 | 74.399 | 55,46 | |||
| 2026-02-17 | 13F | Weiss Asset Management LP | 57.300 | 2.969 | ||||||
| 2026-02-17 | 13F | Citadel Advisors Llc | 1.185.712 | 113,92 | 61.432 | 186,18 | ||||
| 2026-02-13 | 13F | Aptus Capital Advisors, LLC | 6.010 | 311 | ||||||
| 2026-02-13 | 13F | Integrated Wealth Concepts LLC | 4.833 | 250 | ||||||
| 2026-02-17 | 13F | Qube Research & Technologies Ltd | 231.837 | -80,39 | 12.011 | -73,76 | ||||
| 2026-02-12 | 13F | Federation des caisses Desjardins du Quebec | 496.605 | 2,11 | 25.725 | 37,01 | ||||
| 2026-02-17 | 13F | Creative Planning | 47.195 | 4,86 | 2.445 | 40,28 | ||||
| 2026-02-13 | 13F | Vivaldi Capital Management, LLC | 11.186 | 0,00 | 580 | 33,72 | ||||
| 2026-02-13 | 13F | Korea Investment CORP | 478.808 | -34,66 | 24.856 | -12,49 | ||||
| 2026-02-06 | 13F | Creative Financial Designs Inc /adv | 700 | 0,00 | 36 | 33,33 | ||||
| 2026-02-10 | 13F | Crescent Grove Advisors, LLC | 63.704 | 64,69 | 3.301 | 120,29 | ||||
| 2026-02-13 | 13F | SRS Capital Advisors, Inc. | 2.441 | -69,09 | 126 | -58,69 | ||||
| 2026-02-13 | 13F | Colony Group, LLC | 17.968 | 51,39 | 931 | 102,61 | ||||
| 2026-02-17 | 13F | Sciencast Management LP | 90.018 | 84,17 | 4.664 | 146,33 | ||||
| 2026-02-11 | 13F | Janney Montgomery Scott LLC | 47.680 | 1,55 | 2 | 100,00 | ||||
| 2026-02-12 | 13F | Xponance, Inc. | 15.239 | 791 | ||||||
| 2026-02-17 | 13F | Slate Path Capital LP | 1.334.280 | -58,24 | 69.129 | -44,13 | ||||
| 2026-03-04 | 13F | SHP Wealth Management | 25 | 1 | ||||||
| 2026-02-11 | 13F | Everett Harris & Co /ca/ | 6.450 | 334 | ||||||
| 2026-02-12 | 13F | Hrt Financial Lp | 216.100 | 11 | ||||||
| 2026-01-20 | 13F | Sheets Smith Wealth Management | 24.746 | -0,08 | 1.282 | 33,68 | ||||
| 2026-01-26 | 13F | Dakota Community Bank & Trust NA | 0 | -100,00 | 0 | |||||
| 2026-02-05 | 13F | E Fund Management (Hong Kong) Co., Ltd. | 25.881 | 1.895 | ||||||
| 2026-02-13 | 13F | Flow Traders U.s. Llc | 0 | -100,00 | 0 | |||||
| 2026-02-12 | 13F | Campbell & CO Investment Adviser LLC | 23.061 | -84,81 | 1.195 | -79,69 | ||||
| 2026-02-13 | 13F | Alberta Investment Management Corp | 288.115 | -8,22 | 14.938 | 22,83 | ||||
| 2026-02-17 | 13F | Laird Norton Trust Company, Llc | 6.624 | 343 | ||||||
| 2026-02-17 | 13F | Jump Financial, LLC | 3.867 | 200 | ||||||
| 2026-02-11 | 13F | Parallel Advisors, LLC | 645 | 0,47 | 33 | 37,50 | ||||
| 2026-01-22 | 13F | Lesa Sroufe & Co | 143.075 | -27,15 | 7 | 0,00 | ||||
| 2026-01-29 | 13F | Vanguard Group Inc | 17.465.779 | 1,59 | 905.513 | 35,92 | ||||
| 2026-02-11 | 13F | 111 Capital | 0 | -100,00 | 0 | -100,00 | ||||
| 2025-09-29 | NP | SPWO - SP Funds S&P World (ex-US) ETF | 1.593 | 91,93 | 43 | 115,00 | ||||
| 2026-02-11 | 13F | Metis Global Partners, LLC | 16.646 | 1,46 | 863 | 35,91 | ||||
| 2026-02-05 | 13F | Bessemer Group Inc | 1.000 | 1.392,54 | 0 | |||||
| 2026-01-29 | 13F | Veracity Capital LLC | 9.868 | 1,91 | 511 | 36,27 | ||||
| 2026-02-12 | 13F | Commonwealth Equity Services, Llc | 63.691 | -5,99 | 3.300 | 164.850,00 | ||||
| 2026-02-13 | 13F | National Bank Of Canada /fi/ | Put | 642 | 105,77 | 3.328 | 175,27 | |||
| 2026-02-13 | 13F | Stifel Financial Corp | 159.949 | 23,63 | 8.287 | 65,39 | ||||
| 2026-02-17 | 13F | Optiver Holding B.V. | 0 | -100,00 | 0 | |||||
| 2026-02-17 | 13F | Point72 Asset Management, L.P. | 198.707 | 10.295 | ||||||
| 2026-02-12 | 13F | SWAN Capital LLC | 70 | 27,27 | 4 | 50,00 | ||||
| 2026-02-17 | 13F | Point72 Asset Management, L.P. | Put | 109.600 | 5.678 | |||||
| 2026-01-27 | 13F | Hedges Asset Management LLC | 44.572 | -7,05 | 2.309 | 24,34 | ||||
| 2026-02-13 | 13F | Pathstone Holdings, LLC | 51.616 | -3,62 | 2.674 | 28,93 | ||||
| 2026-02-17 | 13F | Point72 Asset Management, L.P. | Call | 133.200 | 6.901 | |||||
| 2026-02-17 | 13F | Toronto Dominion Bank | 243.812 | 86,81 | 12.641 | 150,00 | ||||
| 2026-02-17 | 13F | Toronto Dominion Bank | Call | 150.000 | 38,25 | 7.777 | 85,01 | |||
| 2026-02-17 | 13F | Capital Fund Management S.a. | 191.672 | 48,84 | 9.931 | 99,12 | ||||
| 2026-02-09 | 13F/A | Fideuram - Intesa Sanpaolo Private Banking S.p.a. | 63.026 | 3.265 | ||||||
| 2026-02-06 | 13F | Profund Advisors Llc | 43.354 | -16,65 | 2.246 | 11,52 | ||||
| 2026-01-16 | 13F | Augustine Asset Management Inc | 4.500 | 233 | ||||||
| 2025-12-08 | 13F/A | Evelyn Partners Investment Management LLP | 0 | -100,00 | 0 | -100,00 | ||||
| 2026-02-12 | 13F | Hohimer Wealth Management, Llc | 0 | -100,00 | 0 | |||||
| 2026-02-11 | 13F | Simplex Trading, Llc | Put | 498.900 | 2,72 | 25.848 | 143.500,00 | |||
| 2026-01-13 | 13F | Bank & Trust Co | 105 | 0,00 | 5 | 25,00 | ||||
| 2026-02-11 | 13F | Simplex Trading, Llc | 87.892 | -57,66 | 4.554 | 56.812,50 | ||||
| 2026-01-08 | 13F | True Wealth Design, LLC | 231 | 0,00 | 12 | 37,50 | ||||
| 2026-02-11 | 13F | Simplex Trading, Llc | Call | 1.042.900 | 27,46 | 54.033 | 174.196,77 | |||
| 2026-02-17 | 13F | Gotham Asset Management, LLC | 189.684 | -18,05 | 9.828 | 9,63 | ||||
| 2025-11-14 | 13F | Jain Global LLC | 0 | -100,00 | 0 | |||||
| 2026-02-17 | 13F | Investment Management Corp of Ontario | 51.767 | 231,35 | 2.682 | 343,31 | ||||
| 2025-11-13 | 13F | Renaissance Technologies Llc | 0 | -100,00 | 0 | |||||
| 2026-02-13 | 13F | Change Path, LLC | 0 | -100,00 | 0 | |||||
| 2026-02-11 | 13F | Cedar Mountain Advisors, LLC | 64 | 0,00 | 3 | 50,00 | ||||
| 2026-02-17 | 13F | DZ BANK AG Deutsche Zentral Genossenschafts Bank, Frankfurt am Main | 1.086.690 | -3,62 | 56.379 | 29,08 | ||||
| 2026-02-10 | 13F | CIBC Asset Management Inc | 483.498 | -2,31 | 25.082 | 30,93 | ||||
| 2025-11-14 | 13F | Evelyn Partners Investment Management (Europe) Ltd | 0 | -100,00 | 0 | -100,00 | ||||
| 2026-02-04 | 13F | Schwartz Investment Counsel Inc | 50.000 | -13,79 | 2.590 | 15,32 | ||||
| 2026-02-24 | 13F | Bell Investment Advisors, Inc | 225 | 268,85 | 12 | 450,00 | ||||
| 2026-02-11 | 13F | Empowered Funds, LLC | 66.400 | 3,63 | 3.440 | 38,65 | ||||
| 2026-02-11 | 13F | Electrum Group Llc | 216.130 | 11.198 | ||||||
| 2026-01-14 | 13F | Eastern Bank | 1.757 | 29,48 | 91 | 75,00 | ||||
| 2026-02-13 | 13F | Morgan Stanley | 2.396.226 | -2,76 | 124.149 | 30,08 | ||||
| 2026-02-17 | 13F | Parallax Volatility Advisers, L.P. | Put | 3.400 | -2,86 | 176 | 30,37 | |||
| 2026-02-24 | 13F | Alternative Investment Advisors, LLC. | 1.200 | 62 | ||||||
| 2026-02-17 | 13F | Advisor Group Holdings, Inc. | 90.439 | -31,29 | 4.686 | 0,13 | ||||
| 2026-02-24 | 13F | Alternative Investment Advisors, LLC. | Call | 14.500 | 751 | |||||
| 2026-02-09 | 13F | Kingsview Wealth Management, LLC | Call | 46.000 | 0,00 | 1.320 | 78,38 | |||
| 2026-02-17 | 13F | Tudor Investment Corp Et Al | Call | 16.600 | 860 | |||||
| 2026-02-17 | 13F | SummitTX Capital, L.P. | 10.134 | 525 | ||||||
| 2026-02-17 | 13F | Susquehanna International Group, Llp | Put | 1.527.800 | -4,88 | 79.155 | 27,24 | |||
| 2026-02-02 | 13F | Danske Bank A/s | Call | 6.000 | 0,00 | 201 | 75,44 | |||
| 2026-02-17 | 13F | Tudor Investment Corp Et Al | Put | 25.100 | 298,41 | 1.300 | 434,98 | |||
| 2026-02-17 | 13F | Susquehanna International Group, Llp | Call | 3.571.200 | 38,20 | 185.024 | 84,87 | |||
| 2026-02-17 | 13F | Tudor Investment Corp Et Al | 38.139 | 1.976 | ||||||
| 2026-01-30 | 13F | Pekin Hardy Strauss, Inc. | 13.322 | 690 | ||||||
| 2026-03-04 | 13F | Leonteq Securities AG | Call | 0 | -100,00 | 0 | ||||
| 2026-02-12 | 13F | Aviva Plc | 350.522 | 20,84 | 18.187 | 61,95 | ||||
| 2026-02-12 | 13F | Barings Llc | 138.681 | -17,53 | 7.185 | 10,33 | ||||
| 2026-02-10 | 13F | Nomura Asset Management Co Ltd | 0 | 0 | ||||||
| 2026-02-17 | 13F | Parallax Volatility Advisers, L.P. | Call | 57.200 | 3.264,71 | 2.964 | 4.458,46 | |||
| 2026-02-17 | 13F | IHT Wealth Management, LLC | 4.043 | 209 | ||||||
| 2026-02-05 | 13F | Allworth Financial LP | 1.005 | 92,90 | 52 | 160,00 | ||||
| 2026-01-20 | 13F | Signaturefd, Llc | 12.724 | 28,84 | 659 | 72,51 | ||||
| 2026-01-21 | 13F | Towarzystwo Funduszy Inwestycyjnych Allianz Polska S.A. | 51.850 | 24,19 | 2.732 | 69,00 | ||||
| 2026-02-02 | 13F | Benjamin Edwards Inc | 46.554 | 513,20 | 2.412 | 720,07 | ||||
| 2026-02-10 | 13F | Jupiter Asset Management Ltd | 2.171.931 | 1,31 | 112.528 | 35,47 | ||||
| 2026-02-13 | 13F | Pinnacle Wealth Planning Services, Inc. | 98 | 5 | ||||||
| 2026-01-23 | 13F | Altfest L J & Co Inc | 18.436 | -57,14 | 955 | -42,64 | ||||
| 2026-02-17 | 13F | Gilder Gagnon Howe & Co Llc | 0 | -100,00 | 0 | |||||
| 2026-01-15 | 13F | SILVER OAK SECURITIES, Inc | 5.680 | 0,00 | 299 | 36,53 | ||||
| 2026-02-09 | 13F | Employees Retirement System of Texas | 26.321 | -40,40 | 1 | 0,00 | ||||
| 2026-02-09 | 13F | Catalyst Funds Management Pty Ltd | 7.900 | 409 | ||||||
| 2026-02-05 | 13F | Td Private Client Wealth Llc | 7 | 0 | ||||||
| 2025-10-15 | 13F | Southland Equity Partners LLC | 0 | -100,00 | 0 | |||||
| 2026-02-02 | 13F | Cornerstone Planning Group LLC | 158 | -63,17 | 10 | 66,67 | ||||
| 2026-02-04 | 13F | Swiss Life Asset Management Ltd | 58.827 | 46,94 | 3.051 | 96,46 | ||||
| 2026-02-12 | 13F | Moneta Group Investment Advisors Llc | 21.097 | -1,49 | 1.093 | 31,85 | ||||
| 2026-02-17 | 13F | Susquehanna International Group, Llp | 1.079.519 | 518,30 | 55.930 | 727,11 | ||||
| 2026-02-04 | 13F | Atlantic Union Bankshares Corp | 0 | -100,00 | 0 | |||||
| 2026-01-15 | 13F | Lodestone Wealth Management LLC | 24 | 1 | ||||||
| 2026-02-10 | 13F | Godfrey Financial Associates, Inc. | 20 | 1 | ||||||
| 2026-02-17 | 13F | DV Trading LLC | 392 | 20 | ||||||
| 2026-02-13 | 13F | Blueshift Asset Management, LLC | 0 | -100,00 | 0 | |||||
| 2026-02-17 | 13F | Tower Research Capital LLC (TRC) | 7.087 | 25.210,71 | 367 | 36.600,00 | ||||
| 2026-02-05 | 13F | Baader Bank INC | 6.795 | -66,58 | 307 | -44,67 | ||||
| 2026-02-10 | 13F | Clear Harbor Asset Management, LLC | 17.850 | 925 | ||||||
| 2026-02-17 | 13F | Schonfeld Strategic Advisors LLC | Call | 100.000 | 5.181 | |||||
| 2026-02-10 | 13F | PCJ Investment Counsel Ltd. | 118.918 | -36,26 | 6.165 | -14,71 | ||||
| 2026-02-17 | 13F | Schonfeld Strategic Advisors LLC | 143.877 | -36,53 | 7.454 | -15,10 | ||||
| 2026-01-30 | 13F | Keating Investment Counselors Inc | 115.291 | 1,12 | 5.973 | 35,29 | ||||
| 2026-02-17 | 13F | Crabel Capital Management, LLC | 0 | -100,00 | 0 | |||||
| 2026-02-17 | 13F | Royal Bank Of Canada | Put | 0 | -100,00 | 0 | ||||
| 2026-01-20 | 13F | Corundum Trust Company, INC | 0 | -100,00 | 0 | -100,00 | ||||
| 2026-02-11 | 13F | Prestige Wealth Management Group LLC | 32 | 2 | ||||||
| 2026-02-12 | 13F | Mark Sheptoff Financial Planning, Llc | 6.055 | 6,87 | 314 | 42,92 | ||||
| 2026-02-12 | 13F | Swiss National Bank | 1.118.602 | -7,85 | 58.113 | 23,48 | ||||
| 2026-02-09 | 13F | Geode Capital Management, Llc | 3.827.024 | 7,06 | 197.498 | 43,50 | ||||
| 2026-02-13 | 13F | Prudential Financial Inc | 9.580 | 2,57 | 497 | 37,29 | ||||
| 2026-02-17 | 13F | Royal Bank Of Canada | 4.231.158 | -16,57 | 219.217 | 11,61 | ||||
| 2026-02-13 | 13F | National Bank Of Canada /fi/ | Call | 499 | 86,89 | 2.587 | 150,10 | |||
| 2026-02-02 | 13F | Danske Bank A/s | 7.124 | 139,46 | 370 | 226,55 | ||||
| 2026-01-13 | 13F | Mather Group, Llc. | 0 | -100,00 | 0 | |||||
| 2025-11-07 | 13F | Zions Bancorporation, National Association /ut/ | 0 | -100,00 | 0 | -100,00 | ||||
| 2026-02-13 | 13F | Bank Of Nova Scotia | 651.192 | 1,56 | 33.759 | 35,85 | ||||
| 2026-01-09 | 13F | SG Americas Securities, LLC | Put | 31.000 | 0 | |||||
| 2026-02-03 | 13F | Ballentine Partners, LLC | 4.166 | 216 | ||||||
| 2026-02-10 | 13F | Bank of New York Mellon Corp | 876.197 | -59,26 | 45.396 | -45,50 | ||||
| 2026-02-12 | 13F | Northwest & Ethical Investments L.P. | 71.536 | 45,32 | 3.709 | 94,44 | ||||
| 2026-01-20 | 13F | Perpetual Ltd | 149.451 | -54,92 | 7.743 | -39,70 | ||||
| 2026-02-17 | 13F | Royal Bank Of Canada | Call | 335.900 | -24,33 | 17.403 | 1,23 | |||
| 2026-01-16 | 13F | Vanguard Capital Wealth Advisors This fund is a listed as child fund of Vanguard Group Inc and if that institution has disclosed ownership in this security, then these positions will not be double counted when calculating total shares and total value | 0 | -100,00 | 0 | |||||
| 2026-01-30 | 13F | Wealth High Governance Capital Ltda | 244.020 | 12.643 | ||||||
| 2026-02-12 | 13F | Mindset Wealth Management, Llc | 9.910 | 513 | ||||||
| 2026-02-17 | 13F | CWM Advisors, LLC | 32 | 2 | ||||||
| 2026-01-23 | 13F | Rsm Us Wealth Management Llc | 15.826 | 32,53 | 834 | 80,30 | ||||
| 2025-11-13 | 13F | Pale Fire Capital SE | 0 | -100,00 | 0 | -100,00 | ||||
| 2026-02-13 | 13F | Dynamic Technology Lab Private Ltd | 0 | -100,00 | 0 | |||||
| 2026-01-22 | 13F | City Holding Co | 500 | 0,00 | 26 | 31,58 | ||||
| 2026-02-04 | 13F | HighPoint Advisor Group LLC | 10.127 | -39,81 | 525 | -19,51 | ||||
| 2026-02-17 | 13F | D. E. Shaw & Co., Inc. | Call | 0 | -100,00 | 0 | ||||
| 2026-02-10 | 13F | Connor, Clark & Lunn Investment Management Ltd. | 3.999.858 | -8,08 | 207.376 | 23,01 | ||||
| 2026-02-12 | 13F | Brown Brothers Harriman & Co | 1.607 | 0,00 | 83 | 33,87 | ||||
| 2026-01-28 | 13F | U S Global Investors Inc | 73.555 | 0,00 | 3.811 | 33,78 | ||||
| 2026-02-11 | 13F | Tradition Wealth Management, LLC | 7.842 | 0,00 | 406 | 33,99 | ||||
| 2026-01-30 | 13F | Ares Financial Consulting, LLC | 38 | 2 | ||||||
| 2026-02-17 | 13F | Wellington Management Group Llp | 83.844 | 17,41 | 4.353 | 57,28 | ||||
| 2026-01-16 | 13F | Formidable Asset Management, LLC | 15.806 | 33,08 | 819 | 78,21 | ||||
| 2026-02-13 | 13F | Candriam Luxembourg S.C.A. | 152.000 | 7.875 | ||||||
| 2026-01-07 | 13F | Massmutual Trust Co Fsb/adv | 3.484 | 46,82 | 181 | 97,80 | ||||
| 2026-01-29 | 13F | Compass Ion Advisors, LLC | 8.696 | 0,17 | 451 | 33,93 | ||||
| 2025-11-14 | 13F | Quantessence Capital LLC | 0 | -100,00 | 0 | |||||
| 2026-02-13 | 13F | OMERS ADMINISTRATION Corp | 0 | -100,00 | 0 | |||||
| 2026-02-13 | 13F | Nfj Investment Group, Llc | 241.052 | -19,90 | 12.489 | 7,15 | ||||
| 2026-02-03 | 13F | International Assets Investment Management, Llc | 9.860 | 5,17 | 511 | 91,73 | ||||
| 2025-11-14 | 13F | Point72 Asia (Singapore) Pte. Ltd. | 0 | -100,00 | 0 | |||||
| 2026-02-11 | 13F | Greykasell Wealth Strategies, Inc. | 350 | 18 | ||||||
| 2026-02-11 | 13F | MCF Advisors LLC | 100 | 0,00 | 5 | 66,67 | ||||
| 2026-02-13 | 13F | Bridgewater Associates, LP | 0 | -100,00 | 0 | |||||
| 2026-02-13 | 13F | Hatch Cove Capital, Llc | 358.000 | 18.548 | ||||||
| 2026-02-17 | 13F | Agf Management Ltd | 818.178 | -12,90 | 42.419 | 16,54 | ||||
| 2025-09-29 | NP | PXF - Invesco FTSE RAFI Developed Markets ex-U.S. ETF This fund is a listed as child fund of Invesco Ltd. and if that institution has disclosed ownership in this security, then these positions will not be double counted when calculating total shares and total value | 8.982 | 96,16 | 243 | 111,30 | ||||
| 2026-01-14 | 13F | Tradewinds Capital Management, LLC | 293 | 104,90 | 15 | 200,00 | ||||
| 2025-09-29 | NP | GLBL - Pacer MSCI World Industry Advantage ETF | 9 | 0 | ||||||
| 2026-02-06 | 13F | Banque Cantonale Vaudoise | 4.523 | 23,55 | 234 | |||||
| 2026-02-18 | 13F | GWM Advisors LLC | 40.947 | 317,32 | 2.121 | 458,16 | ||||
| 2026-02-02 | 13F | Oppenheimer & Co Inc | 301.664 | -5,99 | 15.629 | 25,76 | ||||
| 2026-02-10 | 13F | Td Asset Management Inc | 2.467.918 | 9,61 | 128.117 | 46,81 | ||||
| 2026-02-17 | 13F | Ameriprise Financial Inc | 1.424.411 | -59,60 | 73.882 | -45,93 | ||||
| 2026-01-13 | 13F | Synergy Financial Management, LLC | 0 | -100,00 | 0 | -100,00 | ||||
| 2026-01-14 | 13F | Enclave Advisors LLC | 52.000 | 2.694 | ||||||
| 2026-01-16 | 13F | Trust Co Of Vermont | 930 | 48 | ||||||
| 2026-02-17 | 13F | EFG International AG | 1.039 | 54 | ||||||
| 2026-02-17 | 13F | Moneda S.A. Administradora General de Fondos | 16.093 | 0,00 | 834 | 47,17 | ||||
| 2026-02-17 | 13F | Ninepoint Partners LP | 115.621 | 142,62 | 5.990 | 224,66 | ||||
| 2026-01-29 | 13F | Nbc Securities, Inc. | 365 | 0,00 | 19 | 28,57 | ||||
| 2026-02-17 | 13F | Strive Financial Group ,LLC | 2.804 | 145 | ||||||
| 2026-02-04 | 13F | Rock Point Advisors, LLC | 4.437 | -18,77 | 230 | 8,53 | ||||
| 2026-01-23 | 13F | Legend Financial Advisors, Inc. | 28.623 | -9,76 | 1.483 | 20,68 | ||||
| 2026-01-23 | 13F | Ritholtz Wealth Management | 4.009 | 208 | ||||||
| 2026-02-17 | 13F | Asset One Wealth Management LLC | 66.958 | 3.591 | ||||||
| 2026-02-02 | 13F | Sawyer & Company, Inc | 1.000 | 0,00 | 52 | |||||
| 2026-02-12 | 13F | Rossby Financial, LCC | 16.518 | 0,00 | 856 | 31,94 | ||||
| 2026-02-09 | 13F | Knights of Columbus Asset Advisors LLC | 61.994 | -45,99 | 3.212 | -27,76 | ||||
| 2026-02-04 | 13F | First Eagle Investment Management, LLC | 3.488.959 | -24,06 | 180.889 | 1,62 | ||||
| 2026-01-22 | 13F | Bartlett & Co. Wealth Management Llc | 51 | 0,00 | 3 | 100,00 | ||||
| 2026-02-13 | 13F | Charles Schwab Investment Management Inc | 1.025.886 | 0,23 | 53.257 | 34,25 | ||||
| 2026-02-12 | 13F | Skandinaviska Enskilda Banken AB (publ) | 64.206 | 24,06 | 3.326 | 65,92 | ||||
| 2026-01-08 | 13F | Wealth Enhancement Advisory Services, Llc | 37.638 | -13,36 | 2.089 | 22,24 | ||||
| 2026-01-27 | 13F | Zurcher Kantonalbank (Zurich Cantonalbank) | 224.276 | 5,66 | 11.643 | 41,51 | ||||
| 2026-02-10 | 13F | Eurizon Capital SGR S.p.A. | 53.829 | 2.821 | ||||||
| 2026-02-02 | 13F | Fifth Third Bancorp | 36 | 16,13 | 2 | 0,00 | ||||
| 2026-03-20 | 13F/A | Hsbc Holdings Plc | Put | 27.500 | 1.437 | |||||
| 2026-01-28 | 13F | City State Bank | 1.020 | 0,00 | 53 | 33,33 | ||||
| 2026-02-11 | 13F | Capital International Inc /ca/ | 549.330 | 28.461 | ||||||
| 2026-02-17 | 13F | Mercer Global Advisors Inc /adv | 16.452 | 17,48 | 852 | 57,20 | ||||
| 2026-01-08 | 13F | Versant Capital Management, Inc | 429 | 15,32 | 22 | 57,14 | ||||
| 2026-02-02 | 13F | Hussman Strategic Advisors, Inc. | 24.400 | -20,26 | 1.264 | 6,67 | ||||
| 2026-01-15 | 13F | Hara Capital LLC | 19.065 | -1,04 | 988 | 32,31 | ||||
| 2026-02-13 | 13F | Barclays Plc | Call | 226.700 | 11.745 | |||||
| 2026-02-12 | 13F | Summit Financial, LLC | 0 | -100,00 | 0 | |||||
| 2025-09-29 | NP | KCVIX - Knights of Columbus Large Cap Value Fund I Shares | 70.906 | 1.916 | ||||||
| 2026-02-13 | 13F | Barclays Plc | 293.585 | 377,85 | 15.211 | 1.086,43 | ||||
| 2026-02-13 | 13F | Hurley Capital, LLC | Call | 0 | -100,00 | 0 | ||||
| 2026-02-13 | 13F | Barclays Plc | Put | 330.000 | 17.097 | |||||
| 2026-01-30 | 13F | Rachor Investment Advisory Services, LLC | 2 | 0 | ||||||
| 2026-02-02 | 13F | Horizon Investments, LLC | 7 | 0 | ||||||
| 2026-02-12 | 13F | Advocate Investing Services LLC | 400 | 21 | ||||||
| 2026-02-13 | 13F | Wynnefield Capital Inc | 20.000 | -42,86 | 1.036 | -23,54 | ||||
| 2026-02-17 | 13F | Df Dent & Co Inc | 0 | -100,00 | 0 | |||||
| 2026-01-30 | 13F | Us Bancorp \de\ | 9.538 | 3,38 | 494 | 38,38 | ||||
| 2026-02-17 | 13F | MIRAE ASSET GLOBAL ETFS HOLDINGS Ltd. | 15.860.311 | 9,66 | 821.723 | 46,70 | ||||
| 2026-01-27 | 13F | Fractal Investments LLC | 5.567 | 0,00 | 288 | 33,95 | ||||
| 2026-02-10 | 13F | Close Asset Management Ltd | 1.000 | 0 | ||||||
| 2025-11-10 | 13F | Monaco Asset Management SAM | 0 | -100,00 | 0 | |||||
| 2026-02-02 | 13F | Wolverine Asset Management Llc | 1.492 | 0,00 | 77 | 35,09 | ||||
| 2026-02-05 | 13F | Plancorp, LLC | 41.922 | 0,00 | 2.172 | 33,76 | ||||
| 2026-02-13 | 13F | Ubs Asset Management Americas Inc | 1.113 | 58 | ||||||
| 2026-01-29 | 13F | Sanctuary Advisors, LLC | 34.210 | -36,84 | 1.772 | -15,50 | ||||
| 2026-02-17 | 13F | Westwood Holdings Group Inc | 282.910 | -38,41 | 14.658 | -17,61 | ||||
| 2026-02-12 | 13F | Barometer Capital Management Inc. | 0 | -100,00 | 0 | |||||
| 2026-02-13 | 13F | Financial Sense Advisors, Inc. | 420.736 | -39,69 | 21.798 | -19,32 | ||||
| 2026-02-13 | 13F | Global Strategic Management Inc | 153.984 | 38,04 | 8 | -99,82 | ||||
| 2026-02-13 | 13F | Global Strategic Management Inc | Call | 0 | -100,00 | 0 | -100,00 | |||
| 2026-02-13 | 13F | Arkadios Wealth Advisors | 8.756 | 454 | ||||||
| 2026-02-17 | 13F | Magnetar Financial LLC | 0 | -100,00 | 0 | -100,00 | ||||
| 2026-02-11 | 13F | O'shaughnessy Asset Management, Llc | 6.898 | 19,03 | 357 | 59,38 | ||||
| 2026-02-13 | 13F | State Street Corp | 15.600 | 0,00 | 808 | 33,77 | ||||
| 2026-01-29 | 13F | IMC-Chicago, LLC | 269.223 | 31,32 | 13.948 | 75,67 | ||||
| 2026-02-17 | 13F | Jones Financial Companies Lllp | 15.204 | 111,99 | 788 | 186,18 | ||||
| 2026-01-29 | 13F | IMC-Chicago, LLC | Put | 688.500 | 70,55 | 35.671 | 128,15 | |||
| 2025-11-06 | 13F | CIBC World Markets Inc. | Put | 0 | -100,00 | 0 | -100,00 | |||
| 2026-01-29 | 13F | IMC-Chicago, LLC | Call | 819.800 | 65,92 | 42.474 | 121,95 | |||
| 2026-01-26 | 13F | AE Wealth Management LLC | 4.834 | 250 | ||||||
| 2026-02-13 | 13F | JustInvest LLC | 9.572 | 12,28 | 496 | 50,00 | ||||
| 2026-02-17 | 13F | Private Advisor Group, LLC | 43.045 | 9,18 | 2.230 | 46,13 | ||||
| 2026-02-11 | 13F | CSM Advisors, LLC | 129.400 | -34,90 | 7 | -14,29 | ||||
| 2026-02-17 | 13F | Fmr Llc | 6.858.204 | -5,45 | 355.446 | 26,48 | ||||
| 2026-02-10 | 13F | O'Neil Global Advisors, Inc. | 65.335 | 3.385 | ||||||
| 2026-01-26 | 13F | Fruth Investment Management | 7.500 | 0,00 | 0 | |||||
| 2026-02-12 | 13F | UniSuper Management Pty Ltd | 8.800 | 41,94 | 626 | 87,43 | ||||
| 2026-02-13 | 13F | Mml Investors Services, Llc | 17.244 | 6,94 | 893 | 43,11 | ||||
| 2026-01-29 | 13F | Wealth Alliance Advisory Group, LLC | 6.560 | -0,06 | 340 | 33,46 | ||||
| 2025-11-21 | 13F | Nebula Research & Development LLC | 0 | -100,00 | 0 | |||||
| 2026-02-09 | 13F | Legal & General Group Plc | 2.730.291 | 6,38 | 142.743 | 45,79 | ||||
| 2026-01-12 | 13F | DAVENPORT & Co LLC | 56.528 | -12,45 | 2.929 | 17,12 | ||||
| 2026-02-17 | 13F | Engineers Gate Manager LP | 13.538 | -77,26 | 702 | -69,59 | ||||
| 2026-02-12 | 13F | Ensign Peak Advisors, Inc | 18.000 | 934 | ||||||
| 2026-02-17 | 13F | Parvin Asset Management, LLC | 34.359 | 0,15 | 1.780 | 34,04 | ||||
| 2026-01-13 | 13F | CoreCap Advisors, LLC | 4.535 | 7,87 | 235 | 44,44 | ||||
| 2026-01-27 | 13F | Proffitt & Goodson Inc | 50 | 0,00 | 3 | 100,00 | ||||
| 2025-11-14 | 13F | ExodusPoint Capital Management, LP | 67.316 | 21,14 | 2.607 | 260.600,00 | ||||
| 2026-02-10 | 13F | Norges Bank | 5.858.647 | 303.611 | ||||||
| 2026-01-15 | 13F | Brookstone Capital Management | 4.230 | 219 | ||||||
| 2026-02-13 | 13F | Umb Bank N A/mo | 1.695 | 0,00 | 88 | 33,85 | ||||
| 2026-01-15 | 13F | Nisa Investment Advisors, Llc | 346 | 18 | ||||||
| 2026-01-08 | 13F | Tompkins Financial Corp | 432 | 0,00 | 22 | 37,50 | ||||
| 2026-02-13 | 13F | National Bank Of Canada /fi/ | 785.930 | -44,80 | 40.751 | -25,96 | ||||
| 2026-02-17 | 13F | Angeles Wealth Management, Llc | 9.131 | 0,12 | 473 | 33,99 | ||||
| 2025-11-14 | 13F | Capula Management Ltd | 0 | -100,00 | 0 | |||||
| 2026-02-18 | 13F | State of Tennessee, Treasury Department | 8.000 | 0,00 | 438 | 41,29 | ||||
| 2025-11-14 | 13F | Concentric Capital Strategies, LP | 0 | -100,00 | 0 | |||||
| 2026-01-14 | 13F | Exchange Traded Concepts, Llc | 50 | -31,51 | 3 | 0,00 | ||||
| 2026-02-03 | 13F | Privium Fund Management B.V. | 0 | -100,00 | 0 | |||||
| 2026-02-12 | 13F | Advisors Asset Management, Inc. | 29.974 | -27,65 | 1.553 | -3,24 | ||||
| 2026-02-17 | 13F | Glenmede Trust Co Na | 14.657 | -7,46 | 759 | 85,57 | ||||
| 2026-02-09 | 13F | Themes Management Co LLC | 6.639 | 344 | ||||||
| 2026-01-13 | 13F | Stephens Consulting, LLC | 300 | 16 | ||||||
| 2026-02-17 | 13F | Toronto Dominion Bank | Put | 0 | -100,00 | 0 | ||||
| 2026-01-16 | 13F | Linden Thomas Advisory Services, LLC | 6.507 | 4,20 | 337 | 39,83 | ||||
| 2026-02-12 | 13F | Wealthspire Advisors, LLC | 0 | -100,00 | 0 | |||||
| 2026-02-12 | 13F | Marex Group plc | 6.717 | -79,38 | 348 | -72,42 | ||||
| 2026-01-21 | 13F | Steadtrust LLC | 134.800 | -9,48 | 6.984 | 21,09 | ||||
| 2026-02-17 | 13F | Balyasny Asset Management Llc | Call | 62.500 | -76,54 | 3.238 | -68,61 | |||
| 2026-02-17 | 13F | O'Domhnaill Enterprises, Inc. | 93.599 | 4.849 | ||||||
| 2026-01-23 | 13F | Sumitomo Mitsui Trust Holdings, Inc. | 4.973 | -53,71 | 258 | -38,22 | ||||
| 2026-02-03 | 13F | SBI Securities Co., Ltd. | 5.820 | 66,19 | 302 | 122,96 | ||||
| 2026-02-17 | 13F | Northern Trust Corp | 78.568 | 8,38 | 4.071 | 44,99 | ||||
| 2026-01-22 | 13F | Brookwood Investment Group LLC | 6.666 | -36,22 | 345 | -14,60 | ||||
| 2026-02-17 | 13F | Balyasny Asset Management Llc | Put | 8.400 | -91,44 | 435 | -88,55 | |||
| 2026-02-05 | 13F | Gabelli Funds Llc | 634.700 | -0,42 | 32.884 | 33,21 | ||||
| 2026-02-13 | 13F | Great West Life Assurance Co /can/ | 216.733 | -54,63 | 11 | -38,89 | ||||
| 2026-02-13 | 13F | Squarepoint Ops LLC | Call | 20.900 | 0,48 | 1.083 | 34,41 | |||
| 2026-02-13 | 13F | Squarepoint Ops LLC | Put | 30.500 | 29,24 | 1.580 | 72,87 | |||
| 2026-01-30 | 13F | Wealthfront Advisers Llc | 9.909 | 79,09 | 513 | 139,72 | ||||
| 2026-02-13 | 13F | Squarepoint Ops LLC | 59.163 | 433,34 | 3.065 | 614,45 | ||||
| 2026-02-12 | 13F | Principal Securities, Inc. | 0 | -100,00 | 0 | -100,00 | ||||
| 2026-02-11 | 13F | Harvest Fund Management Co., Ltd | 223 | 0 | ||||||
| 2026-02-23 | 13F | Virtu Financial LLC | 5.608 | -51,63 | 0 | |||||
| 2025-11-14 | 13F | Massar Capital Management, LP | 0 | -100,00 | 0 | -100,00 | ||||
| 2026-02-11 | 13F | Jpmorgan Chase & Co | Put | 7.800 | 13,04 | 404 | 51,31 | |||
| 2026-02-04 | 13F | Oxbow Advisors, LLC | 10.662 | -97,60 | 552 | -96,80 | ||||
| 2026-01-20 | 13F | Trust Co Of Toledo Na /oh/ | 3.800 | 0,00 | 197 | 33,33 | ||||
| 2026-02-10 | 13F | Intech Investment Management Llc | 11.575 | 0,00 | 601 | 33,93 | ||||
| 2026-02-11 | 13F | Jpmorgan Chase & Co | 1.749.012 | 325,26 | 90.616 | 468,87 | ||||
| 2026-02-11 | 13F | Jpmorgan Chase & Co | Call | 64.700 | 43,46 | 3.352 | 91,98 | |||
| 2025-10-21 | 13F | Golden State Equity Partners | 0 | -100,00 | 0 | |||||
| 2026-02-03 | 13F/A | Broadwater Capital Management Llc | 0 | 0 | ||||||
| 2026-01-29 | 13F | Dunhill Financial, LLC | 1.563 | 0,26 | 81 | 33,33 | ||||
| 2026-01-29 | 13F | Ashton Thomas Private Wealth, LLC | 5.755 | -50,57 | 298 | -33,78 | ||||
| 2026-01-20 | 13F | Quintet Private Bank (Europe) S.A. | 591 | 0,00 | 31 | 36,36 | ||||
| 2026-02-03 | 13F | Alta Wealth Advisors LLC | 8.351 | 4,70 | 433 | 40,26 | ||||
| 2026-02-11 | 13F | Franklin Resources Inc | 315.392 | 3,31 | 16.352 | 38,25 | ||||
| 2026-02-02 | 13F | Gibraltar Capital Management, Inc. | 3.905 | 202 | ||||||
| 2026-02-10 | 13F | CIBC World Markets Inc. | 1.175.068 | 3,53 | 60.927 | 38,55 | ||||
| 2026-02-06 | 13F | Bare Financial Services, Inc | 0 | -100,00 | 0 | |||||
| 2026-02-18 | 13F | Mackenzie Financial Corp | 1.777.653 | -7,79 | 93.403 | 25,06 | ||||
| 2026-02-13 | 13F | Wells Fargo & Company/mn | 321.446 | 2,19 | 16.654 | 36,71 | ||||
| 2026-02-09 | 13F | GeoSphere Capital Management | 0 | -100,00 | 0 | |||||
| 2026-02-10 | 13F | Forsta Ap-fonden | 217.500 | -5,27 | 11.291 | 26,88 | ||||
| 2026-01-30 | 13F | Archer Investment Corp | 970 | 0,00 | 50 | 35,14 | ||||
| 2026-02-10 | 13F | David R. Rahn & Associates Inc. | 7.000 | 0,00 | 363 | 33,58 | ||||
| 2026-02-13 | 13F | Wells Fargo & Company/mn | Put | 70.200 | 0,00 | 3.637 | 33,81 | |||
| 2026-03-25 | 13F | McAlvany Wealth Management LLC | 62.547 | 3.241 | ||||||
| 2026-02-18 | 13F | Caitlin John, LLC | 455 | 0,00 | 24 | 35,29 | ||||
| 2026-01-09 | 13F | Assenagon Asset Management S.A. | 11.633 | 604 | ||||||
| 2026-02-09 | 13F | Delta Asset Management Llc/tn | 100 | 0,00 | 5 | 66,67 | ||||
| 2026-01-30 | 13F | Oakworth Capital, Inc. | 100 | 5 | ||||||
| 2026-01-14 | 13F | ORG Partners LLC | 0 | -100,00 | 0 | |||||
| 2026-01-30 | 13F | Laurel Wealth Advisors LLC | 795 | 41 | ||||||
| 2026-02-17 | 13F | VestGen Advisors, LLC | 35.664 | 1.848 | ||||||
| 2026-02-05 | 13F | Cambridge Investment Research Advisors, Inc. | 51.126 | 2,09 | 3 | 100,00 | ||||
| 2026-02-17 | 13F | Two Sigma Advisers, Lp | 398.643 | -0,82 | 20.654 | 32,67 | ||||
| 2026-02-17 | 13F | Caption Management, LLC | Call | 68.400 | 3.544 | |||||
| 2026-02-12 | 13F | Jane Street Group, Llc | 177.634 | -78,88 | 9.203 | -71,75 | ||||
| 2026-02-05 | 13F | Cardinal Point Capital Management, ULC | 24.416 | -9,61 | 1.268 | 21,13 | ||||
| 2026-01-20 | 13F | Stratos Wealth Advisors, LLC | 61.889 | -31,33 | 3.207 | -8,14 | ||||
| 2026-02-10 | 13F | BW Gestao de Investimentos Ltda. | 155.980 | 8.081 | ||||||
| 2026-01-09 | 13F | Pacifica Partners Inc. | 577 | -59,79 | 29 | -48,21 | ||||
| 2026-01-26 | 13F | Abbington Investment Group | 3.879 | 201 | ||||||
| 2026-02-12 | 13F | Tocqueville Asset Management L.p. | 23.721 | 0,00 | 1.229 | 33,77 | ||||
| 2026-02-05 | 13F | Leuthold Group, Llc | 62.115 | -49,23 | 3.218 | -32,08 | ||||
| 2026-01-26 | 13F | La Banque Postale Asset Management SA | 41.078 | -5,49 | 2.128 | 26,44 | ||||
| 2026-02-10 | 13F | Gulf International Bank (UK) Ltd | 21.600 | 0,00 | 1 | 0,00 | ||||
| 2026-02-12 | 13F | Alps Advisors Inc | 262.060 | 45,96 | 13.577 | 95,27 | ||||
| 2026-02-06 | 13F | GPS Wealth Strategies Group, LLC | 0 | -100,00 | 0 | |||||
| 2026-02-13 | 13F | Osmosis Investment Management UK Ltd | 183.479 | 9.524 | ||||||
| 2026-02-04 | 13F | Ameritas Advisory Services, LLC | 0 | -100,00 | 0 | |||||
| 2025-11-07 | 13F | Sierra Ocean, Llc | 0 | -100,00 | 0 | |||||
| 2026-02-17 | 13F | Edmond De Rothschild Holding S.a. | 43.584 | -27,32 | 2.258 | -2,76 | ||||
| 2026-02-17 | 13F | Sandler Capital Management | 0 | -100,00 | 0 | |||||
| 2026-02-13 | 13F | First Long Island Investors, LLC | 7.381 | 0,00 | 382 | 34,04 | ||||
| 2026-02-17 | 13F | Millennium Management Llc | Call | 181.600 | 44,70 | 9.409 | 93,58 | |||
| 2026-02-17 | 13F | Millennium Management Llc | 1.199.441 | -60,82 | 62.143 | -47,59 | ||||
| 2026-02-10 | 13F | Carnegie Lake Advisors LLC | 5.759 | 0,00 | 298 | 33,63 | ||||
| 2026-02-17 | 13F | Millennium Management Llc | Put | 90.300 | 222,50 | 4.678 | 331,55 | |||
| 2026-02-17 | 13F | Janus Henderson Group Plc | 274.802 | -20,29 | 14.241 | 6,68 | ||||
| 2026-02-12 | 13F | Lansforsakringar Fondforvaltning AB (publ) | 107.196 | -0,44 | 5.565 | 33,33 | ||||
| 2026-02-09 | 13F | Coldstream Capital Management Inc | 26.746 | 5,96 | 1.386 | 41,76 | ||||
| 2026-01-16 | 13F | FNY Investment Advisers, LLC | 3.461 | 0 | ||||||
| 2026-02-13 | 13F | Rokos Capital Management LLP | 574.217 | 29.742 | ||||||
| 2026-01-27 | 13F | Bayforest Capital Ltd | 3.709 | -76,13 | 192 | -68,05 | ||||
| 2026-02-03 | 13F | Sequoia Financial Advisors, LLC | 9.788 | 0,50 | 507 | 34,48 | ||||
| 2026-01-29 | 13F | First Interstate Bank | 6.392 | 0,00 | 331 | 34,01 | ||||
| 2026-02-06 | 13F | Leonteq Securities AG | 36.171 | -54,22 | 2.119 | -39,02 | ||||
| 2026-01-23 | 13F | Assetmark, Inc | 964 | -14,23 | 50 | 13,95 | ||||
| 2026-02-11 | 13F | Picton Mahoney Asset Management | 13.309 | -61,15 | 691 | 68.900,00 | ||||
| 2026-01-15 | 13F | J. Safra Sarasin Holding AG | 40.224 | -8,47 | 2.084 | 22,44 | ||||
| 2026-02-13 | 13F | Entropy Technologies, LP | 0 | -100,00 | 0 | |||||
| 2025-11-14 | 13F | Cubist Systematic Strategies, LLC | 0 | -100,00 | 0 | |||||
| 2026-01-27 | 13F | Fiscal Wisdom Wealth Management, LLC | 4.310 | 223 | ||||||
| 2026-02-13 | 13F | Kestra Advisory Services, LLC | 0 | -100,00 | 0 | |||||
| 2025-11-07 | 13F | Shell Asset Management Co | 8.329 | -76,71 | 0 | -100,00 | ||||
| 2026-02-12 | 13F | Jane Street Group, Llc | Put | 738.264 | 19,55 | 38.249 | 59,92 | |||
| 2026-02-17 | 13F | Captrust Financial Advisors | 51.347 | 304,63 | 2.660 | 441,75 | ||||
| 2026-02-12 | 13F | Jane Street Group, Llc | Call | 871.528 | 16,91 | 45.154 | 56,40 | |||
| 2026-02-17 | 13F | Farringdon Capital, Ltd. | 0 | -100,00 | 0 | -100,00 | ||||
| 2025-11-13 | 13F | UBS Group AG | Call | 0 | -100,00 | 0 | -100,00 | |||
| 2026-01-05 | 13F | Park Avenue Securities Llc | 5.264 | -42,44 | 0 | |||||
| 2025-11-14 | 13F | Point72 (DIFC) Ltd | 0 | -100,00 | 0 | |||||
| 2026-02-13 | 13F | PYA Waltman Capital, LLC | 9.372 | -5,92 | 486 | 25,97 | ||||
| 2026-02-13 | 13F | Towarzystwo Funduszy Inwestycyjnych Pzu Sa | 0 | -100,00 | 0 | |||||
| 2026-02-13 | 13F | Pinpoint Asset Management (Singapore) Pte. Ltd. | 0 | -100,00 | 0 | |||||
| 2026-02-17 | 13F | Aqr Capital Management Llc | 649.129 | 1.319,73 | 33.653 | 1.801,30 | ||||
| 2026-01-21 | 13F | Flagship Harbor Advisors, Llc | 1.290 | 67 | ||||||
| 2026-02-12 | 13F | BRYN MAWR TRUST Co | 146 | -3,31 | 8 | 40,00 | ||||
| 2026-02-17 | 13F | D. E. Shaw & Co., Inc. | 423.564 | 39,43 | 21.945 | 86,52 | ||||
| 2026-01-27 | 13F | TD Waterhouse Canada Inc. | 610.203 | 2.665,98 | 31.588 | 3.543,37 | ||||
| 2026-02-02 | 13F | Truist Financial Corp | 51.512 | 1,41 | 2.669 | 35,64 | ||||
| 2026-02-17 | 13F | Pinnacle Financial Partners, Inc. | 4.610 | 239 | ||||||
| 2026-01-27 | 13F | Evergreen Capital Management Llc | 21.736 | -0,37 | 1.126 | 33,41 | ||||
| 2026-01-12 | 13F | CVA Family Office, LLC | 81 | 0,00 | 4 | 33,33 | ||||
| 2026-02-18 | 13F | Grand Central Investment Group | 44.590 | -19,72 | 2.310 | 161,90 | ||||
| 2026-02-13 | 13F | Altrafin AG | 0 | -100,00 | 0 | |||||
| 2026-02-17 | 13F | Blair William & Co/il | 13.786 | -51,39 | 714 | -34,97 | ||||
| 2026-02-17 | 13F | Prelude Capital Management, Llc | 25.859 | -32,14 | 1.340 | -9,22 | ||||
| 2026-02-13 | 13F | Manufacturers Life Insurance Company, The | 0 | -100,00 | 0 | |||||
| 2025-11-13 | 13F | UBS Group AG | Put | 0 | -100,00 | 0 | -100,00 | |||
| 2025-11-12 | 13F | Creekmur Asset Management LLC | 2 | 0,00 | 0 | |||||
| 2026-02-12 | 13F | BlackRock, Inc. | 11.602.435 | 57,81 | 601.122 | 111,11 | ||||
| 2025-11-14 | 13F | RW Investment Management LLC | 6.342 | 246 | ||||||
| 2026-01-29 | 13F | Concord Wealth Partners | 328 | 0,00 | 17 | 41,67 | ||||
| 2026-01-20 | 13F | Cigna Investments Inc /new | 7.613 | 0,00 | 0 | |||||
| 2026-01-30 | 13F | Pvg Asset Management Corp | 9.233 | 478 | ||||||
| 2026-02-12 | 13F | Chilton Capital Management Llc | 5.474 | 0,00 | 284 | 33,49 | ||||
| 2026-01-09 | 13F | SG Americas Securities, LLC | Call | 30.000 | 0 | |||||
| 2026-01-09 | 13F | SG Americas Securities, LLC | 648.374 | 789,30 | 34 | 1.550,00 | ||||
| 2026-02-24 | 13F | Chelsea Counsel Co | 8.755 | 0,00 | 454 | 33,63 | ||||
| 2026-01-14 | 13F | Spire Wealth Management | 19.878 | -1,23 | 1.030 | 32,09 | ||||
| 2026-02-17 | 13F | Two Sigma Investments, Lp | 988.715 | 50,68 | 51.225 | 101,56 | ||||
| 2026-02-13 | 13F | Verition Fund Management LLC | 0 | -100,00 | 0 | |||||
| 2026-02-19 | 13F | TMB Capital Partners, LLC | 4.887 | 253 | ||||||
| 2025-11-13 | 13F | Marshall Wace, Llp | 0 | -100,00 | 0 | |||||
| 2026-02-06 | 13F | Global Retirement Partners, LLC | 4.649 | 365,37 | 241 | 531,58 | ||||
| 2025-11-04 | 13F | State of Wyoming | 0 | -100,00 | 0 | |||||
| 2026-02-17 | 13F | Utah Retirement Systems | 46.542 | 0,00 | 2.416 | 34,00 | ||||
| 2026-02-10 | 13F | Old Peak Finance LLC | 12.644 | 655 | ||||||
| 2026-02-13 | 13F | Fourth Sail Capital LP | 0 | -100,00 | 0 | |||||
| 2026-02-13 | 13F | Van Eck Associates Corp | 39.582.900 | -12,31 | 2.051 | 17,28 | ||||
| 2026-02-13 | 13F | Vontobel Holding Ltd. | 63.806 | -13,84 | 3.306 | 15,24 | ||||
| 2026-01-29 | 13F | Pictet Asset Management Holding SA | 211.920 | 27,25 | 11.002 | 70,45 | ||||
| 2026-02-06 | 13F | Pnc Financial Services Group, Inc. | 24.452 | 4,97 | 1.267 | 40,35 | ||||
| 2026-02-13 | 13F | Peak6 Llc | Put | 62.900 | -72,69 | 3.259 | -63,47 | |||
| 2026-02-13 | 13F | Peak6 Llc | Call | 560.200 | 22,15 | 29.024 | 63,41 | |||
| 2026-02-06 | 13F | Larson Financial Group LLC | 200 | -66,67 | 10 | -56,52 | ||||
| 2026-02-06 | 13F | HighTower Advisors, LLC | 83.482 | -4,49 | 4.325 | 27,77 | ||||
| 2026-01-12 | 13F | Rialto Wealth Management, LLC | 180 | 9 | ||||||
| 2026-02-12 | 13F | StoneX Group Inc. | 38.393 | 27,76 | 1.989 | 71,02 | ||||
| 2026-02-13 | 13F | Boston Partners | 38.725 | -1,93 | 2.006 | 31,20 | ||||
| 2026-01-29 | 13F | Concurrent Investment Advisors, LLC | 20.335 | 130,06 | 1.054 | 207,89 | ||||
| 2026-02-17 | 13F | Credit Agricole S A | 138.150 | 72,99 | 7.158 | 131,39 | ||||
| 2026-02-03 | 13F | RFG Advisory, LLC | 7.540 | -86,06 | 391 | -81,38 | ||||
| 2026-02-17 | 13F | Occudo Quantitative Strategies Lp | 56.070 | 244,88 | 2.905 | 361,69 | ||||
| 2026-02-09 | 13F | Harbour Investments, Inc. | 440 | 26,07 | 23 | 69,23 | ||||
| 2025-09-29 | NP | CFSSX - Column Small Cap Select Fund | 109.287 | 11,89 | 3.707 | 55,63 | ||||
| 2026-02-09 | 13F | MQS Management LLC | 0 | -100,00 | 0 | |||||
| 2026-02-13 | 13F | Citigroup Inc | 132.369 | -79,95 | 6.872 | -73,15 | ||||
| 2026-02-13 | 13F | Citigroup Inc | Call | 100.000 | 5.191 | |||||
| 2026-02-17 | 13F | FIL Ltd | 7.307.777 | 154,69 | 378.872 | 240,75 | ||||
| 2026-01-07 | 13F | Aventura Private Wealth, LLC | 1.131 | 0,00 | 59 | 34,88 | ||||
| 2026-02-12 | 13F | Steward Partners Investment Advisory, Llc | 21.439 | 4,23 | 1.111 | 39,45 | ||||
| 2026-03-09 | 13F | Corecam Pte. Ltd. | Call | 0 | -100,00 | 0 | ||||
| 2025-11-14 | 13F | Strategic Wealth Partners, Ltd. | 305 | 12 | ||||||
| 2026-02-23 | 13F | Mv Capital Management, Inc. | 5 | 0 | ||||||
| 2026-02-13 | 13F | Neuberger Berman Group LLC | 69.752 | -6,56 | 3.620 | 25,17 | ||||
| 2026-02-11 | 13F | Cerity Partners LLC | 10.567 | 80,94 | 547 | 142,04 | ||||
| 2026-02-12 | 13F | Cibc World Markets Corp | 24.250 | 1.256 | ||||||
| 2026-01-06 | 13F | Investors Research Corp | 399 | 0,00 | 21 | 33,33 | ||||
| 2025-09-29 | NP | PDN - Invesco FTSE RAFI Developed Markets ex-U.S. Small-Mid ETF This fund is a listed as child fund of Invesco Ltd. and if that institution has disclosed ownership in this security, then these positions will not be double counted when calculating total shares and total value | 16.904 | -34,29 | 458 | -29,26 | ||||
| 2026-01-12 | 13F | Avanza Fonder AB | 10.477 | 746 | ||||||
| 2026-02-09 | 13F | Waratah Capital Advisors Ltd. | 154.335 | -88,49 | 7.996 | -84,60 | ||||
| 2026-02-13 | 13F | Toroso Investments, LLC | 2.567.025 | 66,86 | 132.998 | 123,22 | ||||
| 2026-01-28 | 13F | N.E.W. Advisory Services LLC | 42 | 133,33 | 2 | |||||
| 2026-01-27 | 13F | Regions Financial Corp | 0 | -100,00 | 0 | |||||
| 2026-02-03 | 13F | Sequoia Financial Advisors, LLC | Call | 0 | -100,00 | 0 | -100,00 | |||
| 2026-01-21 | 13F | Westfuller Advisors, LLC | 5.653 | 0,00 | 293 | 33,94 | ||||
| 2026-02-13 | 13F | Arrowstreet Capital, Limited Partnership | 4.581.099 | -1,96 | 237.372 | 31,16 | ||||
| 2026-02-18 | 13F | Vident Advisory, LLC | 7.512 | -88,92 | 389 | -85,19 | ||||
| 2026-02-14 | 13F | Rockefeller Capital Management L.P. | 193.497 | 5,02 | 10.025 | 40,50 | ||||
| 2026-02-13 | 13F | Toroso Investments, LLC | Call | 17.300 | 130,67 | 896 | 208,97 | |||
| 2026-02-17 | 13F | Balyasny Asset Management Llc | 0 | -100,00 | 0 | |||||
| 2026-02-10 | 13F | Savant Capital, LLC | 9.586 | -6,94 | 497 | 24,62 | ||||
| 2026-02-12 | 13F | Scotia Capital Inc. | 63.494 | 43,65 | 3.287 | 92,84 | ||||
| 2026-02-17 | 13F | Man Group plc | 1.001.833 | -25,89 | 51.905 | -0,87 | ||||
| 2026-01-29 | 13F | St Germain D J Co Inc | 187 | 0,00 | 10 | 28,57 | ||||
| 2025-11-13 | 13F | Glenmede Investment Management, LP | 14.657 | -1,02 | 568 | 35,00 | ||||
| 2026-02-17 | 13F | Stansberry Asset Management, Llc | Call | 0 | -100,00 | 0 | ||||
| 2025-10-31 | 13F | Whittier Trust Co Of Nevada Inc | 0 | -100,00 | 0 | |||||
| 2026-03-06 | 13F | Hsbc Holdings Plc | 195.682 | -41,64 | 10.161 | -21,63 | ||||
| 2026-02-10 | 13F | Moors & Cabot, Inc. | 22.791 | -8,11 | 1.181 | 22,92 | ||||
| 2026-01-21 | 13F | Sowell Financial Services LLC | 29.784 | -5,72 | 1.543 | 26,17 | ||||
| 2026-02-17 | 13F | Lombard Odier Asset Management (Switzerland) SA | 71.525 | -21,78 | 3.708 | 4,69 | ||||
| 2025-09-29 | NP | IDMO - Invesco S&P International Developed Momentum ETF This fund is a listed as child fund of Invesco Ltd. and if that institution has disclosed ownership in this security, then these positions will not be double counted when calculating total shares and total value | 55.779 | 77,87 | 1.510 | 91,62 | ||||
| 2026-01-27 | 13F | Duncker Streett & Co Inc | 613 | 0,00 | 32 | 34,78 | ||||
| 2026-02-17 | 13F | Bank Of America Corp /de/ | 2.586.335 | 14,47 | 133.998 | 53,13 | ||||
| 2026-02-10 | 13F | Goldman Sachs Group Inc | 909.992 | -64,55 | 47.147 | -52,58 | ||||
| 2026-02-12 | 13F | CIBC Private Wealth Group, LLC | 754 | -74,08 | 39 | -65,18 | ||||
| 2026-02-17 | 13F | Stansberry Asset Management, Llc | 36.219 | 1,45 | 1.877 | 35,75 | ||||
| 2026-02-17 | 13F | Russell Investments Group, Ltd. | 349.958 | 40,03 | 18.157 | 87,49 | ||||
| 2025-09-29 | NP | VSCAX - Invesco Small Cap Value Fund Class A | 3.680.793 | 0,00 | 99.455 | 7,31 | ||||
| 2026-01-26 | 13F | BCS Private Wealth Management, Inc. | 10.000 | 518 | ||||||
| 2026-02-06 | 13F | Cumberland Partners Ltd | 8.500 | 6,25 | 441 | 42,72 | ||||
| 2026-02-12 | 13F | Adviser Investments LLC | 14.710 | 0,00 | 762 | 33,92 | ||||
| 2025-11-12 | 13F | HAP Trading, LLC | Call | 19.525 | 249 | |||||
| 2026-02-11 | 13F | LPL Financial LLC | 243.768 | -0,89 | 12.630 | 32,59 | ||||
| 2026-02-12 | 13F | Kovack Advisors, Inc. | 12.033 | 614 | ||||||
| 2026-02-13 | 13F | American Century Companies Inc | 1.572.664 | 2,63 | 81.507 | 37,30 | ||||
| 2025-11-12 | 13F | HAP Trading, LLC | Put | 28.700 | 15 | |||||
| 2026-02-04 | 13F | Independent Advisor Alliance | 4.259 | 221 | ||||||
| 2025-11-12 | 13F | HAP Trading, LLC | 59.644 | 2.310 | ||||||
| 2026-02-13 | 13F | Headlands Technologies LLC | 0 | -100,00 | 0 | |||||
| 2026-02-17 | 13F | Old Mission Capital Llc | 8.093 | 419 | ||||||
| 2026-01-26 | 13F | Main Street Group, LTD | 0 | -100,00 | 0 | |||||
| 2026-02-09 | 13F | Hartland & Co., LLC | 14 | 1 | ||||||
| 2025-11-14 | 13F | Susquehanna Advisors Group, Inc. | 0 | -100,00 | 0 | |||||
| 2026-02-17 | 13F | Driehaus Capital Management Llc | 1.188.932 | -41,28 | 61.599 | -21,45 | ||||
| 2026-02-11 | 13F | Deutsche Bank Ag\ | 1.508.844 | 14,42 | 78.173 | 53,06 | ||||
| 2026-01-27 | 13F | Wealth Enhancement Trust Services, Inc. | 908 | 47 | ||||||
| 2026-02-10 | 13F | Bnp Paribas Arbitrage, Sa | 107.332 | -22,19 | 5.561 | 4,08 | ||||
| 2026-02-06 | 13F | IFP Advisors, Inc | 126 | -61,82 | 7 | -50,00 | ||||
| 2026-01-29 | 13F | D.a. Davidson & Co. | 8.707 | -44,58 | 451 | -25,82 | ||||
| 2026-03-13 | 13F | Fund Advisors of America Inc/FL | 12.644 | 655 | ||||||
| 2026-01-14 | 13F | Stegent Equity Advisors, Inc. | 11.101 | 41,18 | 575 | 89,14 | ||||
| 2026-01-14 | 13F | Elevatus Welath Management | 65.056 | 3.371 | ||||||
| 2026-01-29 | 13F | Lee Danner & Bass Inc | 13.000 | 0,00 | 674 | 33,80 | ||||
| 2026-02-09 | 13F | Royce & Associates Lp | 0 | -100,00 | 0 | |||||
| 2026-02-06 | 13F | Gables Capital Management Inc. | 335 | 17 | ||||||
| 2026-02-12 | 13F | Bank Of Montreal /can/ | Put | 41.700 | 82,10 | 2.162 | 143,63 | |||
| 2026-02-17 | 13F | Two Sigma Securities, Llc | 8.733 | 452 | ||||||
| 2026-02-12 | 13F | Bank Of Montreal /can/ | 2.467.971 | 18,04 | 127.955 | 57,96 | ||||
| 2026-02-17 | 13F | Caisse De Depot Et Placement Du Quebec | 291.000 | 15.107 | ||||||
| 2026-01-22 | 13F | Mh & Associates Securities Management Corp /adv | 93.027 | 4.820 | ||||||
| 2026-02-13 | 13F | Parkside Financial Bank & Trust | 1.220 | 100,00 | 63 | 173,91 | ||||
| 2026-02-03 | 13F | Generali Asset Management SPA SGR | 31.798 | 3,42 | 2.263 | 36,43 | ||||
| 2026-02-05 | 13F | Alpine Associates Management Inc. | 0 | -100,00 | 0 | |||||
| 2026-02-10 | 13F | CIBC World Markets Inc. | Call | 0 | -100,00 | 0 | -100,00 | |||
| 2026-02-13 | 13F | Smartleaf Asset Management LLC | 478 | 29,89 | 25 | 78,57 | ||||
| 2026-01-20 | 13F | Pullen Investment Management, LLC | 6.575 | 0,00 | 341 | 33,86 | ||||
| 2025-11-13 | 13F | Macquarie Group Ltd | 0 | -100,00 | 0 | |||||
| 2025-11-10 | 13F | Counterpoint Mutual Funds LLC | 0 | -100,00 | 0 | |||||
| 2026-02-13 | 13F | Ingalls & Snyder Llc | 1.789.824 | -0,31 | 93 | 33,33 | ||||
| 2026-01-28 | 13F | Builder Investment Group Inc /adv | 268.194 | -0,26 | 13.895 | 33,43 | ||||
| 2026-02-17 | 13F | Alliancebernstein L.p. | 44.655 | -61,44 | 2.314 | -48,43 | ||||
| 2026-02-17 | 13F | Trexquant Investment LP | 131.420 | 98,29 | 6.809 | 165,32 | ||||
| 2026-02-18 | 13F | Achmea Investment Management B.V. | 0 | -100,00 | 0 | |||||
| 2026-02-17 | 13F | Perritt Capital Management Inc | 4.829 | 0,00 | 250 | 33,69 | ||||
| 2026-02-13 | 13F | Gen-Wealth Partners Inc | 555 | 21,98 | 29 | 64,71 | ||||
| 2026-01-28 | 13F | CAPROCK Group, Inc. | 70.249 | 88,57 | 3.640 | 188,12 | ||||
| 2026-02-03 | 13F | Anfield Capital Management, LLC | 17 | 0,00 | 1 | |||||
| 2026-02-12 | 13F | Dimensional Fund Advisors Lp | 3.577.765 | -0,89 | 185.379 | 32,59 | ||||
| 2026-02-13 | 13F | BRITISH COLUMBIA INVESTMENT MANAGEMENT Corp | 224.447 | -8,75 | 11.637 | 22,11 | ||||
| 2026-02-17 | 13F | National Asset Management, Inc. | 0 | -100,00 | 0 | |||||
| 2026-02-05 | 13F | AlphaCore Capital LLC | 4.123 | 214 | ||||||
| 2026-03-03 | 13F/A | Caitong International Asset Management Co., Ltd | 23.674 | 1.227 | ||||||
| 2026-02-13 | 13F | Schroder Investment Management Group | 1.731.199 | 33,84 | 91.217 | 81,71 | ||||
| 2025-10-21 | 13F | Optimum Investment Advisors | 306 | -76,57 | 12 | -70,27 | ||||
| 2026-02-12 | 13F | Integrated Quantitative Investments LLC | 19.920 | -29,62 | 1.032 | -5,84 | ||||
| 2026-02-19 | 13F | CI Private Wealth, LLC | 12.238 | 208 | ||||||
| 2026-02-10 | 13F | Envestnet Asset Management Inc | 32.910 | -37,80 | 1.705 | -16,79 | ||||
| 2026-02-17 | 13F | LMR Partners LLP | Call | 220.700 | 11.434 | |||||
| 2026-02-17 | 13F | LMR Partners LLP | Put | 220.700 | 11.434 | |||||
| 2026-02-03 | 13F | Stevens Capital Management Lp | 0 | -100,00 | 0 | |||||
| 2026-01-14 | 13F | Net Worth Advisory Group | 9.360 | -1,70 | 485 | 31,52 | ||||
| 2026-02-18 | 13F | NFP Retirement, Inc. | 6.250 | 0,00 | 324 | 33,47 | ||||
| 2026-01-23 | 13F | Farther Finance Advisors, LLC | 3.918 | -26,90 | 203 | -1,93 | ||||
| 2026-02-13 | 13F | BNP Paribas Asset Management Holding S.A. | 259.988 | 18 | ||||||
| 2025-11-12 | 13F | Integrated Advisors Network LLC | 0 | -100,00 | 0 | |||||
| 2025-12-16 | 13F | Garde Capital, Inc. | 0 | -100,00 | 0 | |||||
| 2026-01-21 | 13F | Sound Income Strategies, LLC | 31 | -80,38 | 2 | -83,33 | ||||
| 2026-02-17 | 13F | Evergreen Quality Fund GP, Ltd. | 1.620.000 | -18,81 | 83.932 | 8,62 | ||||
| 2026-01-20 | 13F | AdvisorNet Financial, Inc | 829 | 2,47 | 43 | 35,48 | ||||
| 2026-02-13 | 13F | Pine Valley Investments Ltd Liability Co | 95.995 | 1,74 | 4.974 | 36,10 | ||||
| 2026-01-30 | 13F | Bogart Wealth, LLC | 395 | 20 | ||||||
| 2026-02-17 | 13F | Clough Capital Partners L P | 41.563 | 2.153 | ||||||
| 2026-02-17 | 13F | Quantinno Capital Management LP | 60.662 | 8,96 | 3.143 | 45,73 | ||||
| 2026-02-10 | 13F | Rothschild Investment Llc | 1.025 | 10,81 | 53 | 51,43 | ||||
| 2026-01-27 | 13F | Elevated Capital Advisors, LLC | 39 | 2 | ||||||
| 2026-02-17 | 13F | Raymond James Financial Inc | 426.968 | -9,98 | 22.121 | 20,43 | ||||
| 2026-02-17 | 13F | First Manhattan Co | 50.662 | -3,51 | 2.625 | 29,07 | ||||
| 2026-02-05 | 13F | Vienna Powszechne Towarzystwo Emerytalne S.A. Vienna Insurance Group | 286.327 | 0,00 | 14.835 | 33,77 | ||||
| 2026-02-11 | 13F | Vise Technologies, Inc. | 6.295 | 12,07 | 326 | 50,23 | ||||
| 2026-02-12 | 13F | Groupe la Francaise | 207.500 | 6,00 | 10.755 | 41,85 | ||||
| 2026-02-17 | 13F | Guggenheim Capital Llc | 183.461 | -21,83 | 9.505 | 4,58 | ||||
| 2026-02-13 | 13F | Evelyn Partners Asset Management Ltd | 383 | 0,00 | 20 | 35,71 | ||||
| 2026-02-17 | 13F | Amundi | 2.834.247 | 5,89 | 146.842 | 37,05 | ||||
| 2026-02-13 | 13F | Goehring & Rozencwajg Associates, LLC | 175.080 | -29,43 | 9.071 | -5,60 | ||||
| 2026-01-28 | 13F | Arizona State Retirement System | 0 | -100,00 | 0 | |||||
| 2026-02-02 | 13F | Robertson Stephens Wealth Management, LLC | 19.021 | 14,52 | 985 | 53,19 | ||||
| 2026-02-17 | 13F | Canada Pension Plan Investment Board | 2.615.426 | 47,06 | 135.600 | 96,79 | ||||
| 2026-02-10 | 13F | Greenwich Wealth Management LLC | 49.000 | 80,12 | 3 | 100,00 | ||||
| 2026-02-17 | 13F | Ancora Advisors, LLC | 834 | 0,00 | 43 | 34,38 | ||||
| 2026-01-20 | 13F | C2P Capital Advisory Group, LLC d.b.a. Prosperity Capital Advisors | 4.743 | 246 | ||||||
| 2026-01-21 | 13F/A | Euro Pacific Asset Management, LLC | 1.287.451 | -3,24 | 62 | 24,49 | ||||
| 2026-02-17 | 13F | Keebeck Alpha, LP | 0 | -100,00 | 0 | |||||
| 2026-02-12 | 13F | Andra AP-fonden | 47.882 | -28,00 | 3.407 | -4,99 | ||||
| 2026-01-08 | 13F | Dagco, Inc. | 695 | 0,00 | 36 | 34,62 | ||||
| 2026-01-05 | 13F | GAMMA Investing LLC | 290 | 0,00 | 15 | 36,36 | ||||
| 2026-02-10 | 13F | Hillsdale Investment Management Inc. | 441.590 | -31,68 | 22.935 | -8,41 | ||||
| 2025-11-14 | 13F | Wolverine Trading, Llc | 67.553 | 223,34 | 2.622 | 352,68 | ||||
| 2026-01-12 | 13F | Byrne Asset Management LLC | 9.240 | 479 | 32,78 | |||||
| 2025-11-14 | 13F | Wolverine Trading, Llc | Call | 455.700 | 58,84 | 17.686 | 122,40 | |||
| 2026-02-12 | 13F | Nuveen, LLC | 447.597 | 0,00 | 23.236 | 33,94 | ||||
| 2026-02-13 | 13F | First Trust Advisors Lp | 72.789 | -24,71 | 3.773 | 0,72 | ||||
| 2025-11-14 | 13F | Wolverine Trading, Llc | Put | 281.600 | 100,86 | 10.929 | 181,21 | |||
| 2026-02-12 | 13F | Laffer Investments | 13.521 | 91,92 | 701 | 157,35 | ||||
| 2026-01-20 | 13F | Steel Peak Wealth Management LLC | 4.813 | 249 | ||||||
| 2026-02-03 | 13F | ASR Vermogensbeheer N.V. | 17.142 | 0,00 | 890 | 33,89 | ||||
| 2026-02-10 | 13F | Daiwa Securities Group Inc. | 0 | -100,00 | 0 |