Grundlæggende statistik
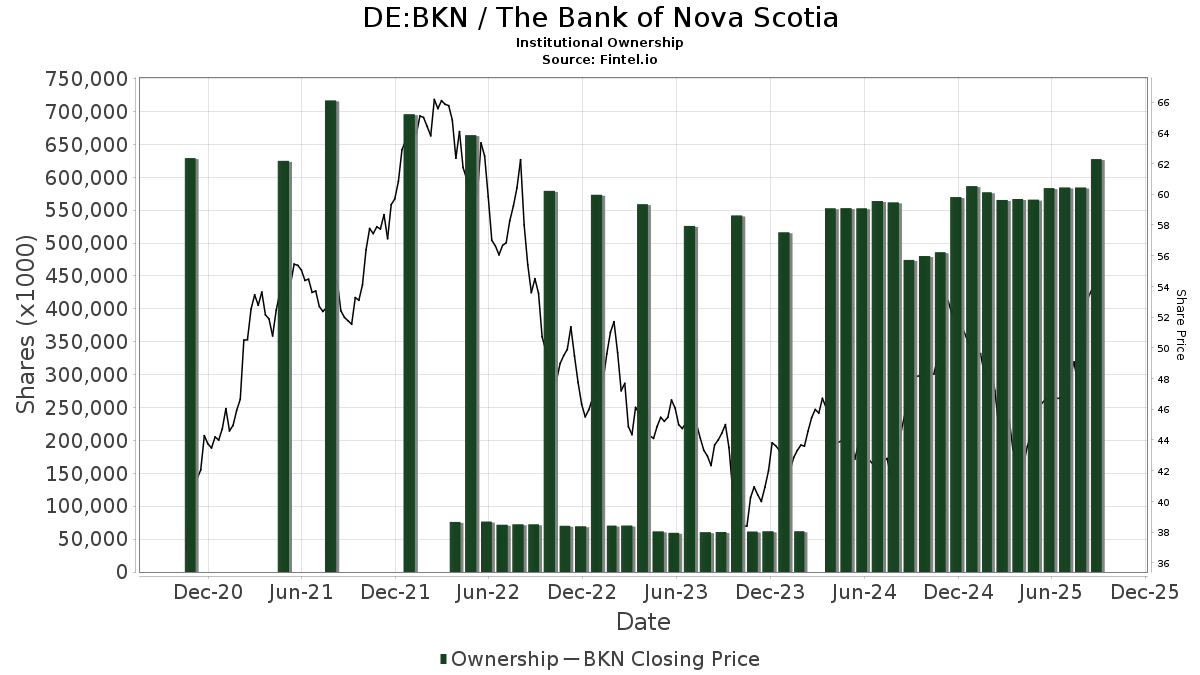
| Institutionelle aktier (lange) | 570.573.874 - 46,33% (ex 13D/G) - change of -6,14MM shares -1,06% MRQ |
| Institutionel værdi (lang) | $ 40.866.685 USD ($1000) |
Institutionelt ejerskab og aktionærer
The Bank of Nova Scotia (DE:BKN) har 495 institutionelle ejere og aktionærer, der har indsendt 13D/G- eller 13F-formularer til Securities Exchange Commission (SEC). Disse institutioner har i alt 570,573,874 aktier. Største aktionærer omfatter Royal Bank Of Canada, Bank Of Montreal /can/, Vanguard Group Inc, CIBC World Markets Inc., Toronto Dominion Bank, Royal Bank Of Canada, 1832 Asset Management L.P., Td Asset Management Inc, Norges Bank, and National Bank Of Canada /fi/ .
The Bank of Nova Scotia (DB:BKN) institutionel ejerskabsstruktur viser aktuelle positioner i virksomheden efter institutioner og fonde, samt seneste ændringer i positionsstørrelse. Større aktionærer kan omfatte individuelle investorer, investeringsforeninger, hedgefonde eller institutioner. Skema 13D angiver, at investoren besidder (eller besidder) mere end 5 % af virksomheden og har til hensigt (eller har til hensigt at) aktivt at forfølge en ændring i forretningsstrategi. Skema 13G indikerer en passiv investering på over 5%.
The share price as of April 24, 2026 is 64,00 / share. Previously, on April 28, 2025, the share price was 43,13 / share. This represents an increase of 48,39% over that period.
Fondens stemningsscore
Fund Sentiment Score (fka Ownership Accumulation Score) finder de aktier, der bliver mest købt af fonde. Det er resultatet af en sofistikeret, multi-faktor kvantitativ model, der identificerer virksomheder med de højeste niveauer af institutionel akkumulering. Scoringsmodellen bruger en kombination af den samlede stigning i oplyste ejere, ændringerne i porteføljeallokeringer i disse ejere og andre målinger. Tallet går fra 0 til 100, hvor højere tal indikerer et højere niveau af akkumulering for sine jævnaldrende, og 50 er gennemsnittet.
Opdateringsfrekvens: Dagligt
Se Ownership Explorer, som giver en liste over højest rangerende virksomheder.
AI+ Ask Fintel’s AI assistant about The Bank of Nova Scotia.
Select a question to share a public post with an AI-crafted answer.
Thinking of good questions…
13F og NPORT arkivering
Detaljer om 13F-arkivering er gratis. Detaljer om NP-ansøgninger kræver et premium-medlemskab. Grønne rækker angiver nye positioner. Røde rækker angiver lukkede positioner. Klik på linket ikon for at se den fulde transaktionshistorik.
Opgrader
for at låse premium-data op og eksportere til Excel ![]() .
.
| Fil dato | Kilde | Investor | Type | Gennemsnitlig pris (Øst) |
Aktier | Δ Aktier (%) |
Rapporteret Værdi ($1000) |
Δ Værdi (%) |
Port Alloc (%) |
|
|---|---|---|---|---|---|---|---|---|---|---|
| 2026-02-12 | 13F | UniSuper Management Pty Ltd | 24.100 | 13,68 | 2.440 | 27,90 | ||||
| 2026-02-11 | 13F | Fiera Capital Corp | 42.746 | -6,02 | 3.154 | 7,28 | ||||
| 2026-02-11 | 13F | Zions Bancorporation, National Association /ut/ | 23 | 2 | ||||||
| 2026-02-13 | 13F | Stifel Financial Corp | 103.320 | 5,69 | 7.614 | 20,46 | ||||
| 2025-11-14 | 13F | ICONIQ Capital, LLC | 0 | -100,00 | 0 | |||||
| 2026-01-23 | 13F | Natural Investments, Llc | 3.230 | 0 | ||||||
| 2025-10-28 | 13F | Campbell & CO Investment Adviser LLC | 0 | -100,00 | 0 | |||||
| 2026-02-17 | 13F | Millennium Management Llc | 767.836 | 6,47 | 56.596 | 21,38 | ||||
| 2026-02-17 | 13F | Millennium Management Llc | Call | 50.000 | -50,69 | 5.062 | -44,32 | |||
| 2026-02-17 | 13F | Worldquant Millennium Advisors Llc | 43.283 | -25,19 | 3.193 | -14,63 | ||||
| 2026-02-17 | 13F | Millennium Management Llc | Put | 1.050.000 | 39,74 | 106.292 | 57,27 | |||
| 2026-04-22 | 13F | Stone House Investment Management, LLC | 21 | 0,00 | 1 | 0,00 | ||||
| 2026-02-13 | 13F | Cornerstone Financial Management LLC | 52 | 4 | ||||||
| 2026-02-13 | 13F | Healthcare Of Ontario Pension Plan Trust Fund | 9.447.941 | 6,59 | 696.876 | 21,61 | ||||
| 2026-02-13 | 13F | Pathstone Holdings, LLC | 11.218 | 6,92 | 827 | 21,83 | ||||
| 2026-04-24 | 13F | Mitchell Mcleod Pugh & Williams Inc | 10.300 | 0,00 | 714 | -9,29 | ||||
| 2026-01-15 | 13F | Nisa Investment Advisors, Llc | 674 | 50 | ||||||
| 2026-02-13 | 13F | Osmosis Investment Management UK Ltd | 97.721 | 7.216 | ||||||
| 2026-02-17 | 13F | Janus Henderson Group Plc | 124.552 | -3,19 | 9.202 | 10,63 | ||||
| 2026-02-17 | 13F | Glenmede Trust Co Na | 0 | -100,00 | 0 | |||||
| 2026-02-03 | 13F | American Assets Investment Management, LLC | 100.000 | 0,00 | 7.369 | 13,98 | ||||
| 2026-04-20 | 13F | Ronald Blue Trust, Inc. | 794 | 0,00 | 55 | -5,17 | ||||
| 2026-02-13 | 13F | Sumitomo Life Insurance Co | 8.227 | -0,07 | 606 | 13,91 | ||||
| 2026-02-17 | 13F | Cetera Investment Advisers | 85.189 | -0,14 | 6.278 | 13,82 | ||||
| 2026-02-13 | 13F | Ieq Capital, Llc | 24.343 | 32,91 | 1.794 | 51,44 | ||||
| 2026-01-15 | 13F | J. Safra Sarasin Holding AG | 13.873 | 25,02 | 1.025 | 42,82 | ||||
| 2026-02-13 | 13F | Virtus ETF Advisers LLC | 4.332 | 1,69 | 439 | 14,36 | ||||
| 2026-02-10 | 13F | Godfrey Financial Associates, Inc. | 30 | 2 | ||||||
| 2026-04-24 | 13F | Triasima Portfolio Management inc. | 128.680 | -0,87 | 8.895 | -7,21 | ||||
| 2026-02-10 | 13F | Periscope Capital Inc. | Call | 251.200 | 0,00 | 18.530 | 14,07 | |||
| 2026-02-13 | 13F | SRS Capital Advisors, Inc. | 985 | -86,93 | 73 | -85,22 | ||||
| 2026-02-19 | 13F | Invesco Ltd. | 2.251.451 | -4,92 | 165.909 | 8,38 | ||||
| 2026-04-07 | 13F | CoreCap Advisors, LLC | 30 | 0,00 | 2 | 0,00 | ||||
| 2026-04-24 | 13F | Bayban | 200 | 0,00 | 14 | -7,14 | ||||
| 2026-02-11 | 13F | CLARET ASSET MANAGEMENT Corp | 103.236 | -1,80 | 8 | 16,67 | ||||
| 2026-02-17 | 13F | United Capital Financial Advisers, Llc | 2.928 | 216 | ||||||
| 2026-02-17 | 13F | Two Sigma Investments, Lp | 189.051 | -78,61 | 13.931 | -75,62 | ||||
| 2026-02-05 | 13F | Bank Julius Baer & Co. Ltd, Zurich | 2.405 | 177 | ||||||
| 2026-02-11 | 13F | Simplex Trading, Llc | 1.439 | -95,76 | 106 | 5.200,00 | ||||
| 2026-02-10 | 13F | Bruce G. Allen Investments, LLC | 294 | 0,00 | 22 | 10,53 | ||||
| 2026-02-11 | 13F | Simplex Trading, Llc | Call | 11.300 | -79,64 | 833 | 27.633,33 | |||
| 2026-02-14 | 13F | Rockefeller Capital Management L.P. | 674 | -36,89 | 50 | -28,99 | ||||
| 2026-02-11 | 13F | Simplex Trading, Llc | Put | 13.600 | -24,86 | 1.002 | 100.100,00 | |||
| 2026-04-23 | 13F | Oppenheimer & Co Inc | 6.503 | 451 | ||||||
| 2026-04-13 | 13F | JCIC Asset Management Inc. | 4.412 | 2,20 | 305 | -4,09 | ||||
| 2026-04-17 | 13F | CENTRAL TRUST Co | 24 | 0,00 | 2 | 0,00 | ||||
| 2026-02-13 | 13F | Prudential Financial Inc | 30.059 | 129,83 | 2.220 | 162,60 | ||||
| 2025-10-31 | 13F | Whittier Trust Co | 0 | -100,00 | 0 | -100,00 | ||||
| 2026-02-17 | 13F | State Of Wisconsin Investment Board | 477.772 | 35.284 | ||||||
| 2025-11-13 | 13F | Eisler Capital Management Ltd. | 100.000 | -66,02 | 6.460 | -60,33 | ||||
| 2026-04-21 | 13F | Pinnacle Associates Ltd | 27.500 | 0,00 | 1.906 | -5,92 | ||||
| 2026-02-13 | 13F | OMERS ADMINISTRATION Corp | 2.303.450 | -13,59 | 170.110 | -1,34 | ||||
| 2026-02-11 | 13F | Buckingham Strategic Partners | 5.661 | 47,12 | 417 | 65,48 | ||||
| 2026-02-17 | 13F | Guardian Partners Inc. | 0 | -100,00 | 0 | |||||
| 2026-02-06 | 13F | Larson Financial Group LLC | 1.280 | 22,25 | 94 | 40,30 | ||||
| 2026-02-17 | 13F | Alliancebernstein L.p. | 119.814 | -1,17 | 8.829 | 12,66 | ||||
| 2026-02-09 | 13F | Mondrian Investment Partners LTD | 470 | 0,00 | 48 | 11,90 | ||||
| 2026-02-12 | 13F | Northwest & Ethical Investments L.P. | 367.609 | 6,43 | 27.114 | 21,38 | ||||
| 2026-01-16 | 13F | Applied Capital LLC/FL | 5.616 | 0,00 | 414 | 13,77 | ||||
| 2026-03-04 | 13F | SHP Wealth Management | 219 | 16 | ||||||
| 2026-02-10 | 13F | Envestnet Asset Management Inc | 4.808 | 6,96 | 354 | 22,07 | ||||
| 2026-02-17 | 13F | Private Advisor Group, LLC | 5.636 | -11,79 | 415 | 0,48 | ||||
| 2026-01-29 | 13F | Cherokee Insurance Co | 12.760 | 0,00 | 940 | 14,08 | ||||
| 2025-12-16 | 13F | Emergent Wealth Advisors, LLC | 0 | 0 | ||||||
| 2025-11-04 | 13F | Guerra Advisors Inc | 4 | 0 | ||||||
| 2026-04-13 | 13F | Trust Co | 7 | 0,00 | 0 | |||||
| 2026-01-28 | 13F | CAPROCK Group, Inc. | 8.392 | 44,14 | 618 | 70,25 | ||||
| 2026-04-21 | 13F | Venturi Wealth Management, LLC | 3.468 | 18,32 | 240 | 11,63 | ||||
| 2026-02-04 | 13F | Bailard, Inc. | 17.104 | -2,10 | 1.260 | 11,60 | ||||
| 2026-02-05 | 13F | Atria Investments Llc | 3.294 | 4,41 | 243 | 19,21 | ||||
| 2026-02-11 | 13F | O'shaughnessy Asset Management, Llc | 243.615 | 5,50 | 17.963 | 20,32 | ||||
| 2026-01-29 | 13F | UBS Group AG | 927.693 | -9,16 | 68.362 | 3,54 | ||||
| 2026-01-27 | 13F | Checchi Capital Advisers, LLC | 4.801 | -7,44 | 354 | 5,37 | ||||
| 2026-01-28 | 13F | HB Wealth Management, LLC | 5.961 | 11,99 | 439 | 27,62 | ||||
| 2026-02-13 | 13F | Integrated Wealth Concepts LLC | 6.892 | -22,83 | 508 | -12,13 | ||||
| 2026-04-10 | 13F/A | PBU - The Pension Fund of Early Childhood & Youth Educators | 152.831 | -0,51 | 10.565 | -6,88 | ||||
| 2026-03-20 | 13F | Purpose Unlimited Inc. | 707.198 | 52.158 | ||||||
| 2026-04-20 | 13F | Ritholtz Wealth Management | 28.421 | 31,15 | 1.970 | 23,37 | ||||
| 2026-02-11 | 13F | Manchester Capital Management LLC | 2.528 | 186 | ||||||
| 2026-02-04 | 13F | Nwam Llc | 4.384 | -1,06 | 329 | 16,25 | ||||
| 2026-04-08 | 13F | Cardinal Capital Management | 62.165 | 0,74 | 4.309 | -5,26 | ||||
| 2026-02-13 | 13F | Bridgewater Associates, LP | 23.024 | -22,64 | 1.700 | -11,69 | ||||
| 2026-02-17 | 13F | Creative Planning | 93.070 | 18,31 | 6.858 | 34,87 | ||||
| 2026-04-16 | 13F | SG Americas Securities, LLC | 16.768 | 1 | ||||||
| 2026-02-04 | 13F | Asahi Life Asset Management Co., Ltd. | 4.853 | -35,34 | 358 | -26,19 | ||||
| 2026-02-13 | 13F | Canerector Inc | 300.000 | 0,00 | 30.369 | 12,49 | ||||
| 2026-02-17 | 13F | Voloridge Investment Management, Llc | 0 | -100,00 | 0 | |||||
| 2026-04-07 | 13F | Cardinal Capital Management, Inc. | 2.022.859 | 1,26 | 139.841 | -30,85 | ||||
| 2026-02-17 | 13F | Advisory Services Network, LLC | 3.847 | -3,51 | 283 | 10,12 | ||||
| 2025-11-14 | 13F | Lighthouse Investment Partners, LLC | 0 | -100,00 | 0 | |||||
| 2025-11-14 | 13F | Texas Permanent School Fund | 0 | -100,00 | 0 | |||||
| 2025-11-14 | 13F | Graham Capital Management, L.P. | 0 | -100,00 | 0 | |||||
| 2026-04-16 | 13F | Toth Financial Advisory Corp | 1.040 | 0,00 | 72 | -5,26 | ||||
| 2025-11-13 | 13F | Farringdon Capital, Ltd. | 0 | -100,00 | 0 | |||||
| 2026-04-20 | 13F | Assenagon Asset Management S.A. | 47.551 | -0,16 | 3.288 | -6,54 | ||||
| 2026-04-15 | 13F | Addenda Capital Inc. | 1.073.598 | 0,25 | 103.570 | -4,47 | ||||
| 2026-04-08 | 13F | AAFMAA Wealth Management & Trust LLC | 6.773 | 0,00 | 469 | -6,01 | ||||
| 2026-02-17 | 13F | Quadrature Capital Ltd | 0 | -100,00 | 0 | -100,00 | ||||
| 2026-04-10 | 13F | Ipswich Investment Management Co., Inc. | 27.672 | -7,78 | 1.918 | -13,30 | ||||
| 2026-02-13 | 13F | Dynamic Technology Lab Private Ltd | 0 | -100,00 | 0 | -100,00 | ||||
| 2026-02-04 | 13F | Dogwood Wealth Management LLC | 27 | 2 | ||||||
| 2026-02-06 | 13F | Callahan Advisors, LLC | 8.835 | 13,49 | 651 | 29,42 | ||||
| 2026-04-10 | 13F | Abound Wealth Management | 97 | 106,38 | 7 | 100,00 | ||||
| 2026-02-17 | 13F | XTX Topco Ltd | 37.662 | 28,88 | 2.775 | 46,90 | ||||
| 2026-04-24 | 13F | UMA Financial Services, Inc. | 50 | 0,00 | 3 | 0,00 | ||||
| 2026-01-30 | 13F | Samalin Investment Counsel, LLC | 0 | -100,00 | 0 | |||||
| 2026-02-17 | 13F | Strive Financial Group ,LLC | 1.379 | 102 | ||||||
| 2026-04-23 | 13F | Cornerstone Wealth Management, LLC | 24.020 | 4,53 | 1.665 | -1,71 | ||||
| 2026-02-17 | 13F | Bank Of America Corp /de/ | Put | 0 | -100,00 | 0 | -100,00 | |||
| 2026-02-10 | 13F | Rothschild Investment Llc | 250 | 0,00 | 18 | 12,50 | ||||
| 2026-03-03 | 13F | Employees Provident Fund Board | 0 | -100,00 | 0 | |||||
| 2025-11-13 | 13F | FORA Capital, LLC | 0 | -100,00 | 0 | -100,00 | ||||
| 2026-02-09 | 13F | Nicola Wealth Management Ltd. | 1.361.500 | 163,19 | 100.430 | 200,22 | ||||
| 2026-04-07 | 13F | Park Avenue Securities Llc | 3.155 | 2,07 | 0 | |||||
| 2026-02-11 | 13F | Metis Global Partners, LLC | 41.474 | -26,79 | 3.059 | -16,52 | ||||
| 2026-02-05 | 13F | Bessemer Group Inc | 64.518 | -10,64 | 5 | 0,00 | ||||
| 2026-02-10 | 13F | Hazlett, Burt & Watson, Inc. | 100 | 0,00 | 0 | |||||
| 2025-11-14 | 13F | Wolverine Trading, Llc | 14.857 | 962 | ||||||
| 2026-04-10 | 13F | Armstrong Advisory Group, Inc | 400 | 0,00 | 28 | -6,90 | ||||
| 2025-11-14 | 13F | Wolverine Trading, Llc | Call | 30.300 | 1.963 | |||||
| 2026-02-05 | 13F | AlphaCore Capital LLC | 4.109 | -8,47 | 303 | 4,14 | ||||
| 2026-02-12 | 13F | Dimensional Fund Advisors Lp | 5.854.148 | 2,38 | 431.399 | 16,70 | ||||
| 2025-11-14 | 13F | Wolverine Trading, Llc | Put | 34.800 | 2.254 | |||||
| 2026-02-13 | 13F | Parkside Financial Bank & Trust | 47 | 0,00 | 3 | 0,00 | ||||
| 2026-02-04 | 13F | Legacy Financial Advisors, Inc. | 4.428 | 27,68 | 326 | 45,54 | ||||
| 2026-02-17 | 13F | SIG North Trading, ULC | Call | 2.042.800 | 6,51 | 150.534 | 21,41 | |||
| 2026-04-03 | 13F | Coastline Trust Co | 195 | 0,00 | 14 | -7,14 | ||||
| 2026-02-17 | 13F | Clear Street Markets Llc | 0 | -100,00 | 0 | -100,00 | ||||
| 2026-02-17 | 13F | SIG North Trading, ULC | 765.785 | -55,37 | 56.431 | -49,13 | ||||
| 2026-02-17 | 13F | Quantinno Capital Management LP | 109.276 | 31,52 | 8.053 | 49,92 | ||||
| 2026-04-09 | 13F | Pacifica Partners Inc. | 18.743 | 1.297 | ||||||
| 2026-04-24 | 13F | Marathon Asset Mgmt Ltd | 1.089.394 | -0,43 | 75.316 | -6,80 | ||||
| 2026-02-17 | 13F | SIG North Trading, ULC | Put | 2.618.500 | -3,20 | 192.957 | 10,33 | |||
| 2026-02-10 | 13F | Savant Capital, LLC | 7.388 | 2,87 | 544 | 17,24 | ||||
| 2026-02-10 | 13F | Jupiter Asset Management Ltd | 900.832 | 66.527 | ||||||
| 2026-01-20 | 13F | Cromwell Holdings LLC | 2.955 | 0,00 | 218 | 13,61 | ||||
| 2026-02-06 | 13F | Harvest Portfolios Group Inc. | 67.305 | 1,91 | 4.964 | 16,23 | ||||
| 2026-01-21 | 13F | Crews Bank & Trust | 300 | 0,00 | 22 | 15,79 | ||||
| 2025-11-10 | 13F | Optiver Holding B.V. | 0 | -100,00 | 0 | |||||
| 2026-02-20 | 13F | Ruggaard & Associates LLC | 8.780 | 0,00 | 647 | 13,93 | ||||
| 2026-02-17 | 13F | Consultiva Wealth Management, Corp. | 0 | -100,00 | 0 | |||||
| 2026-02-10 | 13F | Evolution Wealth Management Inc. | 160 | 12 | ||||||
| 2026-02-17 | 13F | Investment Management Corp of Ontario | 300.178 | 55,72 | 22.120 | 77,50 | ||||
| 2026-02-13 | 13F | Squarepoint Ops LLC | Call | 0 | -100,00 | 0 | ||||
| 2026-04-21 | 13F | Value Partners Investments Inc. | 811.628 | -17,40 | 56.172 | -22,60 | ||||
| 2026-02-10 | 13F | Bowen Hanes & Co Inc | 14.267 | 0,00 | 1 | -99,89 | ||||
| 2026-02-13 | 13F | Walleye Capital LLC | 0 | -100,00 | 0 | -100,00 | ||||
| 2026-02-10 | 13F | Acadian Asset Management Llc | 12.866.335 | 50,57 | 950 | 72,10 | ||||
| 2026-02-17 | 13F | Qube Research & Technologies Ltd | 277.056 | -3,60 | 20.421 | 9,91 | ||||
| 2026-02-17 | 13F | Tower Research Capital LLC (TRC) | 5.319 | -40,44 | 392 | -32,24 | ||||
| 2026-02-18 | 13F | Vident Advisory, LLC | 15.734 | 28,71 | 1.160 | 46,71 | ||||
| 2026-01-27 | 13F | Lorne Steinberg Wealth Management Inc. | 169.702 | -2,18 | 12.534 | 11,76 | ||||
| 2026-02-17 | 13F | Magnetar Financial LLC | 7.017 | 517 | ||||||
| 2026-01-29 | 13F | Vanguard Group Inc | 57.237.537 | 2,09 | 4.221.440 | 16,44 | ||||
| 2026-04-16 | 13F | Kavar Capital Partners Group, Llc | 3.414 | 0,00 | 237 | -5,98 | ||||
| 2026-02-11 | 13F | Allianz Asset Management GmbH | 52.813 | 7,93 | 3.900 | 23,26 | ||||
| 2026-02-06 | 13F | EverSource Wealth Advisors, LLC | 2.748 | 15,80 | 202 | 32,03 | ||||
| 2026-04-13 | 13F | True Wealth Design, LLC | 327 | 24,81 | 23 | 15,79 | ||||
| 2025-11-14 | 13F | Axa S.a. | 0 | -100,00 | 0 | |||||
| 2026-02-13 | 13F | Caitong International Asset Management Co., Ltd | 0 | -100,00 | 0 | |||||
| 2026-04-17 | 13F | Murphy & Mullick Capital Management Corp | 469 | 0,00 | 33 | -5,88 | ||||
| 2026-02-12 | 13F | Steward Partners Investment Advisory, Llc | 1.108 | 0,00 | 82 | 14,08 | ||||
| 2026-02-12 | 13F | APG Asset Management N.V. | 639.651 | -32,94 | 40.221 | -23,39 | ||||
| 2026-02-17 | 13F | SageView Advisory Group, LLC | 47 | 3 | ||||||
| 2026-02-17 | 13F | Public Employees Retirement System Of Ohio | 257.253 | 63,48 | 18.997 | 86,65 | ||||
| 2026-02-17 | 13F | Russell Investments Group, Ltd. | 1.000.701 | -40,05 | 73.938 | -31,63 | ||||
| 2026-02-02 | 13F | Varma Mutual Pension Insurance Co | 269.856 | -3,64 | 19.929 | 10,03 | ||||
| 2026-02-10 | 13F | Natixis Advisors, L.p. | 61.376 | -2,25 | 5 | 0,00 | ||||
| 2026-01-30 | 13F | Us Bancorp \de\ | 89.622 | 0,57 | 6.604 | 14,65 | ||||
| 2026-02-05 | 13F | Allworth Financial LP | 1.220 | 70,63 | 90 | 93,48 | ||||
| 2026-02-02 | 13F | Cornerstone Planning Group LLC | 195 | 9,55 | 15 | 27,27 | ||||
| 2026-01-26 | 13F | Cwm, Llc | 1.980 | -9,84 | 0 | |||||
| 2026-02-11 | 13F | Group One Trading, L.p. | Put | 68.900 | -13,66 | 5.077 | -1,59 | |||
| 2026-02-11 | 13F | Group One Trading, L.p. | Call | 14.700 | -44,32 | 1.083 | -36,52 | |||
| 2026-04-13 | 13F | IFP Advisors, Inc | 36 | -25,00 | 2 | -33,33 | ||||
| 2026-02-09 | 13F | Cypress Capital Management LLC (WY) | 601 | 0,00 | 44 | 15,79 | ||||
| 2025-12-16 | 13F | Garde Capital, Inc. | 0 | -100,00 | 0 | |||||
| 2026-04-03 | 13F | Hickory Point Bank & Trust | 52 | 4 | ||||||
| 2026-02-02 | 13F | Principal Financial Group Inc | 24.800 | -5,34 | 1.831 | 8,09 | ||||
| 2026-04-15 | 13F | Merit Financial Group, LLC | 5.443 | 6,52 | 377 | 0,27 | ||||
| 2026-02-03 | 13F | Manske Wealth Management | 3.710 | -4,13 | 273 | 9,20 | ||||
| 2026-02-12 | 13F | Portland Investment Counsel Inc. | 0 | -100,00 | 0 | |||||
| 2026-02-13 | 13F | Van Eck Associates Corp | 1.196.685 | 16,45 | 88 | 33,33 | ||||
| 2026-02-17 | 13F | Bank Of America Corp /de/ | 4.624.326 | -20,28 | 340.767 | -9,13 | ||||
| 2026-02-13 | 13F | Colony Group, LLC | 16.390 | 10,49 | 1.208 | 27,59 | ||||
| 2026-02-11 | 13F | Erste Asset Management GmbH | 0 | 0 | ||||||
| 2026-02-19 | 13F | Atomi Financial Group, Inc. | 17.740 | 31,64 | 1.307 | 50,06 | ||||
| 2026-02-11 | 13F | CenterBook Partners LP | 20.321 | 1.497 | ||||||
| 2026-02-05 | 13F | Leuthold Group, Llc | 3.399 | 0,15 | 250 | 14,16 | ||||
| 2026-02-12 | 13F | Federation des caisses Desjardins du Quebec | 8.041.565 | -0,50 | 593.078 | 13,45 | ||||
| 2026-04-10 | 13F | Pure Financial Advisors, Inc. | 3.825 | 40,62 | 265 | 32,50 | ||||
| 2026-01-26 | 13F | Private Trust Co Na | 289 | 0,00 | 21 | 16,67 | ||||
| 2026-04-13 | 13F | Highland Capital Management, Llc | 24.550 | -0,41 | 1.702 | -6,33 | ||||
| 2026-02-13 | 13F | National Bank Of Canada /fi/ | Put | 1.899 | -13,96 | 14.004 | -1,87 | |||
| 2026-02-17 | 13F | Laird Norton Trust Company, Llc | 49.604 | 3.655 | ||||||
| 2025-11-13 | 13F | VSM Wealth Advisory, LLC | 0 | -100,00 | 0 | |||||
| 2026-02-13 | 13F | Natixis | 194.838 | -7,20 | 14.358 | 5,78 | ||||
| 2026-02-17 | 13F | Tudor Investment Corp Et Al | Put | 15.000 | -15,73 | 1.105 | -3,91 | |||
| 2026-02-09 | 13F | First National Trust Co | 44.415 | 0,00 | 3.273 | 13,97 | ||||
| 2026-02-13 | 13F | National Bank Of Canada /fi/ | Call | 7.374 | -40,43 | 54.380 | -32,06 | |||
| 2026-02-17 | 13F | Aqr Capital Management Llc | 3.556.295 | 3.120,14 | 262.284 | 3.573,95 | ||||
| 2026-02-17 | 13F | Tudor Investment Corp Et Al | Call | 22.200 | -14,94 | 1.636 | -3,08 | |||
| 2026-02-13 | 13F | Public Sector Pension Investment Board | 0 | -100,00 | 0 | |||||
| 2026-01-27 | 13F | TD Waterhouse Canada Inc. | 4.659.099 | -1,04 | 343.432 | 13,19 | ||||
| 2026-02-11 | 13F | LPL Financial LLC | 55.744 | -36,34 | 4.108 | -27,44 | ||||
| 2026-02-03 | 13F | K.J. Harrison & Partners Inc | 123.271 | -0,28 | 9.105 | 13,18 | ||||
| 2026-01-15 | 13F | Mn Services Vermogensbeheer B.V. | 285.843 | 16,96 | 21 | 40,00 | ||||
| 2026-01-22 | 13F | Hager Investment Management Services, Llc | 71 | 5 | ||||||
| 2026-02-11 | 13F | Jpmorgan Chase & Co | 5.983.525 | -9,28 | 440.926 | 3,40 | ||||
| 2026-02-12 | 13F | Scotia Capital Inc. | 13.816.974 | -1,98 | 1.018.400 | 11,81 | ||||
| 2026-02-12 | 13F | Jane Street Group, Llc | 283.816 | 45,14 | 20.914 | 65,43 | ||||
| 2026-02-09 | 13F | Todd Asset Management Llc | 19.250 | 2,21 | 1.419 | 16,52 | ||||
| 2026-02-12 | 13F | Jane Street Group, Llc | Put | 3.900 | -4,88 | 287 | 8,30 | |||
| 2026-02-17 | 13F | Utah Retirement Systems | 139.596 | 0,00 | 10.309 | 14,19 | ||||
| 2026-02-03 | 13F | Sequoia Financial Advisors, LLC | 13.430 | 0,85 | 990 | 15,00 | ||||
| 2026-02-12 | 13F | Jane Street Group, Llc | Call | 37.200 | 16,98 | 2.741 | 33,38 | |||
| 2026-03-26 | 13F/A | Peak6 Llc | Put | 0 | -100,00 | 0 | -100,00 | |||
| 2026-02-13 | 13F | Clarkston Capital Partners, LLC | 3.476 | 0,00 | 256 | 14,29 | ||||
| 2026-04-24 | 13F | USS Investment Management Ltd | 191.637 | 1,02 | 13.280 | -5,12 | ||||
| 2026-04-23 | 13F | Intrua Financial, LLC | 0 | -100,00 | 0 | |||||
| 2026-02-13 | 13F | Wells Fargo & Company/mn | 18.667 | -11,39 | 1.378 | 1,10 | ||||
| 2026-02-12 | 13F | Wealthspire Advisors, LLC | 0 | -100,00 | 0 | -100,00 | ||||
| 2026-02-13 | 13F | DKRT Investments Corp. | 56.000 | 0,00 | 4.127 | 13,98 | ||||
| 2026-02-10 | 13F | Greenspring Advisors, LLC | 3.551 | 262 | ||||||
| 2026-02-13 | 13F | Umb Bank N A/mo | 200 | 15 | ||||||
| 2026-02-11 | 13F | Twin Tree Management, LP | Call | 100 | -99,88 | 7 | -99,87 | |||
| 2026-02-17 | 13F | Bayesian Capital Management, LP | 0 | -100,00 | 0 | |||||
| 2026-02-10 | 13F | Foundations Investment Advisors, LLC | 17.634 | 158,53 | 1.299 | 195,23 | ||||
| 2026-04-13 | 13F | Creative Financial Designs Inc /adv | 4 | 0,00 | 0 | |||||
| 2026-02-17 | 13F | PharVision Advisers, LLC | 0 | -100,00 | 0 | |||||
| 2026-02-10 | 13F | Nomura Asset Management Co Ltd | 0 | 0 | ||||||
| 2026-02-03 | 13F | Hemenway Trust Co LLC | 4.690 | -4,77 | 346 | 8,49 | ||||
| 2026-04-23 | 13F | Pathway Financial Advisers, LLC | 64.823 | -3,02 | 4.493 | -8,79 | ||||
| 2026-01-28 | 13F | DekaBank Deutsche Girozentrale | 272.850 | 0,00 | 14 | -23,53 | ||||
| 2026-02-10 | 13F | Crescent Grove Advisors, LLC | 2.900 | 214 | ||||||
| 2026-02-17 | 13F | FIL Ltd | 16.489.540 | 49,52 | 1.216.157 | 70,54 | ||||
| 2026-04-15 | 13F | Trust Co Of Toledo Na /oh/ | 52 | 0,00 | 4 | 0,00 | ||||
| 2026-02-06 | 13F | Orca Wealth Management, LLC | 0 | -100,00 | 0 | |||||
| 2025-11-12 | 13F | HAP Trading, LLC | 162.647 | 14.656 | ||||||
| 2026-02-12 | 13F | Colonial Trust Co / SC | 2.000 | 147 | ||||||
| 2026-02-13 | 13F | Manufacturers Life Insurance Company, The | 6.969.396 | 27,55 | 515.094 | 45,75 | ||||
| 2026-04-16 | 13F | Forbes J M & Co Llp | 6.000 | 0,00 | 416 | -6,11 | ||||
| 2026-02-13 | 13F | First Trust Advisors Lp | 661.290 | -10,99 | 48.741 | 1,47 | ||||
| 2025-11-20 | 13F | First Affirmative Financial Network | 7.927 | 7,87 | 512 | 26,11 | ||||
| 2026-01-16 | 13F | Crewe Advisors LLC | 126 | 0,00 | 9 | 12,50 | ||||
| 2026-04-15 | 13F | Silverlake Wealth Management Llc | 7.851 | -0,27 | 544 | -6,21 | ||||
| 2026-01-15 | 13F | Frank, Rimerman Advisors LLC | 7.563 | 0,42 | 557 | 14,61 | ||||
| 2026-02-02 | 13F | Mutual Advisors, LLC | 3.478 | 0,00 | 256 | 14,29 | ||||
| 2026-02-03 | 13F | SBI Securities Co., Ltd. | 2.802 | -9,44 | 206 | 3,00 | ||||
| 2026-02-13 | 13F | Mariner, LLC | 46.143 | 15,26 | 3.401 | 31,41 | ||||
| 2026-02-13 | 13F | Beutel, Goodman & Co Ltd. | 243.554 | -0,53 | 18 | 13,33 | ||||
| 2026-02-17 | 13F | Wellington Management Group Llp | 3.162.458 | -6,03 | 233.405 | 7,25 | ||||
| 2026-02-11 | 13F | Letko, Brosseau & Associates Inc | 3.725.790 | -6,39 | 275.150 | 6,89 | ||||
| 2026-04-14 | 13F | Beacon Investment Advisory Services, Inc. | 500 | 35 | ||||||
| 2026-02-18 | 13F/A | Alberta Investment Management Corp | 1.641.000 | 6,48 | 121.032 | 21,48 | ||||
| 2026-01-15 | 13F | Jamison Private Wealth Management, Inc. | 3.352 | -10,97 | 247 | 1,65 | ||||
| 2026-02-11 | 13F | Cerity Partners LLC | 42.380 | 7,08 | 3.123 | 22,05 | ||||
| 2026-02-13 | 13F | Entropy Technologies, LP | 0 | -100,00 | 0 | |||||
| 2026-02-12 | 13F | Advisors Asset Management, Inc. | 1.804 | -3,32 | 133 | 10,00 | ||||
| 2026-01-28 | 13F | Financial Perspectives, Inc | 100 | 0,00 | 7 | 16,67 | ||||
| 2026-02-02 | 13F | Core Alternative Capital | 0 | -100,00 | 0 | |||||
| 2026-02-17 | 13F | Ewing Morris & Co. Investment Partners Ltd. | 22.766 | -2,72 | 1.702 | 12,43 | ||||
| 2026-04-22 | 13F | Gold Investment Management Ltd. | 138.546 | 1,11 | 9.598 | -5,03 | ||||
| 2026-03-24 | 13F | Old North State Trust, LLC | 4.872 | 0,00 | 0 | |||||
| 2026-02-05 | 13F | Cambridge Investment Research Advisors, Inc. | 12.486 | -10,98 | 1 | |||||
| 2026-04-14 | 13F | Prospera Financial Services Inc | 4.626 | 0,02 | 321 | -5,88 | ||||
| 2026-02-02 | 13F | Danske Bank A/s | 5.349 | -9,39 | 395 | 4,77 | ||||
| 2026-01-28 | 13F | Davis-rea Ltd. | 80.707 | -9,43 | 5.956 | 3,30 | ||||
| 2026-02-02 | 13F | New England Capital Financial Advisors LLC | 100 | 0,00 | 7 | 16,67 | ||||
| 2026-02-17 | 13F | Royal Bank Of Canada | Put | 21.815.200 | 1,39 | 1.607.562 | 15,57 | |||
| 2026-02-03 | 13F | Ethic Inc. | 9.063 | 68,61 | 668 | 92,22 | ||||
| 2026-02-09 | 13F | Hartland & Co., LLC | 1.000 | -0,89 | 74 | 12,31 | ||||
| 2026-02-17 | 13F | Royal Bank Of Canada | Call | 4.366.500 | 5,41 | 321.767 | 20,15 | |||
| 2026-01-21 | 13F | Newbridge Financial Services Group, Inc. | 700 | 0,00 | 52 | 13,33 | ||||
| 2025-11-14 | 13F | Gluskin Sheff & Assoc Inc | 0 | -100,00 | 0 | |||||
| 2026-02-18 | 13F | Guardian Capital Lp | 496.719 | 0,01 | 36.652 | 14,10 | ||||
| 2025-11-07 | 13F | Ontario Teachers Pension Plan Board | 0 | -100,00 | 0 | -100,00 | ||||
| 2026-02-06 | 13F | Americana Partners, LLC | 93.600 | 0,00 | 6.897 | 13,98 | ||||
| 2026-02-17 | 13F | Susquehanna Fundamental Investments, Llc | 44.300 | 3.264 | ||||||
| 2026-02-17 | 13F | Jones Financial Companies Lllp | 14.608 | -32,25 | 1.076 | -22,48 | ||||
| 2026-02-19 | 13F | CI Private Wealth, LLC | 182.233 | -0,79 | 13.429 | 13,08 | ||||
| 2026-04-06 | 13F | GAMMA Investing LLC | 190 | 0,00 | 13 | -7,14 | ||||
| 2026-02-12 | 13F | Ankerstar Wealth, LLC | 100 | 7 | ||||||
| 2026-04-23 | 13F | Lansforsakringar Fondforvaltning AB (publ) | 5.197 | -11,04 | 359 | -16,71 | ||||
| 2026-04-24 | 13F | Root Financial Partners, LLC | 38 | 100,00 | 3 | 100,00 | ||||
| 2026-02-10 | 13F | Scheer, Rowlett & Associates Investment Management Ltd. | 940.485 | -19,38 | 69.365 | -8,02 | ||||
| 2026-02-10 | 13F | Forsta Ap-fonden | 301.500 | -17,51 | 22.266 | -5,81 | ||||
| 2026-02-10 | 13F | Goldman Sachs Group Inc | Call | 300.000 | 0,00 | 22.107 | 13,98 | |||
| 2026-02-10 | 13F | Gulf International Bank (UK) Ltd | 61.829 | 0,00 | 5 | -20,00 | ||||
| 2026-02-13 | 13F | BRITISH COLUMBIA INVESTMENT MANAGEMENT Corp | 647.961 | -9,38 | 47.790 | 3,38 | ||||
| 2026-02-17 | 13F | Ancora Advisors, LLC | 62 | 5 | ||||||
| 2026-01-20 | 13F | Independence Bank of Kentucky | 1.025 | 0,00 | 76 | 13,64 | ||||
| 2025-11-17 | 13F | FSA Wealth Management LLC | 200 | 0,00 | 13 | 9,09 | ||||
| 2026-02-10 | 13F | Goldman Sachs Group Inc | 4.432.906 | -41,51 | 326.661 | -33,33 | ||||
| 2026-02-04 | 13F | Income Insurance Ltd | 3.689 | 272 | ||||||
| 2026-02-12 | 13F | Triumph Capital Management | 3.902 | 2,41 | 288 | 16,67 | ||||
| 2026-02-17 | 13F | Capital Fund Management S.a. | Put | 30.700 | -30,23 | 2.262 | -20,46 | |||
| 2026-02-13 | 13F | Aigen Investment Management, Lp | 4.110 | 308 | ||||||
| 2026-02-13 | 13F | Aviso Financial Inc. | 0 | -100,00 | 0 | |||||
| 2026-02-04 | 13F | Pensionmark Financial Group, Llc | 6.089 | 95,41 | 230 | 13,93 | ||||
| 2026-02-23 | 13F | Mv Capital Management, Inc. | 12 | 1 | ||||||
| 2025-11-14 | 13F | AXA Investment Managers S.A. | 379.092 | 24.508 | ||||||
| 2026-03-26 | 13F/A | Peak6 Llc | 0 | -100,00 | 0 | -100,00 | ||||
| 2026-02-17 | 13F | Capital Fund Management S.a. | Call | 47.300 | -58,10 | 3.486 | -52,25 | |||
| 2026-02-10 | 13F | PCJ Investment Counsel Ltd. | 74.230 | 8,16 | 5.475 | 23,40 | ||||
| 2026-02-12 | 13F | Hrt Financial Lp | 16.644 | 19,08 | 1 | |||||
| 2026-02-12 | 13F | Zevin Asset Management Llc | 4.390 | 0,00 | 323 | |||||
| 2026-02-12 | 13F | Burkett Asset Management Ltd | 4.365 | 322 | ||||||
| 2026-03-06 | 13F | Hsbc Holdings Plc | 0 | -100,00 | 0 | |||||
| 2026-03-06 | 13F | Hsbc Holdings Plc | Call | 0 | -100,00 | 0 | ||||
| 2026-02-13 | 13F | American Century Companies Inc | 516.449 | 14,55 | 38.090 | 30,65 | ||||
| 2026-04-22 | 13F | Princeton Global Asset Management LLC | 650 | 0,00 | 45 | -4,26 | ||||
| 2026-02-06 | 13F | Global Retirement Partners, LLC | 493 | -87,13 | 36 | -85,43 | ||||
| 2026-02-17 | 13F | Fairfax Financial Holdings Ltd/ Can | 359.100 | 0,00 | 26.488 | 14,13 | ||||
| 2026-04-14 | 13F | Nbc Securities, Inc. | 170 | 0,00 | 12 | -8,33 | ||||
| 2026-02-17 | 13F | Royal Bank Of Canada | 81.860.943 | -17,89 | 6.032.333 | -6,41 | ||||
| 2026-02-04 | 13F | Kepler Cheuvreux (Suisse) SA | 246.523 | 85,69 | 24.959 | 109,06 | ||||
| 2026-02-17 | 13F | Northern Trust Corp | 894.087 | 4,95 | 65.885 | 19,63 | ||||
| 2026-04-13 | 13F | Artemis Investment Management LLP | 1.226.186 | 120,28 | 85.050 | 107,16 | ||||
| 2026-02-12 | 13F | Groupe la Francaise | 0 | -100,00 | 0 | |||||
| 2026-04-22 | 13F | Spire Wealth Management | 650 | 0,00 | 45 | -4,26 | ||||
| 2026-02-17 | 13F | Credit Agricole S A | 41.242 | 13,62 | 3.039 | 29,54 | ||||
| 2026-04-24 | 13F | Sumitomo Mitsui DS Asset Management Company, Ltd | 8.584 | 4,34 | 595 | -1,98 | ||||
| 2026-04-13 | 13F | Fiduciary Financial Group, Llc | 4.807 | -3,84 | 333 | -9,51 | ||||
| 2026-04-22 | 13F | Louisbourg Investments Inc. | 89.518 | 15,90 | 6.195 | 8,61 | ||||
| 2026-02-13 | 13F | 1832 Asset Management L.P. | 18.761.273 | 4,62 | 1.382.518 | 19,25 | ||||
| 2026-02-13 | 13F | BNP Paribas Asset Management Holding S.A. | 334.976 | 34 | ||||||
| 2026-04-08 | 13F | Dynamic Advisor Solutions LLC | 15.318 | 1,95 | 1.062 | -4,16 | ||||
| 2026-04-21 | 13F | PDS Planning, Inc | 6.408 | -4,47 | 444 | -10,12 | ||||
| 2026-01-20 | 13F | Cigna Investments Inc /new | 22.042 | -1,40 | 2 | 0,00 | ||||
| 2026-02-17 | 13F | Oddo Bhf Asset Management Sas | 100.400 | -21,50 | 10.163 | -11,70 | ||||
| 2026-02-13 | 13F | Ossiam | 16.177 | -68,14 | 1.195 | -63,64 | ||||
| 2026-04-16 | 13F | SG Americas Securities, LLC | Call | 0 | -100,00 | 0 | ||||
| 2026-04-16 | 13F | SG Americas Securities, LLC | Put | 0 | -100,00 | 0 | ||||
| 2026-04-24 | 13F | Medallion Wealth Advisors, LLC | 100 | 0,00 | 7 | -14,29 | ||||
| 2026-02-17 | 13F | Toronto Dominion Bank | 22.172.775 | 23,74 | 1.635.358 | 41,16 | ||||
| 2026-02-17 | 13F | Toronto Dominion Bank | Put | 3.263.800 | 20,56 | 240.721 | 37,55 | |||
| 2026-01-23 | 13F | Bridgewater Advisors Inc. | 3.905 | 0,44 | 288 | 12,50 | ||||
| 2026-02-17 | 13F | Toronto Dominion Bank | Call | 1.116.100 | -14,32 | 82.318 | -2,25 | |||
| 2026-04-24 | 13F | Keybank National Association/oh | 25.475 | 19,63 | 1.766 | 12,49 | ||||
| 2026-02-06 | 13F | Addison Advisors LLC | 3.040 | -2,66 | 224 | 11,44 | ||||
| 2026-02-06 | 13F | Leonteq Securities AG | 3 | -92,31 | 0 | -100,00 | ||||
| 2026-02-13 | 13F | Korea Investment CORP | 839.579 | 4,87 | 62.003 | 19,75 | ||||
| 2026-02-17 | 13F | Canada Pension Plan Investment Board | 10.770.460 | 22,81 | 794.372 | 40,11 | ||||
| 2026-04-23 | 13F | SJS Investment Consulting Inc. | 170 | 0,00 | 12 | -8,33 | ||||
| 2026-02-13 | 13F | Macquarie Group Ltd | 0 | -100,00 | 0 | |||||
| 2025-11-17 | 13F | Abel Hall, LLC | 0 | -100,00 | 0 | -100,00 | ||||
| 2026-02-06 | 13F | GPS Wealth Strategies Group, LLC | 0 | -100,00 | 0 | |||||
| 2026-02-13 | 13F | National Bank Of Canada /fi/ | 17.824.075 | 4,17 | 1.313.657 | 18,80 | ||||
| 2026-02-17 | 13F | Raymond James Financial Inc | 26.506 | 6,14 | 1.953 | 21,00 | ||||
| 2026-02-13 | 13F | Police & Firemen's Retirement System of New Jersey | 167.412 | -7,14 | 12.363 | 6,04 | ||||
| 2026-04-21 | 13F | Financial Consulate, Inc | 12 | 0,00 | 1 | |||||
| 2026-02-17 | 13F | BCV Asset Management Inc. | 965.514 | 101.159 | ||||||
| 2026-02-12 | 13F | JPL Wealth Management, LLC | 0 | -100,00 | 0 | |||||
| 2026-02-17 | 13F | Amundi | 2.960.899 | -3,20 | 222.436 | 8,27 | ||||
| 2026-04-23 | 13F | Forum Financial Management, LP | 0 | -100,00 | 0 | |||||
| 2026-02-18 | 13F | State of Tennessee, Treasury Department | 694.739 | -1,95 | 52.228 | 13,97 | ||||
| 2026-02-17 | 13F | Man Group plc | 258.385 | 11,23 | 19.068 | 26,93 | ||||
| 2026-02-10 | 13F | CIBC Asset Management Inc | 9.857.887 | 0,59 | 730.958 | 14,98 | ||||
| 2026-01-15 | 13F | Cohen Investment Advisors LLC | 6.955 | -3,88 | 513 | 9,64 | ||||
| 2026-01-30 | 13F/A | M&t Bank Corp | 8.063 | 594 | ||||||
| 2026-02-11 | 13F | Clearbridge Investments, LLC | 2.046.439 | -9,15 | 150.802 | 3,55 | ||||
| 2026-04-17 | 13F | Cidel Asset Management Inc | 161.500 | 11,40 | 11.164 | 4,27 | ||||
| 2026-01-30 | 13F | Lincluden Management Ltd | 671.166 | -3,90 | 68 | 52,27 | ||||
| 2025-11-13 | 13F | Twin Tree Management, LP | 0 | -100,00 | 0 | -100,00 | ||||
| 2026-04-22 | 13F | Coston, McIsaac & Partners | 501 | 0,00 | 0 | |||||
| 2026-01-22 | 13F | Bear Mountain Capital, Inc. | 0 | -100,00 | 0 | |||||
| 2026-02-11 | 13F | Westerkirk Capital Inc. | 3.536 | -93,24 | 261 | -92,31 | ||||
| 2026-04-08 | 13F | Eldred Rock Partners, LLC | 205.596 | -0,95 | 14.250 | -6,84 | ||||
| 2026-04-07 | 13F | Eastern Bank | 393 | 0,00 | 27 | -3,57 | ||||
| 2026-02-13 | 13F | Kestra Advisory Services, LLC | 4.136 | 305 | ||||||
| 2026-04-08 | 13F | Wealth Enhancement Advisory Services, Llc | 24.795 | -13,76 | 1.739 | -16,28 | ||||
| 2026-02-02 | 13F | Benjamin Edwards Inc | 3.325 | -17,88 | 245 | -6,13 | ||||
| 2026-02-04 | 13F | Swiss Life Asset Management Ltd | 215.787 | 18,74 | 15.914 | 35,24 | ||||
| 2026-02-13 | 13F | Capula Management Ltd | Put | 18.600 | 0,00 | 1.371 | 13,98 | |||
| 2026-02-13 | 13F | MAI Capital Management | 1.268 | 0,56 | 93 | 14,81 | ||||
| 2026-02-13 | 13F | Capula Management Ltd | 1.015 | -86,40 | 75 | -84,65 | ||||
| 2026-04-21 | 13F | Vise Technologies, Inc. | 26.537 | 0,00 | 1.956 | 0,00 | ||||
| 2026-02-17 | 13F | Alphadyne Asset Management, LLC | Put | 10.700 | 0,00 | 788 | 14,04 | |||
| 2026-02-05 | 13F | 1620 Investment Advisors, Inc. | 4.657 | 0,15 | 343 | 14,33 | ||||
| 2026-01-16 | 13F | Trust Co Of Vermont | 250 | 0,00 | 18 | 12,50 | ||||
| 2026-02-13 | 13F | Kilter Group LLC | 25 | 257,14 | 2 | |||||
| 2026-04-06 | 13F | Versant Capital Management, Inc | 10.450 | 26,59 | 724 | 19,08 | ||||
| 2026-01-27 | 13F | GHP Investment Advisors, Inc. | 0 | -100,00 | 0 | |||||
| 2026-02-11 | 13F | Tacita Capital Inc | 38.943 | 15,38 | 2.874 | 31,61 | ||||
| 2026-02-17 | 13F | Lazard Asset Management Llc | 102.293 | 0,07 | 7.545 | 14,16 | ||||
| 2026-02-10 | 13F | State of Wyoming | 16.260 | -4,41 | 1.201 | 9,09 | ||||
| 2026-01-29 | 13F | Aprio Wealth Management, LLC | 3.233 | 238 | ||||||
| 2025-10-30 | 13F | Ridgewood Investments LLC | 0 | -100,00 | 0 | |||||
| 2026-02-09 | 13F | Harbour Investments, Inc. | 933 | 0,00 | 69 | 13,33 | ||||
| 2026-02-12 | 13F | Voya Investment Management Llc | 124.122 | -2,52 | 9.166 | 11,31 | ||||
| 2026-02-12 | 13F | Fiduciary Group LLC | 2.847 | 210 | ||||||
| 2026-01-13 | 13F | Kathmere Capital Management, LLC | 3.298 | -0,60 | 243 | 13,55 | ||||
| 2026-02-13 | 13F | Royal London Asset Management Ltd | 211.912 | -0,08 | 15.616 | 13,89 | ||||
| 2026-01-22 | 13F | Massachusetts Financial Services Co /ma/ | 72.165 | -0,29 | 5.318 | 13,66 | ||||
| 2026-02-13 | 13F | Rhumbline Advisers | 6.813 | -11,94 | 502 | 0,40 | ||||
| 2026-02-12 | 13F | Brinker Capital Investments, LLC | 19.776 | 13,87 | 1.457 | 29,86 | ||||
| 2026-04-09 | 13F | Keystone Financial Planning, Inc. | 139.101 | 0,00 | 9.641 | -5,94 | ||||
| 2026-02-12 | 13F | Bank Of Nova Scotia Trust Co | 211.386 | 5,15 | 15.577 | 19,86 | ||||
| 2026-02-13 | 13F | PARK CIRCLE Co | 10.500 | 0,00 | 774 | 14,01 | ||||
| 2026-02-11 | 13F | Barrow Hanley Mewhinney & Strauss Llc | 3.326.510 | -5,34 | 245.131 | 7,90 | ||||
| 2025-11-14 | 13F | Skopos Labs, Inc. | 0 | -100,00 | 0 | |||||
| 2026-04-24 | 13F | Abacus Wealth Partners, LLC | 21.318 | -15,52 | 1.478 | -20,55 | ||||
| 2026-02-13 | 13F | Great West Life Assurance Co /can/ | 707.477 | -16,19 | 52 | -3,70 | ||||
| 2026-02-17 | 13F | Ameriprise Financial Inc | 274.292 | -4,54 | 20.809 | 8,39 | ||||
| 2026-02-10 | 13F/A | Northwestern Mutual Wealth Management Co | 3.193 | 8,09 | 235 | 23,04 | ||||
| 2026-04-09 | 13F | Tompkins Financial Corp | 1.300 | 0,00 | 90 | -5,26 | ||||
| 2026-04-10 | 13F | Magnus Financial Group LLC | 6.412 | 0,03 | 444 | -5,93 | ||||
| 2026-01-20 | 13F | Savvy Advisors, Inc. | 6.509 | 480 | ||||||
| 2026-02-10 | 13F | Intech Investment Management Llc | 821.778 | 354,67 | 60.688 | 419,19 | ||||
| 2026-02-13 | 13F | Dixon Mitchell Investment Counsel Inc. | 9.309 | 63,55 | 726 | 80,60 | ||||
| 2026-02-17 | 13F | Bank Of America Corp /de/ | Call | 0 | -100,00 | 0 | -100,00 | |||
| 2026-04-22 | 13F | Advocate Investing Services LLC | 75 | 0,00 | 5 | 0,00 | ||||
| 2026-02-12 | 13F | Renaissance Technologies Llc | 388.700 | -56,79 | 28.643 | -50,75 | ||||
| 2026-02-17 | 13F | Caisse De Depot Et Placement Du Quebec | 531.388 | -22,72 | 39.243 | -11,76 | ||||
| 2026-02-02 | 13F | Intact Investment Management Inc. | 433.662 | -73,65 | 31.983 | -69,95 | ||||
| 2026-04-23 | 13F | MQS Management LLC | 10.593 | 734 | ||||||
| 2025-11-07 | 13F | Sierra Ocean, Llc | 0 | -100,00 | 0 | |||||
| 2026-04-06 | 13F | Highline Wealth Partners Llc | 204 | 0,00 | 14 | -6,67 | ||||
| 2026-02-13 | 13F | Walleye Capital LLC | Put | 8.200 | 100,00 | 604 | 127,92 | |||
| 2026-04-20 | 13F | Cardinal Point Capital Management, ULC | 215.525 | -2,02 | 14.916 | -8,18 | ||||
| 2026-02-13 | 13F | Walleye Capital LLC | Call | 89.200 | 541,73 | 6.573 | 631,96 | |||
| 2026-02-05 | 13F | Td Private Client Wealth Llc | 21 | 2 | ||||||
| 2026-02-13 | 13F | Sei Investments Co | 24.520 | 11,86 | 1.807 | 27,45 | ||||
| 2026-04-20 | 13F | Jfs Wealth Advisors, Llc | 142 | 0,00 | 10 | -10,00 | ||||
| 2025-10-27 | 13F | Farmers & Merchants Trust Co of Chambersburg PA | 0 | -100,00 | 0 | |||||
| 2026-02-10 | 13F | Connor, Clark & Lunn Investment Management Ltd. | 10.187.643 | 32,46 | 751.366 | 51,12 | ||||
| 2026-02-13 | 13F | Corient IA LLC | 2.980 | -40,40 | 220 | -32,20 | ||||
| 2026-02-17 | 13F | Mercer Global Advisors Inc /adv | 9.611 | 3,60 | 708 | 18,20 | ||||
| 2026-02-17 | 13F | Susquehanna International Group, Llp | 14.641 | 73,16 | 1.079 | 97,44 | ||||
| 2026-04-24 | 13F | Peregrine Asset Advisers, Inc. | 3.340 | 0,00 | 231 | -6,10 | ||||
| 2026-02-13 | 13F | Towarzystwo Funduszy Inwestycyjnych Pzu Sa | 0 | -100,00 | 0 | |||||
| 2026-02-13 | 13F | JustInvest LLC | 38.758 | 6,02 | 2.856 | 20,86 | ||||
| 2026-02-03 | 13F | Chesapeake Capital Corp /il/ | 18.768 | 0,00 | 1.383 | 14,01 | ||||
| 2026-02-12 | 13F | Brown Brothers Harriman & Co | 467 | 34 | ||||||
| 2026-02-17 | 13F | Susquehanna International Group, Llp | Put | 135.300 | -25,70 | 9.970 | -15,31 | |||
| 2026-01-14 | 13F | Advisors Management Group Inc /adv | 30.150 | -40,20 | 2 | -33,33 | ||||
| 2026-02-17 | 13F | Susquehanna International Group, Llp | Call | 96.300 | -21,83 | 7.096 | -10,90 | |||
| 2026-02-17 | 13F | Fmr Llc | 22.457 | 2,28 | 1.656 | 16,70 | ||||
| 2026-02-17 | 13F | PDT Partners, LLC | 83.200 | 0,00 | 6.131 | 14,00 | ||||
| 2026-02-09 | 13F | Westover Capital Advisors, LLC | 6.400 | 0,00 | 472 | 14,04 | ||||
| 2026-01-07 | 13F | Sagespring Wealth Partners, Llc | 4.269 | 2,67 | 315 | 17,16 | ||||
| 2026-04-22 | 13F | Janney Montgomery Scott LLC | 10.933 | -3,49 | 1 | |||||
| 2026-02-18 | 13F | Mackenzie Financial Corp | 9.667.000 | -34,23 | 713.755 | -24,89 | ||||
| 2026-03-12 | 13F/A | Peak6 Llc | Call | 42.100 | -72,75 | 3.102 | -68,94 | |||
| 2026-01-29 | 13F | Munich Reinsurance Co Stock Corp in Munich | 2.104 | 0,00 | 156 | 13,97 | ||||
| 2026-04-07 | 13F | Farther Finance Advisors, LLC | 13.130 | 171,06 | 922 | 158,71 | ||||
| 2026-02-17 | 13F | Two Sigma Advisers, Lp | 0 | -100,00 | 0 | |||||
| 2026-02-12 | 13F | Quadrant Capital Group Llc | 46.683 | 0,00 | 3.440 | 13,98 | ||||
| 2026-02-13 | 13F | Bollard Group LLC | 916 | 0,22 | 0 | |||||
| 2026-02-06 | 13F | Entrust Financial Llc | 116 | 9 | ||||||
| 2025-11-13 | 13F | Glenmede Investment Management, LP | 0 | -100,00 | 0 | |||||
| 2026-02-06 | 13F | Pnc Financial Services Group, Inc. | 21.092 | 5,63 | 1.554 | 20,47 | ||||
| 2026-02-13 | 13F | Morgan Stanley | 5.110.450 | 17,84 | 376.589 | 34,32 | ||||
| 2026-01-29 | 13F | Dunhill Financial, LLC | 1.371 | 0,00 | 101 | 14,77 | ||||
| 2026-01-23 | 13F | Assetmark, Inc | 59 | 210,53 | 4 | 300,00 | ||||
| 2026-02-17 | 13F | Grantham, Mayo, Van Otterloo & Co. LLC | 825.124 | 9,65 | 60.881 | 25,11 | ||||
| 2026-02-10 | 13F | Td Asset Management Inc | 18.674.585 | 1,69 | 1.379.120 | 16,12 | ||||
| 2026-04-07 | 13F | Five Oceans Advisors | 3.938 | 0,00 | 273 | -6,21 | ||||
| 2026-02-03 | 13F | Generali Asset Management SPA SGR | 127.615 | 3,94 | 12.918 | 16,93 | ||||
| 2026-04-24 | 13F | Smithbridge Asset Management Inc/de | 0 | -100,00 | 0 | |||||
| 2026-02-17 | 13F | Balyasny Asset Management Llc | 8.957 | -91,62 | 661 | -90,45 | ||||
| 2026-04-24 | 13F | Yousif Capital Management, Llc | 10.451 | 0,00 | 724 | -5,36 | ||||
| 2026-02-13 | 13F | Smartleaf Asset Management LLC | 1.832 | 133,97 | 136 | 170,00 | ||||
| 2026-01-30 | 13F | Mitsubishi UFJ Trust & Banking Corp | 18.808 | -64,74 | 1.371 | -60,28 | ||||
| 2026-02-13 | 13F | Resources Management Corp /ct/ /adv | 35 | 0,00 | 0 | |||||
| 2026-02-06 | 13F | BOK Financial Private Wealth, Inc. | 368 | 0,00 | 27 | 17,39 | ||||
| 2026-04-17 | 13F | Monticello Wealth Management, Llc | 8.903 | -2,12 | 617 | -7,91 | ||||
| 2026-02-17 | 13F | Agf Management Ltd | 376.688 | -3,05 | 38.132 | 9,06 | ||||
| 2026-01-23 | 13F | Nbt Bank N A /ny | 1.000 | 0,00 | 74 | 14,06 | ||||
| 2026-04-22 | 13F | Pinnacle Bancorp, Inc. | 735 | 0,00 | 51 | -7,41 | ||||
| 2026-02-10 | 13F | WCG Wealth Advisors LLC | 12.145 | 895 | ||||||
| 2026-02-13 | 13F | Verition Fund Management LLC | 0 | -100,00 | 0 | |||||
| 2026-04-13 | 13F | Massmutual Trust Co Fsb/adv | 526 | -39,47 | 36 | -43,75 | ||||
| 2026-04-15 | 13F | Radnor Capital Management, LLC | 13.275 | 0,00 | 920 | -5,93 | ||||
| 2026-02-12 | 13F | Nuveen, LLC | 867.929 | -0,15 | 64.097 | 14,01 | ||||
| 2026-02-11 | 13F | Syon Capital Llc | 7.561 | 557 | ||||||
| 2026-04-20 | 13F | City State Bank | 1.655 | 0,00 | 115 | -5,79 | ||||
| 2026-02-13 | 13F | Transamerica Financial Advisors, Inc. | 4.173 | 308 | ||||||
| 2026-01-05 | 13F | Catherine Avery Investment Management LLC | 0 | -100,00 | 0 | |||||
| 2026-02-17 | 13F | Citadel Advisors Llc | Put | 61.500 | 3,54 | 4.532 | 17,99 | |||
| 2026-02-17 | 13F | Captrust Financial Advisors | 40.504 | 1,27 | 2.985 | 15,44 | ||||
| 2026-04-15 | 13F | Financial Management Professionals, Inc. | 124 | -32,24 | 9 | -38,46 | ||||
| 2026-04-17 | 13F | Bell Investment Advisors, Inc | 178 | -18,35 | 12 | -25,00 | ||||
| 2025-11-14 | 13F | ExodusPoint Capital Management, LP | 91.822 | 5.936 | ||||||
| 2026-02-12 | 13F | Skandinaviska Enskilda Banken AB (publ) | 235.924 | 23,06 | 17.385 | 40,27 | ||||
| 2026-02-11 | 13F | Picton Mahoney Asset Management | 128.612 | -38,94 | 9.499 | 72.961,54 | ||||
| 2026-02-11 | 13F | Coleford Investment Management Ltd. | 200.326 | -2,38 | 14.783 | 11,54 | ||||
| 2026-02-17 | 13F | Citadel Advisors Llc | Call | 81.000 | -68,67 | 5.969 | -64,29 | |||
| 2025-11-14 | 13F | Mount Yale Investment Advisors, LLC | 0 | -100,00 | 0 | -100,00 | ||||
| 2026-01-22 | 13F | Westbourne Investments, Inc. | 2.900 | 214 | ||||||
| 2026-02-17 | 13F | Citadel Advisors Llc | 161.443 | 120,96 | 11.897 | 151,87 | ||||
| 2025-11-14 | 13F | Squarepoint Ops LLC | 0 | -100,00 | 0 | -100,00 | ||||
| 2026-04-22 | 13F | Viewpoint Investment Partners Corp | 18.381 | 1.296 | ||||||
| 2026-01-23 | 13F | LOM Asset Management Ltd | 1.270 | 129 | ||||||
| 2026-01-26 | 13F | Asset Dedication, LLC | 200 | 0,00 | 15 | 16,67 | ||||
| 2026-02-12 | 13F | Rossby Financial, LCC | 31 | 55,00 | 2 | 100,00 | ||||
| 2026-02-17 | 13F | Trexquant Investment LP | 71.091 | 5.239 | ||||||
| 2026-04-22 | 13F | Pictet Asset Management Holding SA | 763.160 | -2,90 | 52.719 | -9,17 | ||||
| 2026-02-12 | 13F | CIBC Private Wealth Group, LLC | 1.578 | -15,97 | 116 | -4,13 | ||||
| 2026-02-05 | 13F | High Note Wealth, LLC | 4 | 0,00 | 0 | |||||
| 2026-02-13 | 13F | Y-Intercept (Hong Kong) Ltd | 0 | -100,00 | 0 | |||||
| 2026-02-17 | 13F | Snowden Capital Advisors LLC | 6.216 | -17,47 | 458 | -5,76 | ||||
| 2026-04-15 | 13F | Fortitude Family Office, LLC | 0 | -100,00 | 0 | |||||
| 2026-01-27 | 13F | Jackson, Grant Investment Advisers, Inc. | 700 | 0,00 | 52 | 13,33 | ||||
| 2026-01-12 | 13F | CVA Family Office, LLC | 96 | 0,00 | 7 | 16,67 | ||||
| 2026-04-07 | 13F | Signaturefd, Llc | 23.542 | 1,90 | 1.632 | -4,17 | ||||
| 2026-02-12 | 13F | Aviva Plc | 1.121.887 | 5,35 | 82.807 | 20,36 | ||||
| 2026-02-12 | 13F | Barometer Capital Management Inc. | 0 | -100,00 | 0 | |||||
| 2026-02-09 | 13F | Genus Capital Management Inc. | 42.020 | 4,60 | 3.103 | 19,44 | ||||
| 2026-01-27 | 13F | Zurcher Kantonalbank (Zurich Cantonalbank) | 603.656 | 2,14 | 44.580 | 16,63 | ||||
| 2026-02-17 | 13F | DV Trading LLC | 100 | 7 | ||||||
| 2026-01-29 | 13F | IMC-Chicago, LLC | Put | 40.500 | -20,74 | 2.984 | -9,66 | |||
| 2026-01-29 | 13F | IMC-Chicago, LLC | Call | 42.800 | -25,69 | 3.154 | -15,31 | |||
| 2026-02-13 | 13F | Candriam Luxembourg S.C.A. | 21.687 | 20,34 | 1.602 | 37,42 | ||||
| 2026-02-13 | 13F | Arrowstreet Capital, Limited Partnership | 13.700 | -82,37 | 1.010 | -79,90 | ||||
| 2026-01-29 | 13F | D.a. Davidson & Co. | 3.013 | 222 | ||||||
| 2026-01-27 | 13F | Bayforest Capital Ltd | 0 | -100,00 | 0 | |||||
| 2025-11-06 | 13F | Wealthstream Advisors, Inc. | 3.094 | 200 | ||||||
| 2026-02-04 | 13F | Global Wealth Management Investment Advisory, Inc. | 3.420 | 0,00 | 252 | 14,03 | ||||
| 2026-02-17 | 13F | D. E. Shaw & Co., Inc. | Call | 1.901.000 | 2,72 | 140.220 | 17,21 | |||
| 2026-02-17 | 13F | D. E. Shaw & Co., Inc. | Put | 3.389.000 | 50,21 | 249.977 | 71,40 | |||
| 2026-02-17 | 13F | Maryland State Retirement & Pension System | 205.623 | 1,24 | 15.173 | 15,56 | ||||
| 2026-02-17 | 13F | D. E. Shaw & Co., Inc. | 63.268 | -50,69 | 4.667 | -43,74 | ||||
| 2026-02-10 | 13F | Bank of New York Mellon Corp | 1.205.101 | -6,14 | 88.804 | 6,99 | ||||
| 2026-02-13 | 13F | Charles Schwab Investment Management Inc | 4.130.396 | 1,94 | 305.030 | 16,40 | ||||
| 2026-02-17 | 13F | DZ BANK AG Deutsche Zentral Genossenschafts Bank, Frankfurt am Main | 1 | 0 | ||||||
| 2026-04-17 | 13F | Sara-Bay Financial | 4.410 | -9,17 | 306 | -15,04 | ||||
| 2026-02-12 | 13F | Principal Securities, Inc. | 9.544 | 33,69 | 703 | 52,49 | ||||
| 2026-02-17 | 13F | Capital Fund Management S.a. | 203.252 | 55,82 | 14.978 | 77,60 | ||||
| 2026-02-02 | 13F | Truist Financial Corp | 11.718 | -1,93 | 864 | 11,79 | ||||
| 2026-02-13 | 13F | Ubs Asset Management Americas Inc | 679 | -97,61 | 50 | -97,28 | ||||
| 2026-02-10 | 13F | Bnp Paribas Arbitrage, Sa | 9.397 | -90,26 | 692 | -88,90 | ||||
| 2026-02-10 | 13F | Hillsdale Investment Management Inc. | 1.153.861 | 5,40 | 85.253 | 20,46 | ||||
| 2026-02-13 | 13F | Walleye Trading LLC | Put | 7.700 | -18,09 | 567 | -6,59 | |||
| 2026-02-04 | 13F | Plato Investment Management Ltd | 32.344 | 24,24 | 2.400 | 43,63 | ||||
| 2026-02-13 | 13F | Walleye Trading LLC | Call | 46.400 | -11,11 | 3.419 | 1,33 | |||
| 2026-02-13 | 13F | Neuberger Berman Group LLC | 506.860 | 8,79 | 37.429 | 24,22 | ||||
| 2026-02-03 | 13F | Crossmark Global Holdings, Inc. | 138.826 | -7,01 | 10.230 | 5,99 | ||||
| 2025-10-30 | 13F | Twin Peaks Wealth Advisors, LLC | 0 | -100,00 | 0 | |||||
| 2025-11-14 | 13F | Numerai GP LLC | 0 | -100,00 | 0 | |||||
| 2026-02-11 | 13F | Franklin Resources Inc | 1.678.072 | 7,90 | 123.766 | 22,74 | ||||
| 2026-02-11 | 13F | Deutsche Bank Ag\ | 2.636.085 | 8,20 | 194.253 | 23,33 | ||||
| 2026-02-12 | 13F | Commonwealth Equity Services, Llc | 17.171 | -1,96 | 1.265 | 126.400,00 | ||||
| 2026-02-12 | 13F | Swiss Re Ltd | 410 | 30 | ||||||
| 2026-02-13 | 13F | Venture Visionary Partners LLC | 4.026 | 0,00 | 297 | 13,85 | ||||
| 2025-11-12 | 13F | NewSquare Capital LLC | 0 | -100,00 | 0 | |||||
| 2026-04-17 | 13F | Vermillion Wealth Management, Inc. | 51 | 0,00 | 4 | 0,00 | ||||
| 2026-01-26 | 13F | Lipe & Dalton | 125 | 0,00 | 0 | |||||
| 2026-02-13 | 13F | Evelyn Partners Investment Management LLP | 3.610 | -2,04 | 266 | 11,76 | ||||
| 2026-02-13 | 13F | Mufg Securities (canada), Ltd. | 1.882.429 | -8,44 | 138.866 | 4,47 | ||||
| 2026-04-16 | 13F | Rockland Trust Co | 3.977 | 0,00 | 276 | -6,14 | ||||
| 2026-04-22 | 13F | Motco | 14.248 | -0,09 | 988 | -6,00 | ||||
| 2026-02-13 | 13F | Pinnacle Wealth Planning Services, Inc. | 247 | 18 | ||||||
| 2026-04-21 | 13F | Maseco Llp | 436 | 30 | ||||||
| 2026-02-09 | 13F | Delta Asset Management Llc/tn | 450 | 0,00 | 33 | 13,79 | ||||
| 2026-02-11 | 13F | Capital Analysts, Inc. | 0 | -100,00 | 0 | |||||
| 2026-02-18 | 13F | GWM Advisors LLC | 21 | 5,00 | 2 | 0,00 | ||||
| 2026-02-17 | 13F | North Capital, Inc. | 0 | -100,00 | 0 | |||||
| 2025-11-13 | 13F | Marshall Wace, Llp | 8.974 | 580 | ||||||
| 2026-04-15 | 13F | Avanza Fonder AB | 86.882 | 9,34 | 8.382 | 4,20 | ||||
| 2026-02-12 | 13F | Penserra Capital Management LLC | 75 | -3,85 | 0 | |||||
| 2026-02-02 | 13F | Fifth Third Bancorp | 688 | 79,17 | 51 | 108,33 | ||||
| 2026-02-06 | 13F | Cumberland Partners Ltd | 552.819 | 89,28 | 40.796 | 116,07 | ||||
| 2026-02-06 | 13F | Lsv Asset Management | 2.700 | 0,00 | 0 | |||||
| 2025-11-14 | 13F | Wetherby Asset Management Inc | 38.758 | 4,52 | 2.506 | 22,25 | ||||
| 2025-11-12 | 13F | Burgundy Asset Management Ltd. | 1.199.190 | -0,13 | 74.847 | 12,93 | ||||
| 2026-02-13 | 13F | Walleye Trading LLC | 8.745 | -35,45 | 644 | -26,40 | ||||
| 2026-02-09 | 13F | Geode Capital Management, Llc | 12.259.989 | 6,98 | 923.232 | 22,43 | ||||
| 2026-01-30 | 13F | Bogart Wealth, LLC | 13.694 | 2,45 | 1.009 | 16,78 | ||||
| 2026-02-13 | 13F | Toroso Investments, LLC | 18.768 | 0,00 | 1.383 | 14,01 | ||||
| 2026-02-12 | 13F | Ensign Peak Advisors, Inc | 49.406 | 0,00 | 3.649 | 14,18 | ||||
| 2026-02-12 | 13F | BRYN MAWR TRUST Co | 900 | -55,00 | 66 | -48,84 | ||||
| 2026-02-03 | 13F | Ballentine Partners, LLC | 15.163 | -0,72 | 1.117 | 13,17 | ||||
| 2026-02-10 | 13F | Private Wealth Asset Management, LLC | 28 | 0,00 | 2 | 100,00 | ||||
| 2026-02-13 | 13F | Quarry LP | 0 | -100,00 | 0 | |||||
| 2026-01-21 | 13F/A | Euro Pacific Asset Management, LLC | 173.579 | -1,14 | 11 | 0,00 | ||||
| 2025-11-07 | 13F | Shell Asset Management Co | 27.031 | -56,05 | 2 | -66,67 | ||||
| 2026-02-06 | 13F | HighTower Advisors, LLC | 7.873 | 5,03 | 580 | 19,83 | ||||
| 2026-02-17 | 13F | Guggenheim Capital Llc | 8.654 | -12,84 | 638 | -0,62 | ||||
| 2026-02-13 | 13F | Barclays Plc | 988.436 | 213,24 | 72.838 | 257,04 | ||||
| 2026-01-27 | 13F | Evergreen Capital Management Llc | 7.544 | -7,53 | 556 | 5,31 | ||||
| 2026-02-03 | 13F | ASR Vermogensbeheer N.V. | 36.686 | 0,00 | 2.709 | 14,21 | ||||
| 2026-02-17 | 13F | EFG International AG | 865 | 64 | ||||||
| 2026-02-17 | 13F | Advisor Group Holdings, Inc. | 20.601 | -23,97 | 1.518 | -11,44 | ||||
| 2025-11-13 | 13F | Healthcare Of Ontario Pension Plan Trust Fund | Call | 0 | -100,00 | 0 | -100,00 | |||
| 2026-02-10 | 13F | CIBC World Markets Inc. | Put | 1.121.800 | 15,44 | 82.744 | 31,71 | |||
| 2026-02-10 | 13F | CIBC World Markets Inc. | Call | 749.500 | -37,83 | 55.283 | -29,07 | |||
| 2026-02-03 | 13F | Koshinski Asset Management, Inc. | 3.467 | 0,26 | 255 | 14,35 | ||||
| 2026-02-06 | 13F/A | Rathbone Brothers plc | 131.118 | -1,10 | 9.683 | 12,95 | ||||
| 2026-02-10 | 13F | CIBC World Markets Inc. | 28.572.101 | 8,47 | 2.107.478 | 23,75 | ||||
| 2026-02-12 | 13F | Bank Of Montreal /can/ | Call | 934.400 | 55,14 | 68.916 | 76,99 | |||
| 2026-02-12 | 13F | Bank Of Montreal /can/ | Put | 235.000 | -59,99 | 17.332 | -54,35 | |||
| 2026-02-12 | 13F | Bank Of Montreal /can/ | 57.900.307 | 7,49 | 4.270.422 | 22,63 | ||||
| 2026-01-20 | 13F | Ascent Group, LLC | 3.523 | 2,47 | 260 | 16,67 | ||||
| 2026-02-11 | 13F | Parallel Advisors, LLC | 3.222 | -3,13 | 237 | 10,23 | ||||
| 2026-02-17 | 13F | Zurich Insurance Group Ltd/FI | 0 | -100,00 | 0 | |||||
| 2026-02-09 | 13F | Legal & General Group Plc | 8.483.129 | 5,42 | 626.478 | 20,38 | ||||
| 2025-11-14 | 13F | Jain Global LLC | 0 | -100,00 | 0 | |||||
| 2026-04-13 | 13F | Baskin Financial Services Inc. | 0 | -100,00 | 0 | |||||
| 2026-02-13 | 13F | Bank Of Nova Scotia | 63.175 | 0,00 | 4.659 | 14,05 | ||||
| 2026-04-23 | 13F | North Star Investment Management Corp. | 714 | 0,85 | 49 | -5,77 | ||||
| 2026-02-03 | 13F | Retirement Planning Group | 10.988 | 0,00 | 810 | 13,94 | ||||
| 2026-02-10 | 13F | Sivia Capital Partners, LLC | 9.705 | 62,10 | 715 | 84,75 | ||||
| 2026-02-10 | 13F | Norges Bank | 18.554.149 | 1.368.456 | ||||||
| 2026-02-09 | 13F | Mediolanum International Funds Ltd | 131.880 | -17,84 | 9.767 | -6,09 | ||||
| 2026-02-11 | 13F | 111 Capital | 3.994 | -84,71 | 295 | -82,57 | ||||
| 2026-02-06 | 13F | Alan B. Lancz & Associates, Inc. | 3.900 | 0,00 | 287 | 13,89 | ||||
| 2026-02-17 | 13F | Lombard Odier Asset Management (Switzerland) SA | 105.681 | -12,72 | 7.795 | -0,42 | ||||
| 2026-02-13 | 13F | Citigroup Inc | 1.425.283 | -6,05 | 105.257 | 7,28 | ||||
| 2026-02-10 | 13F | Texas Yale Capital Corp. | 8.975 | 7,73 | 661 | 22,86 | ||||
| 2026-02-12 | 13F | BlackRock, Inc. | 1.288.625 | 4,73 | 94.959 | 19,37 | ||||
| 2026-02-05 | 13F | Navalign, LLC | 211 | 16 | ||||||
| 2025-11-07 | 13F | Arnhold LLC | 0 | -100,00 | 0 |