Grundlæggende statistik
| Institutionelle ejere | 566 total, 525 long only, 0 short only, 41 long/short - change of -8,99% MRQ |
| Del pris | 99,50 |
| Gennemsnitlig porteføljeallokering | 0.3059 % - change of -15,00% MRQ |
| Institutionelle aktier (lange) | 54.941.596 (ex 13D/G) - change of -25,38MM shares -31,60% MRQ |
| Institutionel værdi (lang) | $ 6.751.437 USD ($1000) |
Institutionelt ejerskab og aktionærer
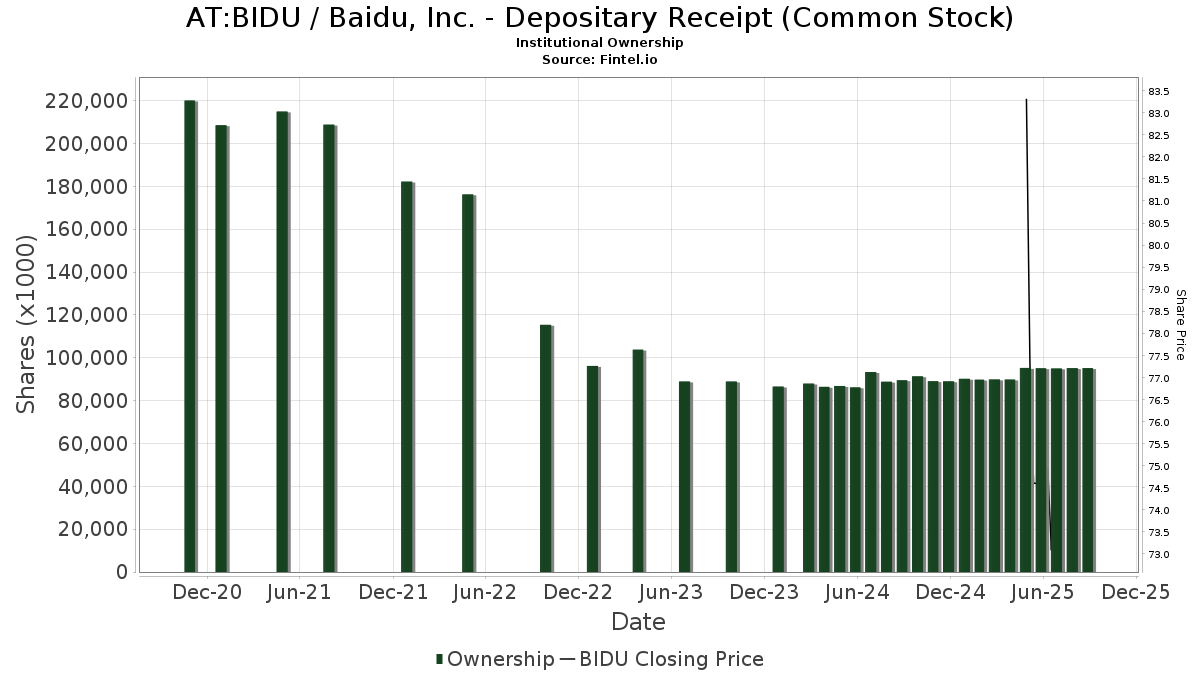
Baidu, Inc. - Depositary Receipt (Common Stock) (AT:BIDU) har 566 institutionelle ejere og aktionærer, der har indsendt 13D/G- eller 13F-formularer til Securities Exchange Commission (SEC). Disse institutioner har i alt 54,941,596 aktier. Største aktionærer omfatter Primecap Management Co/ca/, Susquehanna International Group, Llp, Citadel Advisors Llc, Morgan Stanley, Citadel Advisors Llc, Susquehanna International Group, Llp, IMC-Chicago, LLC, Jane Street Group, Llc, Jane Street Group, Llc, and IMC-Chicago, LLC .
Baidu, Inc. - Depositary Receipt (Common Stock) (WBAG:BIDU) institutionel ejerskabsstruktur viser aktuelle positioner i virksomheden efter institutioner og fonde, samt seneste ændringer i positionsstørrelse. Større aktionærer kan omfatte individuelle investorer, investeringsforeninger, hedgefonde eller institutioner. Skema 13D angiver, at investoren besidder (eller besidder) mere end 5 % af virksomheden og har til hensigt (eller har til hensigt at) aktivt at forfølge en ændring i forretningsstrategi. Skema 13G indikerer en passiv investering på over 5%.
The share price as of March 25, 2026 is 99,50 / share. Previously, on May 9, 2025, the share price was 77,30 / share. This represents an increase of 28,72% over that period.
Fondens stemningsscore
Fund Sentiment Score (fka Ownership Accumulation Score) finder de aktier, der bliver mest købt af fonde. Det er resultatet af en sofistikeret, multi-faktor kvantitativ model, der identificerer virksomheder med de højeste niveauer af institutionel akkumulering. Scoringsmodellen bruger en kombination af den samlede stigning i oplyste ejere, ændringerne i porteføljeallokeringer i disse ejere og andre målinger. Tallet går fra 0 til 100, hvor højere tal indikerer et højere niveau af akkumulering for sine jævnaldrende, og 50 er gennemsnittet.
Opdateringsfrekvens: Dagligt
Se Ownership Explorer, som giver en liste over højest rangerende virksomheder.
AI+ Ask Fintel’s AI assistant about Baidu, Inc. - Depositary Receipt (Common Stock).
Select a question to share a public post with an AI-crafted answer.
Thinking of good questions…
13F og NPORT arkivering
Detaljer om 13F-arkivering er gratis. Detaljer om NP-ansøgninger kræver et premium-medlemskab. Grønne rækker angiver nye positioner. Røde rækker angiver lukkede positioner. Klik på linket ikon for at se den fulde transaktionshistorik.
Opgrader
for at låse premium-data op og eksportere til Excel ![]() .
.
Important Note
In an effort to reduce load times for our mobile users, we are testing some ways to deliver lighter pages.
In this first test, we will deliver only the most recent 750 transactions (out of 814 for this stock). If you are interested in loading *all* the transactions for this company, click the "load all" button below. This is just a test and if you don't like it, please let us know by submitting some gentle feedback via the link at the bottom of this page.
Load All| Fil dato | Kilde | Investor | Type | Gennemsnitlig pris (Øst) |
Aktier | Δ Aktier (%) |
Rapporteret Værdi ($1000) |
Δ Værdi (%) |
Port Alloc (%) |
|
|---|---|---|---|---|---|---|---|---|---|---|
| 2026-02-13 | 13F | Lord, Abbett & Co. Llc | Call | 0 | -100,00 | 0 | ||||
| 2026-02-17 | 13F | Schonfeld Strategic Advisors LLC | 18.280 | 791,27 | 2.388 | 784,44 | ||||
| 2026-02-13 | 13F | Pathstone Holdings, LLC | 6.660 | 2,46 | 870 | 1,64 | ||||
| 2026-02-13 | 13F | Quaker Capital Investments, LLC | 111.100 | 0,00 | 14.516 | -0,84 | ||||
| 2025-10-27 | 13F | Belvedere Trading LLC | 0 | -100,00 | 0 | -100,00 | ||||
| 2026-02-17 | 13F | Shay Capital LLC | 32.500 | 56,25 | 4.246 | 54,96 | ||||
| 2026-02-17 | 13F | Cresset Asset Management, LLC | 9.887 | -33,21 | 1.292 | -33,79 | ||||
| 2026-02-12 | 13F | M&G Plc | 88.096 | 11,10 | 11.541 | 10,26 | ||||
| 2026-02-10 | 13F | Godfrey Financial Associates, Inc. | 3 | 0 | ||||||
| 2026-01-30 | 13F | Laurel Wealth Advisors LLC | 50 | 7 | ||||||
| 2026-01-21 | 13F | Flagship Harbor Advisors, Llc | 52 | 7 | ||||||
| 2026-01-22 | 13F | Financial Consulate, Inc | 6 | 1 | ||||||
| 2026-02-06 | 13F | Ignite Planners, LLC | 5.057 | -28,32 | 775 | -16,68 | ||||
| 2026-02-11 | 13F | SOUTH STATE Corp | 50 | 0,00 | 7 | 0,00 | ||||
| 2026-02-13 | 13F | Ausdal Financial Partners, Inc. | 1.610 | 210 | ||||||
| 2026-02-17 | 13F | Point72 Asset Management, L.P. | Call | 233.300 | 602,71 | 30.483 | 596,89 | |||
| 2026-02-17 | 13F | Point72 Asset Management, L.P. | 726.879 | 94.974 | ||||||
| 2026-02-17 | 13F | Schonfeld Strategic Advisors LLC | Call | 25.600 | -1,92 | 3.345 | -2,76 | |||
| 2026-02-06 | 13F | Vestmark Advisory Solutions, Inc. | 22.561 | 2.948 | ||||||
| 2026-02-17 | 13F | Schonfeld Strategic Advisors LLC | Put | 25.600 | -1,92 | 3.345 | -2,76 | |||
| 2026-02-17 | 13F | Point72 Asset Management, L.P. | Put | 24.700 | 605,71 | 3.227 | 600,00 | |||
| 2026-02-17 | 13F | Ninepoint Partners LP | 30 | 4 | ||||||
| 2025-11-13 | 13F | Eisler Capital Management Ltd. | Call | 0 | -100,00 | 0 | ||||
| 2025-11-13 | 13F | Eisler Capital Management Ltd. | Put | 0 | -100,00 | 0 | ||||
| 2025-11-12 | 13F | Montag A & Associates Inc | 0 | -100,00 | 0 | |||||
| 2025-09-26 | NP | EPIN - Harbor International Equity ETF | 578 | 51 | ||||||
| 2026-02-13 | 13F | Glen Eagle Advisors, LLC | 0 | -100,00 | 0 | |||||
| 2026-02-13 | 13F | Morgan Stanley | 2.709.426 | 37,97 | 354.014 | 36,80 | ||||
| 2026-02-13 | 13F | Marathon Trading Investment Management LLC | Put | 0 | -100,00 | 0 | ||||
| 2026-02-13 | 13F | Stifel Financial Corp | 11.336 | 16,71 | 1.481 | 15,79 | ||||
| 2025-10-30 | 13F | Twin Peaks Wealth Advisors, LLC | 0 | -100,00 | 0 | |||||
| 2026-02-02 | 13F | CX Institutional | 1.049 | 11,36 | 0 | |||||
| 2026-02-12 | 13F | SWAN Capital LLC | 22 | -81,97 | 3 | -87,50 | ||||
| 2026-02-13 | 13F | Marathon Trading Investment Management LLC | 0 | -100,00 | 0 | |||||
| 2026-02-17 | 13F | Shay Capital LLC | Call | 93.000 | 125,73 | 12.151 | 123,86 | |||
| 2025-11-13 | 13F | Eisler Capital Management Ltd. | 0 | -100,00 | 0 | |||||
| 2026-01-23 | 13F | Bellevue Asset Management, Llc | 170 | 0,00 | 22 | 0,00 | ||||
| 2026-02-03 | 13F | Redwood Wealth Management Group, LLC | 4.082 | -3,54 | 533 | -4,31 | ||||
| 2026-02-06 | 13F | GPS Wealth Strategies Group, LLC | 0 | -100,00 | 0 | |||||
| 2026-02-13 | 13F | Schroder Investment Management Group | 1.157.374 | -5,60 | 153.213 | -7,33 | ||||
| 2025-09-29 | NP | Calamos Global Total Return Fund | 1.050 | 0,00 | 92 | 0,00 | ||||
| 2026-02-11 | 13F | Argonautica Private Wealth Management, Inc | 5.308 | 14,35 | 694 | 13,42 | ||||
| 2025-10-07 | 13F | Cooper Financial Group | 0 | -100,00 | 0 | -100,00 | ||||
| 2026-02-12 | 13F | Hollencrest Capital Management | 520 | 2.500,00 | 68 | 3.250,00 | ||||
| 2026-02-10 | 13F | Envestnet Asset Management Inc | 18.720 | 39,07 | 2.446 | 37,90 | ||||
| 2026-02-13 | 13F/A | Alberta Investment Management Corp | 0 | -100,00 | 0 | |||||
| 2026-02-06 | 13F | Pinnbrook Capital Management Lp | Call | 2.900 | -94,63 | 379 | -94,69 | |||
| 2026-02-10 | 13F | Daiwa Securities Group Inc. | 1.900 | 0,00 | 0 | |||||
| 2026-02-17 | 13F | ExodusPoint Capital Management, LP | 0 | -100,00 | 0 | -100,00 | ||||
| 2026-02-17 | 13F | Creative Planning | 93.678 | 28,34 | 12.240 | 27,25 | ||||
| 2025-09-29 | NP | Calamos Global Dynamic Income Fund | 4.050 | 0,00 | 356 | 0,00 | ||||
| 2026-02-17 | 13F | Sender Co & Partners, Inc. | Call | 0 | -100,00 | 0 | ||||
| 2025-09-26 | NP | JHAAX - Multi-Asset Absolute Return Fund Class A | 1.489 | -18,50 | 131 | -18,75 | ||||
| 2026-02-17 | 13F | Private Advisor Group, LLC | 16.585 | -33,01 | 2.167 | -33,60 | ||||
| 2026-02-12 | 13F | Long Corridor Asset Management Ltd | 12.500 | 0,00 | 1.633 | -0,85 | ||||
| 2026-01-08 | 13F | Wealth Enhancement Advisory Services, Llc | 11.783 | 48,96 | 1.725 | 57,10 | ||||
| 2026-01-26 | 13F | Greenwood Capital Associates Llc | 0 | -100,00 | 0 | |||||
| 2026-02-17 | 13F | Boothbay Fund Management, Llc | Call | 0 | -100,00 | 0 | ||||
| 2026-02-11 | 13F | DCF Advisers, LLC | Call | 1.500 | 196 | |||||
| 2026-02-11 | 13F | DCF Advisers, LLC | 40.500 | 5.292 | ||||||
| 2025-09-26 | NP | RTNAX - Tax-Managed International Equity Fund Class A | 23.510 | -32,43 | 2.066 | -32,41 | ||||
| 2026-02-12 | 13F | Intesa Sanpaolo Wealth Management | 3.650 | 478 | ||||||
| 2026-02-17 | 13F | Clearline Capital LP | 85.250 | 27,17 | 11.139 | 26,10 | ||||
| 2026-02-17 | 13F | IHT Wealth Management, LLC | 9.758 | -9,92 | 1.275 | -10,72 | ||||
| 2026-02-13 | 13F | Sterling Capital Management LLC | 0 | -100,00 | 0 | |||||
| 2026-02-12 | 13F | Ardent Capital Management, Inc. | 39.438 | 363,92 | 5.153 | 360,00 | ||||
| 2026-02-12 | 13F | AI-Squared Management Ltd | 97.150 | 10,71 | 12.694 | 9,78 | ||||
| 2026-01-30 | 13F | State of New Jersey Common Pension Fund D | 20.065 | 0,00 | 2.622 | -0,83 | ||||
| 2026-01-29 | 13F | UBS Group AG | Put | 1.267.038 | -2,58 | 165.551 | -3,40 | |||
| 2025-09-25 | NP | QLVE - FlexShares Emerging Markets Quality Low Volatility Index Fund | 0 | -100,00 | 0 | -100,00 | ||||
| 2026-01-29 | 13F | UBS Group AG | Call | 1.167.071 | -38,58 | 152.489 | -39,10 | |||
| 2026-01-29 | 13F | UBS Group AG | 1.429.249 | -38,49 | 186.746 | -39,00 | ||||
| 2026-02-17 | 13F | Orbis Allan Gray Ltd | 254.741 | -75,60 | 33.284 | -75,81 | ||||
| 2026-02-17 | 13F | GAM Holding AG | 25.791 | 97,69 | 3.370 | 95,99 | ||||
| 2026-02-11 | 13F | Allianz Asset Management GmbH | 52.770 | 0,00 | 6.895 | -0,85 | ||||
| 2026-02-05 | 13F | Bank Julius Baer & Co. Ltd, Zurich | 8.140 | 646,79 | 1.064 | 643,36 | ||||
| 2025-09-25 | NP | NEWFX - NEW WORLD FUND INC Class A | 896.624 | 58,55 | 78.786 | 58,64 | ||||
| 2026-02-10 | 13F | Measured Wealth Private Client Group, LLC | 1 | 0,00 | 0 | |||||
| 2026-01-26 | 13F | Mirae Asset Global Investments Co., Ltd. | 93.591 | 1,20 | 12.229 | 0,34 | ||||
| 2026-02-17 | 13F | SummitTX Capital, L.P. | 3.056 | 399 | ||||||
| 2026-01-08 | 13F | True Wealth Design, LLC | 17 | 88,89 | 2 | 100,00 | ||||
| 2025-10-30 | 13F | Traub Capital Management LLC | 0 | -100,00 | 0 | |||||
| 2026-02-10 | 13F | Core Wealth Advisors, Llc | 100 | 13 | ||||||
| 2026-02-13 | 13F | Truvestments Capital Llc | 0 | 0 | ||||||
| 2026-02-17 | 13F | Boothbay Fund Management, Llc | Put | 0 | -100,00 | 0 | ||||
| 2026-02-06 | 13F | EverSource Wealth Advisors, LLC | 929 | -3,23 | 121 | -3,97 | ||||
| 2026-02-12 | 13F | Penserra Capital Management LLC | 316.902 | 0,07 | 41 | 0,00 | ||||
| 2026-02-09 | 13F | Key FInancial Inc | 5 | 0,00 | 1 | |||||
| 2026-02-03 | 13F | Wesbanco Bank Inc | 1.865 | 0,00 | 244 | -0,82 | ||||
| 2026-02-12 | 13F | Dimensional Fund Advisors Lp | 1.238.437 | -0,42 | 161.814 | -1,26 | ||||
| 2025-11-14 | 13F | LMR Partners LLP | Put | 0 | -100,00 | 0 | -100,00 | |||
| 2026-02-10 | 13F | Monaco Asset Management SAM | 107.500 | 53,57 | 14.046 | 52,28 | ||||
| 2025-11-14 | 13F | LMR Partners LLP | Call | 0 | -100,00 | 0 | -100,00 | |||
| 2026-01-29 | 13F | LFA - Lugano Financial Advisors SA | 100 | 0,00 | 13 | 0,00 | ||||
| 2026-02-17 | 13F | Quantinno Capital Management LP | 32.463 | 37,25 | 4.242 | 36,10 | ||||
| 2026-02-04 | 13F | LRI Investments, LLC | 18 | -84,75 | 2 | -86,67 | ||||
| 2026-01-22 | 13F | Mechanics Financial Corp | 50 | 0,00 | 7 | 0,00 | ||||
| 2026-02-02 | 13F | Cornerstone Planning Group LLC | 10 | 2 | ||||||
| 2026-02-09 | 13F | Hantz Financial Services, Inc. | 6.303 | 59,65 | 1 | |||||
| 2026-02-13 | 13F | Centiva Capital, LP | 266 | 35 | ||||||
| 2026-02-13 | 13F | Centiva Capital, LP | Call | 13.600 | -93,30 | 1.777 | -93,36 | |||
| 2026-02-13 | 13F | Centiva Capital, LP | Put | 211.800 | -27,71 | 27.674 | -28,32 | |||
| 2026-03-12 | 13F/A | Peak6 Llc | Call | 62.800 | -93,08 | 8.205 | -93,14 | |||
| 2026-02-12 | 13F | New York State Common Retirement Fund | 127.991 | 100,63 | 16.723 | 98,94 | ||||
| 2026-02-17 | 13F | Hood River Capital Management LLC | 45 | 6 | ||||||
| 2025-09-25 | NP | VMMSX - Vanguard Emerging Markets Select Stock Fund Investor Shares | 8.144 | 0,00 | 716 | 0,00 | ||||
| 2026-01-26 | 13F | Private Trust Co Na | 44 | -30,16 | 6 | -37,50 | ||||
| 2025-10-30 | 13F | Mizuho Securities Co. Ltd. | 0 | -100,00 | 0 | -100,00 | ||||
| 2026-01-12 | 13F | Salem Investment Counselors Inc | 0 | -100,00 | 0 | |||||
| 2026-02-03 | 13F | Navigoe, LLC | 6 | 0,00 | 0 | |||||
| 2026-02-10 | 13F | Natixis Advisors, L.p. | 28.952 | 1,41 | 4 | 0,00 | ||||
| 2026-02-11 | 13F | OPTIMAS CAPITAL Ltd | 26.400 | 0,00 | 3.449 | -0,83 | ||||
| 2026-01-08 | 13F | Adirondack Trust Co | 12 | 0,00 | 2 | 0,00 | ||||
| 2025-09-25 | NP | TRIGX - T. Rowe Price International Value Equity Fund This fund is a listed as child fund of Price T Rowe Associates Inc /md/ and if that institution has disclosed ownership in this security, then these positions will not be double counted when calculating total shares and total value | 0 | -100,00 | 0 | -100,00 | ||||
| 2026-02-17 | 13F | SageView Advisory Group, LLC | 7 | 1 | ||||||
| 2026-02-17 | 13F | Shelton Capital Management | 0 | -100,00 | 0 | |||||
| 2026-02-17 | 13F | Russell Investments Group, Ltd. | 46.786 | 0,19 | 6.113 | -0,65 | ||||
| 2026-02-13 | 13F | Kestra Advisory Services, LLC | 0 | -100,00 | 0 | |||||
| 2026-02-17 | 13F | Laird Norton Trust Company, Llc | 5.576 | 729 | ||||||
| 2026-02-17 | 13F | D L Carlson Investment Group Inc | 25.723 | 3.361 | ||||||
| 2026-02-17 | 13F | Maytus Capital Management, LLC | 38.000 | 88,17 | 4.965 | 86,65 | ||||
| 2026-02-17 | 13F | Susquehanna International Group, Llp | Put | 2.255.000 | -30,36 | 294.638 | -30,94 | |||
| 2026-02-17 | 13F | Susquehanna International Group, Llp | Call | 5.256.700 | -46,12 | 686.840 | -46,57 | |||
| 2026-02-17 | 13F | Susquehanna International Group, Llp | 1.425.180 | 75,93 | 186.214 | 74,45 | ||||
| 2026-01-30 | 13F | ARGA Investment Management, LP | 302.873 | -0,27 | 39.573 | -1,11 | ||||
| 2026-01-27 | 13F | Mainstay Capital Management Llc /adv | 1.839 | 7,80 | 240 | 7,14 | ||||
| 2026-02-17 | 13F | Blair William & Co/il | 34.213 | 6,83 | 4.470 | 5,95 | ||||
| 2026-01-26 | 13F | Great Hill Capital LLC | Call | 1.022.000 | 0,00 | 119.050 | -11,60 | |||
| 2026-02-06 | 13F | Larson Financial Group LLC | 754 | 406,04 | 98 | 415,79 | ||||
| 2026-01-26 | 13F | Great Hill Capital LLC | 18.685 | -1,84 | 2.441 | -2,67 | ||||
| 2026-02-10 | 13F | Intellectus Partners, LLC | 13.536 | -2,70 | 1.769 | -3,55 | ||||
| 2026-01-12 | 13F | Abound Wealth Management | 59 | 1.375,00 | 8 | |||||
| 2026-02-04 | 13F | ABN AMRO Bank N.V. | 2.450 | -3,16 | 323 | -3,01 | ||||
| 2026-02-10 | 13F | Murphy & Mullick Capital Management Corp | 20 | 0,00 | 3 | 0,00 | ||||
| 2026-02-09 | 13F | Wcm Investment Management, Llc | 42.564 | 100,04 | 5.635 | 96,38 | ||||
| 2026-02-02 | 13F | Oppenheimer & Co Inc | 0 | -100,00 | 0 | |||||
| 2026-02-03 | 13F | Farmers & Merchants Investments Inc | 50 | 0,00 | 7 | 0,00 | ||||
| 2026-02-17 | 13F | Defiance ETFs, LLC | 316.806 | 41.939 | ||||||
| 2026-02-03 | 13F | Denali Advisors Llc | 0 | -100,00 | 0 | |||||
| 2026-02-18 | 13F | Caitlin John, LLC | 33 | 0,00 | 4 | 0,00 | ||||
| 2025-10-15 | 13F | Atwood & Palmer Inc | 0 | -100,00 | 0 | -100,00 | ||||
| 2026-02-13 | 13F | Verition Fund Management LLC | Put | 111.100 | 187,08 | 14.516 | 184,68 | |||
| 2026-02-13 | 13F | Verition Fund Management LLC | Call | 56.400 | 53,26 | 7.369 | 51,97 | |||
| 2026-02-17 | 13F | Portolan Capital Management, LLC | 263.681 | 5.657,23 | 34.453 | 5.613,43 | ||||
| 2026-02-13 | 13F | Verition Fund Management LLC | 50.077 | 6.543 | ||||||
| 2026-02-13 | 13F | BNP Paribas Asset Management Holding S.A. | 3.637 | 0 | ||||||
| 2026-02-17 | 13F | FIL Ltd | 218.637 | 8,12 | 28.567 | 7,21 | ||||
| 2026-01-28 | 13F | DekaBank Deutsche Girozentrale | 286.775 | 0,00 | 33 | -15,38 | ||||
| 2025-11-07 | 13F | Rialto Wealth Management, LLC | 0 | -100,00 | 0 | |||||
| 2026-02-05 | 13F | Elyxium Wealth, LLC | 18 | 2 | ||||||
| 2026-02-13 | 13F | Pinpoint Asset Management (Singapore) Pte. Ltd. | 8.983 | 1.174 | ||||||
| 2026-02-17 | 13F | Cantor Fitzgerald, L. P. | 11.152 | 1.457 | ||||||
| 2026-01-20 | 13F | Myriad Asset Management US LP | 2.606 | 340 | ||||||
| 2026-02-09 | 13F | Guinness Asset Management LTD | 3.074 | 5,85 | 390 | -0,51 | ||||
| 2026-02-13 | 13F | Niles Investment Management, LLC | 26.911 | 3.516 | ||||||
| 2026-02-13 | 13F | Johnson Investment Counsel Inc | 0 | -100,00 | 0 | |||||
| 2026-02-13 | 13F | Umb Bank N A/mo | 428 | 25,88 | 56 | 25,00 | ||||
| 2026-02-11 | 13F | LPL Financial LLC | 105.958 | 5,06 | 13.845 | 4,18 | ||||
| 2026-02-11 | 13F | LPL Financial LLC | Put | 2.000 | 0,00 | 261 | -0,76 | |||
| 2026-02-17 | 13F | Quadrature Capital Ltd | 145.847 | 19.056 | ||||||
| 2026-02-11 | 13F | Group One Trading, L.p. | Call | 742.800 | -24,88 | 97.054 | -25,51 | |||
| 2026-02-11 | 13F | Group One Trading, L.p. | Put | 372.700 | -3,25 | 48.697 | -4,06 | |||
| 2026-02-03 | 13F | Maxi Investments CY Ltd | 41.350 | 5 | ||||||
| 2026-02-13 | 13F | First Trust Advisors Lp | 49.760 | 1,11 | 6.502 | 0,25 | ||||
| 2026-02-12 | 13F | Insigneo Advisory Services, Llc | 6.569 | -30,10 | 858 | -30,69 | ||||
| 2026-02-11 | 13F | Jpmorgan Chase & Co | Put | 609.800 | 35,93 | 79.676 | 34,79 | |||
| 2025-11-14 | 13F | Bayesian Capital Management, LP | 0 | -100,00 | 0 | |||||
| 2026-02-05 | 13F | Cambridge Investment Research Advisors, Inc. | 6.482 | 7,12 | 1 | |||||
| 2026-02-11 | 13F | Jpmorgan Chase & Co | 70.151 | -11,50 | 9.166 | -12,25 | ||||
| 2026-02-11 | 13F | Jpmorgan Chase & Co | Call | 661.200 | 18,79 | 86.392 | 17,79 | |||
| 2026-02-09 | 13F | Hartland & Co., LLC | 183 | 75,96 | 24 | 76,92 | ||||
| 2026-02-13 | 13F | Alyeska Investment Group, L.P. | 139.308 | -25,69 | 18.202 | -26,31 | ||||
| 2025-11-14 | 13F | Gluskin Sheff & Assoc Inc | 0 | -100,00 | 0 | -100,00 | ||||
| 2026-01-16 | 13F | Banque Pictet & Cie Sa | 20.000 | 0,00 | 2.613 | -0,83 | ||||
| 2026-02-06 | 13F | Fortis Group Advisors, LLC | 10.881 | 13.501,25 | 1.665 | 16.540,00 | ||||
| 2026-02-12 | 13F | Elevated Private Wealth, LLC | 5.915 | 773 | ||||||
| 2026-02-17 | 13F | Ancora Advisors, LLC | 10 | 1 | ||||||
| 2026-01-07 | 13F | Harbor Investment Advisory, Llc | 105 | 0,00 | 14 | 0,00 | ||||
| 2026-02-10 | 13F | Winthrop Capital Management, LLC | 450 | 0 | ||||||
| 2026-02-04 | 13F | Tsfg, Llc | 73 | 0,00 | 0 | |||||
| 2026-01-23 | 13F | Freestone Capital Holdings, LLC | 1.667 | 0,00 | 218 | -0,91 | ||||
| 2026-02-17 | 13F | PenderFund Capital Management Ltd. | 7.600 | 993 | ||||||
| 2026-02-13 | 13F | Polymer Capital Management (HK) LTD | 68.800 | 307,34 | 8.989 | 304,00 | ||||
| 2025-09-25 | NP | MFWTX - MFS Global Total Return Fund A | 12.428 | -0,96 | 1.092 | -0,82 | ||||
| 2026-02-17 | 13F | Cape Investment Advisory, Inc. | 278 | 1.637,50 | 36 | 1.700,00 | ||||
| 2026-01-23 | 13F | BSW Wealth Partners | 1.651 | 7,42 | 216 | 6,44 | ||||
| 2026-02-17 | 13F | Garden State Investment Advisory Services LLC | 2.720 | 355 | ||||||
| 2026-02-05 | 13F | Everstar Asset Management, LLC | 4.200 | -12,46 | 549 | -13,29 | ||||
| 2026-02-13 | 13F | American Century Companies Inc | 40.667 | 0,00 | 5.314 | -0,84 | ||||
| 2025-11-14 | 13F | AXA Investment Managers S.A. | 43.000 | 5.666 | ||||||
| 2026-02-17 | 13F | Old Mission Capital Llc | 51.687 | 6.767 | ||||||
| 2026-02-17 | 13F | Credit Agricole S A | 28.594 | -17,05 | 3.736 | -17,75 | ||||
| 2026-02-11 | 13F | ARK Investment Management LLC | 1.157.878 | 127,75 | 151.288 | 125,84 | ||||
| 2026-02-12 | 13F | Groupe la Francaise | 0 | -100,00 | 0 | |||||
| 2026-01-27 | 13F | Jeppson Wealth Management, Llc | 1.561 | 0,00 | 204 | -0,98 | ||||
| 2026-02-19 | 13F | CI Private Wealth, LLC | 9.613 | -20,85 | 1.240 | -22,56 | ||||
| 2025-09-29 | NP | SOCL - Global X Social Media ETF This fund is a listed as child fund of Mirae Asset Global Investments Co., Ltd. and if that institution has disclosed ownership in this security, then these positions will not be double counted when calculating total shares and total value | 59.547 | 6,48 | 5.232 | 6,54 | ||||
| 2026-02-04 | 13F | Clark Wealth Partners | 100 | 0,00 | 13 | 0,00 | ||||
| 2026-02-13 | 13F | Cornerstone Financial Management LLC | 10 | 1 | ||||||
| 2026-02-17 | 13F | Equitable Holdings, Inc. | 28.113 | 5,19 | 3.673 | 4,32 | ||||
| 2026-02-17 | 13F | Jones Financial Companies Lllp | 10.391 | 0,27 | 1.358 | -0,29 | ||||
| 2026-02-12 | 13F | Keel Point, LLC | 5.137 | -0,14 | 671 | -0,89 | ||||
| 2025-11-13 | 13F | Arrowstreet Capital, Limited Partnership | 0 | -100,00 | 0 | |||||
| 2026-01-12 | 13F | Heritage Family Offices, LLP | 1.596 | -15,82 | 209 | -16,47 | ||||
| 2026-01-20 | 13F | Savvy Advisors, Inc. | 2.885 | 1,19 | 377 | 0,27 | ||||
| 2026-02-09 | 13F | Huntington National Bank | 121 | 0,00 | 16 | 0,00 | ||||
| 2026-02-13 | 13F | Black Creek Investment Management Inc. | 892.555 | 12,45 | 116.621 | 11,51 | ||||
| 2026-01-23 | 13F | Westside Investment Management, Inc. | 30 | 0,00 | 4 | 0,00 | ||||
| 2026-01-08 | 13F | Grove Bank & Trust | 500 | -3,66 | 65 | -4,41 | ||||
| 2026-02-11 | 13F | Gordian Capital Singapore Pte Ltd | 10 | -90,00 | 1 | -92,31 | ||||
| 2026-02-17 | 13F | Steadfast Capital Management Lp | 0 | -100,00 | 0 | |||||
| 2026-02-13 | 13F | Citigroup Inc | Put | 27.500 | 0,00 | 3.593 | -0,83 | |||
| 2026-02-12 | 13F | Skopos Labs, Inc. | 8.488 | 46,60 | 1.076 | 41,21 | ||||
| 2026-02-13 | 13F | Citigroup Inc | 262.099 | 6,46 | 34.246 | 5,56 | ||||
| 2026-02-13 | 13F | Citigroup Inc | Call | 75.000 | 0,00 | 9.800 | -0,84 | |||
| 2026-02-10 | 13F | Close Asset Management Ltd | 775 | 19,23 | 0 | |||||
| 2025-09-26 | NP | Templeton Global Income Fund | 13.235 | 0,00 | 1.163 | 0,00 | ||||
| 2026-01-29 | 13F | Deltec Asset Management Llc | 0 | -100,00 | 0 | |||||
| 2026-01-22 | 13F | Venturi Wealth Management, LLC | 3.445 | 450 | ||||||
| 2025-11-12 | 13F | Sierra Summit Advisors Llc | 0 | -100,00 | 0 | |||||
| 2026-02-27 | 13F | Strategic Investment Solutions, Inc. /IL | 2.640 | -50,01 | 345 | -50,50 | ||||
| 2026-01-27 | 13F | Meritage Portfolio Management | 117.856 | -1,95 | 15.399 | -2,78 | ||||
| 2026-02-11 | 13F | Nemes Rush Group LLC | 700 | 0,00 | 91 | -1,09 | ||||
| 2026-02-17 | 13F | Tower Research Capital LLC (TRC) | 0 | -100,00 | 0 | |||||
| 2026-01-07 | 13F | Aventura Private Wealth, LLC | 5 | 0,00 | 1 | |||||
| 2026-02-06 | 13F/A | Rathbone Brothers plc | 3.119 | 1,63 | 408 | 0,74 | ||||
| 2026-02-12 | 13F | BRYN MAWR TRUST Co | 0 | -100,00 | 0 | -100,00 | ||||
| 2026-02-13 | 13F | Oasis Management Co Ltd. | Call | 94.900 | 12.400 | |||||
| 2026-02-17 | 13F | Fund 1 Investments, LLC | 21.327 | -55,08 | 2.787 | -55,46 | ||||
| 2026-01-26 | 13F | KBC Group NV | 14.743 | 0,00 | 2 | 0,00 | ||||
| 2026-02-12 | 13F | BRIGHT VALLEY CAPITAL Ltd | Call | 0 | -100,00 | 0 | ||||
| 2026-02-17 | 13F | Amundi | 5.993 | 23,75 | 783 | 11,70 | ||||
| 2026-02-13 | 13F | 1832 Asset Management L.P. | 1.764 | -99,46 | 230 | -99,46 | ||||
| 2025-09-25 | NP | Dimensional Emerging Markets Value Fund - Dimensional Emerging Markets Value Fund This fund is a listed as child fund of Dimensional Fund Advisors Lp and if that institution has disclosed ownership in this security, then these positions will not be double counted when calculating total shares and total value | 624.224 | 0,00 | 54.851 | 0,06 | ||||
| 2026-02-17 | 13F | Westerly Capital Management, Llc | 50.000 | -39,76 | 6.533 | -40,26 | ||||
| 2026-02-13 | 13F | Botty Investors LLC | 22.000 | 0,00 | 2.875 | -0,83 | ||||
| 2026-02-17 | 13F | Raymond James Financial Inc | 65.470 | 39,15 | 8.554 | 37,99 | ||||
| 2025-11-07 | 13F | CenterBook Partners LP | 3.077 | 405 | ||||||
| 2026-02-12 | 13F | Hrt Financial Lp | 107.200 | -26,58 | 14 | -26,32 | ||||
| 2026-02-09 | 13F | Kingsview Wealth Management, LLC | 1.864 | -2,00 | 244 | -2,80 | ||||
| 2026-02-13 | 13F | MAI Capital Management | 2.360 | 1,29 | 308 | 0,33 | ||||
| 2026-01-21 | 13F | Aaron Wealth Advisors LLC | 1.806 | 236 | ||||||
| 2026-02-13 | 13F | Oasis Management Co Ltd. | 6.150 | 804 | ||||||
| 2026-02-17 | 13F | Fred Alger Management, Llc | 0 | -100,00 | 0 | |||||
| 2025-11-10 | 13F | Alerus Financial Na | 0 | -100,00 | 0 | -100,00 | ||||
| 2026-01-20 | 13F | Ethos Financial Group, LLC | 1.747 | 228 | ||||||
| 2026-02-03 | 13F | Orion Capital Management LLC | 52 | 0,00 | 7 | 0,00 | ||||
| 2026-02-11 | 13F | Ovata Capital Management Ltd | 5.000 | 0,00 | 676 | -1,32 | ||||
| 2025-11-13 | 13F | Change Path, LLC | 0 | -100,00 | 0 | |||||
| 2026-02-13 | 13F | Knollwood Investment Advisory, LLC | 3.410 | 0,00 | 446 | -0,89 | ||||
| 2026-01-29 | 13F | Rakuten Securities, Inc. | 713 | -43,64 | 93 | -43,98 | ||||
| 2026-02-05 | 13F | HighMark Wealth Management LLC | 63 | 0,00 | 8 | 0,00 | ||||
| 2026-01-13 | 13F | Kathmere Capital Management, LLC | 2.957 | 50,94 | 386 | 49,61 | ||||
| 2025-11-20 | 13F | Maven Securities LTD | 0 | -100,00 | 0 | -100,00 | ||||
| 2026-01-23 | 13F | Tower View Investment Management & Research LLC | 10.464 | 1.367 | ||||||
| 2025-11-20 | 13F | Maven Securities LTD | Put | 0 | -100,00 | 0 | -100,00 | |||
| 2026-02-13 | 13F | Royal London Asset Management Ltd | 5.729 | 14,95 | 749 | 14,02 | ||||
| 2026-02-13 | 13F | Headlands Technologies LLC | 2.637 | 345 | ||||||
| 2026-02-17 | 13F | Hillhouse Capital Advisors, Ltd. | 0 | -100,00 | 0 | |||||
| 2026-01-22 | 13F | Massachusetts Financial Services Co /ma/ | 580.027 | -8,96 | 75.786 | -9,73 | ||||
| 2026-02-09 | 13F | Harbour Investments, Inc. | 100 | -23,08 | 13 | -23,53 | ||||
| 2026-02-11 | 13F | Contrarius Group Holdings Ltd | 331.123 | 43.265 | ||||||
| 2026-02-13 | 13F | Wbi Investments, Inc. | 0 | -100,00 | 0 | |||||
| 2026-01-26 | 13F | Merit Financial Group, LLC | 4.386 | 4,18 | 573 | 3,43 | ||||
| 2026-02-13 | 13F | Maplelane Capital, Llc | Call | 0 | -100,00 | 0 | ||||
| 2025-11-21 | 13F/A | Royal Bank Of Canada | Put | 0 | -100,00 | 0 | -100,00 | |||
| 2026-02-12 | 13F | Integrated Quantitative Investments LLC | 1.859 | 243 | ||||||
| 2026-02-11 | 13F | Havemeyer Place LP | 7.987 | 1.044 | ||||||
| 2026-02-13 | 13F | Rhumbline Advisers | 1.298 | -14,27 | 170 | -15,08 | ||||
| 2026-02-12 | 13F | Benson Wealth Management INC | 6 | 1 | ||||||
| 2025-09-25 | NP | Dfa Investment Trust Co - The Emerging Markets Series This fund is a listed as child fund of Dimensional Fund Advisors Lp and if that institution has disclosed ownership in this security, then these positions will not be double counted when calculating total shares and total value | 2.292 | 0,00 | 201 | 0,00 | ||||
| 2026-01-21 | 13F | Yousif Capital Management, Llc | 4.539 | 0,00 | 681 | 13,71 | ||||
| 2026-02-06 | 13F | Banque Cantonale Vaudoise | 10.021 | -1,14 | 1.309 | 130.800,00 | ||||
| 2026-01-22 | 13F | Ransom Advisory, Ltd | 0 | -100,00 | 0 | -100,00 | ||||
| 2026-02-13 | 13F | Walleye Capital LLC | Put | 163.600 | 2.496,83 | 21.376 | 2.475,30 | |||
| 2026-02-17 | 13F | Voloridge Investment Management, Llc | 0 | -100,00 | 0 | |||||
| 2026-03-06 | 13F | Hsbc Holdings Plc | 79.282 | -96,29 | 10.435 | -96,26 | ||||
| 2025-11-10 | 13F | Raiffeisen Bank International AG | 0 | -100,00 | 0 | -100,00 | ||||
| 2026-02-13 | 13F | Valliance Asset Management Ltd | Call | 270.000 | 35.278 | |||||
| 2025-10-14 | 13F | Trust Co Of Vermont | 0 | -100,00 | 0 | -100,00 | ||||
| 2026-02-13 | 13F | Resources Investment Advisors, LLC. | 1.611 | -16,14 | 210 | -17,00 | ||||
| 2026-01-23 | 13F | Capital Investment Counsel, Inc | 4.930 | -6,63 | 644 | -7,34 | ||||
| 2026-01-22 | 13F | Bartlett & Co. Wealth Management Llc | 210 | 5,00 | 27 | 3,85 | ||||
| 2026-01-29 | 13F | Calamos Advisors LLC | 5.100 | 0,00 | 666 | -0,89 | ||||
| 2026-02-13 | 13F | Corient IA LLC | 4.580 | -34,57 | 598 | -35,14 | ||||
| 2026-01-26 | 13F | Abbington Investment Group | 0 | -100,00 | 0 | |||||
| 2026-01-14 | 13F | Wealthcare Advisory Partners LLC | 2.823 | 369 | ||||||
| 2026-02-17 | 13F | Fmr Llc | 714.708 | 11,20 | 93.384 | 10,26 | ||||
| 2026-02-17 | 13F | SIH Partners, LLLP | 326.399 | 234,28 | 42.647 | 231,47 | ||||
| 2026-02-20 | 13F | Kovitz Investment Group Partners, LLC | 2.629 | -3,31 | 344 | -4,19 | ||||
| 2026-02-12 | 13F | Polen Capital Management Llc | 0 | -100,00 | 0 | |||||
| 2026-02-12 | 13F | Quadrant Capital Group Llc | 20.112 | 0,36 | 2.628 | -0,49 | ||||
| 2026-02-13 | 13F | Walleye Capital LLC | 23.217 | 2.738,26 | 3.034 | 2.734,58 | ||||
| 2026-02-13 | 13F | Walleye Capital LLC | Call | 83.200 | 715,69 | 10.871 | 708,78 | |||
| 2026-02-14 | 13F | Taikang Asset Management (Hong Kong) Co Ltd | 11.000 | 1.437 | ||||||
| 2026-02-06 | 13F | Pnc Financial Services Group, Inc. | 7.925 | 4,26 | 1.035 | 3,40 | ||||
| 2026-02-10 | 13F/A | Northwestern Mutual Wealth Management Co | 19.473 | 7,53 | 2.544 | 6,62 | ||||
| 2026-01-15 | 13F | Shah Capital Management | 33.935 | 0,00 | 4.434 | -0,85 | ||||
| 2026-03-12 | 13F/A | Peak6 Llc | 21.200 | 2.770 | ||||||
| 2026-03-12 | 13F/A | Peak6 Llc | Put | 555.000 | -42,21 | 72.516 | -42,70 | |||
| 2025-09-29 | NP | POAGX - PRIMECAP Odyssey Aggressive Growth Fund | 1.047.190 | 3,00 | 92.017 | 3,06 | ||||
| 2026-01-29 | 13F | Kercheville Advisors, LLC | 18.275 | 81,84 | 2.970 | 124,32 | ||||
| 2026-02-04 | 13F | Meridian Wealth Management, LLC | 1.686 | 220 | ||||||
| 2026-02-17 | 13F | Alliancebernstein L.p. | 0 | -100,00 | 0 | |||||
| 2026-02-12 | 13F | Marex Group plc | Call | 5.000 | -50,00 | 653 | -50,42 | |||
| 2026-02-12 | 13F | Marex Group plc | 37.649 | 49,65 | 4.919 | 48,39 | ||||
| 2026-02-06 | 13F | Profund Advisors Llc | 20.088 | -19,09 | 2.625 | -19,78 | ||||
| 2026-02-11 | 13F | Arrowpoint Investment Partners (Singapore) Pte. Ltd. | 15.000 | 1.960 | ||||||
| 2026-02-10 | 13F | JTC Employer Solutions Trusteee Ltd | 5.401 | 0,00 | 1 | |||||
| 2026-02-17 | 13F | Quantitative Investment Management, LLC | 0 | -100,00 | 0 | |||||
| 2026-02-14 | 13F | Rockefeller Capital Management L.P. | 32.824 | -2,49 | 4.289 | -3,31 | ||||
| 2026-02-18 | 13F | Vident Advisory, LLC | 22.739 | 350,54 | 2.971 | 346,77 | ||||
| 2026-01-14 | 13F | Clarius Group, LLC | 1.572 | -6,93 | 205 | -7,66 | ||||
| 2026-02-11 | 13F | Mirae Asset Securities (usa) Inc. | Put | 300.704 | 200,70 | 19.599 | 48,74 | |||
| 2025-09-26 | NP | UGPIX - UltraChina ProFund Investor Class | 10.959 | 19,86 | 963 | 19,95 | ||||
| 2026-02-02 | 13F | Horizon Investments, LLC | 1.048 | 137 | ||||||
| 2026-02-17 | 13F | Massar Capital Management, LP | 14.139 | 1.847 | ||||||
| 2026-02-13 | 13F | Smartleaf Asset Management LLC | 73 | 102,78 | 10 | 125,00 | ||||
| 2026-01-23 | 13F | Factory Mutual Insurance Co | 7.570 | 989 | ||||||
| 2026-02-17 | 13F | LMR Partners LLP | 100.213 | 198,58 | 13.094 | 196,09 | ||||
| 2026-02-05 | 13F | High Note Wealth, LLC | 52 | 0,00 | 7 | 0,00 | ||||
| 2026-02-17 | 13F | Sig Brokerage, Lp | Put | 7.500 | -25,00 | 980 | -25,66 | |||
| 2026-02-17 | 13F | Sig Brokerage, Lp | Call | 7.500 | -88,89 | 980 | -88,99 | |||
| 2026-02-13 | 13F | Clear Street Group Inc. | 5.591 | 731 | ||||||
| 2026-02-17 | 13F | Polar Asset Management Partners Inc. | Put | 0 | -100,00 | 0 | ||||
| 2026-02-05 | 13F | Central Asset Investments & Management Holdings (HK) Ltd | 20.100 | 2.626 | ||||||
| 2026-01-30 | 13F | United Community Bank | 135 | 0,00 | 18 | 0,00 | ||||
| 2025-11-14 | 13F | Virtu Financial LLC | 0 | -100,00 | 0 | |||||
| 2026-02-03 | 13F | International Assets Investment Management, Llc | 16.487 | 3,39 | 2.154 | 57,00 | ||||
| 2025-10-30 | 13F | Ridgewood Investments LLC | 10.433 | 8,19 | 1.360 | 64,53 | ||||
| 2026-02-09 | 13F | Keating Financial Advisory Services, Inc. | 7 | 1 | ||||||
| 2026-01-27 | 13F | Zurcher Kantonalbank (Zurich Cantonalbank) | 5.704 | 14,10 | 745 | 13,22 | ||||
| 2026-02-11 | 13F | Mirae Asset Securities (usa) Inc. | 150.352 | 49,34 | 19.645 | 48,08 | ||||
| 2026-02-13 | 13F | Aspex Management (HK) Ltd | 0 | -100,00 | 0 | |||||
| 2026-01-13 | 13F | CoreCap Advisors, LLC | 1.767 | 231 | ||||||
| 2026-01-15 | 13F | SILVER OAK SECURITIES, Inc | 2.794 | -5,89 | 370 | -5,63 | ||||
| 2026-02-17 | 13F | Captrust Financial Advisors | 1.595 | 208 | ||||||
| 2026-02-10 | 13F | Bnp Paribas Arbitrage, Sa | 60.545 | -29,41 | 7.911 | -30,01 | ||||
| 2026-02-12 | 13F | Aviva Plc | 48.310 | -5,68 | 6.312 | -6,46 | ||||
| 2026-02-24 | 13F | DGS Capital Management, LLC | 4.075 | -8,84 | 532 | -9,68 | ||||
| 2026-02-13 | 13F | Ubs Asset Management Americas Inc | 137 | 18 | ||||||
| 2026-01-26 | 13F | Cwm, Llc | 1.079 | 16,52 | 0 | |||||
| 2026-02-11 | 13F | Empowered Funds, LLC | 19.603 | -41,67 | 2.561 | -42,16 | ||||
| 2026-02-17 | 13F | Optiver Holding B.V. | 26.964 | 287,19 | 3.569 | 280,09 | ||||
| 2026-02-04 | 13F | NAN FUNG TRINITY (HK) Ltd | 273.721 | 11,08 | 35.764 | 10,14 | ||||
| 2026-02-03 | 13F | Strengthening Families & Communities, LLC | 0 | -100,00 | 0 | |||||
| 2026-01-28 | 13F | Oversea-Chinese Banking CORP Ltd | 2.252 | 294 | ||||||
| 2026-02-17 | 13F | DZ BANK AG Deutsche Zentral Genossenschafts Bank, Frankfurt am Main | 11.817 | -28,35 | 1.502 | -30,97 | ||||
| 2026-02-10 | 13F | Ritter Daniher Financial Advisory LLC / DE | 45 | 6 | ||||||
| 2026-01-05 | 13F | Catherine Avery Investment Management LLC | 0 | -100,00 | 0 | |||||
| 2026-01-26 | 13F | PDS Planning, Inc | 1.634 | 5,69 | 213 | 4,93 | ||||
| 2026-01-23 | 13F | TT International Asset Management LTD | 258.923 | 34 | ||||||
| 2026-02-12 | 13F | Commonwealth Equity Services, Llc | 21.545 | -13,38 | 2.815 | 93.733,33 | ||||
| 2025-09-26 | NP | Voya Prime Rate Trust | 18.367 | 0,00 | 1.614 | 0,06 | ||||
| 2026-01-09 | 13F | SG Americas Securities, LLC | 363.502 | 33,98 | 47 | 34,29 | ||||
| 2026-01-22 | 13F | Apollon Wealth Management, LLC | 1.630 | 213 | ||||||
| 2026-02-02 | 13F | JDM Financial Group LLC | 325 | 0,00 | 42 | 0,00 | ||||
| 2026-01-26 | 13F | Patriot Financial Group Insurance Agency, LLC | 2.382 | 311 | ||||||
| 2026-02-06 | 13F | Investment House Llc | 0 | -100,00 | 0 | |||||
| 2026-02-13 | 13F | Walleye Trading LLC | Put | 844.600 | 35,31 | 110.355 | 34,17 | |||
| 2026-02-17 | 13F | Liontrust Investment Partners LLP | 0 | -100,00 | 0 | -100,00 | ||||
| 2026-02-13 | 13F | Evelyn Partners Investment Management LLP | 54 | 0,00 | 7 | 0,00 | ||||
| 2026-02-13 | 13F | Walleye Trading LLC | Call | 102.200 | -13,68 | 13.353 | -14,41 | |||
| 2026-02-13 | 13F | Walleye Trading LLC | 413.002 | -23,37 | 53.963 | -24,01 | ||||
| 2025-09-26 | NP | PNQI - Invesco NASDAQ Internet ETF This fund is a listed as child fund of Invesco Ltd. and if that institution has disclosed ownership in this security, then these positions will not be double counted when calculating total shares and total value | 25.772 | -16,74 | 2.265 | -16,70 | ||||
| 2026-02-05 | 13F | May Hill Capital, LLC | 2.466 | 322 | ||||||
| 2026-02-13 | 13F | Quinn Opportunity Partners LLC | 89.000 | 0,00 | 11.629 | -0,84 | ||||
| 2025-09-29 | NP | POGRX - PRIMECAP Odyssey Growth Fund | 614.300 | 1,32 | 53.979 | 1,38 | ||||
| 2026-01-29 | 13F | IMC-Chicago, LLC | 450.285 | 121,19 | 58.834 | 119,33 | ||||
| 2026-01-29 | 13F | IMC-Chicago, LLC | Put | 1.542.600 | -26,36 | 201.556 | -26,98 | |||
| 2026-01-29 | 13F | IMC-Chicago, LLC | Call | 2.023.600 | -26,88 | 264.404 | -27,49 | |||
| 2026-01-30 | 13F | Bogart Wealth, LLC | 4 | 0,00 | 1 | |||||
| 2026-01-23 | 13F | Brown, Lisle/cummings, Inc. | 50 | 0,00 | 7 | 0,00 | ||||
| 2025-11-13 | 13F | Triata Capital Ltd | 0 | -100,00 | 0 | |||||
| 2026-02-17 | 13F | Prelude Capital Management, Llc | 6.910 | -1,68 | 903 | -2,59 | ||||
| 2025-10-27 | 13F | Kiker Wealth Management, LLC | 0 | -100,00 | 0 | -100,00 | ||||
| 2026-02-12 | 13F | Great Lakes Advisors, Llc | 1.573 | -0,25 | 206 | -0,97 | ||||
| 2026-02-09 | 13F | Jefferies Financial Group Inc. | 0 | -100,00 | 0 | |||||
| 2026-02-17 | 13F | J. Goldman & Co LP | 70.000 | 9.146 | ||||||
| 2026-03-06 | 13F | Hsbc Holdings Plc | Put | 0 | -100,00 | 0 | ||||
| 2026-02-10 | 13F | Bnp Paribas | 16.239 | 4,63 | 2.122 | 3,51 | ||||
| 2026-02-17 | 13F | J. Goldman & Co LP | Call | 102.500 | 13.393 | |||||
| 2026-02-17 | 13F | Fortune 45 LLC | 1.400 | 210 | ||||||
| 2025-11-12 | 13F | Creekmur Asset Management LLC | 0 | -100,00 | 0 | |||||
| 2025-10-28 | 13F | Nbt Bank N A /ny | 0 | -100,00 | 0 | -100,00 | ||||
| 2026-02-10 | 13F | CIBC World Markets Inc. | 88.304 | -11,47 | 11.538 | -12,22 | ||||
| 2026-02-13 | 13F | Flow Traders U.s. Llc | 3.938 | 1 | ||||||
| 2026-02-12 | 13F | BlackRock, Inc. | 253.631 | -87,99 | 33.139 | -88,09 | ||||
| 2026-02-03 | 13F | Ballentine Partners, LLC | 2.913 | 6,63 | 381 | 5,85 | ||||
| 2026-02-05 | 13F | LGT Group Foundation | 2.560 | 0,00 | 339 | -3,70 | ||||
| 2026-02-11 | 13F | Financiere des Professionnels - Fonds d,investissement inc. | 12.663 | -3,63 | 1.655 | -4,45 | ||||
| 2026-02-13 | 13F | Gts Securities Llc | 9.365 | -58,69 | 1.224 | -59,06 | ||||
| 2026-01-29 | 13F | Pictet Asset Management Holding SA | 12.700 | -3,05 | 1.659 | -3,88 | ||||
| 2026-02-13 | 13F | Bank Of Nova Scotia | 3.099 | 35,98 | 405 | 34,67 | ||||
| 2026-02-17 | 13F | Ameriflex Group, Inc. | 100 | 13 | ||||||
| 2026-02-13 | 13F | Gmt Capital Corp | 60.127 | -76,70 | 7.856 | -76,89 | ||||
| 2026-02-04 | 13F | Valeo Financial Advisors, LLC | 0 | -100,00 | 0 | |||||
| 2026-02-03 | 13F | Winch Advisory Services, LLC | 22 | 0,00 | 3 | 0,00 | ||||
| 2026-02-11 | 13F | Deutsche Bank Ag\ | 7.607 | -2,22 | 994 | -3,12 | ||||
| 2026-02-11 | 13F | Franklin Resources Inc | 3.392 | -46,92 | 443 | -54,93 | ||||
| 2025-11-12 | 13F | Maseco Llp | 0 | -100,00 | 0 | -100,00 | ||||
| 2026-02-17 | 13F | Discovery Capital Management, Llc / Ct | 75.800 | 0,00 | 9.904 | -0,84 | ||||
| 2025-11-13 | 13F | Total Investment Management Inc | 0 | -100,00 | 0 | |||||
| 2026-02-13 | 13F | Quattro Advisors LLC | 14 | 2 | ||||||
| 2026-01-29 | 13F | Nbc Securities, Inc. | 25 | 3 | ||||||
| 2026-01-29 | 13F | Kestra Private Wealth Services, Llc | 11.315 | 59,64 | 1.478 | 58,41 | ||||
| 2025-11-03 | 13F | Activest Wealth Management | 0 | -100,00 | 0 | -100,00 | ||||
| 2025-09-26 | NP | UUPIX - Ultraemerging Markets Profund Investor Class | 1.357 | 15,59 | 119 | 15,53 | ||||
| 2026-02-17 | 13F | Melqart Asset Management (uk) Ltd | 0 | -100,00 | 0 | |||||
| 2026-01-15 | 13F | Nisa Investment Advisors, Llc | 136 | 18 | ||||||
| 2026-02-17 | 13F | BlueCrest Capital Management Ltd | 41.817 | 5.464 | ||||||
| 2026-02-17 | 13F | Northern Trust Corp | 276.017 | 6,38 | 36.064 | 5,48 | ||||
| 2026-02-17 | 13F | Symmetry Peak Management Llc | Call | 14.400 | -74,65 | 1.882 | -74,87 | |||
| 2026-02-12 | 13F | DRW Securities, LLC | 4.314 | -17,31 | 564 | -18,05 | ||||
| 2026-01-28 | 13F | Geneos Wealth Management Inc. | 2.022 | 0,00 | 264 | -0,75 | ||||
| 2026-02-12 | 13F | Voya Investment Management Llc | 0 | -100,00 | 0 | -100,00 | ||||
| 2026-02-13 | 13F | Marshall Wace, Llp | 535.653 | 69.988 | ||||||
| 2026-02-13 | 13F | Marshall Wace, Llp | Put | 3.800 | 497 | |||||
| 2026-02-12 | 13F | Sit Investment Associates Inc | 0 | -100,00 | 0 | |||||
| 2026-02-05 | 13F | DnB Asset Management AS | 452.579 | 6.832,89 | 59.134 | 6.775,93 | ||||
| 2026-02-03 | 13F | SBI Securities Co., Ltd. | 6.500 | -4,40 | 849 | -5,14 | ||||
| 2026-02-13 | 13F | Ieq Capital, Llc | 7.926 | 4,88 | 1.036 | 4,02 | ||||
| 2026-02-17 | 13F | Saba Capital Management, L.P. | 53.823 | -22,07 | 7.033 | -22,73 | ||||
| 2025-11-14 | 13F | BlueCrest Capital Management Ltd | Call | 72.000 | 9.487 | |||||
| 2026-01-16 | 13F | Empirical Financial Services, LLC d.b.a. Empirical Wealth Management | 2.761 | 361 | ||||||
| 2026-02-06 | 13F | Handelsbanken Fonder AB | 0 | -100,00 | 0 | |||||
| 2026-02-17 | 13F | Millennium Management Llc | Call | 387.100 | 72,58 | 50.578 | 71,13 | |||
| 2026-02-17 | 13F | Millennium Management Llc | Put | 816.700 | 38,42 | 106.710 | 37,26 | |||
| 2026-02-17 | 13F | Millennium Management Llc | 121.670 | 528,95 | 15.897 | 523,66 | ||||
| 2026-03-02 | 13F | Sankala Group LLC | 368 | 46 | ||||||
| 2026-02-13 | 13F | Arkadios Wealth Advisors | 2.936 | -5,66 | 384 | -6,59 | ||||
| 2026-02-10 | 13F | Goldman Sachs Group Inc | Put | 208.000 | 62,50 | 27.177 | 61,13 | |||
| 2026-02-10 | 13F | Goldman Sachs Group Inc | 933.471 | 58,85 | 121.967 | 57,51 | ||||
| 2026-02-13 | 13F | Solstein Capital, LLC | 0 | -100,00 | 0 | |||||
| 2026-02-10 | 13F | Goldman Sachs Group Inc | Call | 172.600 | -31,18 | 22.552 | -31,76 | |||
| 2026-01-15 | 13F | J. Safra Sarasin Holding AG | 5.018 | 13,89 | 656 | 12,93 | ||||
| 2026-02-06 | 13F | Cedar Wealth Management, LLC | 260 | 0,00 | 34 | -2,94 | ||||
| 2026-02-03 | 13F | Ethic Inc. | 14.119 | 17,85 | 1.845 | 16,86 | ||||
| 2026-02-17 | 13F | Edmond De Rothschild Holding S.a. | 235 | 0,00 | 31 | 0,00 | ||||
| 2026-02-18 | 13F | Ctc Llc | Put | 152 | 0,00 | 1.986 | -0,80 | |||
| 2026-02-18 | 13F | Ctc Llc | Call | 56 | 0,00 | 732 | -0,81 | |||
| 2026-02-11 | 13F | O'shaughnessy Asset Management, Llc | 22.359 | 35,73 | 2.921 | 34,61 | ||||
| 2026-02-13 | 13F | Vontobel Holding Ltd. | Call | 21.000 | 0,00 | 2.744 | -0,87 | |||
| 2026-02-13 | 13F | Vontobel Holding Ltd. | 40.136 | -16,04 | 5.244 | -16,74 | ||||
| 2026-02-19 | 13F | Invesco Ltd. | 164.803 | -6,76 | 21.533 | -7,54 | ||||
| 2026-02-17 | 13F | Redwood Park Advisors LLC | 185 | 0,00 | 24 | 0,00 | ||||
| 2025-11-14 | 13F | Axa S.a. | 0 | -100,00 | 0 | |||||
| 2026-01-09 | 13F | SG Americas Securities, LLC | Put | 43.200 | -53,90 | 0 | ||||
| 2025-11-10 | 13F | Armor Advisors, L.l.c. | 0 | -100,00 | 0 | -100,00 | ||||
| 2026-02-17 | 13F | Cetera Investment Advisers | 36.147 | -23,99 | 4.723 | -24,64 | ||||
| 2026-01-23 | 13F | TFC Financial Management | 10 | 0,00 | 1 | 0,00 | ||||
| 2026-01-28 | 13F | CAPROCK Group, Inc. | 3.777 | 39,53 | 494 | 91,83 | ||||
| 2026-02-17 | 13F | Bellevue Group AG | 0 | -100,00 | 0 | |||||
| 2025-11-12 | 13F | Bellwether Advisors, LLC | 0 | -100,00 | 0 | |||||
| 2026-02-11 | 13F | West Family Investments, Inc. | 0 | -100,00 | 0 | -100,00 | ||||
| 2026-01-20 | 13F | Arta Finance Wealth Management LLC | 2.594 | 339 | ||||||
| 2026-02-17 | 13F | Caption Management, LLC | Call | 0 | -100,00 | 0 | ||||
| 2026-01-30 | 13F | North Star Investment Management Corp. | 46 | 411,11 | 6 | 500,00 | ||||
| 2026-01-08 | 13F | Versant Capital Management, Inc | 6 | 1 | ||||||
| 2026-02-09 | 13F | Mondrian Investment Partners LTD | 769 | 26,90 | 101 | 26,58 | ||||
| 2026-02-06 | 13F | Global Retirement Partners, LLC | 3.267 | 454,67 | 427 | 453,25 | ||||
| 2026-02-12 | 13F | North of South Capital LLP | 426.013 | 2,59 | 55.663 | 1,73 | ||||
| 2026-02-13 | 13F | Keystone Investors Pte Ltd | 165.172 | 21.581 | ||||||
| 2026-01-14 | 13F | Spire Wealth Management | 4.433 | 11,47 | 579 | 10,50 | ||||
| 2026-01-28 | 13F | Deane Retirement Strategies, Inc. | 50 | 0,00 | 7 | 0,00 | ||||
| 2026-02-12 | 13F | Qtron Investments LLC | 0 | -100,00 | 0 | |||||
| 2025-11-14 | 13F | Wolverine Trading, Llc | 12.314 | 1.661 | ||||||
| 2025-11-14 | 13F | Wolverine Trading, Llc | Call | 812.800 | 109.614 | |||||
| 2025-11-14 | 13F | Wolverine Trading, Llc | Put | 439.500 | 59.271 | |||||
| 2026-02-17 | 13F | CastleKnight Management LP | 48.300 | -10,89 | 6.311 | -11,64 | ||||
| 2026-02-13 | 13F | Sei Investments Co | 252.113 | 5,24 | 32.941 | 4,36 | ||||
| 2026-02-13 | 13F | Itau Unibanco Holding S.A. | 0 | -100,00 | 0 | |||||
| 2026-02-10 | 13F | Future Fund LLC | 13.917 | 6,05 | 1.819 | 5,15 | ||||
| 2025-09-25 | NP | DFA INVESTMENT DIMENSIONS GROUP INC - Emerging Markets Targeted Value Portfolio Institutional Class This fund is a listed as child fund of Dimensional Fund Advisors Lp and if that institution has disclosed ownership in this security, then these positions will not be double counted when calculating total shares and total value | 783 | 69 | ||||||
| 2026-01-30 | 13F | Centerstone Investors, LLC | 3.421 | 0,00 | 447 | -0,89 | ||||
| 2026-01-06 | 13F | Investors Research Corp | 1.760 | 0,00 | 230 | -0,87 | ||||
| 2026-01-28 | 13F | B. Metzler seel. Sohn & Co. AG | 12.207 | 0,00 | 1.595 | -0,87 | ||||
| 2026-01-27 | 13F | CenterStar Asset Management, LLC | Call | 6.800 | -87,15 | 888 | -87,26 | |||
| 2026-01-13 | 13F | Mather Group, Llc. | 0 | -100,00 | 0 | |||||
| 2026-02-10 | 13F | Hazlett, Burt & Watson, Inc. | 30 | 50,00 | 0 | |||||
| 2025-11-13 | 13F | Glenmede Investment Management, LP | 0 | -100,00 | 0 | |||||
| 2025-11-14 | 13F | WNY Asset Management, LLC | 1.569 | 207 | ||||||
| 2026-02-06 | 13F | IFP Advisors, Inc | 836 | -24,00 | 109 | -24,31 | ||||
| 2026-01-16 | 13F | FNY Investment Advisers, LLC | 9.545 | 21,89 | 1 | 0,00 | ||||
| 2026-02-13 | 13F | Dymon Asia Capital (singapore) Pte. Ltd. | 37.771 | 4.935 | ||||||
| 2026-01-21 | 13F | Prime Capital Investment Advisors, LLC | 15.334 | 2.004 | ||||||
| 2026-01-27 | 13F | First Horizon Corp | 164 | 0,00 | 21 | 0,00 | ||||
| 2026-02-10 | 13F | Parametrica Management Ltd | 0 | -100,00 | 0 | |||||
| 2026-02-10 | 13F/A | Guinness Atkinson Asset Management Inc | 10.223 | -14,16 | 1.296 | -19,30 | ||||
| 2026-02-11 | 13F | Simplex Trading, Llc | Put | 435.700 | -38,29 | 56.929 | 61.112,90 | |||
| 2026-02-11 | 13F | Simplex Trading, Llc | Call | 702.900 | -43,54 | 91.841 | 55.900,00 | |||
| 2026-01-27 | 13F | Waterfront Wealth Inc. | 23.417 | 0,13 | 3.698 | 34,88 | ||||
| 2026-02-06 | 13F | Bare Financial Services, Inc | 3 | -40,00 | 0 | |||||
| 2025-11-12 | 13F | Simplex Trading, Llc | 0 | -100,00 | 0 | -100,00 | ||||
| 2025-11-19 | 13F/A | Regions Financial Corp | 0 | -100,00 | 0 | -100,00 | ||||
| 2026-02-17 | 13F | Woodline Partners LP | 0 | -100,00 | 0 | |||||
| 2025-11-14 | 13F | XTX Topco Ltd | 0 | -100,00 | 0 | -100,00 | ||||
| 2026-02-11 | 13F | Prestige Wealth Management Group LLC | 148 | 0,00 | 19 | 0,00 | ||||
| 2026-02-13 | 13F | Dodge & Cox | 16.530 | -99,62 | 2.160 | -99,63 | ||||
| 2026-01-20 | 13F | Polunin Capital Partners Ltd | 413.496 | 0,27 | 62 | 5,17 | ||||
| 2026-02-17 | 13F | Parallax Volatility Advisers, L.P. | 0 | -100,00 | 0 | |||||
| 2026-02-12 | 13F | Pitcairn Co | 0 | -100,00 | 0 | -100,00 | ||||
| 2026-01-22 | 13F | BOCHK Asset Management Ltd | 0 | -100,00 | 0 | |||||
| 2026-02-13 | 13F | Allianz Se | 8.452 | 417,58 | 1.104 | 413,49 | ||||
| 2026-02-11 | 13F | First Command Advisory Services, Inc. | 115 | 0,00 | 15 | 0,00 | ||||
| 2026-02-17 | 13F | Wiley Bros.-aintree Capital, Llc | 13.287 | 4,44 | 1.711 | 2,15 | ||||
| 2026-02-13 | 13F | Parkside Financial Bank & Trust | 45 | 0,00 | 6 | 0,00 | ||||
| 2026-01-27 | 13F | Silphium Asset Management Ltd | 0 | -100,00 | 0 | |||||
| 2026-01-16 | 13F | Ronald Blue Trust, Inc. | 4.334 | -1,01 | 566 | -1,74 | ||||
| 2026-01-23 | 13F | Sumitomo Mitsui Trust Holdings, Inc. | 669.619 | 112,58 | 87.492 | 110,79 | ||||
| 2025-11-12 | 13F | Fairtree Asset Management (Pty) Ltd | 0 | -100,00 | 0 | |||||
| 2026-02-12 | 13F | Federation des caisses Desjardins du Quebec | 14.784 | -2,53 | 1.932 | -3,35 | ||||
| 2026-02-17 | 13F | Silvercrest Asset Management Group Llc | 1.911 | 19,14 | 250 | 18,01 | ||||
| 2026-02-13 | 13F | Panagora Asset Management Inc | 5.590 | 0,00 | 730 | -0,82 | ||||
| 2026-01-27 | 13F | Financial Management Professionals, Inc. | 126 | -19,75 | 16 | -20,00 | ||||
| 2026-01-30 | 13F | Us Bancorp \de\ | 2.845 | -19,99 | 372 | -20,73 | ||||
| 2026-02-17 | 13F | Mercer Global Advisors Inc /adv | 5.622 | -29,79 | 735 | -30,43 | ||||
| 2026-02-12 | 13F | Steward Partners Investment Advisory, Llc | 1.100 | 175,00 | 144 | 175,00 | ||||
| 2026-02-13 | 13F | Altrafin AG | 0 | -100,00 | 0 | |||||
| 2026-02-05 | 13F | Allworth Financial LP | 192 | 50,00 | 25 | 56,25 | ||||
| 2026-01-20 | 13F | Signaturefd, Llc | 1.276 | 8,41 | 167 | 7,10 | ||||
| 2026-02-13 | 13F | Capula Management Ltd | Put | 0 | -100,00 | 0 | ||||
| 2026-02-12 | 13F | Brown Brothers Harriman & Co | 405 | 35,00 | 53 | 33,33 | ||||
| 2025-10-16 | 13F | Kingstone Capital Partners Texas, LLC | 0 | -100,00 | 0 | -100,00 | ||||
| 2026-02-06 | 13F | Nano Cap New Millennium Growth Fund L P | 8.500 | 1.111 | ||||||
| 2026-02-09 | 13F | Eaton Financial Holdings Company, LLC | 3.822 | 0,00 | 499 | -0,80 | ||||
| 2026-02-11 | 13F | Curio Wealth, Llc | 24 | 3 | ||||||
| 2026-02-17 | 13F | Hidden Lake Asset Management LP | 21.282 | -55,21 | 2.781 | -55,59 | ||||
| 2026-01-09 | 13F | Zrc Wealth Management, Llc | 40 | 0,00 | 5 | 0,00 | ||||
| 2026-02-17 | 13F | Gladstone Institutional Advisory LLC | 2.661 | 348 | ||||||
| 2026-01-08 | 13F | Nordea Investment Management Ab | 293.159 | 1,06 | 37.985 | -1,68 | ||||
| 2026-02-09 | 13F | Accent Capital Management, LLC | 550 | 0,00 | 72 | -1,39 | ||||
| 2026-02-11 | 13F | Myriad Asset Management Advisors LLC | 17.556 | 2.294 | ||||||
| 2026-01-05 | 13F | Confluence Investment Management Llc | 1.740 | 0,00 | 227 | -0,87 | ||||
| 2026-02-17 | 13F | Bank Of America Corp /de/ | 886.732 | -21,48 | 115.860 | -22,14 | ||||
| 2026-02-13 | 13F | Capula Management Ltd | 0 | -100,00 | 0 | |||||
| 2026-01-26 | 13F | Nations Financial Group Inc, /ia/ /adv | 7.174 | 43,97 | 937 | 42,84 | ||||
| 2026-02-03 | 13F | Mitsubishi UFJ Kokusai Asset Management Co., Ltd. | 28.795 | 0,03 | 4.328 | 14,08 | ||||
| 2026-01-27 | 13F | Gf Fund Management Co. Ltd. | 0 | -100,00 | 0 | |||||
| 2026-02-13 | 13F | Natixis | 2.683 | 23,41 | 351 | 22,38 | ||||
| 2026-02-06 | 13F | Carrhae Capital LLP | 341.747 | 44.653 | ||||||
| 2026-02-24 | 13F | Bell Investment Advisors, Inc | 86 | 1.128,57 | 11 | |||||
| 2026-02-19 | 13F | Atomi Financial Group, Inc. | 6.418 | 22,55 | 839 | 21,45 | ||||
| 2026-01-08 | 13F | Aurora Investment Managers, LLC. | 24.419 | -6,04 | 3 | 0,00 | ||||
| 2026-02-12 | 13F | Glaxis Capital Management, LLC | 6.000 | 100,00 | 784 | 98,23 | ||||
| 2026-02-17 | 13F | Capstone Investment Advisors, Llc | 6.968 | 910 | ||||||
| 2026-02-17 | 13F | Capstone Investment Advisors, Llc | Call | 7.600 | 192,31 | 993 | 190,35 | |||
| 2026-02-13 | 13F | Colony Group, LLC | 2.948 | 385 | ||||||
| 2026-02-17 | 13F | Capstone Investment Advisors, Llc | Put | 51.600 | 6.742 | |||||
| 2026-01-07 | 13F | Baldwin Brothers Inc/ma | 17.397 | 37,60 | 2.273 | 36,52 | ||||
| 2026-01-29 | 13F | Sava Infond d.o.o. | 1.400 | 183 | ||||||
| 2025-11-12 | 13F | HAP Trading, LLC | Put | 135.800 | 102 | |||||
| 2026-02-12 | 13F | Davy Global Fund Management Ltd | 59.462 | 7.769 | ||||||
| 2025-11-12 | 13F | HAP Trading, LLC | Call | 259.000 | 1.317 | |||||
| 2025-11-12 | 13F | HAP Trading, LLC | 20.659 | 2.722 | ||||||
| 2026-02-12 | 13F | XY Capital Ltd | Put | 1.400 | 183 | |||||
| 2026-02-12 | 13F | XY Capital Ltd | 33.854 | 70,47 | 4.423 | 69,07 | ||||
| 2026-02-12 | 13F | XY Capital Ltd | Call | 1.400 | 183 | |||||
| 2026-02-12 | 13F | Elo Mutual Pension Insurance Co | 84.204 | 11.002 | ||||||
| 2026-02-10 | 13F | State of Wyoming | 817 | -4,67 | 107 | -5,36 | ||||
| 2026-02-12 | 13F | Bank of Jackson Hole Trust | 41 | 5 | ||||||
| 2026-02-13 | 13F | Macquarie Group Ltd | 3.685 | -99,64 | 481 | -99,65 | ||||
| 2025-11-06 | 13F | Whipplewood Advisors, LLC | 0 | -100,00 | 0 | -100,00 | ||||
| 2026-02-17 | 13F | Tudor Investment Corp Et Al | Put | 145.200 | -44,90 | 18.972 | -45,36 | |||
| 2026-02-17 | 13F | Tudor Investment Corp Et Al | Call | 76.300 | 9.969 | |||||
| 2026-02-20 | 13F/A | CMT Capital Markets Trading GmbH | Put | 157.600 | 26,69 | 21 | 25,00 | |||
| 2026-02-13 | 13F | Wells Fargo & Company/mn | 131.178 | 55,95 | 17.140 | 54,64 | ||||
| 2026-02-17 | 13F | Advisory Services Network, LLC | 0 | -100,00 | 0 | |||||
| 2026-02-20 | 13F/A | CMT Capital Markets Trading GmbH | Call | 177.400 | -4,98 | 23 | -4,17 | |||
| 2026-02-17 | 13F | Tudor Investment Corp Et Al | 27.792 | -47,77 | 3.631 | -48,20 | ||||
| 2026-02-13 | 13F | Wells Fargo & Company/mn | Call | 44.700 | -69,11 | 5.841 | -69,37 | |||
| 2026-02-12 | 13F | Principal Securities, Inc. | 0 | -100,00 | 0 | |||||
| 2026-01-20 | 13F | Cohen Capital Management, Inc. | 7.553 | 0,00 | 987 | -0,90 | ||||
| 2026-02-17 | 13F | Long Focus Capital Management, Llc | 159.800 | 0,00 | 20.879 | -0,84 | ||||
| 2025-10-31 | 13F | Whittier Trust Co | 0 | -100,00 | 0 | |||||
| 2026-02-12 | 13F | Jane Street Group, Llc | Put | 1.797.400 | 4,59 | 234.848 | 3,70 | |||
| 2026-02-12 | 13F | Jane Street Group, Llc | Call | 1.825.300 | -52,72 | 238.494 | -53,12 | |||
| 2026-01-05 | 13F | GAMMA Investing LLC | 99 | 13 | ||||||
| 2026-02-12 | 13F | Jane Street Group, Llc | 665.572 | -3,33 | 86.964 | -4,15 | ||||
| 2026-02-11 | 13F | Janney Montgomery Scott LLC | 4.559 | 13,72 | 1 | |||||
| 2026-02-17 | 13F | Bank Hapoalim Bm | 0 | -100,00 | 0 | |||||
| 2026-01-15 | 13F | Highline Wealth Partners Llc | 94 | 36,23 | 12 | 33,33 | ||||
| 2026-02-11 | 13F | Nikko Asset Management Americas, Inc. | 667.639 | 87.214 | ||||||
| 2026-02-12 | 13F | Earnest Partners Llc | 888.308 | 8,47 | 116.066 | 7,56 | ||||
| 2026-02-20 | 13F | Sunbelt Securities, Inc. | 190 | 0,00 | 25 | -4,00 | ||||
| 2026-02-12 | 13F | Sycomore Asset Management | 600 | 0,00 | 0 | |||||
| 2026-02-03 | 13F | Sequoia Financial Advisors, LLC | 7.203 | 9,45 | 941 | 8,54 | ||||
| 2026-02-17 | 13F | Two Sigma Securities, Llc | 3.041 | -40,47 | 397 | -41,01 | ||||
| 2026-03-10 | 13F | MY.Alpha Management HK Advisors Ltd | 0 | -100,00 | 0 | |||||
| 2026-01-27 | 13F | TD Waterhouse Canada Inc. | 1.780 | 888,89 | 232 | 866,67 | ||||
| 2026-02-17 | 13F | Appaloosa Lp | 575.000 | -44,98 | 75.130 | -45,44 | ||||
| 2026-02-12 | 13F | Federated Hermes, Inc. | 10.784 | 150,79 | 1.409 | 148,94 | ||||
| 2026-02-05 | 13F | Fourier Capital Management Ltd | 9.370 | 1.224 | ||||||
| 2026-02-02 | 13F | Strs Ohio | 11.660 | -39,68 | 1.523 | -40,20 | ||||
| 2026-02-17 | 13F | Nomura Holdings Inc | 3.866 | -95,58 | 505 | -95,62 | ||||
| 2026-02-17 | 13F | Nomura Holdings Inc | Call | 174.100 | 314,52 | 22.748 | 311,04 | |||
| 2026-01-30 | 13F | Cullinan Associates Inc | 5.400 | 0,00 | 706 | -0,84 | ||||
| 2026-02-11 | 13F | Fox Run Management, L.l.c. | 0 | -100,00 | 0 | |||||
| 2026-02-20 | 13F/A | CMT Capital Markets Trading GmbH | 3.172 | 0 | ||||||
| 2026-02-11 | 13F | Primecap Management Co/ca/ | 11.103.600 | -8,33 | 1.450.796 | -9,10 | ||||
| 2025-10-21 | 13F | Capital Advisors Inc/ok | 0 | -100,00 | 0 | |||||
| 2026-02-17 | 13F | Lombard Odier Asset Management (USA) Corp | 6.820 | -57,58 | 891 | -57,93 | ||||
| 2025-11-12 | 13F | Group One Trading, L.p. | 0 | -100,00 | 0 | -100,00 | ||||
| 2025-09-26 | 13F | Capital A Wealth Management, LLC | 0 | -100,00 | 0 | |||||
| 2026-02-13 | 13F | State Street Corp | 86.974 | -40,32 | 11.364 | -40,82 | ||||
| 2026-02-12 | 13F | Advisors Asset Management, Inc. | 1.742 | -0,63 | 228 | -1,30 | ||||
| 2026-02-17 | 13F | Himension Fund | 0 | -100,00 | 0 | |||||
| 2026-02-17 | 13F | Summit Trail Advisors, Llc | 2.155 | -64,99 | 282 | -65,35 | ||||
| 2025-12-09 | 13F | Swiss Life Asset Management Ltd | 0 | -100,00 | 0 | -100,00 | ||||
| 2026-02-11 | 13F | Cerity Partners LLC | 7.536 | -22,19 | 985 | -22,88 | ||||
| 2026-02-10 | 13F | Belvedere Trading LLC | Call | 8.400 | 0,00 | 1.098 | -0,81 | |||
| 2026-02-18 | 13F | Beacon Pointe Advisors, LLC | 5.312 | 2,55 | 694 | 1,76 | ||||
| 2026-02-10 | 13F | Belvedere Trading LLC | Put | 8.300 | 388,24 | 1.084 | 383,93 | |||
| 2026-01-23 | 13F | U.S. Capital Wealth Advisors, LLC | 16.762 | 3,25 | 2.190 | 2,38 | ||||
| 2026-01-21 | 13F | Country Trust Bank | 0 | -100,00 | 0 | |||||
| 2026-01-15 | 13F | Frank, Rimerman Advisors LLC | 6.658 | 0,20 | 870 | -0,69 | ||||
| 2026-02-13 | 13F | Squarepoint Ops LLC | Call | 103.400 | -36,99 | 13.510 | -37,52 | |||
| 2026-02-13 | 13F | Squarepoint Ops LLC | Put | 285.800 | -10,52 | 37.343 | -11,27 | |||
| 2026-02-13 | 13F | Squarepoint Ops LLC | 161.190 | -76,08 | 21.061 | -76,29 | ||||
| 2026-02-19 | 13F/A | Axxcess Wealth Management, Llc | 7.000 | -0,53 | 915 | -1,40 | ||||
| 2026-01-27 | 13F | WealthCollab, LLC | 257 | 0,00 | 34 | 0,00 | ||||
| 2026-02-11 | 13F | Capital World Investors | 1.182.857 | 20,97 | 154.552 | 19,95 | ||||
| 2026-01-14 | 13F | Yarbrough Capital, LLC | 12.986 | 1.697 | ||||||
| 2026-02-17 | 13F | DV Trading LLC | Put | 7.200 | 941 | |||||
| 2026-02-17 | 13F | Lighthouse Investment Partners, LLC | 7.050 | -40,12 | 921 | -40,62 | ||||
| 2026-02-17 | 13F | DV Trading LLC | Call | 22.300 | 2.914 | |||||
| 2026-02-06 | 13F | Leonteq Securities AG | 28.518 | -58,89 | 3.726 | -59,23 | ||||
| 2026-01-23 | 13F | Robbins Farley Llc | 4 | 0,00 | 1 | |||||
| 2026-02-17 | 13F | Sig Brokerage, Lp | 0 | -100,00 | 0 | |||||
| 2026-02-13 | 13F | MYDA Advisors LLC | Call | 0 | -100,00 | 0 | ||||
| 2026-02-04 | 13F | Abc Arbitrage Sa | 6.681 | 47,45 | 873 | 46,06 | ||||
| 2025-11-07 | 13F | Prospect Financial Services LLC | 0 | -100,00 | 0 | |||||
| 2026-01-13 | 13F | Global X Japan Co., Ltd. | 145 | 0,00 | 19 | -5,26 | ||||
| 2026-02-12 | 13F | Bank Of Montreal /can/ | 118.622 | 601,37 | 15.499 | 595,65 | ||||
| 2026-02-11 | 13F | Brandywine Global Investment Management, LLC | 384.282 | 1,27 | 50.210 | 0,42 | ||||
| 2026-02-17 | 13F | Banco Bilbao Vizcaya Argentaria, S.a. | 0 | -100,00 | 0 | |||||
| 2026-02-11 | 13F | Parallel Advisors, LLC | 1.065 | 2,11 | 139 | 1,46 | ||||
| 2026-02-13 | 13F | Y-Intercept (Hong Kong) Ltd | 0 | -100,00 | 0 | |||||
| 2025-09-26 | NP | FBCG - Fidelity Blue Chip Growth ETF This fund is a listed as child fund of Fmr Llc and if that institution has disclosed ownership in this security, then these positions will not be double counted when calculating total shares and total value | 0 | -100,00 | 0 | -100,00 | ||||
| 2026-02-13 | 13F | Ally Financial Inc. | 11.000 | 0,00 | 1.437 | -0,83 | ||||
| 2025-10-28 | 13F | Campbell & CO Investment Adviser LLC | 0 | -100,00 | 0 | -100,00 | ||||
| 2025-09-25 | NP | DFA INVESTMENT DIMENSIONS GROUP INC - World ex U.S. Core Equity Portfolio Institutional Class Shares | 9.754 | -2,36 | 857 | -2,28 | ||||
| 2026-01-05 | 13F | Union Bancaire Privee, UBP SA | 17.518 | 0,00 | 2.028 | -1,94 | ||||
| 2026-01-15 | 13F | Westend Capital Management LLC | 0 | -100,00 | 0 | |||||
| 2026-01-26 | 13F | PFG Investments, LLC | 2.040 | 267 | ||||||
| 2026-01-30 | 13F | Sigma Planning Corp | 1.734 | 1,29 | 227 | 0,44 | ||||
| 2026-02-17 | 13F | Symmetry Peak Management Llc | Put | 0 | -100,00 | 0 | ||||
| 2026-02-13 | 13F | Hel Ved Capital Management Ltd | 49.530 | 6.472 | ||||||
| 2026-02-17 | 13F | Strive Financial Group ,LLC | 48 | 6 | ||||||
| 2026-02-13 | 13F | Integrated Wealth Concepts LLC | 0 | -100,00 | 0 | |||||
| 2026-02-06 | 13F | Leonteq Securities AG | Call | 25.000 | 3.266 | |||||
| 2026-02-06 | 13F | Leonteq Securities AG | Put | 25.500 | -49,00 | 3.332 | -49,44 | |||
| 2025-09-26 | NP | PGJ - Invesco Golden Dragon China ETF This fund is a listed as child fund of Invesco Ltd. and if that institution has disclosed ownership in this security, then these positions will not be double counted when calculating total shares and total value | 102.171 | -11,57 | 8.978 | -11,52 | ||||
| 2026-02-06 | 13F | Maj Invest Holding A/S | 850 | 0,00 | 0 | |||||
| 2026-02-06 | 13F | Pzena Investment Management Llc | 56.507 | -32,59 | 7.383 | -33,16 | ||||
| 2026-02-17 | 13F/A | RBF Capital, LLC | 3.250 | 0,00 | 425 | -0,93 | ||||
| 2026-02-13 | 13F | Mariner, LLC | 198.169 | 0,83 | 25.894 | -0,01 | ||||
| 2026-02-17 | 13F | Ameriprise Financial Inc | 26.695 | -48,33 | 3.493 | -48,67 | ||||
| 2025-09-25 | NP | DFEV - Dimensional Emerging Markets Value ETF | 4.365 | -27,17 | 384 | -27,19 | ||||
| 2025-11-14 | 13F | Strategic Wealth Designers | 0 | -100,00 | 0 | |||||
| 2026-03-12 | 13F | Nalls Sherbakoff Group, Llc | 30 | 0,00 | 4 | 0,00 | ||||
| 2025-10-21 | 13F | Jarislowsky, Fraser Ltd | 1.764 | 232 | ||||||
| 2025-09-26 | NP | IVES - Dan IVES Wedbush AI Revolution ETF | 98.874 | 8.688 | ||||||
| 2026-01-30 | 13F | Turning Point Benefit Group, Inc. | 4 | 0,00 | 1 | |||||
| 2026-02-17 | 13F | Farallon Capital Management Llc | 315.300 | 51,59 | 41.197 | 50,32 | ||||
| 2026-01-23 | 13F | Private Wealth Management Group, LLC | 200 | 0,00 | 26 | 0,00 | ||||
| 2026-02-17 | 13F | Lazard Asset Management Llc | 30.293 | -21,77 | 3.958 | -22,42 | ||||
| 2026-02-17 | 13F | Claro Advisors LLC | 1.726 | 0,00 | 226 | -0,88 | ||||
| 2026-01-16 | 13F | Crowley Wealth Management, Inc. | 0 | -100,00 | 0 | |||||
| 2026-01-23 | 13F | Robeco Institutional Asset Management B.V. | 1.411.937 | -8,28 | 184.484 | -9,05 | ||||
| 2026-02-17 | 13F | Brevan Howard Capital Management LP | Put | 75.000 | 0,00 | 9.800 | -0,84 | |||
| 2026-02-17 | 13F | Brevan Howard Capital Management LP | Call | 445.800 | -82,12 | 57.758 | -82,42 | |||
| 2026-02-17 | 13F | Brevan Howard Capital Management LP | 92.203 | -29,35 | 11.946 | -30,54 | ||||
| 2025-11-12 | 13F/A | Norges Bank | 319.116 | 33.600 | ||||||
| 2026-02-17 | 13F | Hilltop Holdings Inc. | 0 | -100,00 | 0 | |||||
| 2026-01-21 | 13F | Steadtrust LLC | 8.325 | -21,05 | 1.088 | -21,74 | ||||
| 2025-11-14 | 13F | Shay Capital LLC | Put | 0 | -100,00 | 0 | -100,00 | |||
| 2026-01-09 | 13F | SG Americas Securities, LLC | Call | 150.100 | 1,35 | 4 | -40,00 | |||
| 2026-02-12 | 13F | Wealthspire Advisors, LLC | 0 | -100,00 | 0 | |||||
| 2026-02-17 | 13F | Dv Equities, Llc | 3.007 | 393 | ||||||
| 2026-02-02 | 13F | Benjamin Edwards Inc | 5.619 | 734 | ||||||
| 2026-02-10 | 13F | Eurizon Capital SGR S.p.A. | 4.602 | 601 | ||||||
| 2026-02-02 | 13F | Highland Capital Management, Llc | 5.530 | -9,34 | 723 | -10,09 | ||||
| 2025-11-13 | 13F | Kayne Anderson Rudnick Investment Management Llc | 0 | -100,00 | 0 | |||||
| 2026-02-10 | 13F | Fideuram Asset Management (Ireland) dac | 77.627 | 7.046 | ||||||
| 2026-02-02 | 13F | Qrg Capital Management, Inc. | 2.321 | -7,09 | 303 | -7,90 | ||||
| 2026-02-10 | 13F | NINE MASTS CAPITAL Ltd | 19.811 | -44,98 | 2.589 | -47,51 | ||||
| 2026-02-17 | 13F | Delaware Management Holdings, Inc. | 1.028.269 | 134.354 | ||||||
| 2026-02-13 | 13F | Contrarian Capital Management, L.l.c. | 102.139 | 0,00 | 13.345 | -0,84 | ||||
| 2026-02-13 | 13F | JustInvest LLC | 5.271 | 14,99 | 689 | 13,91 | ||||
| 2026-02-12 | 13F | Barometer Capital Management Inc. | 70.685 | 631,35 | 5.030 | 295,05 | ||||
| 2026-02-17 | 13F | Parallax Volatility Advisers, L.P. | Put | 182.800 | 58,41 | 23.885 | 57,07 | |||
| 2026-02-17 | 13F | Parallax Volatility Advisers, L.P. | Call | 330.100 | 21,81 | 43.131 | 20,78 | |||
| 2025-09-26 | NP | OWSMX - Old Westbury Small & Mid Cap Strategies Fund | 82.263 | 0,00 | 7.228 | 0,06 | ||||
| 2026-02-17 | 13F | Advisor Group Holdings, Inc. | 25.483 | -7,80 | 3.330 | -3,51 | ||||
| 2025-10-30 | 13F | Ridgewood Investments LLC | Call | 0 | -100,00 | 0 | -100,00 | |||
| 2026-02-06 | 13F | Gsa Capital Partners Llp | 0 | -100,00 | 0 | |||||
| 2026-01-08 | 13F | Chesapeake Asset Management Llc | 1.045 | 4,50 | 137 | 3,82 | ||||
| 2026-01-23 | 13F | Assetmark, Inc | 2.132 | 48,26 | 279 | 47,09 | ||||
| 2026-02-13 | 13F | Baldwin Investment Management, LLC | 3.102 | 0,00 | 405 | -0,74 | ||||
| 2026-02-04 | 13F | Ameritas Advisory Services, LLC | 0 | -100,00 | 0 | |||||
| 2026-01-23 | 13F | Farther Finance Advisors, LLC | 2.453 | 535,49 | 321 | 540,00 | ||||
| 2026-02-09 | 13F | Themes Management Co LLC | 11.078 | 1.447 | ||||||
| 2026-02-05 | 13F | Plante Moran Financial Advisors, LLC | 0 | -100,00 | 0 | |||||
| 2026-02-13 | 13F | Caitong International Asset Management Co., Ltd | 22 | -80,36 | 3 | -85,71 | ||||
| 2025-11-14 | 13F | Jain Global LLC | 0 | -100,00 | 0 | |||||
| 2026-02-12 | 13F | Ci Investments Inc. | 36.508 | -19,42 | 4.770 | 95.300,00 | ||||
| 2026-01-27 | 13F | Elevated Capital Advisors, LLC | 3 | 0 | ||||||
| 2026-02-17 | 13F | Ionic Capital Management LLC | Call | 0 | -100,00 | 0 | -100,00 | |||
| 2026-02-12 | 13F | CIBC Private Wealth Group, LLC | 136 | -76,01 | 18 | -77,03 | ||||
| 2026-01-30 | 13F | Mitsubishi UFJ Trust & Banking Corp | 7.724 | 45,57 | 1.009 | 44,35 | ||||
| 2026-02-02 | 13F | Miracle Mile Advisors, LLC | 3.156 | 6,16 | 412 | 5,37 | ||||
| 2025-10-21 | 13F | Optimum Investment Advisors | 120 | 0,00 | 16 | 50,00 | ||||
| 2026-02-17 | 13F | Balyasny Asset Management Llc | 248.203 | 5.302,76 | 32.430 | 5.260,33 | ||||
| 2025-11-12 | 13F | NewSquare Capital LLC | 0 | -100,00 | 0 | |||||
| 2026-02-11 | 13F | Syon Capital Llc | 1.694 | 221 | ||||||
| 2026-02-17 | 13F | Qube Research & Technologies Ltd | Put | 319.000 | 45,26 | 41.681 | 44,04 | |||
| 2026-02-17 | 13F | Qube Research & Technologies Ltd | Call | 390.700 | 46,71 | 51.049 | 45,48 | |||
| 2025-11-07 | 13F | Fifth Third Bancorp | 0 | -100,00 | 0 | |||||
| 2026-01-23 | 13F | Lester Murray Antman dba SimplyRich | 5.615 | -4,75 | 1 | |||||
| 2026-02-13 | 13F | Sequoia China Equity Partners (Hong Kong) Ltd | 0 | -100,00 | 0 | |||||
| 2026-02-13 | 13F | Infini Capital Management Ltd | 0 | -100,00 | 0 | |||||
| 2026-02-04 | 13F | HighPoint Advisor Group LLC | 4.675 | -15,08 | 611 | -15,86 | ||||
| 2026-02-06 | 13F | Creative Financial Designs Inc /adv | 200 | 0,00 | 26 | 0,00 | ||||
| 2026-02-12 | 13F | Adviser Investments LLC | 2.423 | 0,00 | 317 | -0,94 | ||||
| 2026-02-10 | 13F | Savant Capital, LLC | 1.856 | 17,77 | 243 | 16,91 | ||||
| 2026-02-17 | 13F | Royal Bank Of Canada | 209.279 | -27,36 | 27.343 | -27,97 | ||||
| 2026-02-17 | 13F | Wealth Watch Advisors, INC | 8 | 1 | ||||||
| 2026-02-17 | 13F | Balyasny Asset Management Llc | Call | 46.500 | -24,27 | 6.076 | -24,91 | |||
| 2026-01-15 | 13F | Allspring Global Investments Holdings, LLC | 2.149 | 323 | ||||||
| 2026-02-17 | 13F | Balyasny Asset Management Llc | Put | 106.500 | -23,05 | 13.915 | -23,69 | |||
| 2026-01-09 | 13F | Assenagon Asset Management S.A. | 130.367 | 100,83 | 17.034 | 99,15 | ||||
| 2026-02-09 | 13F | Kazazian Asset Management, LLC | 7.720 | 0,00 | 1.009 | -0,88 | ||||
| 2026-02-11 | 13F | Capital Wealth Planning, LLC | 54.067 | 8.126 | ||||||
| 2026-02-17 | 13F | MIRAE ASSET GLOBAL ETFS HOLDINGS Ltd. | 306.789 | 9,20 | 40.092 | 8,27 | ||||
| 2026-01-16 | 13F | Matauro, Llc | 0 | -100,00 | 0 | -100,00 | ||||
| 2026-01-12 | 13F | World Equity Group, Inc. | 2.298 | 0,09 | 300 | -0,66 | ||||
| 2026-02-17 | 13F | Evergreen Quality Fund GP, Ltd. | 0 | -100,00 | 0 | |||||
| 2025-11-13 | 13F | AlphaStar Capital Management, LLC | 0 | -100,00 | 0 | |||||
| 2025-09-25 | NP | DFA INVESTMENT DIMENSIONS GROUP INC - Emerging Markets Social Core Equity Portfolio Shares | 4.316 | 0,00 | 379 | 0,00 | ||||
| 2026-01-20 | 13F | AdvisorNet Financial, Inc | 244 | 0,00 | 32 | -3,12 | ||||
| 2026-02-05 | 13F | Commerzbank Aktiengesellschaft /fi | 2.069 | 0,00 | 0 | |||||
| 2026-02-02 | 13F | Truist Financial Corp | 2.677 | 11,82 | 350 | 10,79 | ||||
| 2026-02-13 | 13F | National Bank Of Canada /fi/ | 6.273 | 23,10 | 819 | 22,06 | ||||
| 2026-02-10 | 13F | Bank of New York Mellon Corp | 4.636 | 143,62 | 606 | 142,00 | ||||
| 2026-02-13 | 13F | Silicon Valley Capital Partners | 100 | 0,00 | 13 | 0,00 | ||||
| 2026-01-14 | 13F | Generali Investments CEE, investicni spolecnost, a.s. | 8.130 | -36,63 | 1.062 | -37,16 | ||||
| 2026-02-11 | 13F | Vise Technologies, Inc. | 2.163 | 6,13 | 283 | 5,22 | ||||
| 2026-02-18 | 13F | Mackenzie Financial Corp | 36.681 | -8,65 | 4.846 | -8,41 | ||||
| 2026-01-20 | 13F | Joule Financial, LLC | 7.820 | -6,09 | 1.022 | -6,93 |