Grundlæggende statistik
| Institutionelle ejere | 502 total, 484 long only, 3 short only, 15 long/short - change of 7,96% MRQ |
| Gennemsnitlig porteføljeallokering | 0.1697 % - change of -42,05% MRQ |
| Institutionelle aktier (lange) | 52.886.484 (ex 13D/G) - change of 7,55MM shares 16,66% MRQ |
| Institutionel værdi (lang) | $ 2.183.497 USD ($1000) |
Institutionelt ejerskab og aktionærer
Global X Funds - Global X Uranium ETF (US:URA) har 502 institutionelle ejere og aktionærer, der har indsendt 13D/G- eller 13F-formularer til Securities Exchange Commission (SEC). Disse institutioner har i alt 52,886,484 aktier. Største aktionærer omfatter Susquehanna International Group, Llp, Bank Of America Corp /de/, Morgan Stanley, Susquehanna International Group, Llp, Jpmorgan Chase & Co, Tudor Investment Corp Et Al, Phoenix Holdings Ltd., Wells Fargo & Company/mn, Jane Street Group, Llc, and LPL Financial LLC .
Global X Funds - Global X Uranium ETF (ARCA:URA) institutionel ejerskabsstruktur viser aktuelle positioner i virksomheden efter institutioner og fonde, samt seneste ændringer i positionsstørrelse. Større aktionærer kan omfatte individuelle investorer, investeringsforeninger, hedgefonde eller institutioner. Skema 13D angiver, at investoren besidder (eller besidder) mere end 5 % af virksomheden og har til hensigt (eller har til hensigt at) aktivt at forfølge en ændring i forretningsstrategi. Skema 13G indikerer en passiv investering på over 5%.
The share price as of April 24, 2026 is 55,31 / share. Previously, on April 28, 2025, the share price was 25,05 / share. This represents an increase of 120,80% over that period.

Fondens stemningsscore
Fund Sentiment Score (fka Ownership Accumulation Score) finder de aktier, der bliver mest købt af fonde. Det er resultatet af en sofistikeret, multi-faktor kvantitativ model, der identificerer virksomheder med de højeste niveauer af institutionel akkumulering. Scoringsmodellen bruger en kombination af den samlede stigning i oplyste ejere, ændringerne i porteføljeallokeringer i disse ejere og andre målinger. Tallet går fra 0 til 100, hvor højere tal indikerer et højere niveau af akkumulering for sine jævnaldrende, og 50 er gennemsnittet.
Opdateringsfrekvens: Dagligt
Se Ownership Explorer, som giver en liste over højest rangerende virksomheder.
AI+ Ask Fintel’s AI assistant about Global X Funds - Global X Uranium ETF.
Select a question to share a public post with an AI-crafted answer.
Thinking of good questions…
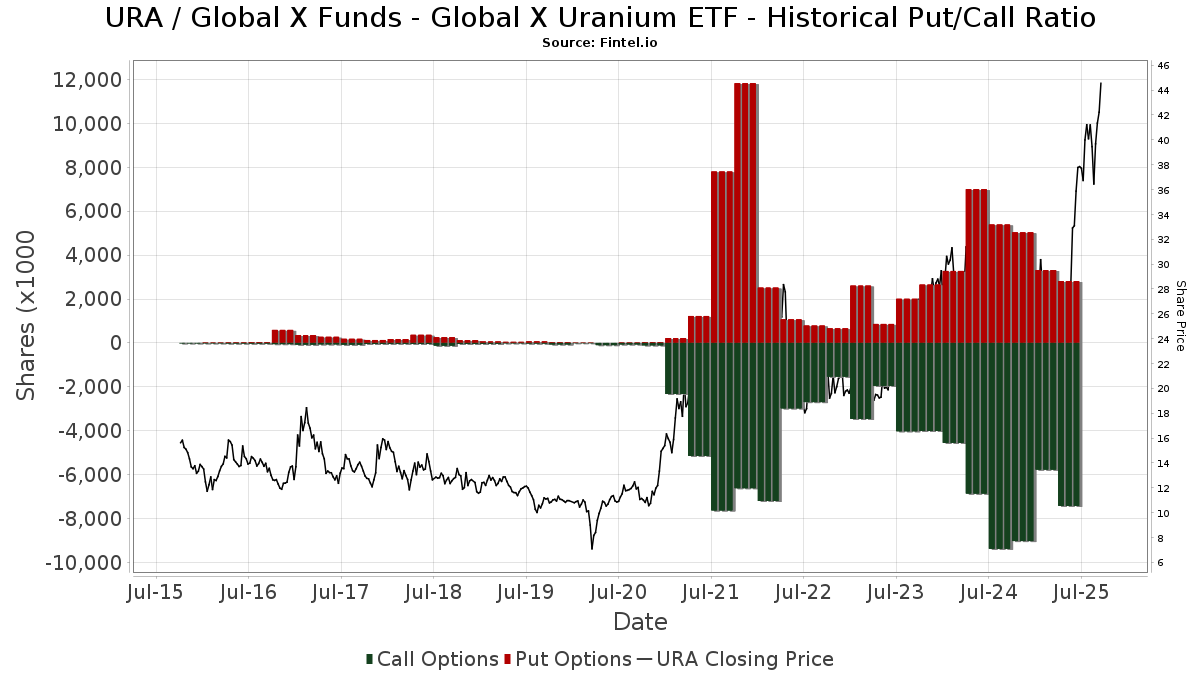
Institutionel Put/Call-forhold
Ud over at indberette standardaktie- og gældsudstedelser skal institutter med mere end 100 mill. aktiver under forvaltning også oplyse deres put- og call-optionsbeholdninger. Da salgsoptioner generelt indikerer negativ stemning, og købsoptioner indikerer positiv stemning, kan vi få en fornemmelse af den overordnede institutionelle stemning ved at plotte forholdet mellem put og kald. Diagrammet til højre viser det historiske put/call-forhold for dette instrument.
Brug af Put/Call Ratio som en indikator for investorernes stemning overvinder en af de vigtigste mangler ved at bruge totalt institutionelt ejerskab, som er, at en betydelig mængde af aktiver under forvaltning investeres passivt for at spore indekser. Passivt forvaltede fonde køber typisk ikke optioner, så indikatoren for put/call-forholdet følger mere nøje følelsen af aktivt forvaltede fonde.
13F og NPORT arkivering
Detaljer om 13F-arkivering er gratis. Detaljer om NP-ansøgninger kræver et premium-medlemskab. Grønne rækker angiver nye positioner. Røde rækker angiver lukkede positioner. Klik på linket ikon for at se den fulde transaktionshistorik.
Opgrader
for at låse premium-data op og eksportere til Excel ![]() .
.
| Fil dato | Kilde | Investor | Type | Gennemsnitlig pris (Øst) |
Aktier | Δ Aktier (%) |
Rapporteret Værdi ($1000) |
Δ Værdi (%) |
Port Alloc (%) |
|
|---|---|---|---|---|---|---|---|---|---|---|
| 2026-01-27 | 13F | Legacy Advisors, LLC | 10.438 | 0,00 | 468 | -6,04 | ||||
| 2025-11-04 | 13F | ASB Consultores, LLC | 0 | -100,00 | 0 | -100,00 | ||||
| 2026-04-16 | 13F | Henrickson Nauta Wealth Advisors, Inc. | 12.862 | -50,00 | 623 | -50,99 | ||||
| 2026-01-21 | 13F | Persium Advisors, LLC | 0 | -100,00 | 0 | |||||
| 2026-02-11 | 13F | J.Safra Asset Management Corp | 10.100 | 2,64 | 432 | -8,10 | ||||
| 2026-02-13 | 13F | Barclays Plc | 133.561 | 1.458,11 | 5.707 | 1.298,77 | ||||
| 2026-01-14 | 13F | ORG Partners LLC | 300 | 0,00 | 13 | -14,29 | ||||
| 2025-11-14 | 13F | Evelyn Partners Investment Management LLP | 0 | -100,00 | 0 | -100,00 | ||||
| 2025-11-14 | 13F | BlueCrest Capital Management Ltd | 37.800 | 1.802 | ||||||
| 2026-02-10 | 13F | Core Wealth Advisors, Llc | 1 | 0 | ||||||
| 2026-02-04 | 13F | Wsfs Capital Management, Llc | 0 | -100,00 | 0 | |||||
| 2026-02-12 | 13F | Brinker Capital Investments, LLC | 12.274 | 54,37 | 524 | 38,26 | ||||
| 2026-04-17 | 13F | McHugh Group, LLC | 39.239 | 6,34 | 1.900 | 20,56 | ||||
| 2026-02-09 | 13F | Annis Gardner Whiting Capital Advisors, LLC | 3.405 | 0,00 | 145 | -10,49 | ||||
| 2026-02-17 | 13F | LMR Partners LLP | Call | 0 | -100,00 | 0 | ||||
| 2025-11-12 | 13F | Creative Financial Designs Inc /adv | 0 | -100,00 | 0 | |||||
| 2026-04-06 | 13F | Highline Wealth Partners Llc | 150 | -72,73 | 7 | -69,57 | ||||
| 2026-04-22 | 13F | Coastal Investment Advisors, Inc. | 1.775 | 0,00 | 86 | 13,33 | ||||
| 2026-02-12 | 13F | FreeGulliver LLC | 16.217 | -3,24 | 693 | -13,28 | ||||
| 2026-04-22 | 13F | Patriot Financial Group Insurance Agency, LLC | 27.706 | 109,58 | 1.342 | 137,77 | ||||
| 2026-04-14 | 13F | Southland Equity Partners LLC | 6.761 | 327 | ||||||
| 2026-04-22 | 13F | Continuum Advisory, LLC | 4.957 | 240 | ||||||
| 2026-02-11 | 13F | Picton Mahoney Asset Management | 1.000 | 0,00 | 43 | |||||
| 2025-11-13 | 13F | Total Investment Management Inc | 0 | -100,00 | 0 | -100,00 | ||||
| 2026-02-12 | 13F | Colonial Trust Advisors | 100 | 4 | ||||||
| 2026-02-17 | 13F | Scopus Asset Management, L.p. | Put | 250.000 | -37,50 | 10.682 | -43,98 | |||
| 2026-02-09 | 13F | Premier Financial Group | 0 | -100,00 | 0 | |||||
| 2026-02-17 | 13F | Pinnacle Financial Partners, Inc. | 18.966 | 810 | ||||||
| 2026-04-17 | 13F | Worth Asset Management, LLC | 0 | -100,00 | 0 | |||||
| 2026-02-03 | 13F | Encompass More Asset Management | 9.434 | 403 | ||||||
| 2026-04-21 | 13F | Savior LLC | 22.194 | 3,30 | 1.075 | 16,99 | ||||
| 2025-11-04 | 13F | Pineridge Advisors LLC | 345 | 0,00 | 16 | 23,08 | ||||
| 2026-02-17 | 13F | Glenmede Trust Co Na | 244 | 0,00 | 10 | 100,00 | ||||
| 2026-04-15 | 13F | Financial Management Professionals, Inc. | 100 | 0,00 | 5 | 0,00 | ||||
| 2026-01-27 | 13F | Revisor Wealth Management LLC | 8.563 | 426 | ||||||
| 2026-01-14 | 13F | Canoe Financial LP | 0 | -100,00 | 0 | |||||
| 2025-11-14 | 13F | NorthRock Partners, LLC | 0 | -100,00 | 0 | -100,00 | ||||
| 2026-02-13 | 13F | AlTi Global, Inc. | 25.065 | 1.071 | ||||||
| 2026-01-20 | 13F | Savvy Advisors, Inc. | 0 | -100,00 | 0 | |||||
| 2026-02-17 | 13F | Caption Management, LLC | Call | 207.500 | -21,70 | 8.866 | -29,81 | |||
| 2026-03-13 | 13F | ARP Global Capital Ltd | 35.613 | 1.522 | ||||||
| 2026-02-10 | 13F | JTC Employer Solutions Trusteee Ltd | 3.309 | 0,00 | 0 | |||||
| 2026-02-05 | 13F | Owen LaRue, LLC | 13.800 | 7,81 | 590 | -3,44 | ||||
| 2026-02-17 | 13F | DV Trading LLC | 2.000 | 85 | ||||||
| 2026-02-13 | 13F | Kilter Group LLC | 127 | 5 | ||||||
| 2026-02-17 | 13F | Wealth Watch Advisors, INC | 0 | -100,00 | 0 | |||||
| 2026-02-17 | 13F | Toronto Dominion Bank | 22 | 1 | ||||||
| 2025-11-14 | 13F | Marathon Capital Management | 0 | -100,00 | 0 | |||||
| 2026-02-04 | 13F | Money Concepts Capital Corp | 45.043 | -11,12 | 1.925 | -20,33 | ||||
| 2026-02-12 | 13F | BRYN MAWR TRUST Co | 472 | 0,00 | 20 | -9,09 | ||||
| 2026-02-17 | 13F | Caption Management, LLC | 40.547 | 189,62 | 1.733 | 159,67 | ||||
| 2026-02-17 | 13F | Caption Management, LLC | Put | 175.100 | 7.482 | |||||
| 2026-02-17 | 13F | Asset One Wealth Management LLC | 93.787 | 4.996 | ||||||
| 2026-03-16 | 13F/A | Rockefeller Capital Management L.P. | 51.871 | 9,32 | 2.216 | -1,99 | ||||
| 2026-02-13 | 13F | Colony Group, LLC | 20.220 | 5,18 | 865 | -5,68 | ||||
| 2026-02-11 | 13F | Empowered Funds, LLC | 33.248 | -3,56 | 1.421 | -13,57 | ||||
| 2026-02-13 | 13F | Diametric Capital, LP | 6.650 | 10,23 | 284 | -1,05 | ||||
| 2026-02-13 | 13F | SRS Capital Advisors, Inc. | 2.150 | 92 | ||||||
| 2026-02-13 | 13F | Mariner, LLC | 28.153 | 42,36 | 1.203 | 27,60 | ||||
| 2026-02-17 | 13F | Sig Brokerage, Lp | Call | 10.000 | -13,04 | 427 | -22,08 | |||
| 2026-02-12 | 13F | Intesa Sanpaolo Wealth Management | 6.360 | 272 | ||||||
| 2026-02-09 | 13F | Blue Bell Private Wealth Management, Llc | 175 | 0,00 | 7 | -12,50 | ||||
| 2026-02-05 | 13F | Park Square Financial Group, LLC | 14 | 0 | ||||||
| 2025-11-04 | 13F | IMC-Chicago, LLC | 0 | -100,00 | 0 | -100,00 | ||||
| 2026-02-12 | 13F | Bank Of Montreal /can/ | Put | 0 | -100,00 | 0 | -100,00 | |||
| 2026-04-20 | 13F | Banque Cantonale Vaudoise | 3.251 | 157 | ||||||
| 2026-01-08 | 13F | Ulland Investment Advisors, LLC | 3.574 | -0,03 | 0 | |||||
| 2026-02-13 | 13F | Caxton Associates Llp | 0 | -100,00 | 0 | |||||
| 2026-02-17 | 13F | TCG Advisory Services, LLC | 6.030 | 258 | ||||||
| 2026-01-29 | 13F | UBS Group AG | Call | 862.084 | -42,96 | 36.837 | -48,87 | |||
| 2026-01-29 | 13F | UBS Group AG | 1.155.175 | -30,63 | 49.361 | -37,82 | ||||
| 2026-02-11 | 13F | Ameraudi Asset Management, Inc. | 38.446 | -3,89 | 1.643 | -13,85 | ||||
| 2026-02-12 | 13F | Great Valley Advisor Group, Inc. | 29.780 | 15,78 | 1.272 | 3,84 | ||||
| 2026-02-13 | 13F | Centaurus Financial, Inc. | 2.416 | 0 | ||||||
| 2026-02-17 | 13F | Brevan Howard Capital Management LP | 8.565 | -71,77 | 369 | -74,78 | ||||
| 2026-02-17 | 13F | Ameriflex Group, Inc. | 4.433 | -34,69 | 189 | -41,49 | ||||
| 2026-02-13 | 13F | Centerpoint Advisors, LLC | 850 | 0,00 | 0 | |||||
| 2026-02-17 | 13F | Spruce Point Capital Management, Llc | 32.879 | 1.405 | ||||||
| 2026-04-20 | 13F | Eagle Strategies LLC | 83.959 | -26,64 | 4.066 | -16,85 | ||||
| 2026-04-20 | 13F | Brian Low Financial Group, Llc | 0 | -100,00 | 0 | |||||
| 2026-04-24 | 13F | Heritage Oak Wealth Advisors Llc | 25.285 | 31,34 | 1.225 | 48,91 | ||||
| 2026-02-17 | 13F | Raymond James Financial Inc | 349.928 | -28,59 | 14.952 | -35,99 | ||||
| 2026-01-21 | 13F | Walkner Condon Financial Advisors LLC | 20.355 | -1,36 | 870 | -11,24 | ||||
| 2026-02-09 | 13F | Hartland & Co., LLC | 11 | 0 | ||||||
| 2026-02-12 | 13F | Gould Capital, LLC | 535 | 1.428,57 | 23 | 2.100,00 | ||||
| 2026-02-03 | 13F | Legacy Wealth Managment, LLC/ID | 918 | 39 | ||||||
| 2026-02-12 | 13F | Lane Generational LLC | 8.266 | 0,00 | 353 | -10,41 | ||||
| 2026-02-10 | 13F | CIBC World Markets Inc. | 76.340 | -24,92 | 3.262 | -32,69 | ||||
| 2026-04-07 | 13F | Farther Finance Advisors, LLC | 50.703 | 128,07 | 2.498 | 163,12 | ||||
| 2025-11-06 | 13F | Compagnie Lombard Odier SCmA | 0 | -100,00 | 0 | -100,00 | ||||
| 2026-03-16 | 13F | Osbon Capital Management Llc | 200 | 9 | ||||||
| 2026-04-21 | 13F | Financial Consulate, Inc | 281 | 0,00 | 14 | 8,33 | ||||
| 2026-02-12 | 13F | Proficio Capital Partners LLC | 24.478 | 1.046 | ||||||
| 2026-02-13 | 13F | Itau Unibanco Holding S.A. | 5.520 | -89,07 | 236 | -90,23 | ||||
| 2026-02-12 | 13F | Commonwealth Equity Services, Llc | 174.272 | 9,00 | 7.447 | 106.271,43 | ||||
| 2026-04-23 | 13F | Spinnaker Trust | 284.627 | 1,29 | 13.784 | 14,80 | ||||
| 2026-01-23 | 13F | Sumitomo Mitsui Trust Holdings, Inc. | 5.000 | 214 | ||||||
| 2026-01-29 | 13F | LFA - Lugano Financial Advisors SA | 715 | 0,00 | 31 | -11,76 | ||||
| 2026-02-12 | 13F | Prudent Man Investment Management, Inc. | 200 | 0,00 | 9 | 60,00 | ||||
| 2026-02-24 | 13F | Astoria Portfolio Advisors LLC. | 4.516 | 4,22 | 241 | 9,05 | ||||
| 2025-11-07 | 13F | Synovus Financial Corp | 16.938 | 29,05 | 807 | 58,55 | ||||
| 2026-04-15 | 13F | Merit Financial Group, LLC | 21.832 | 0,54 | 1.057 | 14,02 | ||||
| 2025-11-14 | 13F | Credit Agricole S A | 0 | -100,00 | 0 | |||||
| 2025-11-14 | 13F | Hamilton Wealth, LLC | 0 | -100,00 | 0 | |||||
| 2026-01-16 | 13F | Crowley Wealth Management, Inc. | 0 | -100,00 | 0 | |||||
| 2026-02-10 | 13F | Goldman Sachs Group Inc | Call | 71.700 | 0,00 | 3.064 | -10,36 | |||
| 2026-01-29 | 13F | Kestra Private Wealth Services, Llc | 0 | -100,00 | 0 | |||||
| 2026-01-29 | 13F | Koa Wealth Management, LLC | 46.147 | 7,46 | 1.972 | -3,71 | ||||
| 2025-11-04 | 13F | Tyche Wealth Partners LLC | 0 | -100,00 | 0 | |||||
| 2026-02-05 | 13F | Freemont Management S.A. | 70.000 | 0,00 | 2.991 | -10,34 | ||||
| 2026-02-10 | 13F | Goldman Sachs Group Inc | 344.258 | 20,46 | 14.710 | 7,98 | ||||
| 2026-01-27 | 13F | Berger Financial Group, Inc | 12.083 | 161,20 | 516 | 134,55 | ||||
| 2026-02-09 | 13F | MTM Investment Management, LLC | 600 | 0,00 | 26 | -10,71 | ||||
| 2026-01-30 | 13F | Sigma Planning Corp | 11.146 | 3,81 | 476 | -6,85 | ||||
| 2026-02-05 | 13F | PCG Wealth Advisors, LLC | 16.070 | -75,99 | 687 | -78,50 | ||||
| 2026-02-17 | 13F | Lloyd Harbor Capital Management, LLC | Put | 0 | -100,00 | 0 | ||||
| 2026-01-29 | 13F | UBS Group AG | Put | 0 | -100,00 | 0 | -100,00 | |||
| 2026-02-06 | 13F | Keystone Financial Group | 5.603 | 28,72 | 239 | 15,46 | ||||
| 2026-02-02 | 13F | Benjamin Edwards Inc | 13.508 | -3,49 | 577 | -13,49 | ||||
| 2026-04-16 | 13F | Diversified Trust Co | 4.465 | 216 | ||||||
| 2026-01-26 | 13F | Moran Wealth Management, LLC | 23.538 | 13,11 | 1.006 | 1,41 | ||||
| 2026-04-23 | 13F | Harbor Investment Advisory, Llc | 750 | 0,00 | 36 | 12,50 | ||||
| 2026-02-17 | 13F | Point72 Asset Management, L.P. | Call | 0 | -100,00 | 0 | ||||
| 2026-02-03 | 13F | Sound Financial Strategies Group, LLC | 4 | 0 | ||||||
| 2026-04-23 | 13F | SMART Wealth LLC | 44.584 | 7,68 | 2.159 | 22,05 | ||||
| 2026-02-10 | 13F | Tidemark, LLC | 4.778 | -1,87 | 204 | -12,07 | ||||
| 2026-02-11 | 13F | Cerity Partners LLC | 10.257 | 5,14 | 438 | -5,81 | ||||
| 2026-02-13 | 13F | Walleye Trading LLC | Call | 168.200 | 34,67 | 7.187 | 20,73 | |||
| 2026-02-19 | 13F | CI Private Wealth, LLC | 520.248 | 761,34 | 2.883 | 0,14 | ||||
| 2026-04-16 | 13F | Brookstone Capital Management | 21.954 | 136,45 | 1.063 | 168,43 | ||||
| 2026-02-17 | 13F | Fmr Llc | 1.558 | -37,10 | 67 | -44,07 | ||||
| 2025-11-12 | 13F | Creekmur Asset Management LLC | 854 | -1,16 | 41 | 21,21 | ||||
| 2026-01-21 | 13F | Newbridge Financial Services Group, Inc. | 259 | 3,60 | 11 | 0,00 | ||||
| 2026-02-17 | 13F | Qube Research & Technologies Ltd | 26.694 | 1.004,43 | 1.141 | 891,30 | ||||
| 2026-02-02 | 13F | GenTrust, LLC | 622.588 | -48,95 | 27.901 | -52,01 | ||||
| 2026-02-13 | 13F | Walleye Trading LLC | Put | 149.100 | 32,53 | 6.371 | 18,82 | |||
| 2026-02-17 | 13F | Massar Capital Management, LP | 97.500 | 77,27 | 4.166 | 58,95 | ||||
| 2026-02-11 | 13F | LPL Financial LLC | 1.698.090 | 7,27 | 72.559 | -3,84 | ||||
| 2026-04-15 | 13F | Archford Capital Strategies, LLC | 9.546 | -14,97 | 462 | -3,55 | ||||
| 2026-02-17 | 13F | Parallax Volatility Advisers, L.P. | 1 | 0,00 | 0 | |||||
| 2026-01-27 | 13F | Friedenthal Financial | 0 | -100,00 | 0 | |||||
| 2026-01-26 | 13F | Reyes Financial Architecture, Inc. | 761 | 16,90 | 33 | 3,23 | ||||
| 2026-04-21 | 13F | Paradigm Financial Partners, Llc | 14.357 | -82,86 | 695 | -80,58 | ||||
| 2026-02-17 | 13F | EFG International AG | 111.867 | 4.781 | ||||||
| 2026-02-17 | 13F | Parallax Volatility Advisers, L.P. | Call | 159.100 | 18,38 | 6.798 | 6,12 | |||
| 2026-02-17 | 13F | Parallax Volatility Advisers, L.P. | Put | 350.800 | 35,39 | 14.990 | 21,36 | |||
| 2026-01-27 | 13F | Q3 Asset Management | 0 | -100,00 | 0 | |||||
| 2026-02-13 | 13F | Squarepoint Ops LLC | Call | 24.800 | -3,12 | 1.060 | -13,20 | |||
| 2026-02-13 | 13F | Squarepoint Ops LLC | Put | 21.700 | 0,00 | 927 | -10,35 | |||
| 2026-02-04 | 13F | Clark Wealth Partners | 1 | 0,00 | 0 | |||||
| 2026-02-12 | 13F | Rossby Financial, LCC | 215 | 0,00 | 9 | -10,00 | ||||
| 2026-01-26 | 13F | Cwm, Llc | 2.319 | 99,57 | 0 | |||||
| 2026-02-13 | 13F | Resources Investment Advisors, LLC. | 0 | -100,00 | 0 | -100,00 | ||||
| 2026-04-16 | 13F | Heck Capital Advisors, LLC | 43.097 | 2.087 | ||||||
| 2026-04-22 | 13F | Apollon Wealth Management, LLC | 9.228 | 15,18 | 447 | 30,41 | ||||
| 2026-04-07 | 13F | Financially Speaking Inc | 53 | 0,00 | 3 | 0,00 | ||||
| 2026-02-10 | 13F | Deuterium Capital Management, LLC | 27.169 | 0,00 | 1.161 | -10,42 | ||||
| 2026-02-04 | 13F | Atlantic Union Bankshares Corp | 865 | 0,00 | 37 | -12,20 | ||||
| 2026-02-11 | 13F | Jpmorgan Chase & Co | 2.430.935 | 11,08 | 103.874 | -0,44 | ||||
| 2026-02-13 | 13F | Ausdal Financial Partners, Inc. | 10.829 | 21,33 | 463 | 8,71 | ||||
| 2026-01-26 | 13F | Mirae Asset Global Investments Co., Ltd. | 312.580 | 106,38 | 13.357 | 84,99 | ||||
| 2026-02-06 | 13F | Advisory Alpha, LLC | 15.758 | 7,02 | 673 | -8,93 | ||||
| 2025-11-14 | 13F | Mount Yale Investment Advisors, LLC | 0 | -100,00 | 0 | -100,00 | ||||
| 2026-02-02 | 13F | Your Advocates Ltd., LLP | 50 | 0,00 | 2 | 0,00 | ||||
| 2026-02-17 | 13F | Tudor Investment Corp Et Al | Put | 63.600 | -68,20 | 2.718 | -71,50 | |||
| 2026-01-30 | 13F | Us Bancorp \de\ | 3.100 | 47,62 | 132 | 32,00 | ||||
| 2026-02-17 | 13F | Tudor Investment Corp Et Al | Call | 2.105.000 | 16,94 | 89.947 | 4,82 | |||
| 2026-02-06 | 13F | Saranac Partners Ltd | 0 | -100,00 | 0 | |||||
| 2026-02-12 | 13F | Lbmc Investment Advisors, Llc | 5.676 | 243 | ||||||
| 2026-04-15 | 13F | DAVENPORT & Co LLC | 10.555 | -14,23 | 511 | -2,67 | ||||
| 2026-01-22 | 13F | Fiduciary Planning LLC | 14.841 | -3,32 | 634 | -13,27 | ||||
| 2026-02-13 | 13F | Barclays Plc | Call | 0 | -100,00 | 0 | -100,00 | |||
| 2026-02-03 | 13F | Navigoe, LLC | 30 | 0 | ||||||
| 2026-02-13 | 13F | Y-Intercept (Hong Kong) Ltd | 63.743 | 2.724 | ||||||
| 2026-04-13 | 13F | Cyndeo Wealth Partners, LLC | 289.364 | -29,96 | 14.014 | -20,62 | ||||
| 2026-01-23 | 13F | Assetmark, Inc | 794 | -37,18 | 34 | -45,00 | ||||
| 2026-02-17 | 13F | LMR Partners LLP | Put | 0 | -100,00 | 0 | ||||
| 2026-01-22 | 13F | Brookwood Investment Group LLC | 96.635 | 21,05 | 4.129 | 8,52 | ||||
| 2026-01-28 | 13F | CAPROCK Group, Inc. | 25.183 | 0,00 | 1.129 | 10,16 | ||||
| 2026-04-22 | 13F | Midwest Financial Group LLC | 10.270 | 53,28 | 497 | 73,78 | ||||
| 2026-01-13 | 13F | Stephens Consulting, LLC | 100 | 0,00 | 4 | 0,00 | ||||
| 2026-03-05 | 13F | Gunpowder Capital Management, LLC dba Oliver Wealth Management | 504 | 22 | ||||||
| 2026-02-13 | 13F | Squarepoint Ops LLC | 0 | -100,00 | 0 | -100,00 | ||||
| 2026-01-14 | 13F | Jfs Wealth Advisors, Llc | 0 | -100,00 | 0 | |||||
| 2026-02-12 | 13F | StoneX Group Inc. | 7.676 | -39,32 | 335 | -44,52 | ||||
| 2026-02-17 | 13F | Tudor Investment Corp Et Al | 5.302 | 227 | ||||||
| 2026-04-15 | 13F | Redhawk Wealth Advisors, Inc. | 5.077 | -36,05 | 246 | -27,73 | ||||
| 2026-02-13 | 13F | Verition Fund Management LLC | 13.072 | 0,00 | 559 | -10,43 | ||||
| 2026-02-13 | 13F | Aptus Capital Advisors, LLC | 5.027 | 79,09 | 215 | 60,90 | ||||
| 2026-01-15 | 13F | J. Safra Sarasin Holding AG | 66.587 | -8,32 | 2.845 | -17,82 | ||||
| 2026-02-10 | 13F | David R. Rahn & Associates Inc. | 185.119 | -0,55 | 7.910 | -10,85 | ||||
| 2026-02-05 | 13F | Cambridge Investment Research Advisors, Inc. | 165.074 | 14,48 | 7 | 16,67 | ||||
| 2026-04-14 | 13F | Wealthcare Advisory Partners LLC | 11.046 | 10,35 | 535 | 25,06 | ||||
| 2026-01-27 | 13F | Belpointe Asset Management LLC | 22.959 | -12,53 | 981 | -21,58 | ||||
| 2026-01-29 | 13F | Verdence Capital Advisors LLC | 0 | -100,00 | 0 | |||||
| 2026-02-26 | 13F | Anchor Investment Management, LLC | 50 | 0,00 | 2 | 0,00 | ||||
| 2026-02-04 | 13F | Ameritas Advisory Services, LLC | 0 | -100,00 | 0 | |||||
| 2026-02-13 | 13F | Wells Fargo & Company/mn | 1.978.480 | 8,13 | 84.540 | -3,08 | ||||
| 2026-02-17 | 13F | Royal Bank Of Canada | 926.549 | -56,30 | 39.591 | -60,83 | ||||
| 2026-02-13 | 13F | Evelyn Partners Investment Management Services Ltd | 33.169 | 19,20 | 1.417 | 6,86 | ||||
| 2026-02-12 | 13F | Rik Saylor Financial, Inc. | 26.927 | 1.151 | ||||||
| 2026-02-12 | 13F | Jane Street Group, Llc | Call | 455.100 | -24,21 | 19.446 | -32,07 | |||
| 2026-01-14 | 13F | LVW Advisors, LLC | 0 | -100,00 | 0 | |||||
| 2026-02-03 | 13F | International Assets Investment Management, Llc | 67 | 3 | ||||||
| 2026-02-12 | 13F | Jane Street Group, Llc | Put | 576.800 | -31,98 | 24.647 | -39,03 | |||
| 2026-01-26 | 13F | San Luis Wealth Advisors LLC | 14.017 | 599 | ||||||
| 2026-02-09 | 13F | Wellington Shields Capital Management, LLC | 12.700 | 0,00 | 543 | -10,41 | ||||
| 2026-04-21 | 13F | Wedbush Securities Inc | 4.825 | 0 | ||||||
| 2026-01-29 | 13F | Concurrent Investment Advisors, LLC | 7.498 | 13,71 | 320 | 1,91 | ||||
| 2026-04-23 | 13F | SJS Investment Consulting Inc. | 335 | 10,93 | 16 | 33,33 | ||||
| 2026-01-29 | 13F | DecisionPoint Financial, LLC | 100 | 0,00 | 4 | 0,00 | ||||
| 2026-02-10 | 13F | Envestnet Asset Management Inc | 155.260 | -19,98 | 6.634 | -28,27 | ||||
| 2026-02-13 | 13F | National Bank Of Canada /fi/ | 19.703 | -94,93 | 842 | -95,46 | ||||
| 2026-02-17 | 13F | Aqr Capital Management Llc | 11.105 | -67,37 | 475 | -70,78 | ||||
| 2026-02-17 | 13F | Northern Trust Corp | 5.000 | -43,12 | 214 | -49,16 | ||||
| 2026-02-10 | 13F | Bnp Paribas Arbitrage, Sa | 288.475 | -16,93 | 12.327 | -25,54 | ||||
| 2026-04-24 | 13F | Bayban | 1.500 | 0,00 | 73 | 12,50 | ||||
| 2026-02-12 | 13F | Jane Street Group, Llc | 1.948.206 | 115,20 | 83.247 | 92,90 | ||||
| 2026-02-04 | 13F | Nwam Llc | 6.360 | 11,89 | 349 | 15,18 | ||||
| 2025-11-14 | 13F | DRW Securities, LLC | 0 | -100,00 | 0 | -100,00 | ||||
| 2026-02-10 | 13F | Tandem Financial, LLC | 47.373 | 1.304 | ||||||
| 2026-02-13 | 13F | Integrated Wealth Concepts LLC | 12.363 | 80,19 | 528 | 61,47 | ||||
| 2026-04-22 | 13F | Spire Wealth Management | 550 | 120,00 | 27 | 160,00 | ||||
| 2026-01-23 | 13F | Ogorek Anthony Joseph /ny/ /adv | 699 | -15,68 | 0 | |||||
| 2026-04-09 | 13F | Acropolis Investment Management, LLC | 5.941 | 288 | ||||||
| 2026-02-03 | 13F | Strengthening Families & Communities, LLC | 2.149 | 377,56 | 92 | 333,33 | ||||
| 2026-01-21 | 13F | Sound Income Strategies, LLC | 1.301 | 1.634,67 | 71 | 2.233,33 | ||||
| 2026-04-21 | 13F | Pinnacle Associates Ltd | 14.228 | 0,00 | 689 | 13,51 | ||||
| 2025-11-13 | 13F | Crewe Advisors LLC | 0 | -100,00 | 0 | |||||
| 2026-04-15 | 13F | FNY Investment Advisers, LLC | 0 | -100,00 | 0 | |||||
| 2026-02-13 | 13F | Flow Traders U.s. Llc | 155.987 | 7 | ||||||
| 2026-02-13 | 13F | Change Path, LLC | 24.681 | -8,01 | 1.055 | -17,53 | ||||
| 2026-02-17 | 13F | Edmond De Rothschild Holding S.a. | 279 | 0,00 | 12 | -15,38 | ||||
| 2026-02-11 | 13F | Modus Advisors, LLC | 483 | 21 | ||||||
| 2025-11-14 | 13F | Skopos Labs, Inc. | 0 | -100,00 | 0 | |||||
| 2026-01-26 | 13F | Welch Group, LLC | 0 | -100,00 | 0 | |||||
| 2026-02-11 | 13F | Parallel Advisors, LLC | 599 | 3,81 | 26 | -7,41 | ||||
| 2026-02-04 | 13F | MADDEN SECURITIES Corp | 0 | -100,00 | 0 | |||||
| 2026-02-12 | 13F | Banco BTG Pactual S.A. | 144.066 | 161,01 | 6.156 | 133,94 | ||||
| 2026-02-17 | 13F | Garden State Investment Advisory Services LLC | 8.070 | -27,56 | 345 | -35,22 | ||||
| 2026-04-21 | 13F | Laurel Oak Wealth Management, Llc | 5.609 | 0,30 | 272 | 13,87 | ||||
| 2026-02-06 | 13F | Fortis Group Advisors, LLC | 7.419 | 408 | ||||||
| 2026-02-03 | 13F | Emerald Investment Partners, Llc | 912 | 173,87 | 39 | 153,33 | ||||
| 2025-11-14 | 13F | State Of Wisconsin Investment Board | 0 | -100,00 | 0 | |||||
| 2026-02-10 | 13F | Periscope Capital Inc. | Put | 50.000 | 2.136 | |||||
| 2026-02-17 | 13F | Clear Street Markets Llc | 498.200 | 21.288 | ||||||
| 2026-02-09 | 13F | Jefferies Financial Group Inc. | 17.751 | 46,62 | 758 | 31,37 | ||||
| 2026-01-30 | 13F | Wealthfront Advisers Llc | 85.292 | 24,25 | 3.645 | 11,37 | ||||
| 2026-02-17 | 13F | Citadel Advisors Llc | 5.516 | -98,23 | 236 | -98,42 | ||||
| 2026-02-18 | 13F | EP Wealth Advisors, Inc. | 0 | -100,00 | 0 | -100,00 | ||||
| 2026-02-17 | 13F | Citadel Advisors Llc | Call | 1.116.300 | -13,44 | 47.699 | -22,41 | |||
| 2026-02-13 | 13F | Fiduciary Trust Co | 19.607 | 0,00 | 838 | -10,39 | ||||
| 2026-04-21 | 13F | Red Tortoise LLC | 13.823 | 4,21 | 669 | 18,20 | ||||
| 2026-02-17 | 13F | Citadel Advisors Llc | Put | 938.500 | -17,33 | 40.102 | -25,90 | |||
| 2026-01-29 | 13F | D.a. Davidson & Co. | 56.280 | 150,07 | 2.405 | 124,25 | ||||
| 2026-02-05 | 13F | AlphaCore Capital LLC | 903 | 40 | ||||||
| 2026-04-16 | 13F | Toth Financial Advisory Corp | 35 | 0,00 | 2 | 0,00 | ||||
| 2026-02-17 | 13F | Creative Planning | 20.656 | -4,49 | 883 | -14,37 | ||||
| 2026-04-21 | 13F | Sugar Maple Asset Management, LLC | 10.300 | 106,00 | 499 | 133,80 | ||||
| 2026-02-05 | 13F | Phoenix Holdings Ltd. | 2.043.004 | 90.486 | ||||||
| 2026-01-20 | 13F | Ethos Financial Group, LLC | 87.468 | -3,04 | 3.847 | -10,53 | ||||
| 2026-02-17 | 13F | Cardiff Park Advisors, Llc | 10.763 | -6,88 | 460 | -16,55 | ||||
| 2026-02-13 | 13F | Polymer Capital Management (HK) LTD | 65.300 | 2.790 | ||||||
| 2026-02-12 | 13F | Bank of Jackson Hole Trust | 0 | -100,00 | 0 | |||||
| 2026-02-17 | 13F | Jones Financial Companies Lllp | 149.746 | 46,88 | 6.399 | 29,65 | ||||
| 2026-01-29 | 13F | St. Johns Investment Management Company, LLC | 70 | 0,00 | 3 | -33,33 | ||||
| 2026-04-22 | 13F | Peak Financial Advisors Llc | 35.603 | -0,04 | 1.724 | 13,35 | ||||
| 2026-02-13 | 13F | Cordoba Advisory Partners LLC | 36.969 | 1.651 | ||||||
| 2026-01-30 | 13F | Laurel Wealth Advisors LLC | 1.000 | 43 | ||||||
| 2026-02-04 | 13F | Bensler, LLC | 382.028 | -8,19 | 16.324 | -17,70 | ||||
| 2026-01-26 | 13F | Quadrant Private Wealth Management, LLC | 82.811 | 1.047,60 | 3.709 | 981,34 | ||||
| 2026-02-13 | 13F | Quattro Advisors LLC | 40 | 2 | ||||||
| 2026-01-20 | 13F | Stratos Wealth Partners, LTD. | 14.316 | 18,51 | 612 | 6,26 | ||||
| 2026-04-07 | 13F | Cooper Financial Group | 18.257 | 1,96 | 884 | 15,56 | ||||
| 2026-04-15 | 13F | Register Financial Advisors LLC | 29 | 1 | ||||||
| 2026-04-13 | 13F | Pettinga Financial Advisors, LLC | 15.959 | -3,16 | 773 | 9,66 | ||||
| 2026-02-17 | 13F | FIL Ltd | 0 | -100,00 | 0 | |||||
| 2026-03-03 | 13F | NWF Advisory Services Inc. | 21.508 | 919 | ||||||
| 2026-04-15 | 13F | AlphaStar Capital Management, LLC | 6.707 | 27,00 | 325 | 44,00 | ||||
| 2026-02-17 | 13F | Pine Valley Investments Ltd Liability Co | Call | 23 | ||||||
| 2026-02-10 | 13F | Hazlett, Burt & Watson, Inc. | 630 | 0 | ||||||
| 2026-04-15 | 13F | Activest Wealth Management | 529 | 26 | ||||||
| 2026-01-23 | 13F | Transcend Wealth Collective, Llc | 23.743 | -3,26 | 1.015 | -13,26 | ||||
| 2026-04-22 | 13F | Janney Montgomery Scott LLC | 64.661 | 56,42 | 3 | 200,00 | ||||
| 2026-01-07 | 13F | Central Pacific Bank - Trust Division | 0 | -100,00 | 0 | |||||
| 2026-02-12 | 13F | BlackRock, Inc. | 1.750 | 75 | ||||||
| 2026-02-17 | 13F | Snowden Capital Advisors LLC | 10.926 | 18,94 | 490 | 11,90 | ||||
| 2026-02-13 | 13F | Kestra Advisory Services, LLC | 0 | -100,00 | 0 | |||||
| 2026-01-08 | 13F | Brave Asset Management Inc | 0 | -100,00 | 0 | |||||
| 2026-04-22 | 13F | SFG Wealth Management, LLC. | 0 | -100,00 | 0 | |||||
| 2026-01-23 | 13F | Inlight Wealth Management, LLC | 1.200 | 0,00 | 51 | -10,53 | ||||
| 2026-04-15 | 13F | Sage Capital Management, LLC | 9.630 | 79,36 | 467 | 103,49 | ||||
| 2026-04-09 | 13F | Pacifica Partners Inc. | 346 | 0,00 | 17 | 6,67 | ||||
| 2026-02-03 | 13F | Kassira Wealth Management LLC | 5.073 | -78,38 | 217 | -80,68 | ||||
| 2026-04-10 | 13F | Armstrong Advisory Group, Inc | 5.207 | -21,18 | 252 | -10,64 | ||||
| 2026-02-12 | 13F | Groupe la Francaise | 0 | -100,00 | 0 | |||||
| 2026-04-13 | 13F | Lauer Wealth, LLC | 6.302 | -3,74 | 324 | -0,31 | ||||
| 2026-04-16 | 13F | Fortem Financial Group, Llc | 301.066 | -22,64 | 14.581 | -12,32 | ||||
| 2026-02-06 | 13F | Larson Financial Group LLC | 0 | -100,00 | 0 | |||||
| 2026-04-23 | 13F | Cornerstone Wealth Management, LLC | 13.875 | 672 | ||||||
| 2026-02-13 | 13F | Citigroup Inc | Put | 75.000 | 3.205 | |||||
| 2025-11-14 | 13F | Schonfeld Strategic Advisors LLC | 0 | -100,00 | 0 | |||||
| 2026-04-23 | 13F | Summer Road Llc | 419 | 36,93 | 20 | 53,85 | ||||
| 2026-02-13 | 13F | Citigroup Inc | 586.947 | 181,55 | 25.080 | 152,39 | ||||
| 2026-02-13 | 13F | Gen-Wealth Partners Inc | 9.025 | 2,99 | 386 | -7,67 | ||||
| 2026-02-13 | 13F | Citigroup Inc | Call | 250.000 | 10.682 | |||||
| 2026-04-14 | 13F | Juncture Wealth Strategies, Llc | 100.233 | -5,22 | 4.854 | 7,44 | ||||
| 2026-01-26 | 13F | Mountain Hill Investment Partners Corp. | 1 | 0,00 | 0 | |||||
| 2026-02-10 | 13F | Moors & Cabot, Inc. | 0 | -100,00 | 0 | |||||
| 2026-02-06 | 13F | Berbice Capital Management LLC | 0 | -100,00 | 0 | |||||
| 2026-04-07 | 13F | Heartwood Wealth Advisors LLC | 438.061 | -30,78 | 21.215 | -21,55 | ||||
| 2026-02-23 | 13F | Virtu Financial LLC | 109.533 | 313,18 | 5 | 300,00 | ||||
| 2026-02-02 | 13F | Summit Place Financial Advisors, LLC | 72.660 | -0,55 | 3.105 | -10,86 | ||||
| 2026-01-21 | 13F | Palumbo Wealth Management LLC | 26.537 | 8,22 | 1.134 | -3,00 | ||||
| 2026-02-11 | 13F | Comprehensive Financial Planning, Inc./PA | 0 | -100,00 | 0 | |||||
| 2026-02-13 | 13F | Global Endowment Management, LP | 8.000 | 1,01 | 342 | -9,28 | ||||
| 2026-01-29 | 13F | Sava Infond d.o.o. | 10.500 | 41,89 | 449 | 27,27 | ||||
| 2025-11-14 | 13F | ExodusPoint Capital Management, LP | 4.291 | 205 | ||||||
| 2026-04-15 | 13F | Regatta Capital Group, Llc | 10.620 | 4,33 | 514 | 18,43 | ||||
| 2026-04-06 | 13F | Rosenberg Matthew Hamilton | 550 | 0,00 | 27 | 13,04 | ||||
| 2026-04-23 | 13F | J.w. Cole Advisors, Inc. | 26.896 | 12,07 | 1.303 | 258,68 | ||||
| 2026-02-05 | 13F | Center for Financial Planning, Inc. | 200 | 0,00 | 9 | -11,11 | ||||
| 2026-01-28 | 13F | Geneos Wealth Management Inc. | 60.160 | -8,66 | 2.571 | -18,13 | ||||
| 2026-04-20 | 13F | Keudell/Morrison Wealth Management | 10.175 | -1,21 | 493 | 11,82 | ||||
| 2026-02-27 | 13F | Strategic Investment Solutions, Inc. /IL | 1.295 | 0,00 | 55 | -9,84 | ||||
| 2026-02-11 | 13F | Ameritas Investment Partners, Inc. | 7.445 | 318 | ||||||
| 2025-10-30 | 13F | WFA Asset Management Corp | 0 | -100,00 | 0 | |||||
| 2026-02-05 | 13F | Stephens Inc /ar/ | 32.333 | -0,55 | 1.382 | -10,85 | ||||
| 2026-02-23 | 13F | Walser Wealth Management Company, A Ltd Liability Co | 41.698 | 1.782 | ||||||
| 2025-11-14 | 13F | Wolverine Trading, Llc | Call | 196.800 | 360,89 | 9.586 | 489,91 | |||
| 2025-11-14 | 13F | Wolverine Trading, Llc | Put | 175.800 | 400,85 | 8.563 | 540,94 | |||
| 2026-04-14 | 13F | Nbc Securities, Inc. | 17.055 | 0,79 | 826 | 14,11 | ||||
| 2026-02-17 | 13F | Fwl Investment Management, Llc | 61.214 | 20,88 | 2.616 | 8,33 | ||||
| 2026-02-13 | 13F | Natixis | 976 | 3,17 | 42 | -8,89 | ||||
| 2026-02-17 | 13F | National Asset Management, Inc. | 0 | -100,00 | 0 | |||||
| 2026-02-17 | 13F | IHT Wealth Management, LLC | 35.140 | 2,48 | 1.502 | -8,14 | ||||
| 2026-02-12 | 13F | Bank Of Montreal /can/ | 185.148 | 29,64 | 7.911 | 16,22 | ||||
| 2026-02-12 | 13F | Triumph Capital Management | 4.152 | -4,09 | 177 | -14,08 | ||||
| 2026-02-19 | 13F | Atomi Financial Group, Inc. | 4.829 | 0,19 | 206 | -10,04 | ||||
| 2026-02-13 | 13F | Toroso Investments, LLC | 0 | -100,00 | 0 | |||||
| 2026-02-18 | 13F | Financial Advisory Service, Inc. | 1.122 | 0,00 | 48 | -11,32 | ||||
| 2026-02-03 | 13F | Stevens Capital Management Lp | 0 | -100,00 | 0 | |||||
| 2025-11-14 | 13F | Wolverine Trading, Llc | 85.832 | 279,08 | 4.181 | 385,48 | ||||
| 2026-01-23 | 13F | TFC Financial Management | 0 | -100,00 | 0 | |||||
| 2026-04-14 | 13F | Baldwin Brothers Inc/ma | 9.878 | -36,99 | 478 | -28,55 | ||||
| 2026-04-07 | 13F | U.S. Capital Wealth Advisors, LLC | 9.132 | 20,03 | 442 | 36,00 | ||||
| 2026-01-16 | 13F | Beaumont Financial Advisors, LLC | 5.690 | -1,73 | 243 | -11,96 | ||||
| 2026-01-30 | 13F | Smart Portfolios, LLC | 26.711 | -45,71 | 1.141 | -51,34 | ||||
| 2026-04-16 | 13F | SG Americas Securities, LLC | 138.804 | 578,98 | 7 | |||||
| 2026-04-21 | 13F | Trilogy Capital Inc. | 0 | -100,00 | 0 | |||||
| 2025-11-14 | 13F | First Manhattan Co | 0 | -100,00 | 0 | |||||
| 2026-02-06 | 13F | Envestnet Portfolio Solutions, Inc. | 0 | -100,00 | 0 | |||||
| 2026-02-10 | 13F | MGO Private Wealth, LLC | 13.447 | -68,52 | 575 | -71,81 | ||||
| 2026-02-11 | 13F | Sharpepoint Llc | 8.158 | 349 | ||||||
| 2026-02-17 | 13F | Bank Of America Corp /de/ | Put | 0 | -100,00 | 0 | ||||
| 2026-04-03 | 13F | Global Wealth Strategies & Associates | 36 | 0,00 | 2 | 0,00 | ||||
| 2026-02-13 | 13F | Mml Investors Services, Llc | 103.201 | 80,44 | 4.410 | 61,74 | ||||
| 2025-10-29 | 13F | Global View Capital Management LLC | 0 | -100,00 | 0 | -100,00 | ||||
| 2026-02-12 | 13F | Barometer Capital Management Inc. | 0 | -100,00 | 0 | |||||
| 2026-04-13 | 13F | Wolff Wiese Magana Llc | 282 | 0,00 | 14 | 8,33 | ||||
| 2026-02-17 | 13F | National Asset Management, Inc. | Call | 0 | -100,00 | 0 | ||||
| 2025-11-14 | 13F | Delos Wealth Advisors, LLC | 0 | -100,00 | 0 | |||||
| 2026-02-09 | 13F | Cary Street Partner Investment Advisory Llc | 120 | 0,00 | 5 | 0,00 | ||||
| 2026-04-07 | 13F | GK Wealth Management LLC | 0 | -100,00 | 0 | |||||
| 2026-01-21 | 13F | Capital Investment Advisory Services, LLC | 2.617 | 0,00 | 112 | -10,48 | ||||
| 2026-02-17 | 13F | Twin Focus Capital Partners, Llc | 15.300 | 0,00 | 654 | -10,43 | ||||
| 2026-02-13 | 13F | Rafferty Asset Management, LLC | 235.941 | 93,87 | 10.082 | 73,78 | ||||
| 2025-10-31 | 13F | Sovran Advisors, LLC | 0 | -100,00 | 0 | |||||
| 2026-04-21 | 13F | Lewis Asset Management, LLC | 28.786 | -1,18 | 1.394 | 12,06 | ||||
| 2026-02-09 | 13F | Catalyst Funds Management Pty Ltd | 16.100 | 0,00 | 688 | -10,43 | ||||
| 2026-02-17 | 13F | Wiley Bros.-aintree Capital, Llc | 79.712 | 20,25 | 3.415 | 8,07 | ||||
| 2026-02-13 | 13F | Ieq Capital, Llc | 9.612 | -4,34 | 411 | -14,23 | ||||
| 2026-04-21 | 13F | E&G Advisors, LP | 13.062 | -0,57 | 633 | 12,66 | ||||
| 2026-02-12 | 13F | Cibc World Markets Corp | 25.976 | -31,10 | 1.110 | -24,20 | ||||
| 2026-02-06 | 13F | Pnc Financial Services Group, Inc. | 8.866 | 8,06 | 379 | -3,32 | ||||
| 2026-02-17 | 13F | Equitable Holdings, Inc. | 43.174 | 32,93 | 1.845 | 19,12 | ||||
| 2026-02-09 | 13F | Rhl Group, Llc | 19 | 1 | ||||||
| 2026-02-13 | 13F | Financial Sense Advisors, Inc. | 9.838 | -1,72 | 420 | -11,95 | ||||
| 2026-02-17 | 13F | Cresset Asset Management, LLC | 25.005 | 212,84 | 1.121 | 193,96 | ||||
| 2026-02-09 | 13F | Mmbg Investment Advisors Co. | 0 | -100,00 | 0 | |||||
| 2026-01-22 | 13F | Elm3 Financial Group, LLC | 0 | -100,00 | 0 | |||||
| 2026-04-13 | 13F | Global X Japan Co., Ltd. | 281.839 | 13.649 | ||||||
| 2026-02-17 | 13F | Cambridge Associates Llc /ma/ /adv | 19.100 | 0,00 | 816 | -10,33 | ||||
| 2026-04-16 | 13F | Trinity Legacy Partners, LLC | 77.767 | 18,87 | 4.109 | 47,01 | ||||
| 2026-02-17 | 13F | BTG Pactual Asset Management US LLC | 0 | -100,00 | 0 | |||||
| 2026-02-09 | 13F | Choate Investment Advisors | 0 | -100,00 | 0 | |||||
| 2026-02-17 | 13F | Capital Fund Management S.a. | Put | 93.400 | -13,68 | 3.991 | -22,63 | |||
| 2026-04-21 | 13F | GHP Investment Advisors, Inc. | 28 | 0,00 | 1 | 0,00 | ||||
| 2026-02-17 | 13F | Capital Fund Management S.a. | Call | 104.300 | -8,43 | 4.457 | -17,92 | |||
| 2026-02-11 | 13F | VMS Asset Management Limited | 154.687 | 6.610 | ||||||
| 2026-02-13 | 13F | Avid Wealth Partners LLC | 281.701 | -10,12 | 12.037 | -19,44 | ||||
| 2026-02-17 | 13F | Sona Asset Management (us) Llc | 115.000 | -23,33 | 4.914 | -31,29 | ||||
| 2026-02-03 | 13F | Pilgrim Partners Asia Pte Ltd | 0 | -100,00 | 0 | |||||
| 2026-02-17 | 13F | Russell Investments Group, Ltd. | 20 | 0,00 | 1 | |||||
| 2026-01-29 | 13F | Comerica Bank | 26.402 | 21,81 | 1.128 | 9,20 | ||||
| 2026-04-23 | 13F | Oppenheimer & Co Inc | 17.045 | 36,90 | 825 | 55,08 | ||||
| 2026-02-04 | 13F | Meridian Wealth Management, LLC | 4.711 | -89,20 | 201 | -90,33 | ||||
| 2026-04-08 | 13F | Wealth Enhancement Advisory Services, Llc | 153.105 | -34,09 | 7.487 | -34,72 | ||||
| 2026-02-17 | 13F | Basso Capital Management, L.p. | 32.575 | 26,38 | 1.392 | 13,27 | ||||
| 2026-02-17 | 13F | Cape Investment Advisory, Inc. | 1.568 | 67 | ||||||
| 2026-03-12 | 13F/A | Peak6 Llc | Put | 189.800 | -41,38 | 8.110 | -47,46 | |||
| 2026-02-04 | 13F | LRI Investments, LLC | 200 | 0,00 | 9 | -11,11 | ||||
| 2026-03-12 | 13F/A | Peak6 Llc | Call | 4.400 | -98,36 | 188 | -98,53 | |||
| 2026-01-26 | 13F | CMC Financial Group | 13.371 | -0,07 | 571 | -10,36 | ||||
| 2026-01-30 | 13F | Citizens Financial Group Inc/ri | 13.462 | 575 | ||||||
| 2026-02-13 | 13F | Pine Valley Investments Ltd Liability Co | 64.005 | -2,42 | 2.750 | -12,06 | ||||
| 2026-03-12 | 13F/A | Peak6 Llc | 57.877 | 2.473 | ||||||
| 2026-02-06 | 13F | Evoke Wealth, Llc | 9.067 | -25,92 | 406 | -30,36 | ||||
| 2026-02-17 | 13F | Capitolis Liquid Global Markets LLC | 0 | -100,00 | 0 | |||||
| 2026-02-13 | 13F | Macquarie Group Ltd | 20.000 | 0,00 | 855 | -10,39 | ||||
| 2026-02-11 | 13F | Simplex Trading, Llc | 0 | -100,00 | 0 | |||||
| 2026-02-13 | 13F | Evelyn Partners Asset Management Ltd | 175.399 | 3,44 | 7.495 | -7,29 | ||||
| 2026-04-13 | 13F | Massmutual Trust Co Fsb/adv | 1.537 | 0,00 | 74 | 13,85 | ||||
| 2025-11-12 | 13F | SPX Equities Gestao de Recursos Ltda | 0 | -100,00 | 0 | |||||
| 2026-02-17 | 13F | Gladstone Institutional Advisory LLC | 5.278 | 22,35 | 226 | 9,76 | ||||
| 2026-02-17 | 13F | Captrust Financial Advisors | 4.506 | 193 | ||||||
| 2025-11-12 | 13F | HAP Trading, LLC | Call | 168.400 | 811 | |||||
| 2026-02-13 | 13F | Golden State Wealth Management, LLC | 4.994 | 0,48 | 213 | -9,75 | ||||
| 2026-04-14 | 13F | Focus Financial Network, Inc. | 22.327 | -5,66 | 1.081 | 1,98 | ||||
| 2026-02-10 | 13F | Elm Partners Management LLC | 4.687 | 0,00 | 200 | -10,31 | ||||
| 2026-04-07 | 13F | Estate Planners Group, LLC | 100 | 4 | ||||||
| 2026-04-23 | 13F | Ewa, Llc | 5.658 | 4,26 | 274 | 18,61 | ||||
| 2026-02-17 | 13F | Cetera Investment Advisers | Call | 0 | -100,00 | 0 | -100,00 | |||
| 2026-02-05 | 13F | Western Wealth Management, LLC | 10.624 | 61,04 | 454 | 44,27 | ||||
| 2026-02-10 | 13F | BW Gestao de Investimentos Ltda. | 268.100 | 11.456 | ||||||
| 2026-02-17 | 13F | Css Llc/il | 19.910 | 0,00 | 851 | -10,43 | ||||
| 2026-02-09 | 13F | Avalon Trust Co | 600 | 26 | ||||||
| 2026-02-17 | 13F | Quantitative Investment Management, LLC | 38.503 | 2 | ||||||
| 2026-04-08 | 13F | Holos Integrated Wealth LLC | 3.949 | 189 | ||||||
| 2026-04-15 | 13F | Eaton Financial Holdings Company, LLC | 67.815 | 2,44 | 3.284 | 16,12 | ||||
| 2025-11-07 | 13F | Essex Financial Services, Inc. | 0 | -100,00 | 0 | |||||
| 2026-01-27 | 13F | Zurcher Kantonalbank (Zurich Cantonalbank) | 5.738 | 0,00 | 245 | -12,19 | ||||
| 2026-04-10 | 13F | Lifestyle Asset Management, Inc. | 12.689 | 615 | ||||||
| 2025-11-12 | 13F | Headlands Technologies LLC | 0 | -100,00 | 0 | -100,00 | ||||
| 2026-02-17 | 13F | MGB Wealth Management, LLC | 16.672 | 3,09 | 712 | -7,53 | ||||
| 2026-02-12 | 13F | Stamos Capital Partners, L.p. | 24.329 | 17,28 | 1.040 | 5,16 | ||||
| 2026-04-21 | 13F | Systelligence, LLC | 30.164 | -28,97 | 1.461 | -19,51 | ||||
| 2026-04-21 | 13F | Columbus Macro, LLC | 24.209 | 5,44 | 1.172 | 19,47 | ||||
| 2025-11-13 | 13F | Glenmede Investment Management, LP | 244 | 0,00 | 12 | 22,22 | ||||
| 2026-02-12 | 13F | Steward Partners Investment Advisory, Llc | 25.566 | -22,44 | 1.092 | -30,49 | ||||
| 2026-02-17 | 13F | Matrix Private Capital Group Llc | 250 | 11 | ||||||
| 2026-04-15 | 13F | Aspen Investment Management Inc | 6.955 | -8,25 | 0 | |||||
| 2026-01-28 | 13F | HB Wealth Management, LLC | 8.031 | 17,95 | 343 | 5,86 | ||||
| 2025-11-05 | 13F | SOUTH STATE Corp | 0 | -100,00 | 0 | |||||
| 2026-02-09 | 13F | Keating Financial Advisory Services, Inc. | 8 | 0 | ||||||
| 2026-04-20 | 13F | Parkway Wealth Management Group, LLC | 335.423 | -28,33 | 17.083 | -14,58 | ||||
| 2026-02-12 | 13F | Insigneo Advisory Services, Llc | 13.590 | 10,23 | 581 | -1,19 | ||||
| 2026-02-10 | 13F | Belvedere Trading LLC | 14.828 | 2,80 | 634 | -7,86 | ||||
| 2026-02-13 | 13F | Walleye Trading LLC | 0 | -100,00 | 0 | -100,00 | ||||
| 2026-02-12 | 13F | SWAN Capital LLC | 70 | 3 | ||||||
| 2026-02-02 | 13F | Avidian Wealth Solutions, LLC | 15.976 | -2,74 | 683 | -12,90 | ||||
| 2026-02-10 | 13F | Belvedere Trading LLC | Put | 20.500 | 876 | |||||
| 2026-02-10 | 13F | Belvedere Trading LLC | Call | 700 | 30 | |||||
| 2026-04-13 | 13F | Gill Capital Partners, Llc | 943 | 46 | ||||||
| 2026-01-26 | 13F | Shelton Wealth Management, Llc | 11.941 | 11,68 | 510 | 0,20 | ||||
| 2026-02-17 | 13F | Strive Financial Group ,LLC | 2 | 0 | ||||||
| 2026-02-11 | 13F | Capital Analysts, Inc. | 253 | 0,00 | 0 | |||||
| 2026-01-13 | 13F | ForthRight Wealth Management, LLC | 13.525 | 12,96 | 578 | 1,23 | ||||
| 2026-02-19 | 13F | Invesco Ltd. | 0 | -100,00 | 0 | |||||
| 2026-02-17 | 13F | Advisor Group Holdings, Inc. | 174.069 | 24,58 | 7.446 | 22,05 | ||||
| 2026-02-17 | 13F | Advisory Services Network, LLC | 56.202 | 284,87 | 2.402 | 244,97 | ||||
| 2026-02-09 | 13F | Cypress Capital Management LLC (WY) | 133 | 6 | ||||||
| 2026-04-15 | 13F | Seacrest Wealth Management, Llc | 4.713 | 3,49 | 228 | 0,88 | ||||
| 2026-02-13 | 13F | Vontobel Holding Ltd. | 37.961 | 56,50 | 1.622 | 40,31 | ||||
| 2026-04-20 | 13F | Sowell Financial Services LLC | 8.751 | 15,11 | 424 | 30,56 | ||||
| 2026-04-14 | 13F | Madrona Financial Services, LLC | 128.909 | 6.243 | ||||||
| 2026-01-28 | 13F | Financial Perspectives, Inc | 6 | 0,00 | 0 | |||||
| 2025-10-29 | 13F | Mizuho Markets Americas Llc | 0 | -100,00 | 0 | |||||
| 2026-02-13 | 13F | Bridgewater Associates, LP | 414.846 | -9,54 | 17.726 | -18,91 | ||||
| 2026-02-17 | 13F | Bank Of America Corp /de/ | 5.485.399 | 7,43 | 234.391 | -3,70 | ||||
| 2026-02-17 | 13F | Alphadyne Asset Management, LLC | 0 | -100,00 | 0 | |||||
| 2026-02-13 | 13F | Absolute Gestao de Investimentos Ltda. | 0 | -100,00 | 0 | |||||
| 2026-04-14 | 13F | Thurston, Springer, Miller, Herd & Titak, Inc. | 535 | 1.428,57 | 26 | 2.400,00 | ||||
| 2026-01-12 | 13F | Evolution Wealth Advisors, LLC | 5.360 | 0,00 | 229 | -10,20 | ||||
| 2026-02-17 | 13F | Keebeck Wealth Management, LLC | 25.000 | 0,00 | 1.120 | -5,96 | ||||
| 2026-02-17 | 13F | Arosa Capital Management LP | Put | 220.000 | 9.401 | |||||
| 2026-04-17 | 13F | Berman McAleer LLC | 4.450 | 216 | ||||||
| 2026-02-17 | 13F | Cetera Investment Advisers | 434.636 | -13,65 | 18.572 | -22,59 | ||||
| 2026-02-10 | 13F | Lido Advisors, LLC | 6.905 | 0,00 | 329 | 0,00 | ||||
| 2026-02-02 | 13F | Mutual Advisors, LLC | 11.114 | 2,76 | 475 | -12,22 | ||||
| 2026-01-28 | 13F | Kapitalo Investimentos Ltda | 0 | -100,00 | 0 | -100,00 | ||||
| 2026-02-03 | 13F | Patten & Patten Inc/tn | 10.335 | 15,86 | 442 | 3,76 | ||||
| 2026-02-09 | 13F | Kingsview Wealth Management, LLC | 205.062 | 230,59 | 8.762 | 196,41 | ||||
| 2026-04-16 | 13F | Balboa Wealth Partners | 26.347 | -1,42 | 1.276 | 11,65 | ||||
| 2026-02-06 | 13F | EverSource Wealth Advisors, LLC | 712 | 612,00 | 30 | 650,00 | ||||
| 2025-11-12 | 13F | Principal Securities, Inc. | 0 | -100,00 | 0 | -100,00 | ||||
| 2026-02-13 | 13F | Umb Bank N A/mo | 12.000 | 0,00 | 513 | -10,49 | ||||
| 2026-02-18 | 13F | GWM Advisors LLC | 165.895 | 20,22 | 7.089 | 7,77 | ||||
| 2025-11-14 | 13F | Ripple Effect Asset Management LP | Put | 0 | -100,00 | 0 | ||||
| 2026-02-11 | 13F | MCF Advisors LLC | 11.388 | 509 | ||||||
| 2026-04-07 | 13F | CoreCap Advisors, LLC | 3.625 | 0,55 | 176 | 13,64 | ||||
| 2026-02-05 | 13F | Armor Investment Advisors, LLC | 200 | 0,00 | 9 | -11,11 | ||||
| 2026-02-13 | 13F | Magnolia Capital Advisors Llc | 7.830 | 0,00 | 335 | -10,46 | ||||
| 2026-04-08 | 13F | Parkside Investments, LLC | 156.312 | -0,66 | 7.570 | 12,60 | ||||
| 2026-01-22 | 13F | Evermay Wealth Management Llc | 70 | 3 | ||||||
| 2026-02-04 | 13F | Summit Wealth Group Llc / Co | 0 | -100,00 | 0 | -100,00 | ||||
| 2026-02-12 | 13F | Hikari Tsushin, Inc. | 0 | -100,00 | 0 | |||||
| 2026-02-12 | 13F | Financial Engines Advisors L.L.C. | 6.000 | 0,00 | 256 | -10,49 | ||||
| 2026-02-17 | 13F | Ursa Fund Management, LLC | 85.700 | 3.662 | ||||||
| 2026-02-06 | 13F | Windmill Hill Asset Management Ltd | 84.163 | -2,06 | 3.596 | -12,21 | ||||
| 2026-02-09 | 13F | Client First Investment Management LLC | 0 | -100,00 | 0 | |||||
| 2026-02-14 | 13F | Howe & Rusling Inc | 192 | 0,00 | 8 | -11,11 | ||||
| 2026-01-28 | 13F | Oversea-Chinese Banking CORP Ltd | 51.850 | -24,70 | 2.215 | -32,88 | ||||
| 2026-02-06 | 13F | Global Retirement Partners, LLC | 13.110 | 45,07 | 560 | 30,23 | ||||
| 2026-02-17 | 13F | Ursa Fund Management, LLC | Put | 75.000 | 3.205 | |||||
| 2026-02-09 | 13F | Bleakley Financial Group, LLC | 36.402 | 1.555 | ||||||
| 2026-02-17 | 13F | Gotham Asset Management, LLC | 7.071 | 302 | ||||||
| 2026-04-22 | 13F | Sykon Capital Llc | 0 | -100,00 | 0 | |||||
| 2026-01-16 | 13F | Matauro, Llc | 0 | -100,00 | 0 | |||||
| 2026-04-20 | 13F | Dagco, Inc. | 3.330 | 1,03 | 161 | 15,00 | ||||
| 2026-02-13 | 13F | Morgan Stanley | 3.550.762 | 38,43 | 151.724 | 24,09 | ||||
| 2026-02-13 | 13F | Wealth Alliance | 5.481 | 0,00 | 234 | -10,34 | ||||
| 2026-03-09 | 13F | Corecam Pte. Ltd. | 0 | -100,00 | 0 | |||||
| 2025-11-14 | 13F | Strategic Wealth Partners, Ltd. | 1.234 | -26,42 | 59 | -10,77 | ||||
| 2026-04-17 | 13F | Harbour Wealth Management Group, Inc. | 59.694 | -20,34 | 2.891 | -9,71 | ||||
| 2026-04-15 | 13F | Apex Wealth Management, LLC | 21.223 | 1.028 | ||||||
| 2026-02-17 | 13F | Modern Wealth Management, LLC | 96.025 | 198,90 | 4.103 | 167,99 | ||||
| 2026-02-06 | 13F | GPS Wealth Strategies Group, LLC | 0 | -100,00 | 0 | |||||
| 2026-02-02 | 13F | Cornerstone Planning Group LLC | 93 | 4,49 | 6 | 0,00 | ||||
| 2026-02-03 | 13F | Sequoia Financial Advisors, LLC | 15.347 | 5,55 | 656 | -5,48 | ||||
| 2026-02-06 | 13F/A | Rathbone Brothers plc | 4.774 | -25,21 | 204 | -33,22 | ||||
| 2026-01-29 | 13F | Sanctuary Advisors, LLC | 32.248 | -1,77 | 1.378 | -11,96 | ||||
| 2026-04-20 | 13F | One + One Wealth Management, Llc | 0 | -100,00 | 0 | |||||
| 2025-11-14 | 13F | J. Goldman & Co LP | 0 | -100,00 | 0 | |||||
| 2026-04-06 | 13F | Versant Capital Management, Inc | 4.139 | 4,20 | 200 | 18,34 | ||||
| 2026-01-23 | 13F | Rsm Us Wealth Management Llc | 5.633 | 241 | ||||||
| 2026-02-06 | 13F | Copia Wealth Management | 3.234 | -1,28 | 138 | -11,54 | ||||
| 2026-02-17 | 13F | D. E. Shaw & Co., Inc. | 0 | -100,00 | 0 | |||||
| 2025-11-13 | 13F | Renaissance Technologies Llc | 0 | -100,00 | 0 | |||||
| 2026-02-17 | 13F | Main Street Financial Solutions, LLC | 0 | -100,00 | 0 | -100,00 | ||||
| 2026-02-03 | 13F | We Are One Seven, LLC | 0 | -100,00 | 0 | |||||
| 2026-02-27 | 13F | Compass Financial Services Inc | 31 | 0,00 | 1 | 0,00 | ||||
| 2026-02-18 | 13F | Zazove Associates Llc | Call | 0 | -100,00 | 0 | ||||
| 2026-02-11 | 13F | O'shaughnessy Asset Management, Llc | 96 | 0,00 | 4 | 0,00 | ||||
| 2026-04-02 | 13F | Aspect Partners, LLC | 0 | -100,00 | 0 | |||||
| 2026-02-17 | 13F | Hilltop Holdings Inc. | 7.800 | -18,09 | 333 | -26,49 | ||||
| 2026-02-13 | 13F | Visionary Wealth Advisors | 34.032 | -0,02 | 1.454 | -10,36 | ||||
| 2026-01-30 | 13F | Carrera Capital Advisors | 16.002 | -13,72 | 684 | -22,74 | ||||
| 2026-04-17 | 13F | Krilogy Financial LLC | 5.775 | 0,00 | 319 | 0,63 | ||||
| 2026-04-22 | 13F | Coston, McIsaac & Partners | 47 | 0,00 | 0 | |||||
| 2026-02-09 | 13F | Cary Street Partners Financial Llc | 20.598 | 11,17 | 880 | -0,34 | ||||
| 2026-02-11 | 13F | Group One Trading, L.p. | 536.284 | -38,41 | 22.915 | -44,80 | ||||
| 2026-02-03 | 13F | NewEdge Wealth, LLC | 6.514 | -8,19 | 278 | -21,69 | ||||
| 2026-01-29 | 13F | Riggs Asset Managment Co. Inc. | 96.941 | 12,49 | 4.142 | 0,83 | ||||
| 2026-02-17 | 13F | Centennial Bank/AR/ | 71.180 | -0,14 | 3.042 | -10,48 | ||||
| 2026-04-13 | 13F | Trust Co | 200 | 33,33 | 10 | 50,00 | ||||
| 2026-03-19 | 13F | Painted Porch Advisors LLC | 0 | -100,00 | 0 | -100,00 | ||||
| 2026-02-13 | 13F | Johnson Investment Counsel Inc | 0 | -100,00 | 0 | |||||
| 2026-02-11 | 13F | Goodman Advisory Group, LLC | 0 | -100,00 | 0 | |||||
| 2026-02-13 | 13F | Smartleaf Asset Management LLC | 3.146 | 135 | ||||||
| 2026-04-15 | 13F | Northbridge Financial Group, Llc | 5.315 | 0,36 | 277 | 22,57 | ||||
| 2026-02-02 | 13F | Advisors Preferred, LLC | 51 | 2 | ||||||
| 2026-02-11 | 13F | Alteri Wealth LLC | 21.061 | 0,86 | 900 | -9,65 | ||||
| 2026-01-27 | 13F | TD Waterhouse Canada Inc. | 402.499 | -2,14 | 17.195 | -13,41 | ||||
| 2026-01-16 | 13F | Trust Co Of Vermont | 2.000 | 0,00 | 85 | -10,53 | ||||
| 2026-01-20 | 13F | Fundamentun, Llc | 24.843 | -0,72 | 1.062 | -10,99 | ||||
| 2026-02-13 | 13F | Uniting Wealth Partners, LLC | 0 | -100,00 | 0 | |||||
| 2026-02-06 | 13F | HighTower Advisors, LLC | Put | 0 | -100,00 | 0 | -100,00 | |||
| 2026-02-09 | 13F | IPG Investment Advisors LLC | 4.797 | -26,20 | 215 | -30,74 | ||||
| 2026-01-28 | 13F | Kingswood Wealth Advisors, Llc | 5.857 | 250 | ||||||
| 2026-02-05 | 13F | Plante Moran Financial Advisors, LLC | 140 | 0,00 | 6 | -16,67 | ||||
| 2026-02-12 | 13F | Federation des caisses Desjardins du Quebec | 53.893 | -23,42 | 2.303 | -31,37 | ||||
| 2026-02-05 | 13F | Spectrum Strategic Capital Management, LLC | 24.969 | 1.067 | ||||||
| 2026-02-12 | 13F | Hrt Financial Lp | 31.695 | 1 | ||||||
| 2026-02-17 | 13F | VestGen Advisors, LLC | 0 | -100,00 | 0 | |||||
| 2026-02-13 | 13F | GM Advisory Group, Inc. | 6.468 | 8,47 | 276 | -2,82 | ||||
| 2025-11-12 | 13F | Oak Grove Capital LLC | 0 | -100,00 | 0 | |||||
| 2026-02-17 | 13F | Millennium Management Llc | 794.482 | 7.373,96 | 33.948 | 6.609,09 | ||||
| 2026-04-22 | 13F | Gemmer Asset Management LLC | 26.671 | -20,74 | 1.292 | -10,16 | ||||
| 2026-02-11 | 13F | Harvest Fund Management Co., Ltd | 14.792 | 1 | ||||||
| 2026-02-17 | 13F | Perennial Investment Advisors, LLC | 19.160 | 10,56 | 819 | -0,97 | ||||
| 2025-11-04 | 13F | Truxt Investmentos Ltda. | 0 | -100,00 | 0 | |||||
| 2026-02-13 | 13F | Pathstone Holdings, LLC | 8.960 | 1,01 | 383 | -9,48 | ||||
| 2025-11-06 | 13F | Financial Advocates Investment Management | 0 | -100,00 | 0 | |||||
| 2026-04-20 | 13F | Ronald Blue Trust, Inc. | 1.000 | 233,33 | 48 | 300,00 | ||||
| 2026-02-17 | 13F | MIRAE ASSET GLOBAL ETFS HOLDINGS Ltd. | 1.607.098 | 34,29 | 68.800 | 18,03 | ||||
| 2026-04-15 | 13F | Nations Financial Group Inc, /ia/ /adv | 198.521 | -2,05 | 9.614 | 11,02 | ||||
| 2026-02-17 | 13F | Bramshill Investments, LLC | 0 | -100,00 | 0 | |||||
| 2026-04-24 | 13F | Deltec Asset Management Llc | 185.100 | 0,00 | 8.964 | 13,34 | ||||
| 2026-02-17 | 13F | Symmetry Investments LP | 0 | -100,00 | 0 | |||||
| 2026-01-26 | 13F | Lansing Street Advisors | 0 | -100,00 | 0 | |||||
| 2026-02-04 | 13F | Fourth Dimension Wealth, LLC | 1.416 | 0,00 | 61 | -10,45 | ||||
| 2026-02-17 | 13F | Susquehanna International Group, Llp | 7.169.349 | 602,05 | 306.346 | 529,29 | ||||
| 2026-04-13 | 13F | Arcadia Investment Advisors Llc | 100 | 0,00 | 5 | 0,00 | ||||
| 2026-02-17 | 13F | Tower Research Capital LLC (TRC) | 97 | 288,00 | 4 | 300,00 | ||||
| 2026-04-23 | 13F | Powell Investment Advisors, LLC | 4.811 | 2,58 | 233 | 10,48 | ||||
| 2026-01-23 | 13F | Reuter James Wealth Management, Llc | 0 | -100,00 | 0 | |||||
| 2026-01-30 | 13F | Turning Point Benefit Group, Inc. | 100 | 4 | ||||||
| 2026-02-17 | 13F | Nomura Holdings Inc | Call | 265.100 | 0,00 | 11.328 | -10,37 | |||
| 2026-04-22 | 13F | Formidable Asset Management, LLC | 0 | -100,00 | 0 | |||||
| 2026-02-13 | 13F | Clal Insurance Enterprises Holdings Ltd | 1.264.000 | 0,00 | 57 | -6,67 | ||||
| 2026-02-17 | 13F | Susquehanna International Group, Llp | Put | 3.230.300 | 205,81 | 138.031 | 174,12 | |||
| 2026-02-17 | 13F | Susquehanna International Group, Llp | Call | 1.478.100 | -36,23 | 63.159 | -42,83 | |||
| 2026-03-31 | 13F | Sankala Group LLC | 267 | 0,00 | 13 | -14,29 | ||||
| 2026-02-12 | 13F | Summit Financial, LLC | 56.181 | 1,05 | 2.518 | -5,02 | ||||
| 2026-04-16 | 13F | ARS Investment Partners, LLC | 32.920 | 42,86 | 1.594 | 61,99 | ||||
| 2026-01-21 | 13F | Flagship Harbor Advisors, Llc | 2.342 | 100 | ||||||
| 2026-02-13 | 13F | Gts Securities Llc | 186.469 | 7.968 | ||||||
| 2026-02-17 | 13F | Warren Averett Asset Management, LLC | 12.484 | 7,33 | 533 | -3,79 | ||||
| 2026-02-13 | 13F | MAI Capital Management | 1.603 | -15,76 | 68 | -24,44 | ||||
| 2026-02-17 | 13F | Mpwm Advisory Solutions, Llc | 450 | 19 | ||||||
| 2026-04-17 | 13F | AdvisorNet Financial, Inc | 72 | 4,35 | 3 | 50,00 | ||||
| 2026-04-23 | 13F | URS Advisory LLC | 29.259 | 13,70 | 1.417 | 28,94 | ||||
| 2026-02-05 | 13F | Allworth Financial LP | 9.430 | -0,14 | 403 | -10,67 | ||||
| 2026-02-12 | 13F | CIBC Private Wealth Group, LLC | 3.644 | 12,99 | 156 | 1,31 | ||||
| 2026-02-17 | 13F | Balyasny Asset Management Llc | Call | 150.000 | 6.410 | |||||
| 2026-02-17 | 13F | Ameriprise Financial Inc | 513.807 | 17,99 | 21.953 | 9,79 | ||||
| 2026-02-17 | 13F | Balyasny Asset Management Llc | Put | 417.000 | 17.818 | |||||
| 2026-04-07 | 13F | Signaturefd, Llc | 291 | 0,34 | 14 | 16,67 | ||||
| 2026-02-17 | 13F | Capital Fund Management S.a. | 0 | -100,00 | 0 | |||||
| 2026-02-17 | 13F | Prosperity Consulting Group, LLC | 11.063 | 49,70 | 473 | 34,09 | ||||
| 2026-02-17 | 13F/A | Kovack Advisors, Inc. | 8.332 | 356 | ||||||
| 2026-02-17 | 13F | Private Advisor Group, LLC | 60.928 | 3,05 | 2.603 | -7,63 | ||||
| 2026-01-23 | 13F | HBW Advisory Services LLC | 9.872 | -17,14 | 422 | -25,75 | ||||
| 2026-02-13 | 13F | Southeast Asset Advisors Inc. | 40.000 | 1.709 | ||||||
| 2026-02-10 | 13F | Greenwich Wealth Management LLC | 4.889 | 0 | ||||||
| 2026-02-10 | 13F | Ssi Investment Management Llc | 0 | -100,00 | 0 | |||||
| 2026-02-10 | 13F | Main Management LLC | 1.000 | 0,00 | 0 | |||||
| 2025-11-14 | 13F | Two Sigma Securities, Llc | 0 | -100,00 | 0 | |||||
| 2026-02-13 | 13F | Financial Freedom, LLC | 1.439 | 0,00 | 61 | -10,29 | ||||
| 2026-02-12 | 13F | Hollencrest Capital Management | Call | 8.400 | 359 | |||||
| 2026-01-26 | 13F | AE Wealth Management LLC | 1.373 | -28,97 | 59 | -36,96 | ||||
| 2026-02-12 | 13F | Hollencrest Capital Management | 400 | 17 | ||||||
| 2026-02-13 | 13F | Inspire Advisors, LLC | 27.591 | -68,83 | 1.179 | -72,08 | ||||
| 2026-04-08 | 13F | Wealthspan Partners, Llc | 4.707 | 228 | ||||||
| 2026-04-16 | 13F | Tactive Advisors, LLC | 8.347 | 0,00 | 404 | 13,48 | ||||
| 2026-02-17 | 13F | Sig Brokerage, Lp | Put | 0 | -100,00 | 0 | ||||
| 2026-02-05 | 13F | Thrivent Financial For Lutherans | 49.868 | -38,53 | 2 | -33,33 | ||||
| 2026-02-13 | 13F | Stifel Financial Corp | 200.364 | 39,49 | 8.562 | 25,03 | ||||
| 2026-01-27 | 13F | Journey Advisory Group, LLC | 9.432 | 5,60 | 403 | -5,18 | ||||
| 2026-02-05 | 13F | Wakefield Asset Management LLLP | 14.109 | 604 | ||||||
| 2026-04-13 | 13F | Fiduciary Financial Group, Llc | 6.329 | 0,19 | 307 | 13,75 | ||||
| 2026-02-13 | 13F | OpenArc Corporate Advisory, LLC | 17.584 | 751 | ||||||
| 2026-02-18 | 13F | Caitlin John, LLC | 22.829 | 9,90 | 975 | -1,52 | ||||
| 2026-02-09 | 13F | Harbour Investments, Inc. | 3.977 | 28,37 | 170 | 14,97 | ||||
| 2026-02-11 | 13F | Cypress Capital Group | 58.205 | 1,65 | 2.487 | -8,87 | ||||
| 2026-04-07 | 13F | Park Avenue Securities Llc | 8.031 | 52,19 | 0 | |||||
| 2026-04-13 | 13F | IFP Advisors, Inc | 2.035 | -2,26 | 99 | 11,36 | ||||
| 2026-02-10 | 13F | Foundations Investment Advisors, LLC | 85.901 | 860,75 | 3.671 | 761,50 | ||||
| 2026-02-13 | 13F | Oxford Financial Group Ltd | 0 | -100,00 | 0 | -100,00 | ||||
| 2026-01-30 | 13F | American Capital Advisory, LLC | 135 | 6 | ||||||
| 2026-02-10 | 13F/A | Northwestern Mutual Wealth Management Co | 370.161 | -24,74 | 15.817 | -32,54 | ||||
| 2026-02-17 | 13F | Van Den Berg Management I, Inc | 6.113 | -1,61 | 261 | -11,82 | ||||
| 2026-02-20 | 13F | Sunbelt Securities, Inc. | 963 | 51,65 | 41 | 36,67 | ||||
| 2026-04-16 | 13F | First Community Trust Na | 0 | -100,00 | 0 | |||||
| 2025-10-27 | 13F | Kiker Wealth Management, LLC | 0 | -100,00 | 0 | -100,00 | ||||
| 2026-02-03 | 13F | SBI Securities Co., Ltd. | 7.577 | 7,51 | 324 | -3,58 | ||||
| 2026-02-06 | 13F | HighTower Advisors, LLC | 70.664 | 7,34 | 3.019 | -3,79 | ||||
| 2026-02-11 | 13F | Gordian Capital Singapore Pte Ltd | 27.000 | 1.154 | ||||||
| 2025-11-14 | 13F | Cetera Investment Advisers | Put | 0 | -100,00 | 0 | -100,00 | |||
| 2026-04-14 | 13F | Prospera Financial Services Inc | 28.246 | 22,42 | 1.368 | 38,88 | ||||
| 2026-02-12 | 13F | Mint Tower Capital Management B.V. | 5.000 | -33,33 | 0 | |||||
| 2026-02-10 | 13F | Gw Henssler & Associates Ltd | 252.683 | -6,19 | 10.797 | -15,91 | ||||
| 2026-04-24 | 13F | Key FInancial Inc | 226 | 0,00 | 11 | 11,11 | ||||
| 2026-02-12 | 13F | Marex Group plc | 68.544 | 171,84 | 2.929 | 143,80 | ||||
| 2026-02-13 | 13F | Centiva Capital, LP | 0 | -100,00 | 0 | |||||
| 2026-01-22 | 13F | Glass Jacobson Investment Advisors llc | 0 | -100,00 | 0 | |||||
| 2026-02-17 | 13F | Running Point Capital Advisors, LLC | 84 | 0,00 | 4 | -25,00 | ||||
| 2026-02-09 | 13F | Fidelis Capital Partners, LLC | 18.784 | -3,50 | 803 | -13,48 | ||||
| 2026-02-13 | 13F | Baird Financial Group, Inc. | 111.753 | 2,27 | 4.775 | -8,33 | ||||
| 2026-02-13 | 13F | Arkadios Wealth Advisors | 19.933 | -4,72 | 852 | -14,64 | ||||
| 2026-04-22 | 13F | Union Bancaire Privee, UBP SA | 45.880 | -70,34 | 2.139 | -59,16 | ||||
| 2026-02-13 | 13F | Navis Wealth Advisors, LLC | 12.500 | 0,00 | 534 | -10,25 | ||||
| 2026-01-21 | 13F/A | Euro Pacific Asset Management, LLC | 6.405 | 1,51 | 0 |