Grundlæggende statistik
| Institutionelle aktier (lange) | 249.631.979 - 88,50% (ex 13D/G) - change of -32,73MM shares -11,59% MRQ |
| Institutionel værdi (lang) | $ 14.051.053 USD ($1000) |
Institutionelt ejerskab og aktionærer
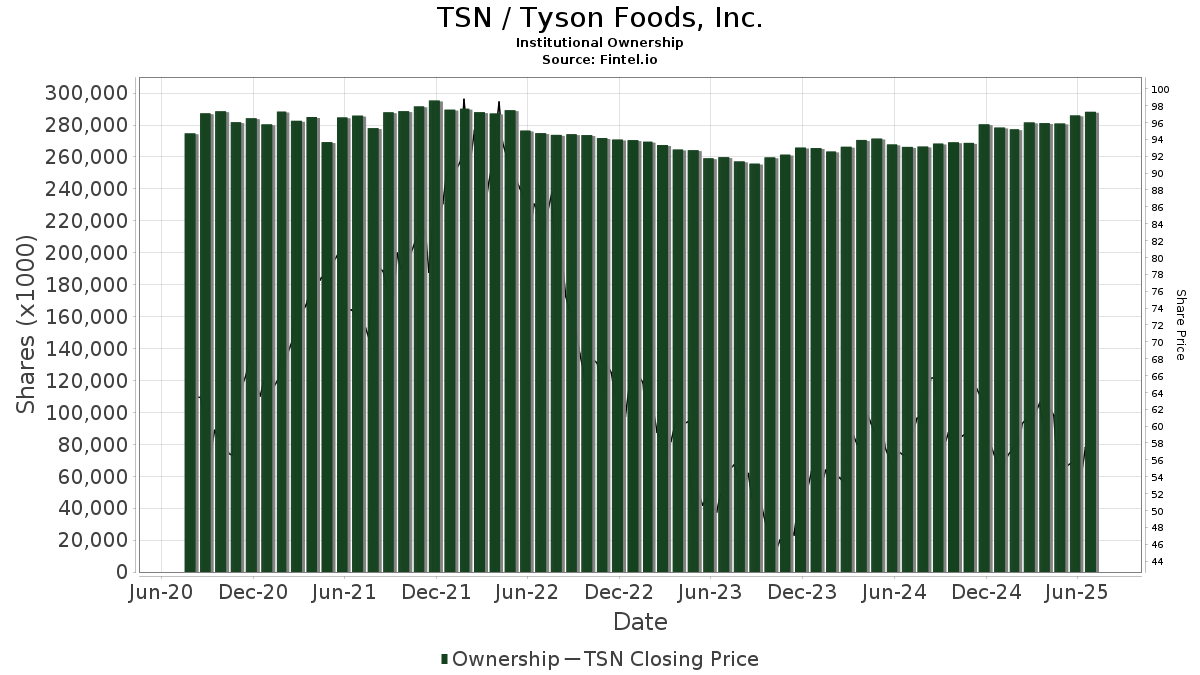
Tyson Foods, Inc. (US:TSN) har 863 institutionelle ejere og aktionærer, der har indsendt 13D/G- eller 13F-formularer til Securities Exchange Commission (SEC). Disse institutioner har i alt 249,631,979 aktier. Største aktionærer omfatter Vanguard Group Inc, BlackRock, Inc., Pzena Investment Management Llc, State Street Corp, Davis Selected Advisers, Aqr Capital Management Llc, Geode Capital Management, Llc, Wellington Management Group Llp, Invesco Ltd., and Price T Rowe Associates Inc /md/ .
Tyson Foods, Inc. (NYSE:TSN) institutionel ejerskabsstruktur viser aktuelle positioner i virksomheden efter institutioner og fonde, samt seneste ændringer i positionsstørrelse. Større aktionærer kan omfatte individuelle investorer, investeringsforeninger, hedgefonde eller institutioner. Skema 13D angiver, at investoren besidder (eller besidder) mere end 5 % af virksomheden og har til hensigt (eller har til hensigt at) aktivt at forfølge en ændring i forretningsstrategi. Skema 13G indikerer en passiv investering på over 5%.
The share price as of April 2, 2026 is 64,63 / share. Previously, on April 3, 2025, the share price was 63,56 / share. This represents an increase of 1,68% over that period.
Fondens stemningsscore
Fund Sentiment Score (fka Ownership Accumulation Score) finder de aktier, der bliver mest købt af fonde. Det er resultatet af en sofistikeret, multi-faktor kvantitativ model, der identificerer virksomheder med de højeste niveauer af institutionel akkumulering. Scoringsmodellen bruger en kombination af den samlede stigning i oplyste ejere, ændringerne i porteføljeallokeringer i disse ejere og andre målinger. Tallet går fra 0 til 100, hvor højere tal indikerer et højere niveau af akkumulering for sine jævnaldrende, og 50 er gennemsnittet.
Opdateringsfrekvens: Dagligt
Se Ownership Explorer, som giver en liste over højest rangerende virksomheder.
AI+ Ask Fintel’s AI assistant about Tyson Foods, Inc..
Select a question to share a public post with an AI-crafted answer.
Thinking of good questions…
Institutionel Put/Call-forhold
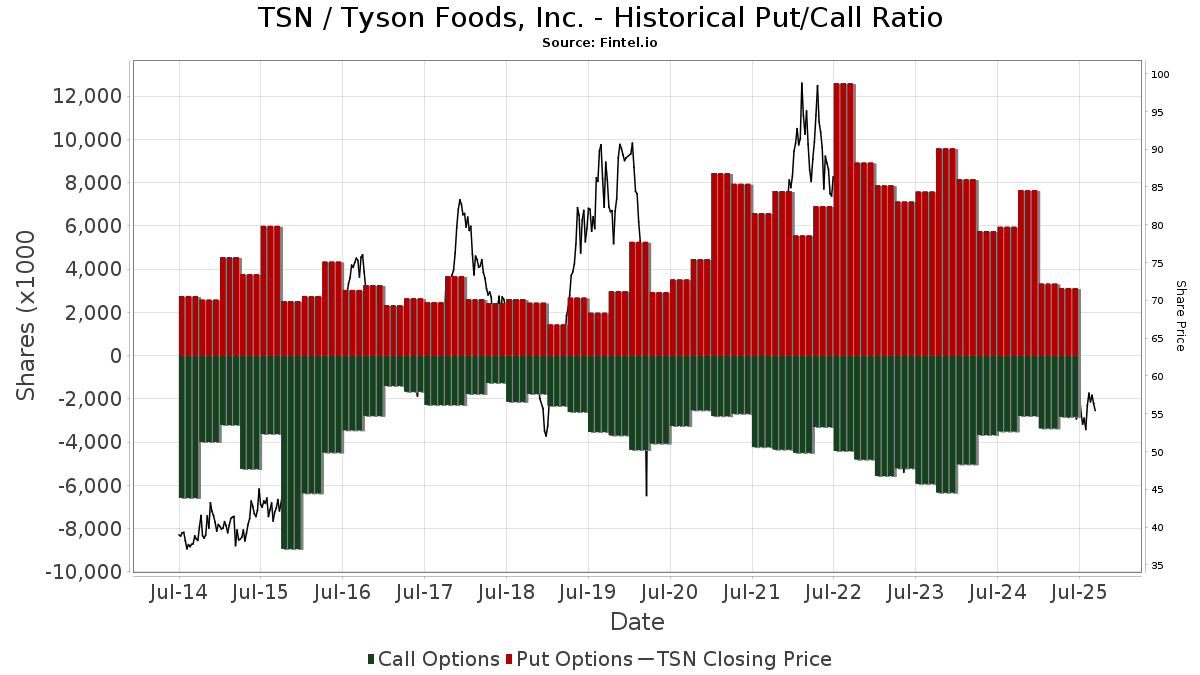
Ud over at indberette standardaktie- og gældsudstedelser skal institutter med mere end 100 mill. aktiver under forvaltning også oplyse deres put- og call-optionsbeholdninger. Da salgsoptioner generelt indikerer negativ stemning, og købsoptioner indikerer positiv stemning, kan vi få en fornemmelse af den overordnede institutionelle stemning ved at plotte forholdet mellem put og kald. Diagrammet til højre viser det historiske put/call-forhold for dette instrument.
Brug af Put/Call Ratio som en indikator for investorernes stemning overvinder en af de vigtigste mangler ved at bruge totalt institutionelt ejerskab, som er, at en betydelig mængde af aktiver under forvaltning investeres passivt for at spore indekser. Passivt forvaltede fonde køber typisk ikke optioner, så indikatoren for put/call-forholdet følger mere nøje følelsen af aktivt forvaltede fonde.
13D/G-arkivering
Vi præsenterer 13D/G ansøgninger separat fra 13F ansøgninger på grund af den forskellige behandling af SEC. 13D/G-ansøgninger kan indgives af grupper af investorer (med én ledende), hvorimod 13F-ansøgninger ikke kan. Dette resulterer i situationer, hvor en investor kan indsende en 13D/G, der rapporterer én værdi for de samlede aktier (der repræsenterer alle de aktier, der ejes af investorgruppen), men derefter indsender en 13F, der rapporterer en anden værdi for de samlede aktier (der udelukkende repræsenterer deres egne) ejendomsret). Det betyder, at aktieejerskab af 13D/G-arkiver og 13F-arkiveringer ofte ikke er direkte sammenlignelige, så vi præsenterer dem separat.
Bemærk: Fra den 16. maj 2021 viser vi ikke længere ejere, der ikke har indsendt en 13D/G inden for det seneste år. Tidligere viste vi den fulde historie af 13D/G-arkiver. Generelt skal enheder, der er forpligtet til at indgive 13D/G-ansøgninger, indgive mindst årligt, før de indsender en afsluttende ansøgning. Dog forlader fonde nogle gange positioner uden at indsende en afsluttende ansøgning (dvs. de afvikler), så visning af den fulde historie resulterede nogle gange i forvirring om det nuværende ejerskab. For at undgå forvirring viser vi nu kun 'aktuelle' ejere - det vil sige - ejere, der har anmeldt inden for det seneste år.
Upgrade to unlock premium data.
| Fil dato | Form | Investor | Forrige Aktier |
Seneste Aktier |
Δ Aktier (Procent) |
Ejendomsret (Procent) |
Δ Ejerskab (Procent) |
|
|---|---|---|---|---|---|---|---|---|
| 2026-02-13 | TYSON LIMITED PARTNERSHIP | 70,000,000 | 72,743,680 | 3.92 | 99.99 | 0.00 | ||
| 2026-01-29 | PZENA INVESTMENT MANAGEMENT LLC | 15,458,901 | 5.50 | |||||
| 2025-04-17 | BlackRock, Inc. | 28,859,577 | 25,033,123 | -13.26 | 8.70 | -13.86 |
13F og NPORT arkivering
Detaljer om 13F-arkivering er gratis. Detaljer om NP-ansøgninger kræver et premium-medlemskab. Grønne rækker angiver nye positioner. Røde rækker angiver lukkede positioner. Klik på linket ikon for at se den fulde transaktionshistorik.
Opgrader
for at låse premium-data op og eksportere til Excel ![]() .
.
Important Note
In an effort to reduce load times for our mobile users, we are testing some ways to deliver lighter pages.
In this first test, we will deliver only the most recent 750 transactions (out of 1090 for this stock). If you are interested in loading *all* the transactions for this company, click the "load all" button below. This is just a test and if you don't like it, please let us know by submitting some gentle feedback via the link at the bottom of this page.
Load All| Fil dato | Kilde | Investor | Type | Gennemsnitlig pris (Øst) |
Aktier | Δ Aktier (%) |
Rapporteret Værdi ($1000) |
Δ Værdi (%) |
Port Alloc (%) |
|
|---|---|---|---|---|---|---|---|---|---|---|
| 2025-11-14 | 13F | Capitolis Liquid Global Markets LLC | 0 | -100,00 | 0 | |||||
| 2026-02-17 | 13F | United Capital Financial Advisers, Llc | 4.257 | 250 | ||||||
| 2026-01-27 | 13F | Jeppson Wealth Management, Llc | 12.953 | 10,30 | 759 | 19,15 | ||||
| 2026-01-29 | 13F | Sanctuary Advisors, LLC | 44.670 | 13,62 | 2.619 | 22,68 | ||||
| 2026-02-10 | 13F | Winthrop Capital Management, LLC | 6.412 | 0,63 | 0 | |||||
| 2026-02-10 | 13F | Intech Investment Management Llc | 138.352 | 60,73 | 8.110 | 73,51 | ||||
| 2026-02-10 | 13F | Sivia Capital Partners, LLC | 17.096 | 131,18 | 1.002 | 149,88 | ||||
| 2026-02-09 | 13F | Arnhold LLC | 58.307 | 0,00 | 3.418 | 7,93 | ||||
| 2026-02-11 | 13F | Brandywine Global Investment Management, LLC | 757.626 | -0,77 | 44.412 | 7,13 | ||||
| 2026-01-30 | 13F | R Squared Ltd | 12.583 | 69,40 | 738 | 82,88 | ||||
| 2026-02-03 | 13F | Yacktman Asset Management Lp | 2.489.380 | -2,32 | 145.927 | 5,45 | ||||
| 2026-02-11 | 13F | Jpmorgan Chase & Co | 1.307.134 | -30,44 | 76.624 | -24,91 | ||||
| 2026-02-05 | 13F | HFM Investment Advisors, LLC | 12 | -7,69 | 1 | |||||
| 2025-11-14 | 13F | Capstone Investment Advisors, Llc | 12.795 | -70,50 | 695 | -71,39 | ||||
| 2026-01-27 | 13F | Fiduciary Advisors, Inc. | 928 | 0,00 | 54 | 8,00 | ||||
| 2025-11-14 | 13F | Capstone Investment Advisors, Llc | Put | 20.300 | 31,82 | 1.102 | 27,99 | |||
| 2026-01-26 | 13F | Merit Financial Group, LLC | 37.222 | 81,75 | 2.182 | 96,13 | ||||
| 2026-02-11 | 13F | Waddell & Associates, Llc | 8.814 | 517 | ||||||
| 2026-02-11 | 13F | Vise Technologies, Inc. | 5.340 | 5,30 | 313 | 13,82 | ||||
| 2026-01-26 | 13F | Key Capital Management, INC | 178 | 10 | ||||||
| 2026-01-09 | 13F | Zrc Wealth Management, Llc | 120 | 14,29 | 7 | 40,00 | ||||
| 2026-02-12 | 13F | Groupe la Francaise | 0 | -100,00 | 0 | -100,00 | ||||
| 2026-01-16 | 13F | First Community Trust Na | 700 | 0,00 | 41 | 7,89 | ||||
| 2025-11-05 | 13F | Plante Moran Financial Advisors, LLC | 0 | -100,00 | 0 | |||||
| 2026-01-14 | 13F | Hennion & Walsh Asset Management, Inc. | 12.521 | -1,64 | 734 | 6,08 | ||||
| 2026-01-23 | 13F | Assetmark, Inc | 429.939 | 3,17 | 25.203 | 11,38 | ||||
| 2026-02-11 | 13F | Prestige Wealth Management Group LLC | 250 | 10,13 | 15 | 16,67 | ||||
| 2026-03-24 | 13F | Armis Advisers, LLC | 4.101 | 239 | ||||||
| 2026-02-06 | 13F | Twin Capital Management Inc | 9.255 | 0,41 | 543 | 8,40 | ||||
| 2026-02-17 | 13F | Tudor Investment Corp Et Al | Put | 5.700 | -55,47 | 334 | -51,94 | |||
| 2026-01-22 | 13F | Newman Dignan & Sheerar, Inc. | 8.337 | 16,88 | 489 | 26,10 | ||||
| 2026-02-17 | 13F | Private Advisor Group, LLC | 5.327 | -0,21 | 312 | 7,96 | ||||
| 2026-02-17 | 13F | Tudor Investment Corp Et Al | Call | 16.600 | -56,43 | 973 | -52,95 | |||
| 2026-01-23 | 13F | Howard Capital Management Inc. | 82.704 | 1,90 | 4.848 | 10,01 | ||||
| 2026-02-11 | 13F | Simplex Trading, Llc | 0 | -100,00 | 0 | |||||
| 2026-01-28 | 13F | Old National Bancorp /in/ | 167.030 | -47,61 | 9.791 | -43,44 | ||||
| 2026-02-13 | 13F | Treasurer of the State of North Carolina | 117.225 | -6,81 | 7 | 0,00 | ||||
| 2026-02-17 | 13F | Summit Global Investments | 40.325 | -69,16 | 2 | -71,43 | ||||
| 2026-01-28 | 13F | HB Wealth Management, LLC | 17.245 | -14,31 | 1.011 | -7,51 | ||||
| 2025-11-07 | 13F | TCTC Holdings, LLC | 0 | -100,00 | 0 | |||||
| 2026-02-17 | 13F | DZ BANK AG Deutsche Zentral Genossenschafts Bank, Frankfurt am Main | 0 | -100,00 | 0 | |||||
| 2026-01-08 | 13F | Nordea Investment Management Ab | 41.403 | 1,57 | 2.442 | 11,92 | ||||
| 2026-01-27 | 13F | Optas, LLC | 7.415 | 435 | ||||||
| 2026-02-17 | 13F | Engineers Gate Manager LP | 205.404 | 13,81 | 12.041 | 22,87 | ||||
| 2026-02-05 | 13F | Elyxium Wealth, LLC | 331 | 19 | ||||||
| 2026-02-11 | 13F | Vestcor Inc | 48.369 | 0,00 | 3 | 0,00 | ||||
| 2026-02-12 | 13F | DRW Securities, LLC | 5.130 | -35,55 | 301 | -31,19 | ||||
| 2026-01-20 | 13F | Signaturefd, Llc | 2.020 | 19,81 | 118 | 29,67 | ||||
| 2026-02-02 | 13F | Forza Wealth Management, LLC | 4.151 | -12,63 | 243 | -5,45 | ||||
| 2026-02-11 | 13F | Manchester Capital Management LLC | 363 | 21 | ||||||
| 2026-01-05 | 13F | GAMMA Investing LLC | 6.000 | 0,79 | 352 | 8,67 | ||||
| 2026-02-02 | 13F | Principal Financial Group Inc | 356.629 | 0,47 | 20.906 | 8,46 | ||||
| 2026-02-13 | 13F | Van Eck Associates Corp | 793.116 | -34,81 | 46 | -30,30 | ||||
| 2026-02-13 | 13F | Korea Investment CORP | 131.131 | -18,47 | 7.687 | -11,99 | ||||
| 2026-01-30 | 13F | Torren Management, LLC | 21 | 1 | ||||||
| 2026-01-29 | 13F | Northern Oak Wealth Management Inc | 50.382 | -14,66 | 2.953 | -7,86 | ||||
| 2026-02-13 | 13F | Commerce Bank | 90.247 | -5,46 | 5.290 | 2,06 | ||||
| 2026-02-02 | 13F | Strs Ohio | 456.702 | -27,36 | 26.772 | -21,58 | ||||
| 2026-01-26 | 13F | AE Wealth Management LLC | 7.365 | 14,79 | 432 | 23,85 | ||||
| 2026-01-05 | 13F | Park Avenue Securities Llc | 13.259 | 3,68 | 1 | |||||
| 2026-02-13 | 13F | Mufg Securities Americas Inc. | 7.625 | -1,05 | 447 | 6,70 | ||||
| 2025-11-14 | 13F | Wood Tarver Financial Group, LLC | 0 | -100,00 | 0 | |||||
| 2025-11-14 | 13F | Qtron Investments LLC | 0 | -100,00 | 0 | |||||
| 2026-01-27 | 13F | Financial Management Professionals, Inc. | 77 | 18,46 | 5 | 33,33 | ||||
| 2026-02-17 | 13F | Amundi | 931.478 | -11,76 | 54.603 | -4,49 | ||||
| 2026-02-12 | 13F | Raiffeisen Bank International AG | 286 | 0,00 | 17 | 6,67 | ||||
| 2026-02-12 | 13F | Cibc World Markets Corp | Call | 13.000 | 762 | |||||
| 2026-02-10 | 13F | BKD Wealth Advisors, LLC | 31.474 | -4,65 | 1.845 | 2,96 | ||||
| 2026-02-13 | 13F | Umb Bank N A/mo | 7.130 | 91,31 | 418 | 106,44 | ||||
| 2026-01-23 | 13F | U.S. Capital Wealth Advisors, LLC | 3.492 | 205 | ||||||
| 2026-01-30 | 13F | Bogart Wealth, LLC | 213 | -31,29 | 12 | -25,00 | ||||
| 2026-02-04 | 13F | Legacy Financial Advisors, Inc. | 3.796 | 223 | ||||||
| 2026-01-16 | 13F | DiNuzzo Private Wealth, Inc. | 29 | 0,00 | 2 | 0,00 | ||||
| 2026-02-09 | 13F | Fisher Asset Management, LLC | 0 | -100,00 | 0 | |||||
| 2026-02-04 | 13F | MONECO Advisors, LLC | 3.460 | 203 | ||||||
| 2026-02-13 | 13F | MAI Capital Management | 7.687 | -4,85 | 451 | 2,74 | ||||
| 2026-02-13 | 13F | Walleye Trading LLC | Put | 43.300 | -52,68 | 2.538 | -48,91 | |||
| 2026-01-27 | 13F | Wealth Enhancement Trust Services, Inc. | 23 | 1 | ||||||
| 2026-01-07 | 13F | Harbor Investment Advisory, Llc | 42 | 0,00 | 2 | 0,00 | ||||
| 2026-02-03 | 13F | Mitsubishi UFJ Kokusai Asset Management Co., Ltd. | 609.977 | 2,50 | 35.403 | 9,56 | ||||
| 2026-02-20 | 13F | Sunbelt Securities, Inc. | 3.151 | -51,67 | 185 | -48,02 | ||||
| 2025-10-09 | 13F | Whalen Wealth Management Inc. | 0 | -100,00 | 0 | |||||
| 2026-02-13 | 13F | Walleye Trading LLC | Call | 85.800 | 256,02 | 5.030 | 284,48 | |||
| 2026-02-17 | 13F | Janus Henderson Group Plc | 23.460 | 2,45 | 1.375 | 10,62 | ||||
| 2026-02-13 | 13F | Walleye Capital LLC | Call | 21.700 | 167,90 | 1.272 | 189,75 | |||
| 2026-02-13 | 13F | Walleye Capital LLC | Put | 16.900 | 22,46 | 991 | 32,18 | |||
| 2026-01-28 | 13F | CAPROCK Group, Inc. | 54.819 | 81,98 | 3.214 | 86,26 | ||||
| 2025-11-07 | 13F | Beacon Capital Management, LLC | 0 | -100,00 | 0 | |||||
| 2026-02-13 | 13F | Walleye Capital LLC | 684 | -99,61 | 40 | -99,58 | ||||
| 2026-02-10 | 13F | Zhang Financial LLC | 3.812 | 3,03 | 223 | 11,50 | ||||
| 2026-02-17 | 13F | Susquehanna International Group, Llp | Put | 568.100 | -5,35 | 33.302 | 2,18 | |||
| 2026-02-17 | 13F | Susquehanna International Group, Llp | Call | 635.700 | 23,51 | 37.265 | 33,33 | |||
| 2026-02-17 | 13F | Susquehanna International Group, Llp | 288.548 | 17,11 | 16.915 | 26,43 | ||||
| 2026-02-17 | 13F | Two Sigma Advisers, Lp | 1.546.400 | 29,66 | 90.650 | 39,97 | ||||
| 2026-02-04 | 13F | Plato Investment Management Ltd | 0 | -100,00 | 0 | |||||
| 2026-02-13 | 13F | Cutler Capital Management, LLC | 27.107 | -0,53 | 1.589 | 7,37 | ||||
| 2026-02-17 | 13F | PharVision Advisers, LLC | 0 | -100,00 | 0 | |||||
| 2026-02-03 | 13F | Indivisible Partners | 4.652 | 273 | ||||||
| 2026-01-23 | 13F | Avion Wealth | 156 | 0,00 | 0 | |||||
| 2026-02-11 | 13F | Hughes Financial Services, LLC | 6 | 0 | ||||||
| 2026-02-02 | 13F | Oppenheimer Asset Management Inc. | 129.856 | 8,15 | 7.612 | 16,77 | ||||
| 2026-02-05 | 13F | Barr E S & Co | 6.246 | 366 | ||||||
| 2026-02-17 | 13F | Artisan Partners Limited Partnership | 792.480 | -15,65 | 46.455 | -8,93 | ||||
| 2026-01-14 | 13F | ORG Partners LLC | 681 | 2.519,23 | 40 | 3.800,00 | ||||
| 2026-02-05 | 13F | Bessemer Group Inc | 6.476 | 7,41 | 0 | |||||
| 2026-01-05 | 13F | Holos Integrated Wealth LLC | 153 | 0,00 | 9 | 14,29 | ||||
| 2026-02-09 | 13F | Glenview Trust Co | 6.085 | 0,00 | 357 | 7,88 | ||||
| 2026-02-12 | 13F | Hollencrest Capital Management | 10.001 | 0,01 | 586 | 7,92 | ||||
| 2026-02-10 | 13F/A | Northwestern Mutual Wealth Management Co | 68.171 | 9,93 | 3.996 | 18,68 | ||||
| 2026-02-17 | 13F | Cresset Asset Management, LLC | 0 | -100,00 | 0 | -100,00 | ||||
| 2026-02-17 | 13F | Grantham, Mayo, Van Otterloo & Co. LLC | 18.623 | -69,52 | 1.092 | -67,11 | ||||
| 2026-02-17 | 13F | Wealth Watch Advisors, INC | 320 | 0,00 | 19 | 5,88 | ||||
| 2026-01-30 | 13F | New York State Teachers Retirement System | 217.645 | -12,31 | 13 | -7,69 | ||||
| 2026-02-12 | 13F | Jane Street Group, Llc | Call | 177.600 | 64,90 | 10.411 | 78,01 | |||
| 2026-02-12 | 13F | Jane Street Group, Llc | Put | 359.100 | 3,19 | 21.050 | 11,40 | |||
| 2026-02-12 | 13F | Jane Street Group, Llc | 194.005 | -84,33 | 11.373 | -83,08 | ||||
| 2026-01-16 | 13F | Perigon Wealth Management, LLC | 12.966 | -12,24 | 760 | -5,24 | ||||
| 2026-02-17 | 13F | Sciencast Management LP | 104.548 | 31,10 | 6.129 | 41,52 | ||||
| 2025-11-13 | 13F | Riggs Asset Managment Co. Inc. | 0 | -100,00 | 0 | -100,00 | ||||
| 2026-02-06 | 13F | Evoke Wealth, Llc | 3.482 | 204 | ||||||
| 2026-02-13 | 13F | Macquarie Group Ltd | 47.208 | -82,95 | 2.767 | -81,60 | ||||
| 2025-11-10 | 13F | Towle & Co | 0 | -100,00 | 0 | |||||
| 2026-01-30 | 13F/A | M&t Bank Corp | 31.660 | 54,44 | 1.857 | 66,76 | ||||
| 2026-01-28 | 13F | Arizona State Retirement System | 78.310 | -7,50 | 4.591 | -0,13 | ||||
| 2026-02-12 | 13F | MetLife Investment Management, LLC | 67.796 | -4,24 | 3.974 | 3,38 | ||||
| 2026-02-13 | 13F | Rhumbline Advisers | 606.764 | -3,43 | 35.568 | 4,26 | ||||
| 2026-02-17 | 13F | T. Rowe Price Investment Management, Inc. | 44 | 0,00 | 0 | |||||
| 2026-02-09 | 13F | Huntington National Bank | 1.081 | -18,48 | 63 | -12,50 | ||||
| 2026-01-09 | 13F | SG Americas Securities, LLC | Put | 53.800 | 0,00 | 0 | ||||
| 2026-01-28 | 13F | Salomon & Ludwin, LLC | 22 | -85,43 | 1 | -87,50 | ||||
| 2025-11-13 | 13F | Kennedy Capital Management, Inc. | 0 | -100,00 | 0 | |||||
| 2026-01-08 | 13F | True Wealth Design, LLC | 1.815 | -10,50 | 106 | -3,64 | ||||
| 2026-02-12 | 13F | Empirical Finance, LLC | 9.999 | -4,05 | 586 | 3,72 | ||||
| 2026-02-02 | 13F | Truist Financial Corp | 32.760 | -28,96 | 1.920 | -23,32 | ||||
| 2026-02-13 | 13F | Quarry LP | 1.894 | 74,72 | 111 | 91,38 | ||||
| 2026-01-29 | 13F | Supplemental Annuity Collective Trust of NJ | 8.800 | 0,00 | 516 | 7,97 | ||||
| 2025-11-14 | 13F | Wealth Preservation Advisors, LLC | 0 | -100,00 | 0 | -100,00 | ||||
| 2026-02-10 | 13F | Fideuram Asset Management (Ireland) dac | 247 | 14 | ||||||
| 2026-02-17 | 13F | Dv Equities, Llc | 390 | 23 | ||||||
| 2026-02-09 | 13F | Onefund, Llc | 821 | 5,80 | 48 | 14,29 | ||||
| 2026-02-10 | 13F | Bruce G. Allen Investments, LLC | 11 | 0,00 | 1 | |||||
| 2026-02-10 | 13F | New Mexico Educational Retirement Board | 13.165 | 1,54 | 1 | |||||
| 2026-02-09 | 13F | Legal & General Group Plc | 1.602.734 | -2,63 | 93.952 | 5,11 | ||||
| 2026-02-03 | 13F | Maxi Investments CY Ltd | 41.000 | 2 | ||||||
| 2026-02-11 | 13F | Cookson Peirce & Co Inc | 18.498 | 15,53 | 1.084 | 24,74 | ||||
| 2026-02-12 | 13F | California Public Employees Retirement System | 731.998 | -16,79 | 42.910 | -10,18 | ||||
| 2026-01-21 | 13F | Yousif Capital Management, Llc | 46.781 | -5,00 | 2.849 | 6,55 | ||||
| 2026-02-17 | 13F | EFG International AG | 148 | 9 | ||||||
| 2026-02-09 | 13F | Investors Portfolio Services LLC | 19 | 1 | ||||||
| 2026-02-05 | 13F | Applied Finance Capital Management, LLC | 246.148 | -4,70 | 14.429 | 2,89 | ||||
| 2026-01-29 | 13F | UBS Group AG | Put | 254.500 | -0,97 | 14.919 | 6,90 | |||
| 2026-01-29 | 13F | UBS Group AG | Call | 153.200 | -4,37 | 8.981 | 3,24 | |||
| 2026-02-12 | 13F | Skandinaviska Enskilda Banken AB (publ) | 55.403 | -0,76 | 3.248 | 7,13 | ||||
| 2026-01-29 | 13F | UBS Group AG | 1.290.291 | -39,19 | 75.637 | -34,36 | ||||
| 2026-02-13 | 13F | American Century Companies Inc | 172.661 | 101,04 | 10.121 | 117,05 | ||||
| 2026-01-22 | 13F | Vicus Capital | 3.715 | -3,88 | 218 | 3,83 | ||||
| 2026-01-22 | 13F | City Holding Co | 495 | 29 | ||||||
| 2026-01-21 | 13F | New Wave Wealth Advisors Llc | 79.066 | -16,36 | 4.635 | -9,72 | ||||
| 2026-02-11 | 13F | Fjarde Ap-fonden /fourth Swedish National Pension Fund | 148.546 | 8.708 | ||||||
| 2026-01-07 | 13F | CWA Asset Management Group, LLC | 8.011 | 24,59 | 470 | 34,38 | ||||
| 2026-02-17 | 13F | Quantinno Capital Management LP | 1.218.553 | 9,37 | 71.432 | 18,08 | ||||
| 2026-02-13 | 13F | Entropy Technologies, LP | 88.607 | 66,25 | 5.194 | 79,54 | ||||
| 2026-02-17 | 13F | Vinva Investment Management Ltd | 153.691 | -60,36 | 9.095 | -56,83 | ||||
| 2025-10-15 | 13F | Stephens Consulting, LLC | 0 | -100,00 | 0 | |||||
| 2026-02-10 | 13F | Core Wealth Advisors, Llc | 53 | 3 | ||||||
| 2025-11-13 | 13F | Magnetar Financial LLC | 0 | -100,00 | 0 | |||||
| 2026-02-17 | 13F | NEOS Investment Management LLC | 44.522 | 20,01 | 2.610 | 29,54 | ||||
| 2025-11-13 | 13F | GeoWealth Management, LLC | 0 | -100,00 | 0 | |||||
| 2026-02-05 | 13F | Cornerstone Wealth Management, LLC | 39.198 | 7,68 | 2.298 | 16,24 | ||||
| 2026-02-02 | 13F | Core Alternative Capital | 0 | -100,00 | 0 | |||||
| 2026-01-21 | 13F | Clayton Financial Group LLC | 17 | 1 | ||||||
| 2026-02-04 | 13F | Oregon Public Employees Retirement Fund | 32.433 | -0,61 | 1.901 | 7,34 | ||||
| 2026-01-13 | 13F | Matrix Trust Co | 818 | 28,82 | 0 | |||||
| 2026-01-30 | 13F | Us Bancorp \de\ | 13.307 | 4,36 | 780 | 12,72 | ||||
| 2026-02-17 | 13F | Alliancebernstein L.p. | 291.704 | -3,36 | 17.100 | 4,33 | ||||
| 2026-02-09 | 13F | Hartland & Co., LLC | 6.370 | 326,94 | 373 | 360,49 | ||||
| 2026-02-13 | 13F | Sofos Investments, Inc. | 0 | -100,00 | 0 | -100,00 | ||||
| 2026-01-27 | 13F | Regions Financial Corp | 9.789 | -23,72 | 574 | -17,67 | ||||
| 2026-01-27 | 13F | Hedges Asset Management LLC | 20.750 | 0,00 | 1.216 | 7,99 | ||||
| 2026-02-12 | 13F | Barings Llc | 21.946 | -3,69 | 1.286 | 3,96 | ||||
| 2026-02-11 | 13F | Ing Groep Nv | 41.592 | -5,75 | 2.438 | 1,75 | ||||
| 2026-02-13 | 13F | Nfj Investment Group, Llc | 0 | -100,00 | 0 | |||||
| 2026-02-03 | 13F | F/M Investments LLC | 129.017 | -3,40 | 7.563 | 4,27 | ||||
| 2026-02-03 | 13F | We Are One Seven, LLC | 4.659 | 273 | ||||||
| 2026-02-05 | 13F | Everstar Asset Management, LLC | 19.486 | 62,40 | 1.144 | 75,58 | ||||
| 2026-02-13 | 13F | Sumitomo Life Insurance Co | 7.484 | 1,11 | 439 | 9,23 | ||||
| 2026-01-30 | 13F | North Star Investment Management Corp. | 537 | 7,40 | 31 | 14,81 | ||||
| 2026-02-06 | 13F | Tortoise Investment Management, LLC | 0 | -100,00 | 0 | |||||
| 2026-02-06 | 13F | Addison Advisors LLC | 6 | -50,00 | 0 | |||||
| 2026-02-03 | 13F | LaFleur & Godfrey LLC | 11.234 | 659 | ||||||
| 2026-02-17 | 13F | MIRAE ASSET GLOBAL ETFS HOLDINGS Ltd. | 112.020 | 9,10 | 6.567 | 17,78 | ||||
| 2025-11-12 | 13F | Allianz Se | 0 | -100,00 | 0 | |||||
| 2026-02-11 | 13F | Havemeyer Place LP | 1.365 | 80 | ||||||
| 2026-02-19 | 13F | Rare Wolf Capital LLC | 35.875 | 2.103 | ||||||
| 2026-02-18 | 13F | EP Wealth Advisors, Inc. | 20.552 | 20,83 | 1.205 | 26,60 | ||||
| 2026-01-13 | 13F | Triangle Securities Wealth Management | 5.500 | -4,35 | 322 | 3,21 | ||||
| 2026-02-09 | 13F | Integrity Alliance, Llc. | 15.159 | 889 | ||||||
| 2026-01-29 | 13F | Pictet Asset Management Holding SA | 134.454 | -6,19 | 7.881 | 1,32 | ||||
| 2026-01-23 | 13F | Tectonic Advisors Llc | 18.200 | 3,63 | 1.067 | 11,86 | ||||
| 2026-02-13 | 13F | Public Sector Pension Investment Board | 0 | -100,00 | 0 | |||||
| 2026-03-06 | 13F | Hsbc Holdings Plc | 589.708 | 4,29 | 34.613 | 12,85 | ||||
| 2026-02-10 | 13F | State of Wyoming | 0 | -100,00 | 0 | |||||
| 2026-01-20 | 13F | Perpetual Ltd | 22.986 | 1,09 | 1.347 | 9,16 | ||||
| 2026-02-02 | 13F | Qrg Capital Management, Inc. | 101.910 | 4,62 | 5.974 | 12,93 | ||||
| 2026-04-02 | 13F | Byrne Asset Management LLC | 0 | -100,00 | 0 | |||||
| 2026-01-15 | 13F | Royal Fund Management, LLC | 61.494 | 14,07 | 3.606 | 23,07 | ||||
| 2026-02-13 | 13F | Panagora Asset Management Inc | 979.941 | 69,25 | 57.444 | 82,72 | ||||
| 2026-02-17 | 13F | Lighthouse Investment Partners, LLC | 16.698 | 979 | ||||||
| 2026-01-26 | 13F | Provenance Wealth Advisors, LLC | 1.000 | 0,00 | 59 | 7,41 | ||||
| 2026-02-04 | 13F | Money Concepts Capital Corp | 22.872 | 8,83 | 1.341 | 17,44 | ||||
| 2026-02-17 | 13F | Modern Wealth Management, LLC | 8.353 | 1,83 | 490 | 9,89 | ||||
| 2026-02-14 | 13F | Rockefeller Capital Management L.P. | 182.418 | 1.890,81 | 10.693 | 2.051,51 | ||||
| 2026-02-09 | 13F | Cary Street Partner Investment Advisory Llc | 516 | 62,26 | 30 | 76,47 | ||||
| 2026-02-09 | 13F | Hantz Financial Services, Inc. | 976 | 30,83 | 0 | |||||
| 2025-11-12 | 13F | Andra AP-fonden | 0 | -100,00 | 0 | |||||
| 2026-02-19 | 13F | CI Private Wealth, LLC | 288.189 | 308,56 | 6.978 | 82,17 | ||||
| 2026-03-17 | 13F | Stance Capital Llc | 0 | -100,00 | 0 | |||||
| 2026-01-29 | 13F | Concurrent Investment Advisors, LLC | 3.999 | 234 | ||||||
| 2026-04-01 | 13F | Bangor Savings Bank | 13.342 | -3,21 | 855 | 5,69 | ||||
| 2026-02-12 | 13F | Keynote Financial Services Llc | 11.752 | 1,69 | 689 | 9,73 | ||||
| 2026-02-05 | 13F | Stephens Inc /ar/ | 43.770 | -10,00 | 2.566 | -2,84 | ||||
| 2025-11-14 | 13F | Elequin Capital Lp | 0 | -100,00 | 0 | |||||
| 2026-02-10 | 13F | Baker Avenue Asset Management, LP | 11.988 | -1,06 | 703 | 6,85 | ||||
| 2026-01-30 | 13F | Oakworth Capital, Inc. | 300 | 0,00 | 18 | 6,25 | ||||
| 2026-02-09 | 13F | CBIZ Investment Advisory Services, LLC | 0 | -100,00 | 0 | |||||
| 2026-02-13 | 13F | Aptus Capital Advisors, LLC | 21.512 | 1.261 | ||||||
| 2025-11-14 | 13F | Elequin Capital Lp | Put | 0 | -100,00 | 0 | ||||
| 2025-11-04 | 13F | Jackson Creek Investment Advisors LLC | 0 | -100,00 | 0 | |||||
| 2026-02-12 | 13F | EntryPoint Capital, LLC | 4.910 | -71,22 | 288 | -69,01 | ||||
| 2026-02-03 | 13F | Richard Bernstein Advisors LLC | 20.134 | -9,92 | 1.180 | -2,72 | ||||
| 2026-02-13 | 13F | Rafferty Asset Management, LLC | 23.706 | -2,66 | 1.390 | 5,07 | ||||
| 2026-02-13 | 13F | Williams Jones Wealth Management, LLC. | 22.879 | 0,35 | 1.341 | 8,32 | ||||
| 2026-01-22 | 13F | V-Square Quantitative Management LLC | 8.398 | 492 | ||||||
| 2026-02-12 | 13F | Brinker Capital Investments, LLC | 16.985 | 59,62 | 996 | 72,44 | ||||
| 2025-10-22 | 13F | McIlrath & Eck, LLC | 0 | -100,00 | 0 | |||||
| 2026-01-15 | 13F | Royal Fund Management, LLC | Call | 0 | -100,00 | 0 | ||||
| 2026-01-16 | 13F | Ronald Blue Trust, Inc. | 983 | -61,66 | 58 | -58,99 | ||||
| 2026-02-13 | 13F | Platinum Investment Management Ltd | 0 | -100,00 | 0 | |||||
| 2026-02-09 | 13F | MTM Investment Management, LLC | 650 | 0,00 | 38 | 8,57 | ||||
| 2026-01-26 | 13F | Private Trust Co Na | 1.063 | -42,88 | 62 | -38,61 | ||||
| 2026-02-17 | 13F | Public Employees Retirement System Of Ohio | 90.840 | -3,39 | 5.325 | 4,31 | ||||
| 2025-11-14 | 13F | Occudo Quantitative Strategies Lp | 0 | -100,00 | 0 | |||||
| 2026-02-17 | 13F | Balyasny Asset Management Llc | 1.524.925 | 1.524,75 | 89.391 | 1.654,14 | ||||
| 2025-11-12 | 13F | Globeflex Capital L P | 0 | -100,00 | 0 | |||||
| 2026-01-21 | 13F | Oak Thistle LLC | 39.078 | 2.291 | ||||||
| 2026-02-11 | 13F | Meeder Asset Management Inc | 77 | 5,48 | 5 | 33,33 | ||||
| 2026-01-30 | 13F | Camden Capital, LLC | 10.330 | 15,55 | 606 | 24,74 | ||||
| 2026-01-23 | 13F | Transcend Wealth Collective, Llc | 7.318 | 5,39 | 429 | 13,53 | ||||
| 2026-01-13 | 13F | Granite Group Advisors, LLC | 20.853 | 2,54 | 1.222 | 10,69 | ||||
| 2026-02-17 | 13F | Balyasny Asset Management Llc | Call | 17.700 | -9,23 | 1.038 | -1,98 | |||
| 2026-02-13 | 13F | Vontobel Holding Ltd. | 2.042 | -74,21 | 120 | -72,26 | ||||
| 2026-02-12 | 13F | Commonwealth Equity Services, Llc | 68.335 | -8,39 | 4.006 | 100.025,00 | ||||
| 2026-02-13 | 13F | First Trust Advisors Lp | 607.743 | 8,95 | 35.626 | 17,61 | ||||
| 2026-02-10 | 13F | Westpac Banking Corp | 27.657 | -0,26 | 1.621 | 7,71 | ||||
| 2026-02-12 | 13F | Campbell & CO Investment Adviser LLC | 6.388 | 374 | ||||||
| 2026-01-16 | 13F | Walker Asset Management, LLC | 16.354 | -9,67 | 959 | -2,54 | ||||
| 2026-02-13 | 13F | Vontobel Holding Ltd. | Call | 5.500 | 322 | |||||
| 2025-11-14 | 13F | Mbb Public Markets I Llc | 0 | -100,00 | 0 | -100,00 | ||||
| 2026-02-12 | 13F | Colonial Trust Co / SC | 6 | -89,29 | 0 | -100,00 | ||||
| 2026-02-17 | 13F | Norinchukin Bank, The | 12.614 | 1,05 | 739 | 9,16 | ||||
| 2026-02-09 | 13F | Jefferies Financial Group Inc. | 25.636 | -54,20 | 1.503 | -50,58 | ||||
| 2026-02-10 | 13F | REAP Financial Group, LLC | 76 | 4 | ||||||
| 2026-02-10 | 13F | Mutual Of America Capital Management Llc | 30.403 | -1,88 | 1.782 | 5,95 | ||||
| 2026-02-13 | 13F | Arrowstreet Capital, Limited Partnership | 1.761.781 | -10,20 | 103.276 | -3,05 | ||||
| 2026-02-02 | 13F | Montag A & Associates Inc | 614 | -60,23 | 36 | -57,83 | ||||
| 2025-11-10 | 13F | Jupiter Asset Management Ltd | 0 | -100,00 | 0 | |||||
| 2025-11-14 | 13F | Petrus Trust Company, LTA | 0 | -100,00 | 0 | -100,00 | ||||
| 2026-01-29 | 13F | Camelot Portfolios, LLC | 17.776 | 1,30 | 1.042 | 9,45 | ||||
| 2026-01-22 | 13F | tru Independence LLC | 79.771 | 1,79 | 4.676 | 9,89 | ||||
| 2026-02-18 | 13F | Vident Advisory, LLC | 12.932 | -24,15 | 758 | -18,05 | ||||
| 2026-01-30 | 13F | American Capital Advisory, LLC | 5 | 25,00 | 0 | |||||
| 2026-02-10 | 13F | Goldman Sachs Group Inc | Put | 36.700 | 0,00 | 2.151 | 7,98 | |||
| 2026-02-13 | 13F | Blueshift Asset Management, LLC | 13.232 | 776 | ||||||
| 2026-02-17 | 13F | CWM Advisors, LLC | 0 | -100,00 | 0 | |||||
| 2026-02-10 | 13F | Goldman Sachs Group Inc | 4.741.778 | 27,50 | 277.963 | 37,65 | ||||
| 2026-02-10 | 13F | Goldman Sachs Group Inc | Call | 36.700 | 0,00 | 2.151 | 7,98 | |||
| 2026-02-24 | 13F | SG Trading Solutions, LLC | 21.685 | 1 | ||||||
| 2026-01-15 | 13F | Nisa Investment Advisors, Llc | 65.761 | 4,54 | 3.855 | 12,86 | ||||
| 2026-01-26 | 13F | Whittier Trust Co | 467 | -3,91 | 26 | 0,00 | ||||
| 2026-02-10 | 13F | Daiwa Securities Group Inc. | 59.446 | 3,33 | 3 | 0,00 | ||||
| 2026-02-17 | 13F | RMB Capital Management, LLC | 14.714 | 863 | ||||||
| 2026-02-13 | 13F | Mml Investors Services, Llc | 38.469 | 5,67 | 2.255 | 14,12 | ||||
| 2026-01-21 | 13F | Greenleaf Trust | 3.878 | -20,97 | 227 | -14,66 | ||||
| 2026-02-09 | 13F | Putnam Fl Investment Management Co | 27.785 | -0,55 | 1.629 | 7,32 | ||||
| 2026-02-17 | 13F | Aqr Capital Management Llc | 8.114.441 | 20,63 | 475.669 | 30,73 | ||||
| 2026-02-12 | 13F | Federation des caisses Desjardins du Quebec | 52.229 | 1,04 | 3.062 | 9,09 | ||||
| 2025-11-06 | 13F | Baader Bank INC | 0 | -100,00 | 0 | |||||
| 2026-02-03 | 13F | Credit Industriel Et Commercial | 0 | -100,00 | 0 | -100,00 | ||||
| 2025-11-04 | 13F | Mutual Advisors, LLC | 0 | -100,00 | 0 | -100,00 | ||||
| 2026-02-13 | 13F | Natixis | 131.868 | 49,45 | 7.730 | 61,34 | ||||
| 2026-02-17 | 13F | Ancora Advisors, LLC | 332 | 19 | ||||||
| 2026-02-17 | 13F | Summit Trail Advisors, Llc | 32.156 | -42,77 | 1.885 | -38,23 | ||||
| 2026-02-17 | 13F | DoubleLine ETF Adviser LP | 16.613 | 6,34 | 974 | 14,74 | ||||
| 2026-02-12 | 13F | Mount Yale Investment Advisors, LLC | 4.695 | 9,52 | 275 | 18,53 | ||||
| 2026-01-12 | 13F | CVA Family Office, LLC | 175 | 9,38 | 10 | 25,00 | ||||
| 2026-02-04 | 13F | Swiss Life Asset Management Ltd | 33.507 | 4,17 | 1.964 | 12,49 | ||||
| 2026-01-21 | 13F | Capital Advisors, Ltd. LLC | 1.291 | 34,34 | 0 | |||||
| 2026-02-12 | 13F | Rossby Financial, LCC | 1.227 | 6,79 | 72 | 14,52 | ||||
| 2025-11-03 | 13F | Pittenger & Anderson Inc | 0 | -100,00 | 0 | -100,00 | ||||
| 2026-02-06 | 13F | HighTower Advisors, LLC | 19.487 | -1,64 | 1.142 | 6,23 | ||||
| 2026-01-30 | 13F | Keybank National Association/oh | 33.377 | 19,40 | 1.957 | 28,94 | ||||
| 2026-02-10 | 13F | Peapack Gladstone Financial Corp | 25.200 | -0,39 | 1 | 0,00 | ||||
| 2026-01-23 | 13F | Optima Capital Llc | 26 | 2 | ||||||
| 2026-02-13 | 13F | Wilkerson Advisory Group LLC | 1.483 | 87 | ||||||
| 2026-02-18 | 13F | Caitlin John, LLC | 0 | -100,00 | 0 | -100,00 | ||||
| 2026-02-13 | 13F | Brown Advisory Inc | 0 | -100,00 | 0 | -100,00 | ||||
| 2025-11-07 | 13F/A | Abn Amro Investment Solutions | 6.467 | 327 | ||||||
| 2026-02-11 | 13F | Picton Mahoney Asset Management | 18 | -99,88 | 1 | |||||
| 2026-01-26 | 13F | Cwm, Llc | 150.379 | 14,33 | 9 | 14,29 | ||||
| 2026-02-06 | 13F | Envestnet Portfolio Solutions, Inc. | 6.580 | 11,83 | 386 | 20,69 | ||||
| 2026-02-05 | 13F | Northwestern Mutual Investment Management Company, Llc | 9.044 | -0,70 | 530 | 7,29 | ||||
| 2026-02-12 | 13F | Steward Partners Investment Advisory, Llc | 1.422 | -61,52 | 83 | -58,50 | ||||
| 2026-02-17 | 13F | Wellington Management Group Llp | 6.071.265 | -4,01 | 355.898 | 3,62 | ||||
| 2026-01-23 | 13F | Private Wealth Management Group, LLC | 254 | 0,00 | 15 | 7,69 | ||||
| 2026-02-09 | 13F | Arista Wealth Management, LLC | 0 | -100,00 | 0 | |||||
| 2026-02-10 | 13F | Nomura Asset Management Co Ltd | 101.414 | -0,04 | 5.945 | 7,92 | ||||
| 2026-02-19 | 13F | Mcguire Capital Advisors Inc | 80 | 5 | ||||||
| 2026-02-11 | 13F | Illinois Municipal Retirement Fund | 157.315 | -28,22 | 9.222 | -22,51 | ||||
| 2026-02-12 | 13F | Marex Group plc | 3.709 | 217 | ||||||
| 2026-02-10 | 13F | Axq Capital, Lp | 16.543 | 15,18 | 970 | 24,39 | ||||
| 2026-01-14 | 13F | Northwest Wealth Management, Llc | 6.711 | 7,72 | 393 | 16,27 | ||||
| 2026-02-10 | 13F | New Republic Capital, LLC | 7.418 | 95,01 | 435 | 110,68 | ||||
| 2026-02-13 | 13F | Manufacturers Life Insurance Company, The | 337.202 | -4,83 | 19.866 | 3,26 | ||||
| 2026-01-20 | 13F | Sanibel Captiva Trust Company, Inc. | 6.767 | 41,72 | 397 | 52,90 | ||||
| 2026-01-26 | 13F | Greenwood Capital Associates Llc | 27.865 | -1,13 | 1.633 | 6,73 | ||||
| 2026-02-06 | 13F | IFP Advisors, Inc | 1.679 | 10,32 | 98 | 19,51 | ||||
| 2025-10-20 | 13F | Ascent Group, LLC | 0 | -100,00 | 0 | |||||
| 2026-02-11 | 13F | SOUTH STATE Corp | 10 | -47,37 | 1 | -100,00 | ||||
| 2026-02-11 | 13F | First Command Advisory Services, Inc. | 460 | -20,42 | 27 | -16,13 | ||||
| 2026-02-05 | 13F/A | Delta Accumulation, LLC | Call | 8.900 | 0,00 | 522 | -1,70 | |||
| 2026-02-09 | 13F | Keating Financial Advisory Services, Inc. | 104 | 6 | ||||||
| 2026-01-21 | 13F | Cidel Asset Management Inc | 7.956 | 3,77 | 466 | 12,02 | ||||
| 2026-01-30 | 13F | Trifecta Capital Advisors, LLC | 0 | -100,00 | 0 | |||||
| 2026-02-05 | 13F/A | Delta Accumulation, LLC | 122 | 0,83 | 7 | 0,00 | ||||
| 2025-11-07 | 13F | Sierra Ocean, Llc | 0 | -100,00 | 0 | |||||
| 2026-01-29 | 13F | Directional Asset Management | 29.040 | 1.702 | ||||||
| 2026-02-12 | 13F | Ci Investments Inc. | 0 | -100,00 | 0 | |||||
| 2026-02-12 | 13F | CIBC Private Wealth Group, LLC | 2.254 | 21,05 | 132 | 30,69 | ||||
| 2026-02-12 | 13F | Lansforsakringar Fondforvaltning AB (publ) | 90.209 | -25,39 | 5.288 | -19,45 | ||||
| 2025-10-09 | 13F | Contravisory Investment Management, Inc. | 0 | -100,00 | 0 | |||||
| 2026-02-13 | 13F | State Street Corp | 13.940.745 | -0,96 | 817.206 | 6,92 | ||||
| 2026-02-11 | 13F | Metis Global Partners, LLC | 9.089 | -5,54 | 533 | 1,92 | ||||
| 2026-02-13 | 13F | National Bank Of Canada /fi/ | 164.478 | -7,18 | 9.641 | 0,21 | ||||
| 2026-03-05 | 13F | Gunpowder Capital Management, LLC dba Oliver Wealth Management | 18 | 1 | ||||||
| 2026-02-18 | 13F | Achmea Investment Management B.V. | 0 | -100,00 | 0 | |||||
| 2026-01-22 | 13F | Personal Cfo Solutions, Llc | 5.274 | -0,45 | 309 | 7,67 | ||||
| 2026-01-30 | 13F | Interchange Capital Partners, LLC | 4.414 | 259 | ||||||
| 2026-02-02 | 13F | New England Capital Financial Advisors LLC | 275 | 0,73 | 16 | 14,29 | ||||
| 2026-02-17 | 13F | Warren Averett Asset Management, LLC | 8.669 | 63,50 | 508 | 77,00 | ||||
| 2026-02-12 | 13F | Hm Payson & Co | 2.186 | 23,50 | 128 | 33,33 | ||||
| 2026-01-27 | 13F | Bayforest Capital Ltd | 1.636 | -77,37 | 96 | -75,77 | ||||
| 2026-02-02 | 13F | Oppenheimer & Co Inc | 21.606 | 27,46 | 1.267 | 37,61 | ||||
| 2026-02-10 | 13F | Principia Wealth Advisory, LLC | 4 | 0,00 | 0 | |||||
| 2026-02-12 | 13F | Wealthspire Advisors, LLC | 0 | -100,00 | 0 | |||||
| 2026-01-08 | 13F | NorthCrest Asset Manangement, LLC | 17.239 | 85,51 | 985 | 95,63 | ||||
| 2026-01-16 | 13F | Louisiana State Employees Retirement System | 14.500 | -3,33 | 850 | 4,30 | ||||
| 2026-02-09 | 13F | Quest Partners LLC | 50.346 | -34,42 | 2.951 | -29,20 | ||||
| 2026-02-13 | 13F | Dai-Ichi Life Insurance Company, Ltd | 0 | -100,00 | 0 | -100,00 | ||||
| 2025-11-07 | 13F | Shell Asset Management Co | 8.045 | 0,00 | 0 | |||||
| 2026-02-05 | 13F | Tucker Asset Management Llc | 270 | 16 | ||||||
| 2026-02-03 | 13F | SBI Securities Co., Ltd. | 1.027 | 1,99 | 60 | 11,11 | ||||
| 2026-02-20 | 13F | Kovitz Investment Group Partners, LLC | 0 | -100,00 | 0 | -100,00 | ||||
| 2026-01-29 | 13F | Quent Capital, LLC | 870 | -3,23 | 51 | 6,25 | ||||
| 2025-10-22 | 13F | Spirepoint Private Client, Llc | 0 | -100,00 | 0 | |||||
| 2026-02-13 | 13F | Ieq Capital, Llc | 375.143 | 43,25 | 21.991 | 54,65 | ||||
| 2026-02-06 | 13F | Cullen/frost Bankers, Inc. | 2.470 | 255,40 | 145 | 289,19 | ||||
| 2026-02-12 | 13F | Bank Of Montreal /can/ | 280.373 | 11,21 | 16.435 | 20,06 | ||||
| 2026-02-10 | 13F | Kentucky Retirement Systems | 17.566 | 0,00 | 1.030 | 7,97 | ||||
| 2026-01-29 | 13F | State Of Michigan Retirement System | 95.928 | 0,00 | 5.623 | 7,97 | ||||
| 2026-02-05 | 13F | iA Global Asset Management Inc. | 0 | -100,00 | 0 | |||||
| 2026-02-02 | 13F | Bay Harbor Wealth Management, LLC | 29 | 107,14 | 2 | |||||
| 2026-02-10 | 13F | Rothschild Investment Llc | 5.184 | 100,00 | 304 | 116,43 | ||||
| 2026-02-10 | 13F | Acadian Asset Management Llc | 24.885 | -53,42 | 1 | -50,00 | ||||
| 2025-11-14 | 13F | Cubist Systematic Strategies, LLC | Call | 103.500 | -3,90 | 5.620 | -6,71 | |||
| 2025-11-07 | 13F | Synovus Financial Corp | 4.051 | 220 | ||||||
| 2026-02-13 | 13F | Wbi Investments, Inc. | 10.199 | 92,36 | 598 | 108,01 | ||||
| 2026-02-03 | 13F | Manske Wealth Management | 4.407 | -7,28 | 258 | 0,00 | ||||
| 2026-02-17 | 13F | TCG Advisory Services, LLC | 9.214 | 97,01 | 540 | 113,44 | ||||
| 2025-11-14 | 13F | Virtu Financial LLC | 0 | -100,00 | 0 | |||||
| 2026-02-11 | 13F | Meeder Advisory Services, Inc. | 5.213 | 306 | ||||||
| 2026-02-13 | 13F | Squarepoint Ops LLC | 373.291 | 4.797,55 | 21.882 | 5.198,31 | ||||
| 2026-02-17 | 13F | Cambria Investment Management, L.P. | 144.773 | 8.487 | ||||||
| 2026-03-12 | 13F/A | Peak6 Llc | Put | 8.300 | -34,65 | 487 | -29,46 | |||
| 2026-02-17 | 13F | Delaware Management Holdings, Inc. | 139.120 | 8.155 | ||||||
| 2026-03-12 | 13F/A | Peak6 Llc | Call | 124.800 | 94,70 | 7.316 | 110,20 | |||
| 2026-02-13 | 13F | Gts Securities Llc | 0 | -100,00 | 0 | |||||
| 2026-02-26 | 13F | Anchor Investment Management, LLC | 68 | -88,03 | 4 | -86,67 | ||||
| 2026-02-10 | 13F | Connor, Clark & Lunn Investment Management Ltd. | 0 | -100,00 | 0 | |||||
| 2026-02-13 | 13F | Squarepoint Ops LLC | Call | 12.900 | -83,16 | 756 | -81,82 | |||
| 2026-02-13 | 13F | Squarepoint Ops LLC | Put | 11.300 | 4,63 | 662 | 12,97 | |||
| 2026-02-05 | 13F | Intrua Financial, LLC | 4.657 | -18,98 | 273 | -12,50 | ||||
| 2026-02-06 | 13F | Banque Cantonale Vaudoise | 0 | -100,00 | 0 | |||||
| 2025-10-20 | 13F | LVW Advisors, LLC | 0 | -100,00 | 0 | |||||
| 2026-01-12 | 13F | Kozak & Associates, Inc. | 23 | 0,00 | 1 | 0,00 | ||||
| 2026-01-22 | 13F | Trilogy Capital Inc. | 60.474 | 1.402,46 | 3.545 | 1.525,69 | ||||
| 2025-10-20 | 13F | Accurate Wealth Management, LLC | 0 | -100,00 | 0 | |||||
| 2025-11-21 | 13F/A | Royal Bank Of Canada | Call | 0 | -100,00 | 0 | -100,00 | |||
| 2026-01-16 | 13F | Tema Etfs Llc | 4.942 | -0,24 | 290 | 7,43 | ||||
| 2026-02-13 | 13F | Golden State Wealth Management, LLC | 29 | 0,00 | 2 | 0,00 | ||||
| 2026-02-10 | 13F | Intellectus Partners, LLC | 5.616 | -15,02 | 329 | -8,10 | ||||
| 2026-02-10 | 13F | Eurizon Capital SGR S.p.A. | 25.584 | 1.500 | ||||||
| 2026-01-28 | 13F | WPG Advisers, LLC | 254 | -10,88 | 15 | -6,67 | ||||
| 2026-01-23 | 13F | Community Bank of Raymore | 43.893 | -0,40 | 2.573 | 7,57 | ||||
| 2026-01-15 | 13F | Retirement Systems of Alabama | 60.214 | -1,22 | 3.530 | 6,62 | ||||
| 2025-11-14 | 13F | Binnacle Investments Inc | 99 | 13,79 | 5 | 25,00 | ||||
| 2026-02-10 | 13F | IFG Advisory, LLC | 82.923 | 4.861 | ||||||
| 2026-01-23 | 13F | Halbert Hargrove Global Advisors, Llc | 0 | -100,00 | 0 | |||||
| 2026-02-12 | 13F | Nuveen, LLC | 615.283 | -5,37 | 36.068 | 2,16 | ||||
| 2026-02-17 | 13F | Tcw Group Inc | 4.277 | 251 | ||||||
| 2026-02-17 | 13F | NewSquare Capital LLC | 58.459 | 3.427 | ||||||
| 2026-02-05 | 13F | Amalgamated Bank | 53.450 | -1,69 | 3 | 50,00 | ||||
| 2026-02-12 | 13F | Dimensional Fund Advisors Lp | 2.819.008 | -0,46 | 165.264 | 7,47 | ||||
| 2026-01-16 | 13F | Marquette Asset Management, LLC | 0 | -100,00 | 0 | -100,00 | ||||
| 2026-02-03 | 13F | Wesbanco Bank Inc | 5.900 | 2,15 | 346 | 10,22 | ||||
| 2026-02-17 | 13F | Advisory Services Network, LLC | 39.766 | 3,58 | 2.331 | 11,85 | ||||
| 2026-02-04 | 13F | HighPoint Advisor Group LLC | 10.575 | 18,21 | 620 | 27,63 | ||||
| 2026-02-17 | 13F | Bank Of America Corp /de/ | Put | 0 | -100,00 | 0 | ||||
| 2026-02-17 | 13F | D. E. Shaw & Co., Inc. | Call | 313.100 | 0,00 | 18.354 | 7,95 | |||
| 2026-02-17 | 13F | D. E. Shaw & Co., Inc. | 103.050 | 53,15 | 6.041 | 65,34 | ||||
| 2026-02-17 | 13F | D. E. Shaw & Co., Inc. | Put | 161.900 | 124,86 | 9.491 | 142,77 | |||
| 2026-02-17 | 13F | Northern Trust Corp | 4.601.488 | 2,09 | 269.739 | 10,21 | ||||
| 2026-02-17 | 13F | SageView Advisory Group, LLC | 932 | 55 | ||||||
| 2026-02-04 | 13F | Sentry Investment Management Llc | 676 | 0,00 | 0 | |||||
| 2026-01-20 | 13F | Trust Investment Advisors | 15.504 | 4,12 | 909 | 12,38 | ||||
| 2026-01-28 | 13F | Teacher Retirement System Of Texas | 234.157 | 524,45 | 13.726 | 574,17 | ||||
| 2026-02-02 | 13F | Altrius Capital Management Inc | 93.617 | 13,36 | 5.488 | 22,37 | ||||
| 2026-01-23 | 13F | Steigerwald, Gordon & Koch Inc. | 63 | 4 | ||||||
| 2026-01-23 | 13F | Patton Fund Management, Inc. | 3.914 | -0,51 | 229 | 7,51 | ||||
| 2026-02-12 | 13F | New York State Common Retirement Fund | 128.197 | -29,33 | 7.515 | -23,71 | ||||
| 2026-02-11 | 13F | Fox Run Management, L.l.c. | 0 | -100,00 | 0 | |||||
| 2026-01-23 | 13F | Robeco Institutional Asset Management B.V. | 184.842 | -35,51 | 10.835 | -30,38 | ||||
| 2026-01-27 | 13F | TD Waterhouse Canada Inc. | 926 | -6,09 | 54 | 1,89 | ||||
| 2026-01-20 | 13F | Savvy Advisors, Inc. | 3.548 | -47,94 | 208 | -43,78 | ||||
| 2026-01-14 | 13F | Exchange Traded Concepts, Llc | 38.244 | 2,22 | 2.242 | 10,34 | ||||
| 2026-02-17 | 13F | Brevan Howard Capital Management LP | 25.478 | -76,15 | 1.494 | -74,26 | ||||
| 2025-11-14 | 13F | PineBridge Investments, L.P. | 17.654 | -87,48 | 959 | -87,85 | ||||
| 2026-01-29 | 13F | Inscription Capital, LLC | 24.436 | -9,38 | 1.432 | -2,19 | ||||
| 2026-02-03 | 13F | Strengthening Families & Communities, LLC | 0 | -100,00 | 0 | |||||
| 2026-02-13 | 13F | Sterling Capital Management LLC | 17.218 | -4,05 | 1.009 | 3,59 | ||||
| 2026-01-26 | 13F | Parcion Private Wealth LLC | 6.262 | 367 | ||||||
| 2026-02-17 | 13F | Cetera Investment Advisers | 98.661 | 35,41 | 5.783 | 46,18 | ||||
| 2026-02-13 | 13F | Martingale Asset Management L P | 272.406 | -0,33 | 15.968 | 7,60 | ||||
| 2026-02-06 | 13F | Gsa Capital Partners Llp | 0 | -100,00 | 0 | |||||
| 2026-01-21 | 13F | Paladin Advisory Group, LLC | 300 | 0,00 | 18 | 6,25 | ||||
| 2026-01-26 | 13F | Iams Wealth Management, Llc | 0 | -100,00 | 0 | |||||
| 2026-02-06 | 13F | Resona Asset Management Co.,Ltd. | 138.830 | 0,23 | 8.138 | 8,26 | ||||
| 2026-02-11 | 13F | Twin Tree Management, LP | Put | 0 | -100,00 | 0 | ||||
| 2026-02-03 | 13F | Sequoia Financial Advisors, LLC | 25.756 | 3,27 | 1.510 | 11,45 | ||||
| 2026-01-27 | 13F | First Horizon Corp | 723 | -29,60 | 42 | -23,64 | ||||
| 2026-02-10 | 13F | DT Investment Partners, LLC | 30 | 0,00 | 2 | 0,00 | ||||
| 2026-02-13 | 13F | Chevy Chase Trust Holdings, Inc. | 143.512 | -1,59 | 8.413 | 6,23 | ||||
| 2025-10-16 | 13F | Kingstone Capital Partners Texas, LLC | 0 | -100,00 | 0 | -100,00 | ||||
| 2026-02-17 | 13F | Banco Bilbao Vizcaya Argentaria, S.a. | 0 | -100,00 | 0 | |||||
| 2026-02-17 | 13F | Maryland State Retirement & Pension System | 13.994 | 0,00 | 820 | 8,04 | ||||
| 2026-02-05 | 13F | High Note Wealth, LLC | 293 | 0,00 | 17 | 13,33 | ||||
| 2026-02-17 | 13F | Sovereign's Capital Management, LLC | 24.002 | -47,51 | 1.407 | -43,35 | ||||
| 2026-02-05 | 13F | Wakefield Asset Management LLLP | 7.698 | 4,98 | 451 | 13,32 | ||||
| 2026-02-09 | 13F | Smithfield Trust Co | 95 | 0,00 | 0 | |||||
| 2026-02-17 | 13F | Dark Forest Capital Management Lp | 38.558 | 97,54 | 2.260 | 107,15 | ||||
| 2026-02-12 | 13F | UniSuper Management Pty Ltd | 40.037 | -8,59 | 2.347 | -1,35 | ||||
| 2026-02-11 | 13F | Twin Tree Management, LP | Call | 0 | -100,00 | 0 | ||||
| 2026-02-12 | 13F | Federated Hermes, Inc. | 1.207 | -1,15 | 71 | 6,06 | ||||
| 2026-02-04 | 13F | Tsfg, Llc | 48 | 0,00 | 0 | |||||
| 2025-10-14 | 13F | Arvest Investments, Inc. | 0 | 0 | ||||||
| 2026-02-04 | 13F | Hartford Investment Management Co | 16.078 | -2,96 | 942 | 4,78 | ||||
| 2026-02-13 | 13F | Ostrum Asset Management | 7.248 | -24,89 | 425 | -18,93 | ||||
| 2026-01-28 | 13F | Klp Kapitalforvaltning As | 251.831 | -17,68 | 14.762 | -11,14 | ||||
| 2026-02-13 | 13F | Palisade Asset Management, LLC | 7.965 | -42,99 | 467 | -38,52 | ||||
| 2026-02-13 | 13F | Strategic Global Advisors, LLC | 0 | -100,00 | 0 | |||||
| 2025-11-14 | 13F/A | Mubadala Investment Co PJSC | 0 | -100,00 | 0 | |||||
| 2026-02-17 | 13F | Aquatic Capital Management LLC | 0 | -100,00 | 0 | |||||
| 2026-02-12 | 13F | BRYN MAWR TRUST Co | 306 | -4,97 | 18 | 0,00 | ||||
| 2026-01-15 | 13F | Fortitude Family Office, LLC | 46 | -52,08 | 3 | -60,00 | ||||
| 2026-02-17 | 13F | Westwood Holdings Group Inc | 143.778 | -20,54 | 8.428 | -14,22 | ||||
| 2026-02-17 | 13F | Nissay Asset Management Corp /japan/ /adv | 37.727 | 1,59 | 2.212 | 9,67 | ||||
| 2026-02-11 | 13F | Rise Advisors, LLC | 0 | -100,00 | 0 | |||||
| 2026-03-30 | 13F/A | Barclays Plc | Put | 0 | -100,00 | 0 | ||||
| 2026-01-08 | 13F | Versant Capital Management, Inc | 6.223 | -32,47 | 365 | -27,20 | ||||
| 2026-01-14 | 13F | Pallas Capital Advisors LLC | 13.415 | -0,30 | 786 | 7,67 | ||||
| 2025-11-13 | 13F | Bank Julius Baer & Co. Ltd, Zurich | 0 | -100,00 | 0 | |||||
| 2026-02-12 | 13F | JPL Wealth Management, LLC | 0 | -100,00 | 0 | |||||
| 2026-02-09 | 13F | Morningstar Investment Management LLC | 32.079 | -2,43 | 2 | 0,00 | ||||
| 2026-02-17 | 13F | Polymer Capital Management (US) LLC | 15.144 | 5,19 | 888 | 13,57 | ||||
| 2026-02-02 | 13F | Farmers & Merchants Trust Co of Chambersburg PA | 800 | 0,00 | 0 | |||||
| 2026-02-10 | 13F | Quantbot Technologies LP | 0 | -100,00 | 0 | |||||
| 2026-01-21 | 13F | McElhenny Sheffield Capital Management, LLC | 0 | -100,00 | 0 | |||||
| 2026-02-04 | 13F | Greenwood Gearhart Inc | 135.826 | 23,65 | 7.962 | 33,50 | ||||
| 2026-02-17 | 13F | Fmr Llc | 1.394.152 | -62,88 | 81.725 | -59,93 | ||||
| 2026-02-11 | 13F | Barrow Hanley Mewhinney & Strauss Llc | 223.581 | -6,46 | 13.106 | 0,99 | ||||
| 2026-02-17 | 13F | Gotham Asset Management, LLC | 630.542 | 21,97 | 36.962 | 31,67 | ||||
| 2026-02-12 | 13F | McMillan Office, Inc. | 300 | 18 | ||||||
| 2026-02-24 | 13F | Bell Investment Advisors, Inc | 76 | 0,00 | 4 | 0,00 | ||||
| 2026-02-17 | 13F | Clear Street Markets Llc | 4.747 | 69,96 | 278 | 84,11 | ||||
| 2026-02-10 | 13F | Evolution Wealth Management Inc. | 14 | 0,00 | 1 | |||||
| 2026-02-17 | 13F | Wiley Bros.-aintree Capital, Llc | 35.084 | 4,31 | 2.056 | 15,19 | ||||
| 2025-11-13 | 13F | Artemis Investment Management LLP | 0 | -100,00 | 0 | |||||
| 2026-01-14 | 13F | Thompson Investment Management, Inc. | 2.979 | -86,08 | 175 | -85,01 | ||||
| 2026-02-24 | 13F | DGS Capital Management, LLC | 3.498 | 205 | ||||||
| 2026-01-27 | 13F | Zurcher Kantonalbank (Zurich Cantonalbank) | 122.082 | -20,47 | 7.156 | -14,15 | ||||
| 2026-02-17 | 13F | Qube Research & Technologies Ltd | Put | 300 | 0,00 | 18 | 6,25 | |||
| 2026-02-17 | 13F | Qube Research & Technologies Ltd | 676.880 | -67,78 | 39.679 | -65,22 | ||||
| 2025-11-14 | 13F | Mangrove Partners | 0 | -100,00 | 0 | |||||
| 2026-02-11 | 13F | Inceptionr Llc | 26.673 | -31,20 | 1.564 | -25,75 | ||||
| 2026-01-28 | 13F | Oversea-Chinese Banking CORP Ltd | 11.839 | 85,83 | 694 | 101,16 | ||||
| 2026-02-03 | 13F | Crossmark Global Holdings, Inc. | 20.349 | 2,66 | 1.193 | 10,78 | ||||
| 2026-02-09 | 13F | Coldstream Capital Management Inc | 6.903 | 55,89 | 405 | 68,33 | ||||
| 2026-02-04 | 13F | Clark Wealth Partners | 53 | 0,00 | 3 | 0,00 | ||||
| 2026-02-17 | 13F | Keebeck Alpha, LP | 0 | -100,00 | 0 | |||||
| 2026-04-02 | 13F | Aspect Partners, LLC | 160 | 0,00 | 10 | 11,11 | ||||
| 2026-02-17 | 13F | Quantitative Investment Management, LLC | 4.524 | 0 | ||||||
| 2026-02-05 | 13F | PAX Financial Group, LLC | 3.874 | 227 | ||||||
| 2026-02-13 | 13F | Morgan Stanley | 3.286.088 | -1,70 | 192.631 | 6,12 | ||||
| 2026-02-17 | 13F | Caisse De Depot Et Placement Du Quebec | 0 | -100,00 | 0 | |||||
| 2026-02-13 | 13F | Ossiam | 0 | -100,00 | 0 | |||||
| 2026-02-05 | 13F | Td Private Client Wealth Llc | 4.069 | -31,21 | 239 | -25,86 | ||||
| 2026-02-13 | 13F | Prudential Financial Inc | 141.234 | -13,72 | 8.279 | -6,85 | ||||
| 2026-01-15 | 13F | apricus wealth, LLC | 62.690 | 9,00 | 3.675 | 17,64 | ||||
| 2026-01-29 | 13F | Nbc Securities, Inc. | 4.084 | 239 | ||||||
| 2026-01-30 | 13F | Archer Investment Corp | 550 | 0,00 | 32 | 10,34 | ||||
| 2025-10-31 | 13F | Symphony Financial, Ltd. Co. | 0 | -100,00 | 0 | -100,00 | ||||
| 2026-02-17 | 13F | Toronto Dominion Bank | 94.932 | -43,24 | 5.565 | -38,73 | ||||
| 2026-01-20 | 13F | Independence Bank of Kentucky | 450 | 0,00 | 26 | 8,33 | ||||
| 2026-02-11 | 13F | CSM Advisors, LLC | 257.007 | 8,61 | 15 | 25,00 | ||||
| 2026-02-06 | 13F | Leonteq Securities AG | 8.242 | -33,93 | 483 | -28,66 | ||||
| 2026-02-12 | 13F | Cloud Capital Management, LLC | 0 | -100,00 | 0 | |||||
| 2026-02-11 | 13F | J.w. Cole Advisors, Inc. | 19.120 | -17,42 | 1.109 | -11,85 | ||||
| 2026-01-28 | 13F | Legacy Capital Group California, Inc. | 4.300 | 0,63 | 252 | 8,62 | ||||
| 2026-02-11 | 13F | Gwn Securities Inc. | 3.560 | 209 | ||||||
| 2026-02-17 | 13F | Woodline Partners LP | 5.228 | 306 | ||||||
| 2026-02-17 | 13F | Raymond James Financial Inc | 461.966 | 11,75 | 27.080 | 20,64 | ||||
| 2026-02-03 | 13F | International Assets Investment Management, Llc | 920 | 54 | ||||||
| 2026-02-17 | 13F | Nomura Holdings Inc | 11.200 | 6,19 | 657 | 14,69 | ||||
| 2025-10-31 | 13F | Mendel Capital Management LLC | 15.042 | 1,78 | 817 | -1,21 | ||||
| 2026-01-09 | 13F | Assenagon Asset Management S.A. | 480.707 | 75,71 | 28.179 | 89,69 | ||||
| 2026-02-13 | 13F | Truvestments Capital Llc | 6.001 | -22,42 | 352 | -16,43 | ||||
| 2026-02-17 | 13F | Fairscale Capital, LLC | 28 | 0,00 | 2 | 0,00 | ||||
| 2026-02-17 | 13F | Credit Agricole S A | 108.928 | 126,56 | 6.385 | 144,64 | ||||
| 2026-02-13 | 13F | Liberty One Investment Management, Llc | 0 | -100,00 | 0 | |||||
| 2026-02-17 | 13F | Sherbrooke Park Advisers Llc | 0 | -100,00 | 0 | |||||
| 2026-01-08 | 13F | PMV Capital Advisers, LLC | 169 | 10 | ||||||
| 2026-01-13 | 13F | CoreCap Advisors, LLC | 299 | -29,15 | 18 | -22,73 | ||||
| 2026-01-27 | 13F | Forum Financial Management, LP | 9.248 | -2,25 | 542 | 5,65 | ||||
| 2026-01-15 | 13F | Highline Wealth Partners Llc | 10 | 0,00 | 1 | |||||
| 2025-11-12 | 13F | Bellwether Advisors, LLC | 0 | -100,00 | 0 | |||||
| 2026-02-17 | 13F | Algert Global Llc | 7.750 | 16,54 | 0 | |||||
| 2026-01-28 | 13F | Universal- Beteiligungs- und Servicegesellschaft mbH | 214.486 | 4,99 | 12.596 | 13,55 | ||||
| 2026-02-02 | 13F | Millstone Evans Group, LLC | 62 | 0,00 | 4 | 0,00 | ||||
| 2025-10-24 | 13F | Hemington Wealth Management | 409 | 0,74 | 0 | |||||
| 2026-02-17 | 13F | XTX Topco Ltd | 0 | -100,00 | 0 | |||||
| 2026-01-30 | 13F | BancorpSouth Bank | 12.791 | 11,24 | 750 | 20,03 | ||||
| 2026-02-13 | 13F | Jacobi Capital Management LLC | 14.986 | 4,67 | 878 | 13,00 | ||||
| 2026-02-17 | 13F | Advisor Group Holdings, Inc. | 62.209 | -42,51 | 3.648 | -39,08 | ||||
| 2026-02-17 | 13F/A | Sentinus, LLC | 5.762 | 338 | ||||||
| 2026-01-13 | 13F | Capital Investment Advisors, LLC | 8.878 | -2,59 | 520 | 5,26 | ||||
| 2026-02-13 | 13F | Royal London Asset Management Ltd | 778.467 | 5,54 | 45.634 | 13,94 | ||||
| 2026-01-30 | 13F | State of New Jersey Common Pension Fund D | 89.701 | -4,06 | 5.258 | 3,59 | ||||
| 2026-02-23 | 13F | Beaird Harris Wealth Management, LLC | 703 | -0,42 | 41 | 7,89 | ||||
| 2025-11-12 | 13F | Neo Ivy Capital Management | 0 | -100,00 | 0 | -100,00 | ||||
| 2026-02-17 | 13F | Utah Retirement Systems | 46.208 | 0,00 | 2.709 | 7,93 | ||||
| 2026-01-16 | 13F | Standard Life Aberdeen plc | 116.588 | -16,78 | 6.834 | -9,60 | ||||
| 2026-02-13 | 13F | Walleye Trading LLC | 0 | -100,00 | 0 | -100,00 | ||||
| 2025-10-30 | 13F | Twin Peaks Wealth Advisors, LLC | 0 | -100,00 | 0 | |||||
| 2026-02-12 | 13F | Cibc World Markets Corp | 103.273 | 186,77 | 6.054 | 200,55 | ||||
| 2026-02-09 | 13F | Allstate Corp | 19.791 | 91,13 | 1.160 | 106,41 | ||||
| 2026-02-13 | 13F | Cohen & Steers, Inc. | 81.770 | 3.988,50 | 5 | |||||
| 2026-02-05 | 13F | Leeward Investments, LLC - MA | 93.488 | -4,90 | 5.480 | 2,68 | ||||
| 2026-01-27 | 13F | Brighton Jones Llc | 0 | -100,00 | 0 | |||||
| 2026-02-23 | 13F | Mv Capital Management, Inc. | 114 | 5,56 | 7 | 0,00 | ||||
| 2026-02-17 | 13F | Weiss Asset Management LP | 50.481 | 2.959 | ||||||
| 2026-02-12 | 13F | Adviser Investments LLC | 0 | -100,00 | 0 | |||||
| 2026-02-17 | 13F | Trexquant Investment LP | 57.205 | -37,31 | 3.353 | -32,33 | ||||
| 2026-02-10 | 13F | Kentucky Retirement Systems Insurance Trust Fund | 7.363 | 0,00 | 432 | 8,02 | ||||
| 2026-02-12 | 13F | Hrt Financial Lp | 13.700 | 53,93 | 1 | -100,00 | ||||
| 2026-02-17 | 13F | Mercer Global Advisors Inc /adv | 107.862 | 17,51 | 6.323 | 26,85 | ||||
| 2025-11-14 | 13F | AXA Investment Managers S.A. | 9.589 | 521 | ||||||
| 2026-02-17 | 13F | Evolve Private Wealth, Llc | 12.336 | 723 | ||||||
| 2026-02-17 | 13F | Twinbeech Capital Lp | 0 | -100,00 | 0 | |||||
| 2026-02-13 | 13F | Verition Fund Management LLC | 131.389 | -19,57 | 7.702 | -13,17 | ||||
| 2026-02-05 | 13F | Pinnacle Associates Ltd | 9.385 | 88,57 | 550 | 103,70 | ||||
| 2026-01-23 | 13F | Brown, Lisle/cummings, Inc. | 1.867 | 0,00 | 109 | 7,92 | ||||
| 2026-02-13 | 13F | Verition Fund Management LLC | Call | 25.200 | -81,59 | 1.477 | -80,13 | |||
| 2025-11-03 | 13F | Townsquare Capital Llc | 4.292 | -27,33 | 233 | -29,39 | ||||
| 2026-02-03 | 13F | Ethic Inc. | 16.102 | -3,77 | 944 | 3,85 | ||||
| 2026-02-12 | 13F | Voya Investment Management Llc | 70.318 | -2,21 | 4.122 | 5,58 | ||||
| 2026-02-12 | 13F | BlackRock, Inc. | 24.993.416 | -4,47 | 1.465.114 | 3,14 | ||||
| 2026-01-06 | 13F | Sage Capital Advisors,llc | 108.200 | 0,57 | 6.343 | 8,58 | ||||
| 2026-02-13 | 13F | 1 North Wealth Services Llc | 80 | 0,00 | 5 | 0,00 | ||||
| 2026-02-17 | 13F | Bank Of America Corp /de/ | Call | 0 | -100,00 | 0 | ||||
| 2026-02-17 | 13F | Strategic Investment Advisors / MI | 8.272 | -3,94 | 485 | 3,64 | ||||
| 2026-02-10 | 13F | Bnp Paribas Arbitrage, Sa | 455.231 | 29,56 | 26.686 | 39,87 | ||||
| 2026-02-02 | 13F | Davis Selected Advisers | 12.827.540 | 28,76 | 751.951 | 39,01 | ||||
| 2026-02-10 | 13F | Thompson Siegel & Walmsley Llc | 810.267 | -12,65 | 47 | -6,00 | ||||
| 2026-02-13 | 13F | Public Employees Retirement Association Of Colorado | 26.545 | 0,00 | 2 | 0,00 | ||||
| 2026-02-04 | 13F | Ameritas Advisory Services, LLC | 4.418 | 259 | ||||||
| 2026-02-10 | 13F | Bnp Paribas Arbitrage, Sa | Put | 242 | 1.419 | |||||
| 2026-02-09 | 13F/A | Swedbank AB | 140.554 | 0,00 | 8.239 | 7,95 | ||||
| 2026-02-10 | 13F | Bnp Paribas Arbitrage, Sa | Call | 562 | 64,33 | 3.294 | 77,38 | |||
| 2026-02-10 | 13F | Bank of New York Mellon Corp | 1.694.191 | -22,43 | 99.313 | -16,26 | ||||
| 2026-01-21 | 13F | Aaron Wealth Advisors LLC | 25.099 | -27,52 | 1.471 | -21,76 | ||||
| 2026-02-17 | 13F | Glenmede Trust Co Na | 0 | -100,00 | 0 | |||||
| 2026-02-13 | 13F | JustInvest LLC | 32.612 | 22,55 | 1.912 | 32,34 | ||||
| 2025-11-17 | 13F | Armistice Capital, Llc | 0 | -100,00 | 0 | -100,00 | ||||
| 2026-02-17 | 13F | Css Llc/il | 21.390 | -1,79 | 1.254 | 6,01 | ||||
| 2026-01-22 | 13F | Pinnacle Bancorp, Inc. | 109 | 31,33 | 6 | 50,00 | ||||
| 2026-02-13 | 13F | Citigroup Inc | 346.291 | -17,49 | 20.300 | -10,92 | ||||
| 2025-11-14 | 13F | Skopos Labs, Inc. | 0 | -100,00 | 0 | |||||
| 2026-02-12 | 13F | CoreCommodity Management, LLC | 66.726 | 13,78 | 3.911 | 22,83 | ||||
| 2025-11-12 | 13F | Total Clarity Wealth Management, Inc. | 0 | -100,00 | 0 | |||||
| 2026-01-27 | 13F | Lecap Asset Management Ltd | 10.172 | -61,04 | 596 | -57,94 | ||||
| 2026-01-16 | 13F | Crewe Advisors LLC | 17 | 1 | ||||||
| 2026-02-06 | 13F | Vestmark Advisory Solutions, Inc. | 4.695 | 275 | ||||||
| 2026-01-22 | 13F | Venturi Wealth Management, LLC | 4.618 | -26,04 | 271 | -20,35 | ||||
| 2025-11-14 | 13F | Volterra Technologies LP | 0 | -100,00 | 0 | |||||
| 2025-11-14 | 13F | Volterra Technologies LP | Put | 0 | -100,00 | 0 | ||||
| 2025-11-10 | 13F/A | Flaharty Asset Management, LLC | 0 | -100,00 | 0 | |||||
| 2026-02-17 | 13F | Russell Investments Group, Ltd. | 1.543.063 | -9,62 | 90.473 | -2,40 | ||||
| 2026-02-11 | 13F | Deseret Mutual Benefit Administrators | 3.942 | 4,40 | 231 | 12,68 | ||||
| 2026-01-06 | 13F | Investors Research Corp | 8.066 | 0,00 | 473 | 8,01 | ||||
| 2026-01-23 | 13F | Sumitomo Mitsui Trust Holdings, Inc. | 729.600 | -2,12 | 42.769 | 5,67 | ||||
| 2026-02-09 | 13F | Life Cycle Investment Partners Ltd | 2.818.485 | 165.220 | ||||||
| 2026-02-11 | 13F | Cedar Mountain Advisors, LLC | 124 | -58,25 | 7 | -56,25 | ||||
| 2026-02-11 | 13F | Parallel Advisors, LLC | 2.335 | -27,10 | 137 | -21,39 | ||||
| 2026-01-21 | 13F | Signature Resources Capital Management, LLC | 30 | 0,00 | 2 | 0,00 | ||||
| 2026-02-11 | 13F | Zions Bancorporation, National Association /ut/ | 72 | -20,00 | 4 | 0,00 | ||||
| 2026-01-30 | 13F | Citizens Financial Group Inc/ri | 3.588 | 210 | ||||||
| 2026-02-13 | 13F | Bridgewater Associates, LP | 17.118 | -46,96 | 1.003 | -42,75 | ||||
| 2026-02-13 | 13F | Advyzon Investment Management, LLC | 5.707 | 0,42 | 335 | 8,44 | ||||
| 2026-02-05 | 13F | Center for Financial Planning, Inc. | 4 | 0 | ||||||
| 2026-02-17 | 13F | Guggenheim Capital Llc | 66.964 | -33,01 | 3.925 | -27,69 | ||||
| 2026-02-09 | 13F | Atlantic Trust, LLC | 295 | -14,49 | 17 | -5,56 | ||||
| 2026-02-05 | 13F | Convergence Investment Partners, LLC | 9.792 | 574 | ||||||
| 2026-02-17 | 13F | Captrust Financial Advisors | 40.443 | -2,16 | 2.371 | 5,61 | ||||
| 2026-01-29 | 13F | Vanguard Group Inc | 36.530.135 | 0,13 | 2.141.397 | 8,09 | ||||
| 2026-02-13 | 13F | QTR Family Wealth, LLC | 3.459 | 225 | ||||||
| 2025-11-14 | 13F | Full Sail Capital, LLC | 9.029 | 80,15 | 490 | 75,00 | ||||
| 2026-02-05 | 13F | Thrivent Financial For Lutherans | 27.975 | -28,56 | 2 | -50,00 | ||||
| 2026-01-29 | 13F | D.a. Davidson & Co. | 30.119 | 57,72 | 1.766 | 70,37 | ||||
| 2026-02-13 | 13F | Quinn Opportunity Partners LLC | 96.096 | 110,68 | 5.633 | 127,50 | ||||
| 2026-02-13 | 13F | Wells Fargo & Company/mn | 291.793 | 55,60 | 17.105 | 67,98 | ||||
| 2026-01-29 | 13F | Klingman & Associates, LLC | 3.427 | 201 | ||||||
| 2025-11-03 | 13F | AustralianSuper Pty Ltd | 0 | -100,00 | 0 | |||||
| 2026-02-02 | 13F | Danske Bank A/s | 176.356 | 2,80 | 10.338 | 10,97 | ||||
| 2026-02-17 | 13F | Lazard Asset Management Llc | 3.464 | -54,87 | 203 | -51,20 | ||||
| 2026-02-05 | 13F | AlphaCore Capital LLC | 5.684 | 333 | ||||||
| 2026-02-12 | 13F | Ensign Peak Advisors, Inc | 917.551 | -21,08 | 53.787 | -14,80 | ||||
| 2026-02-12 | 13F | Penserra Capital Management LLC | 27 | 28,57 | 0 | |||||
| 2026-01-29 | 13F | IMC-Chicago, LLC | 0 | -100,00 | 0 | -100,00 | ||||
| 2025-10-30 | 13F | Ridgewood Investments LLC | 5.684 | -2,07 | 309 | -4,94 | ||||
| 2025-11-10 | 13F | Lion Street Advisors, LLC | 12.589 | 16,86 | 1.007 | 67,11 | ||||
| 2026-02-04 | 13F | WealthTrust Asset Management, LLC | 0 | -100,00 | 0 | |||||
| 2026-01-08 | 13F | Wealth Enhancement Advisory Services, Llc | 103.769 | 39,08 | 5.788 | 43,10 | ||||
| 2026-02-06 | 13F | Profund Advisors Llc | 3.580 | 210 | ||||||
| 2026-02-13 | 13F | Mariner, LLC | 218.339 | 84,42 | 12.811 | 99,28 | ||||
| 2026-02-11 | 13F | Buckingham Strategic Partners | 30.501 | 68,76 | 1.788 | 83,38 | ||||
| 2026-02-18 | 13F | GWM Advisors LLC | 6.711 | 266,32 | 393 | 296,97 | ||||
| 2026-02-18 | 13F | State of Tennessee, Treasury Department | 106.441 | -16,05 | 6.954 | 1,00 | ||||
| 2026-02-09 | 13F | Lathrop Investment Management Corp | 9.592 | 7,75 | 1 | |||||
| 2026-02-02 | 13F | CENTRAL TRUST Co | 7.979 | 3,46 | 468 | 11,72 | ||||
| 2026-02-13 | 13F | Schroder Investment Management Group | 18.068 | 23,65 | 1.069 | 35,66 | ||||
| 2025-11-14 | 13F | Strategic Wealth Partners, Ltd. | 779 | 0,78 | 42 | -2,33 | ||||
| 2026-02-13 | 13F | Great West Life Assurance Co /can/ | 180.390 | -19,99 | 11 | -16,67 | ||||
| 2026-02-17 | 13F | NorthRock Partners, LLC | 6.757 | -75,06 | 396 | -73,06 | ||||
| 2026-02-17 | 13F | Ameriprise Financial Inc | 1.267.360 | -12,79 | 74.287 | -5,85 | ||||
| 2026-02-12 | 13F | State Board Of Administration Of Florida Retirement System | 248.386 | -9,10 | 14.560 | -1,87 | ||||
| 2026-02-17 | 13F | Centennial Bank/AR/ | 200 | 0,00 | 12 | 10,00 | ||||
| 2026-01-20 | 13F | American National Bank | 32 | 2 | ||||||
| 2026-02-10 | 13F | Norges Bank | 5.259.241 | 308.297 | ||||||
| 2026-02-12 | 13F | Renaissance Technologies Llc | 6.800 | -98,26 | 399 | -98,12 | ||||
| 2026-02-05 | 13F | WealthPlan Investment Management, LLC | 89.278 | -52,84 | 5.233 | -49,09 | ||||
| 2025-11-07 | 13F | Tobam | 0 | -100,00 | 0 | |||||
| 2026-02-10 | 13F | Moors & Cabot, Inc. | 14.206 | 0,11 | 833 | 8,05 | ||||
| 2026-02-12 | 13F | WealthPLAN Partners, LLC | 48.933 | -9,92 | 2.868 | -2,75 | ||||
| 2026-02-17 | 13F | Mirabella Financial Services Llp | 0 | -100,00 | 0 | |||||
| 2026-02-18 | 13F | Mackenzie Financial Corp | 88.827 | -64,03 | 5.246 | -60,88 | ||||
| 2026-01-16 | 13F | Weatherly Asset Management L. P. | 7.054 | -2,42 | 414 | 5,36 | ||||
| 2026-02-13 | 13F | Charles Schwab Investment Management Inc | 2.685.681 | 2,53 | 157.435 | 10,69 | ||||
| 2026-02-19 | 13F | TMB Capital Partners, LLC | 4.908 | 288 | ||||||
| 2026-02-13 | 13F | Arkadios Wealth Advisors | 4.895 | 19,10 | 287 | 28,25 | ||||
| 2026-02-11 | 13F | LPL Financial LLC | 222.514 | -3,35 | 13.044 | 4,34 | ||||
| 2026-02-10 | 13F | Murphy & Mullick Capital Management Corp | 7 | 0 | ||||||
| 2026-02-05 | 13F | 626 Financial, LLC | 3.581 | 210 | ||||||
| 2026-02-12 | 13F | Logan Capital Management Inc | 0 | -100,00 | 0 | |||||
| 2026-01-29 | 13F | Teachers Retirement System Of The State Of Kentucky | 22.405 | 0,00 | 1 | 0,00 | ||||
| 2026-02-11 | 13F | 111 Capital | 5.147 | 302 | ||||||
| 2026-01-09 | 13F | SG Americas Securities, LLC | 516.967 | 564,23 | 30 | 650,00 | ||||
| 2026-02-17 | 13F | Rakuten Investment Management, Inc. | 37.349 | 135,25 | 2.188 | 346,33 | ||||
| 2026-02-05 | 13F | Allworth Financial LP | 8.066 | 70,53 | 473 | 84,38 | ||||
| 2026-02-13 | 13F | Verition Fund Management LLC | Put | 0 | -100,00 | 0 | -100,00 | |||
| 2025-10-24 | 13F | MorganRosel Wealth Management, LLC | 0 | -100,00 | 0 | |||||
| 2026-02-24 | 13F/A | Pacer Advisors, Inc. | 48.012 | -96,93 | 2.814 | -96,68 | ||||
| 2026-02-05 | 13F | Qsemble Capital Management, LP | 63.277 | 81,27 | 3.709 | 95,73 | ||||
| 2026-02-02 | 13F | Kornitzer Capital Management Inc /ks | 28.955 | -3,66 | 1.697 | 4,05 | ||||
| 2026-02-06 | 13F | Hexagon Capital Partners LLC | 40.420 | -1,63 | 2.369 | 6,19 | ||||
| 2026-02-10 | 13F | Waterloo Capital, L.P. | 38.417 | 37,70 | 2.252 | 48,75 | ||||
| 2026-02-13 | 13F | Marshall Wace, Llp | 126.916 | 7.440 | ||||||
| 2026-02-27 | 13F | Groupama Asset Managment | 12.403 | -4,95 | 727 | 2,68 | ||||
| 2025-11-14 | 13F | Prudential Plc | 0 | -100,00 | 0 | -100,00 | ||||
| 2026-02-17 | 13F | Two Sigma Securities, Llc | 8.332 | -0,74 | 488 | 7,25 | ||||
| 2026-02-13 | 13F | Parkside Financial Bank & Trust | 473 | 47,35 | 28 | 58,82 | ||||
| 2026-02-17 | 13F | Lombard Odier Asset Management (USA) Corp | 0 | -100,00 | 0 | |||||
| 2026-02-03 | 13F | Rnc Capital Management Llc | 23.562 | -2,42 | 1.381 | 5,34 | ||||
| 2026-02-13 | 13F | Toroso Investments, LLC | 83.327 | 1,59 | 4.885 | 9,65 | ||||
| 2026-02-06 | 13F | Curat Global, LLC | 539 | 0,37 | 32 | 6,90 | ||||
| 2026-02-13 | 13F | Ubs Asset Management Americas Inc | 1.720.794 | 22,84 | 100.873 | 32,62 | ||||
| 2026-02-13 | 13F | Bridgefront Capital, LLC | 0 | -100,00 | 0 | -100,00 | ||||
| 2026-01-15 | 13F | Foster & Motley Inc | 10.032 | -22,22 | 1 | |||||
| 2026-02-13 | 13F | Maverick Capital Ltd | 35.080 | -49,73 | 2.056 | -45,74 | ||||
| 2026-03-13 | 13F/A | Pensionmark Financial Group, Llc | 6.228 | -27,29 | 365 | -21,51 | ||||
| 2026-02-17 | 13F | Jump Financial, LLC | 25.746 | 140,75 | 1.509 | 160,17 | ||||
| 2026-02-06 | 13F | Cedar Wealth Management, LLC | 59 | 0,00 | 3 | 0,00 | ||||
| 2026-02-13 | 13F | Centiva Capital, LP | 5.463 | 320 | ||||||
| 2026-02-13 | 13F | Cornercap Investment Counsel Inc | 28.558 | -1,35 | 1.674 | 6,56 | ||||
| 2026-01-12 | 13F | Kempner Capital Management Inc. | 44.273 | -8,78 | 2.636 | 0,04 | ||||
| 2026-01-12 | 13F | Abound Wealth Management | 51 | 0,00 | 3 | 0,00 | ||||
| 2026-01-20 | 13F | JB Capital LLC | 79.478 | 24,87 | 4.659 | 34,81 | ||||
| 2026-02-06 | 13F | Mach-1 Financial Group, Inc. | 8.579 | 503 | ||||||
| 2026-01-22 | 13F | Ofi Invest Asset Management | 390.000 | 19.466 | ||||||
| 2026-01-28 | 13F | DekaBank Deutsche Girozentrale | 56.200 | 0,00 | 4 | 0,00 | ||||
| 2026-02-09 | 13F | Cary Street Partners Financial Llc | 53.617 | -11,39 | 3.143 | -4,32 | ||||
| 2026-02-12 | 13F | Xponance, Inc. | 49.905 | 4,50 | 2.925 | 12,80 | ||||
| 2026-01-29 | 13F | Polaris Capital Management, LLC | 472.248 | -13,07 | 27.683 | -6,15 | ||||
| 2026-02-17 | 13F | Canada Pension Plan Investment Board | 543.888 | -12,37 | 31.883 | -5,40 | ||||
| 2026-02-11 | 13F | Modus Advisors, LLC | 388 | 23 | ||||||
| 2026-02-06 | 13F | Markel Corp | 884.500 | 4,24 | 51.849 | 12,54 | ||||
| 2026-02-04 | 13F | Securian Asset Management, Inc | 7.696 | -44,03 | 451 | -39,54 | ||||
| 2026-01-30 | 13F | Oakwell Private Wealth Management, LLC | 3.544 | 208 | ||||||
| 2026-02-13 | 13F | Healthcare Of Ontario Pension Plan Trust Fund | 11.189 | -1,09 | 656 | 6,68 | ||||
| 2026-02-03 | 13F | Credit Industriel Et Commercial | Put | 5.000 | 293 | |||||
| 2026-02-12 | 13F | Great Lakes Advisors, Llc | 25.622 | -93,23 | 1.502 | -92,70 | ||||
| 2026-02-17 | 13F | Man Group plc | 301.232 | 54,65 | 17.658 | 66,96 | ||||
| 2026-02-17 | 13F | North Capital, Inc. | 0 | -100,00 | 0 | |||||
| 2025-10-16 | 13F | Nvwm, Llc | 0 | -100,00 | 0 | |||||
| 2025-11-14 | 13F | Quadcap Wealth Management, LLC | 0 | -100,00 | 0 | |||||
| 2026-02-11 | 13F | Allianz Asset Management GmbH | 50.335 | -83,78 | 2.951 | -82,49 | ||||
| 2026-02-12 | 13F | Wedbush Securities Inc | 6.667 | -5,50 | 0 | |||||
| 2026-02-17 | 13F | Hilltop Holdings Inc. | 3.819 | -30,27 | 224 | -24,92 | ||||
| 2026-01-20 | 13F | Harbor Capital Advisors, Inc. | 0 | -100,00 | 0 | |||||
| 2026-02-13 | 13F | Neuberger Berman Group LLC | 57.982 | 7,35 | 3.399 | 15,89 | ||||
| 2026-01-29 | 13F | UMA Financial Services, Inc. | 48 | 71,43 | 3 | 100,00 | ||||
| 2026-02-05 | 13F | Sherman Asset Management, Inc. | 175 | 0,00 | 10 | 11,11 | ||||
| 2025-11-12 | 13F | Solstein Capital, LLC | 0 | -100,00 | 0 | |||||
| 2026-01-23 | 13F | Westside Investment Management, Inc. | 274 | -41,08 | 16 | -40,00 | ||||
| 2026-01-28 | 13F | Chicago Partners Investment Group LLC | 20.002 | 18,92 | 1.233 | 40,59 | ||||
| 2026-01-23 | 13F | Cantor Fitzgerald Investment Adviser L.p. | 0 | -100,00 | 0 | -100,00 | ||||
| 2026-01-30 | 13F | United Community Bank | 440 | -75,49 | 26 | -74,23 | ||||
| 2026-02-13 | 13F | Journey Strategic Wealth Llc | 3.493 | 205 | ||||||
| 2026-02-13 | 13F | Becker Capital Management Inc | 19.024 | 0,07 | 1.115 | 8,04 | ||||
| 2026-01-27 | 13F | Asset Management One Co., Ltd. | 151.742 | -0,41 | 8.889 | 7,45 | ||||
| 2026-02-04 | 13F | Naples Global Advisors, Llc | 28.735 | -0,04 | 1.684 | 7,95 | ||||
| 2026-02-02 | 13F | Sachetta, LLC | 10 | -95,95 | 1 | -100,00 |