Grundlæggende statistik
| Institutionelle aktier (lange) | 275.917.346 - 83,49% (ex 13D/G) - change of -35,00MM shares -11,26% MRQ |
| Institutionel værdi (lang) | $ 17.632.381 USD ($1000) |
Institutionelt ejerskab og aktionærer
Everpure, Inc. (US:PSTG) har 799 institutionelle ejere og aktionærer, der har indsendt 13D/G- eller 13F-formularer til Securities Exchange Commission (SEC). Disse institutioner har i alt 275,917,346 aktier. Største aktionærer omfatter Fmr Llc, BlackRock, Inc., Vanguard Group Inc, State Street Corp, Geode Capital Management, Llc, Disciplined Growth Investors Inc /mn, Atreides Management, LP, Arrowstreet Capital, Limited Partnership, Norges Bank, and Renaissance Technologies Llc .
Everpure, Inc. (NYSE:PSTG) institutionel ejerskabsstruktur viser aktuelle positioner i virksomheden efter institutioner og fonde, samt seneste ændringer i positionsstørrelse. Større aktionærer kan omfatte individuelle investorer, investeringsforeninger, hedgefonde eller institutioner. Skema 13D angiver, at investoren besidder (eller besidder) mere end 5 % af virksomheden og har til hensigt (eller har til hensigt at) aktivt at forfølge en ændring i forretningsstrategi. Skema 13G indikerer en passiv investering på over 5%.
The share price as of April 16, 2026 is 67,80 / share. Previously, on May 2, 2025, the share price was 47,84 / share. This represents an increase of 41,72% over that period.

Fondens stemningsscore
Fund Sentiment Score (fka Ownership Accumulation Score) finder de aktier, der bliver mest købt af fonde. Det er resultatet af en sofistikeret, multi-faktor kvantitativ model, der identificerer virksomheder med de højeste niveauer af institutionel akkumulering. Scoringsmodellen bruger en kombination af den samlede stigning i oplyste ejere, ændringerne i porteføljeallokeringer i disse ejere og andre målinger. Tallet går fra 0 til 100, hvor højere tal indikerer et højere niveau af akkumulering for sine jævnaldrende, og 50 er gennemsnittet.
Opdateringsfrekvens: Dagligt
Se Ownership Explorer, som giver en liste over højest rangerende virksomheder.
AI+ Ask Fintel’s AI assistant about Everpure, Inc..
Select a question to share a public post with an AI-crafted answer.
Thinking of good questions…
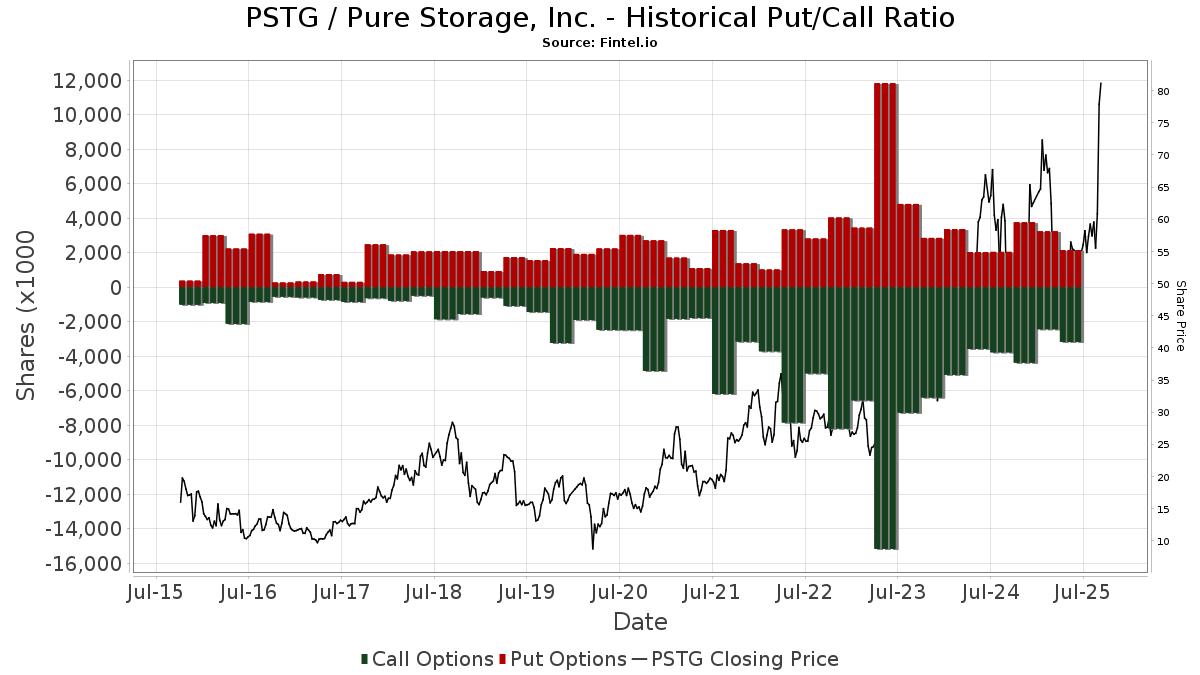
Institutionel Put/Call-forhold
Ud over at indberette standardaktie- og gældsudstedelser skal institutter med mere end 100 mill. aktiver under forvaltning også oplyse deres put- og call-optionsbeholdninger. Da salgsoptioner generelt indikerer negativ stemning, og købsoptioner indikerer positiv stemning, kan vi få en fornemmelse af den overordnede institutionelle stemning ved at plotte forholdet mellem put og kald. Diagrammet til højre viser det historiske put/call-forhold for dette instrument.
Brug af Put/Call Ratio som en indikator for investorernes stemning overvinder en af de vigtigste mangler ved at bruge totalt institutionelt ejerskab, som er, at en betydelig mængde af aktiver under forvaltning investeres passivt for at spore indekser. Passivt forvaltede fonde køber typisk ikke optioner, så indikatoren for put/call-forholdet følger mere nøje følelsen af aktivt forvaltede fonde.
13D/G-arkivering
Vi præsenterer 13D/G ansøgninger separat fra 13F ansøgninger på grund af den forskellige behandling af SEC. 13D/G-ansøgninger kan indgives af grupper af investorer (med én ledende), hvorimod 13F-ansøgninger ikke kan. Dette resulterer i situationer, hvor en investor kan indsende en 13D/G, der rapporterer én værdi for de samlede aktier (der repræsenterer alle de aktier, der ejes af investorgruppen), men derefter indsender en 13F, der rapporterer en anden værdi for de samlede aktier (der udelukkende repræsenterer deres egne) ejendomsret). Det betyder, at aktieejerskab af 13D/G-arkiver og 13F-arkiveringer ofte ikke er direkte sammenlignelige, så vi præsenterer dem separat.
Bemærk: Fra den 16. maj 2021 viser vi ikke længere ejere, der ikke har indsendt en 13D/G inden for det seneste år. Tidligere viste vi den fulde historie af 13D/G-arkiver. Generelt skal enheder, der er forpligtet til at indgive 13D/G-ansøgninger, indgive mindst årligt, før de indsender en afsluttende ansøgning. Dog forlader fonde nogle gange positioner uden at indsende en afsluttende ansøgning (dvs. de afvikler), så visning af den fulde historie resulterede nogle gange i forvirring om det nuværende ejerskab. For at undgå forvirring viser vi nu kun 'aktuelle' ejere - det vil sige - ejere, der har anmeldt inden for det seneste år.
Upgrade to unlock premium data.
| Fil dato | Form | Investor | Forrige Aktier |
Seneste Aktier |
Δ Aktier (Procent) |
Ejendomsret (Procent) |
Δ Ejerskab (Procent) |
|
|---|---|---|---|---|---|---|---|---|
| 2025-12-03 | BlackRock, Inc. | 32,397,870 | 33,158,593 | 2.35 | 10.10 | 2.02 |
13F og NPORT arkivering
Detaljer om 13F-arkivering er gratis. Detaljer om NP-ansøgninger kræver et premium-medlemskab. Grønne rækker angiver nye positioner. Røde rækker angiver lukkede positioner. Klik på linket ikon for at se den fulde transaktionshistorik.
Opgrader
for at låse premium-data op og eksportere til Excel ![]() .
.
| Fil dato | Kilde | Investor | Type | Gennemsnitlig pris (Øst) |
Aktier | Δ Aktier (%) |
Rapporteret Værdi ($1000) |
Δ Værdi (%) |
Port Alloc (%) |
|
|---|---|---|---|---|---|---|---|---|---|---|
| 2026-02-12 | 13F | Adviser Investments LLC | 50.045 | -2,17 | 3.354 | -21,79 | ||||
| 2026-02-10 | 13F | Acadian Asset Management Llc | 788.860 | 617,80 | 53 | 477,78 | ||||
| 2026-02-10 | 13F | Rothschild Investment Llc | 993 | 18,07 | 67 | -5,71 | ||||
| 2026-02-12 | 13F | BlackRock, Inc. | 38.044.426 | 2,58 | 2.549.357 | -17,99 | ||||
| 2026-02-17 | 13F | Qube Research & Technologies Ltd | Put | 55.200 | -33,17 | 3.699 | -46,58 | |||
| 2026-02-17 | 13F | Qube Research & Technologies Ltd | Call | 31.900 | -43,94 | 2.138 | -55,18 | |||
| 2026-04-14 | 13F | Banque Pictet & Cie Sa | 220.397 | -0,61 | 13.012 | -12,43 | ||||
| 2026-02-11 | 13F | Meeder Asset Management Inc | 2.784 | -69,16 | 187 | -75,40 | ||||
| 2026-02-13 | 13F | Diametric Capital, LP | 9.412 | 52,17 | 631 | 21,62 | ||||
| 2026-02-03 | 13F | Anfield Capital Management, LLC | 8 | 0,00 | 1 | |||||
| 2026-02-03 | 13F | RFG Advisory, LLC | 0 | -100,00 | 0 | |||||
| 2026-04-07 | 13F | Park Avenue Securities Llc | 0 | -100,00 | 0 | |||||
| 2026-01-21 | 13F | Capital Investment Advisory Services, LLC | 11.050 | 44,29 | 740 | 15,44 | ||||
| 2026-02-09 | 13F | Investors Portfolio Services LLC | 8 | 1 | ||||||
| 2026-04-15 | 13F | Trust Co Of Toledo Na /oh/ | 100 | 0,00 | 6 | -16,67 | ||||
| 2026-02-02 | 13F | Heritage Financial Services, LLC | 4.523 | 0,02 | 303 | -19,84 | ||||
| 2026-02-13 | 13F | Citigroup Inc | 173.056 | -13,89 | 11.596 | -31,15 | ||||
| 2026-02-17 | 13F | Shelton Capital Management | 10.507 | -5,37 | 704 | -24,30 | ||||
| 2026-05-01 | 13F | Arizona State Retirement System | 85.243 | -0,88 | 5.033 | -12,67 | ||||
| 2026-02-18 | 13F | Beacon Pointe Advisors, LLC | 9.826 | -1,08 | 658 | -20,91 | ||||
| 2026-02-13 | 13F | Panagora Asset Management Inc | 68.351 | 4.580 | ||||||
| 2026-04-23 | 13F | West Bancorporation Inc | 4.299 | 0,00 | 254 | -12,15 | ||||
| 2026-02-11 | 13F | Twin Tree Management, LP | Call | 142.300 | -45,60 | 9.536 | -56,51 | |||
| 2026-02-11 | 13F | Twin Tree Management, LP | Put | 310.800 | -0,70 | 20.827 | -20,61 | |||
| 2026-02-11 | 13F | Twin Tree Management, LP | 16.241 | -41,26 | 1.088 | -53,04 | ||||
| 2026-02-17 | 13F | Bank Of America Corp /de/ | 1.217.782 | 18,03 | 81.604 | -5,63 | ||||
| 2026-04-30 | 13F | ASR Vermogensbeheer N.V. | 39.719 | 1,97 | 2.345 | -10,15 | ||||
| 2026-02-13 | 13F | Manufacturers Life Insurance Company, The | 174.508 | -3,46 | 11.696 | -22,79 | ||||
| 2026-02-17 | 13F | Sagewood Asset Management LP | 6.145 | 412 | ||||||
| 2026-01-20 | 13F | Ascent Group, LLC | 7.538 | 4,16 | 505 | -16,67 | ||||
| 2026-01-30 | 13F | Camden Capital, LLC | 6.897 | 57,86 | 462 | 26,23 | ||||
| 2026-02-17 | 13F | Qube Research & Technologies Ltd | 122.666 | -59,93 | 8.220 | -67,97 | ||||
| 2026-04-20 | 13F | Dagco, Inc. | 0 | -100,00 | 0 | |||||
| 2026-04-14 | 13F | Drive Wealth Management, Llc | 0 | -100,00 | 0 | -100,00 | ||||
| 2026-02-12 | 13F | Hollencrest Capital Management | 30 | 2 | ||||||
| 2026-04-29 | 13F | Oregon Public Employees Retirement Fund | 64.261 | 3,55 | 3.794 | -8,78 | ||||
| 2026-04-08 | 13F | Grove Bank & Trust | 0 | -100,00 | 0 | -100,00 | ||||
| 2026-01-23 | 13F | LOM Asset Management Ltd | 1.200 | 0,00 | 80 | -20,79 | ||||
| 2026-04-13 | 13F | St Germain D J Co Inc | 0 | -100,00 | 0 | -100,00 | ||||
| 2026-02-10 | 13F | Bnp Paribas Arbitrage, Sa | 279.859 | 92,61 | 18.753 | 54,00 | ||||
| 2026-02-04 | 13F | Meridian Wealth Management, LLC | 14.102 | 945 | ||||||
| 2026-02-17 | 13F | Crosslink Capital Inc | 482.845 | -32,96 | 32.355 | -46,40 | ||||
| 2026-02-06 | 13F | HighTower Advisors, LLC | 38.931 | -1,79 | 2.609 | -21,49 | ||||
| 2026-04-27 | 13F | Asahi Life Asset Management Co., Ltd. | 0 | -100,00 | 0 | |||||
| 2026-04-13 | 13F | Robinhood Asset Management, LLC | 0 | -100,00 | 0 | -100,00 | ||||
| 2026-02-11 | 13F | Waddell & Associates, Llc | 3.460 | 34,89 | 232 | 7,94 | ||||
| 2026-02-17 | 13F | T. Rowe Price Investment Management, Inc. | 3.706.136 | -47,72 | 248 | -58,25 | ||||
| 2026-02-12 | 13F | Ci Investments Inc. | 0 | -100,00 | 0 | |||||
| 2026-02-06 | 13F | EverSource Wealth Advisors, LLC | 4.317 | 14,03 | 289 | -8,83 | ||||
| 2026-04-14 | 13F | Congress Asset Management Co /ma | 218.533 | -76,43 | 12.902 | -79,24 | ||||
| 2025-11-07 | 13F | Atticus Wealth Management, Llc | 0 | -100,00 | 0 | |||||
| 2026-02-10 | 13F | REAP Financial Group, LLC | 457 | -32,20 | 31 | -46,43 | ||||
| 2026-01-14 | 13F | Hennion & Walsh Asset Management, Inc. | 44.575 | 12,92 | 2.987 | -9,73 | ||||
| 2026-02-12 | 13F | Jane Street Group, Llc | 406.630 | -4,08 | 27.248 | -23,30 | ||||
| 2026-02-12 | 13F | Jane Street Group, Llc | Call | 472.800 | 37,16 | 31.682 | 9,67 | |||
| 2026-01-22 | 13F | Evermay Wealth Management Llc | 1.000 | 0,00 | 67 | -19,28 | ||||
| 2026-02-12 | 13F | Jane Street Group, Llc | Put | 122.900 | 25,28 | 8.236 | 0,17 | |||
| 2026-04-28 | 13F | Corbyn Investment Management Inc/md | 13.582 | 2,20 | 802 | -10,00 | ||||
| 2026-02-03 | 13F | We Are One Seven, LLC | 7.464 | -6,76 | 500 | -25,37 | ||||
| 2026-05-01 | 13F | Thrivent Financial For Lutherans | 70.671 | 0,52 | 4 | 0,00 | ||||
| 2026-02-17 | 13F | RMB Capital Management, LLC | 161.727 | 6,36 | 10.837 | -14,96 | ||||
| 2026-04-30 | 13F | Valued Wealth Advisors LLC | 116 | -11,45 | 7 | -25,00 | ||||
| 2026-01-23 | 13F | Optima Capital Llc | 21 | 1 | ||||||
| 2026-02-17 | 13F | Sender Co & Partners, Inc. | Call | 0 | -100,00 | 0 | ||||
| 2026-02-11 | 13F | Krane Funds Advisors LLC | 13.915 | -25,48 | 932 | -45,56 | ||||
| 2026-02-17 | 13F | Sender Co & Partners, Inc. | Put | 0 | -100,00 | 0 | ||||
| 2026-02-13 | 13F | Charles Schwab Investment Management Inc | 1.228.081 | 0,73 | 82.294 | -19,47 | ||||
| 2026-03-12 | 13F/A | Peak6 Llc | Call | 204.900 | -68,47 | 13.730 | -74,79 | |||
| 2026-02-13 | 13F | Creekside Partners | 0 | -100,00 | 0 | |||||
| 2026-03-12 | 13F/A | Peak6 Llc | 115.295 | 1.205,72 | 7.726 | 943,92 | ||||
| 2025-11-12 | 13F | Portfolio Design Labs, LLC | 0 | -100,00 | 0 | |||||
| 2026-03-12 | 13F/A | Peak6 Llc | Put | 237.900 | -52,07 | 15.942 | -61,67 | |||
| 2025-11-12 | 13F | K.J. Harrison & Partners Inc | 0 | -100,00 | 0 | |||||
| 2026-02-11 | 13F | LPL Financial LLC | 175.987 | 14,81 | 11.793 | -8,20 | ||||
| 2026-02-17 | 13F | DZ BANK AG Deutsche Zentral Genossenschafts Bank, Frankfurt am Main | 0 | -100,00 | 0 | |||||
| 2026-02-12 | 13F | Cooper Capital Advisors LLC | 9.376 | 0,00 | 628 | -20,00 | ||||
| 2026-02-10 | 13F | One Capital Management, LLC | 20.755 | 40,71 | 1.391 | 12,46 | ||||
| 2026-02-10 | 13F | Nelson Capital Management, LLC | 6.286 | -10,02 | 421 | -28,03 | ||||
| 2026-02-11 | 13F | Clearbridge Investments, LLC | 713.951 | 1,92 | 47.842 | -18,51 | ||||
| 2026-02-12 | 13F | Federation des caisses Desjardins du Quebec | 47.306 | 12,10 | 3.170 | -10,38 | ||||
| 2026-02-10 | 13F | Operose Advisors LLC | 1.791 | 120 | ||||||
| 2026-02-17 | 13F | SageView Advisory Group, LLC | 779 | 52 | ||||||
| 2026-02-13 | 13F | Morgan Stanley | 2.456.541 | -8,72 | 164.613 | -27,02 | ||||
| 2026-02-17 | 13F | Polar Capital Holdings Plc | 1.491.444 | -47,32 | 99.942 | -57,88 | ||||
| 2026-01-14 | 13F | Cypress Wealth Services, LLC | 0 | -100,00 | 0 | |||||
| 2026-02-13 | 13F | Aigen Investment Management, Lp | 0 | -100,00 | 0 | |||||
| 2026-04-23 | 13F | Private Wealth Management Group, LLC | 173 | 34,11 | 10 | 25,00 | ||||
| 2026-04-24 | 13F | Raiffeisen Bank International AG | 370.670 | -6,28 | 21.124 | -21,21 | ||||
| 2026-04-16 | 13F | Davis Capital Management | 3 | -25,00 | 0 | |||||
| 2026-02-06 | 13F | Tortoise Investment Management, LLC | 0 | -100,00 | 0 | |||||
| 2026-02-12 | 13F | Steward Partners Investment Advisory, Llc | 8.255 | 12,21 | 553 | -10,23 | ||||
| 2025-11-13 | 13F | Glenmede Investment Management, LP | 22.748 | -50,87 | 1.907 | -28,51 | ||||
| 2025-11-14 | 13F | First Commonwealth Financial Corp /pa/ | 3.200 | -8,57 | 268 | 33,33 | ||||
| 2026-02-17 | 13F | Prosperity Bancshares Inc | 600 | 40 | ||||||
| 2026-04-24 | 13F | Private Advisor Group, LLC | 7.632 | -34,91 | 451 | -42,68 | ||||
| 2026-04-13 | 13F | Hm Payson & Co | 7.500 | 0,00 | 443 | -11,95 | ||||
| 2026-04-29 | 13F | Skopos Labs, Inc. | 21.260 | 12,17 | 1.255 | -3,16 | ||||
| 2026-02-10 | 13F | Sivia Capital Partners, LLC | 4.363 | 40,20 | 292 | 12,31 | ||||
| 2026-04-23 | 13F | Impact Partnership Wealth, LLC | 0 | -100,00 | 0 | |||||
| 2026-05-01 | 13F | HFM Investment Advisors, LLC | 9 | -75,00 | 1 | -100,00 | ||||
| 2025-11-14 | 13F | Menard Financial Group LLC | 0 | -100,00 | 0 | -100,00 | ||||
| 2026-05-01 | 13F | Midwest Trust Co | 3.759 | 222 | ||||||
| 2026-02-13 | 13F | Korea Investment CORP | 246.255 | 1,44 | 16.502 | -18,89 | ||||
| 2026-02-12 | 13F | Campbell & CO Investment Adviser LLC | 33.208 | 26,85 | 2.225 | 1,41 | ||||
| 2026-01-29 | 13F | Northern Oak Wealth Management Inc | 15.910 | -3,28 | 1.066 | -22,64 | ||||
| 2026-02-13 | 13F | Landscape Capital Management, L.l.c. | 0 | -100,00 | 0 | |||||
| 2026-02-12 | 13F | CIBC Private Wealth Group, LLC | 6.589 | 20,68 | 442 | -3,50 | ||||
| 2026-02-13 | 13F | Natixis | 17.299 | 106,78 | 1.159 | 65,34 | ||||
| 2026-04-20 | 13F | State of Alaska, Department of Revenue | 31.042 | 0,98 | 2 | -50,00 | ||||
| 2026-04-23 | 13F | Farmers & Merchants Investments Inc | 270 | 0,00 | 16 | -16,67 | ||||
| 2026-03-02 | 13F | Reflection Asset Management | 483 | 32 | ||||||
| 2026-02-11 | 13F | Ramirez Asset Management, Inc. | 700 | 0,00 | 47 | -20,69 | ||||
| 2026-01-08 | 13F | Nordea Investment Management Ab | 267.502 | 7,05 | 17.990 | -12,87 | ||||
| 2026-02-17 | 13F | Susquehanna International Group, Llp | 54.203 | -78,17 | 3.632 | -82,55 | ||||
| 2026-02-17 | 13F | Susquehanna International Group, Llp | Put | 573.400 | 16,66 | 38.424 | -6,72 | |||
| 2026-02-13 | 13F | Vontobel Holding Ltd. | 3.489 | -11,20 | 234 | -29,18 | ||||
| 2026-02-17 | 13F | Artisan Partners Limited Partnership | 1.947.504 | -36,73 | 130.502 | -49,41 | ||||
| 2026-04-29 | 13F | Swedbank AB | 254.152 | 0,56 | 15.005 | -11,40 | ||||
| 2026-02-13 | 13F | Treasurer of the State of North Carolina | 130.130 | -6,81 | 9 | -27,27 | ||||
| 2026-04-07 | 13F | Signaturefd, Llc | 4.763 | 3,63 | 281 | -8,47 | ||||
| 2026-04-30 | 13F | Elevated Capital Advisors, LLC | 671 | 40 | ||||||
| 2026-02-17 | 13F | Summit Trail Advisors, Llc | 27.591 | 114,57 | 1.849 | 71,59 | ||||
| 2025-11-14 | 13F | Wolverine Trading, Llc | 0 | -100,00 | 0 | -100,00 | ||||
| 2026-04-15 | 13F | Radnor Capital Management, LLC | 36.551 | -0,31 | 2.158 | -12,17 | ||||
| 2026-02-17 | 13F | Susquehanna International Group, Llp | Call | 1.014.200 | 24,15 | 67.962 | -0,73 | |||
| 2026-04-30 | 13F | BRYN MAWR TRUST Co | 9.222 | -4,15 | 544 | -15,53 | ||||
| 2026-04-10 | 13F | Marshall Financial Group LLC | 8.345 | -21,05 | 493 | -30,51 | ||||
| 2026-01-29 | 13F | Concurrent Investment Advisors, LLC | 8.736 | 9,39 | 585 | -12,56 | ||||
| 2026-02-13 | 13F | Arrowstreet Capital, Limited Partnership | 3.994.727 | -0,82 | 267.687 | -20,70 | ||||
| 2026-04-28 | 13F | Stephens Investment Management Group LLC | 1.081.700 | -0,48 | 63.864 | -12,31 | ||||
| 2026-02-17 | 13F | United Capital Financial Advisers, Llc | 25.594 | -4,87 | 1.715 | -23,91 | ||||
| 2026-04-30 | 13F | Cedar Mountain Advisors, LLC | 16 | 0,00 | 1 | -100,00 | ||||
| 2026-04-17 | 13F | Anchyra Partners Llc | 4.304 | 254 | ||||||
| 2026-02-13 | 13F | American Century Companies Inc | 675.206 | -13,91 | 45.246 | -31,17 | ||||
| 2026-01-15 | 13F | Retireful, LLC | 0 | -100,00 | 0 | |||||
| 2026-02-17 | 13F | Sherbrooke Park Advisers Llc | 4.171 | 279 | ||||||
| 2026-02-17 | 13F | Raymond James Financial Inc | 501.558 | 8,22 | 33.609 | -13,47 | ||||
| 2026-04-10 | 13F | Linden Thomas Advisory Services, LLC | 53.278 | 107,11 | 3.146 | 82,53 | ||||
| 2026-02-11 | 13F | West Family Investments, Inc. | 0 | -100,00 | 0 | -100,00 | ||||
| 2026-02-13 | 13F | Lord, Abbett & Co. Llc | 74.350 | 1,85 | 5 | -33,33 | ||||
| 2026-04-08 | 13F | NorthCrest Asset Manangement, LLC | 4.566 | 7,16 | 285 | -3,72 | ||||
| 2026-02-04 | 13F | Atlantic Union Bankshares Corp | 250 | 31,58 | 17 | 6,67 | ||||
| 2026-02-09 | 13F | Hartland & Co., LLC | 1.240 | 29,71 | 83 | 3,75 | ||||
| 2026-02-05 | 13F | Qsemble Capital Management, LP | 0 | -100,00 | 0 | -100,00 | ||||
| 2026-02-17 | 13F | Sciencast Management LP | 40.291 | 2.700 | ||||||
| 2026-01-27 | 13F | BankPlus Trust Department | 21 | 0,00 | 1 | 0,00 | ||||
| 2026-01-29 | 13F | State Of Michigan Retirement System | 73.800 | -0,14 | 4.945 | -20,15 | ||||
| 2026-04-23 | 13F | CWM Advisors, LLC | 41.391 | 2,17 | 2.444 | -9,99 | ||||
| 2026-04-30 | 13F | Lecap Asset Management Ltd | 4.983 | 294 | ||||||
| 2026-02-10 | 13F | Glassy Mountain Advisors, Inc. | 43.381 | 4,85 | 2.907 | -16,18 | ||||
| 2025-11-14 | 13F | Weiss Asset Management LP | 136.323 | 11.425 | ||||||
| 2026-02-10 | 13F | Nomura Asset Management Co Ltd | 99.210 | 7,13 | 6.648 | -14,34 | ||||
| 2026-02-04 | 13F | Valeo Financial Advisors, LLC | 3.449 | 2,59 | 231 | -17,79 | ||||
| 2026-02-12 | 13F | StoneX Group Inc. | 7.099 | 18,75 | 476 | -5,19 | ||||
| 2026-01-23 | 13F | Diversify Advisory Services, LLC | 4.581 | -71,98 | 334 | -79,33 | ||||
| 2026-02-17 | 13F | Wiley Bros.-aintree Capital, Llc | 18.647 | 3,12 | 1.250 | -17,05 | ||||
| 2026-04-09 | 13F | Nelson, Van Denburg & Campbell Wealth Management Group, LLC | 5.117 | -5,71 | 302 | -16,80 | ||||
| 2026-04-27 | 13F | Board of the Pension Protection Fund | 2.200 | 340,00 | 130 | 290,91 | ||||
| 2026-04-13 | 13F | Massmutual Trust Co Fsb/adv | 5.250 | -4,35 | 310 | -15,80 | ||||
| 2026-01-23 | 13F | Transcend Wealth Collective, Llc | 3.334 | 6,62 | 223 | -14,89 | ||||
| 2026-02-11 | 13F | Group One Trading, L.p. | Call | 128.600 | 12,31 | 8.617 | -10,20 | |||
| 2026-02-11 | 13F | Group One Trading, L.p. | Put | 57.700 | 12,04 | 3.866 | -10,43 | |||
| 2026-02-12 | 13F | Voya Investment Management Llc | 186.377 | -28,84 | 12.489 | -43,10 | ||||
| 2026-02-12 | 13F | Founders Financial Alliance, LLC | 0 | -100,00 | 0 | |||||
| 2026-02-17 | 13F | Parallax Volatility Advisers, L.P. | Call | 1.700 | 114 | |||||
| 2026-04-23 | 13F | Oppenheimer & Co Inc | 5.257 | -4,90 | 310 | -16,22 | ||||
| 2026-02-17 | 13F | Parallax Volatility Advisers, L.P. | Put | 2.400 | 161 | |||||
| 2026-02-06 | 13F | Cullen/frost Bankers, Inc. | 210 | -10,26 | 14 | -26,32 | ||||
| 2026-02-11 | 13F | BIT Capital GmbH | 168.329 | 11.280 | ||||||
| 2026-02-17 | 13F | Parallax Volatility Advisers, L.P. | 2.326 | -71,63 | 156 | -77,44 | ||||
| 2026-01-30 | 13F | Sigma Planning Corp | 6.548 | 6,02 | 439 | -15,28 | ||||
| 2026-02-11 | 13F | Cookson Peirce & Co Inc | 0 | -100,00 | 0 | |||||
| 2026-02-11 | 13F | Metis Global Partners, LLC | 3.199 | -8,52 | 214 | -26,96 | ||||
| 2026-01-23 | 13F | Legacy Bridge, LLC | 225 | 0,00 | 15 | -16,67 | ||||
| 2026-02-10 | 13F | Principia Wealth Advisory, LLC | 11 | 37,50 | 1 | |||||
| 2026-02-17 | 13F | Ameriprise Financial Inc | 769.222 | -15,52 | 51.544 | -32,79 | ||||
| 2026-01-28 | 13F | Cornerstone Advisory, LLC | 4.045 | -11,20 | 271 | -28,87 | ||||
| 2025-11-03 | 13F | Townsquare Capital Llc | 0 | -100,00 | 0 | -100,00 | ||||
| 2026-02-17 | 13F | Nomura Holdings Inc | 19.677 | 115,69 | 1.319 | 72,51 | ||||
| 2026-01-29 | 13F | Teachers Retirement System Of The State Of Kentucky | 95.760 | 1,27 | 6 | -14,29 | ||||
| 2026-02-03 | 13F | Bokf, Na | 54.171 | -15,15 | 3.630 | -32,18 | ||||
| 2026-04-29 | 13F | Greenwood Capital Associates Llc | 82.029 | 4.843 | ||||||
| 2026-02-04 | 13F | Swiss Life Asset Management Ltd | 37.545 | 2,86 | 2.516 | -17,78 | ||||
| 2026-02-13 | 13F | Greenline Wealth Management LLC | 482 | 32 | ||||||
| 2026-02-13 | 13F | Prudential Financial Inc | 27.368 | -91,47 | 1.834 | -93,18 | ||||
| 2026-04-24 | 13F | CHICAGO TRUST Co NA | 7.900 | 9,72 | 466 | -3,32 | ||||
| 2026-02-13 | 13F | Dai-Ichi Life Insurance Company, Ltd | 13.764 | 0,00 | 922 | -20,03 | ||||
| 2026-02-13 | 13F | Quarry LP | 0 | -100,00 | 0 | |||||
| 2026-05-01 | 13F | Diversify Wealth Management, Llc | 3.831 | 269 | ||||||
| 2026-02-09 | 13F | Shufro Rose & Co Llc | 58.550 | -5,56 | 3.923 | 42,97 | ||||
| 2026-02-12 | 13F | New York State Common Retirement Fund | 168.754 | 0,00 | 11.308 | -20,05 | ||||
| 2026-04-23 | 13F | First Pacific Financial | 123 | 66,22 | 7 | 75,00 | ||||
| 2026-02-12 | 13F | Jasper Ridge Partners, L.P. | 85.086 | 0,00 | 5.702 | -20,05 | ||||
| 2026-02-17 | 13F | DV Trading LLC | 389 | 26 | ||||||
| 2026-04-27 | 13F | Mosley Wealth Management | 10 | 1 | ||||||
| 2026-05-01 | 13F | International Assets Investment Management, Llc | 0 | -100,00 | 0 | |||||
| 2026-02-12 | 13F | Polen Capital Management Llc | 0 | -100,00 | 0 | |||||
| 2026-02-09 | 13F | William Blair Investment Management, Llc | 3.742.928 | -19,80 | 250.814 | -35,88 | ||||
| 2026-05-01 | 13F | Mountain Hill Investment Partners Corp. | 169.200 | 59,92 | 9.990 | 40,91 | ||||
| 2026-02-18 | 13F | GWM Advisors LLC | 27.359 | 10,35 | 1.833 | -11,75 | ||||
| 2026-04-24 | 13F | Strs Ohio | 96.923 | 0,09 | 5.722 | -11,82 | ||||
| 2026-02-11 | 13F | Prudential Plc | 19.011 | 0,00 | 1.274 | -20,09 | ||||
| 2026-04-10 | 13F | Oak Thistle LLC | 29.505 | 1.742 | ||||||
| 2026-04-22 | 13F | Spire Wealth Management | 419 | -0,24 | 25 | -14,29 | ||||
| 2026-02-11 | 13F | Parallel Advisors, LLC | 9.120 | -7,38 | 611 | -25,94 | ||||
| 2026-02-13 | 13F | Fieldview Capital Management, LLC | 0 | -100,00 | 0 | |||||
| 2026-04-30 | 13F | Dara Capital Us, Inc. | 1.773 | 7,78 | 105 | -5,45 | ||||
| 2026-02-06 | 13F | Berbice Capital Management LLC | 709 | 0,00 | 48 | -20,34 | ||||
| 2026-04-10 | 13F | Perigon Wealth Management, LLC | 0 | -100,00 | 0 | -100,00 | ||||
| 2026-04-27 | 13F | Y-Intercept (Hong Kong) Ltd | 0 | -100,00 | 0 | |||||
| 2026-02-17 | 13F | Delaware Management Holdings, Inc. | 115.934 | 7.769 | ||||||
| 2026-02-04 | 13F | HighPoint Advisor Group LLC | 3.749 | -8,61 | 251 | -26,82 | ||||
| 2026-01-27 | 13F | Zurcher Kantonalbank (Zurich Cantonalbank) | 170.250 | -4,12 | 11.408 | -23,34 | ||||
| 2026-02-17 | 13F | Warren Averett Asset Management, LLC | 7.607 | 9,69 | 510 | -12,39 | ||||
| 2026-02-17 | 13F | Vinva Investment Management Ltd | 215.284 | 55,45 | 14.594 | 26,87 | ||||
| 2026-04-13 | 13F | Bank of New Hampshire | 14.620 | 863 | ||||||
| 2026-02-17 | 13F | Tcw Group Inc | 4.829 | 324 | ||||||
| 2026-02-11 | 13F | Westfield Capital Management Co Lp | 1.520.219 | -13,21 | 101.870 | -30,61 | ||||
| 2025-11-14 | 13F | Granahan Investment Management Inc/ma | 0 | -100,00 | 0 | |||||
| 2026-04-28 | 13F | Handelsbanken Fonder AB | 94.753 | 0,00 | 6 | -16,67 | ||||
| 2026-02-10 | 13F | Kesler, Norman & Wride, LLC | 9.923 | 665 | ||||||
| 2026-02-17 | 13F | Occudo Quantitative Strategies Lp | 0 | -100,00 | 0 | |||||
| 2026-02-17 | 13F | HighVista Strategies LLC | 17.409 | -14,66 | 1.167 | -31,77 | ||||
| 2026-04-24 | 13F | IFM Investors Pty Ltd | 74.730 | 7,05 | 4.412 | 110.200,00 | ||||
| 2026-02-10 | 13F | Eurizon Capital SGR S.p.A. | 27.622 | 1.852 | ||||||
| 2026-02-11 | 13F | MCF Advisors LLC | 92 | 0,00 | 6 | -14,29 | ||||
| 2026-02-11 | 13F | CLARET ASSET MANAGEMENT Corp | 4.131 | -0,24 | 0 | |||||
| 2025-11-14 | 13F | ISAM Funds (UK) Ltd | 0 | -100,00 | 0 | |||||
| 2026-04-17 | 13F | Hanson & Doremus Investment Management | 100 | 0 | ||||||
| 2026-02-09 | 13F | Keating Financial Advisory Services, Inc. | 2.158 | 145 | ||||||
| 2026-04-27 | 13F | Truist Financial Corp | 30.742 | -13,38 | 1.815 | -23,68 | ||||
| 2026-02-12 | 13F | Advisors Asset Management, Inc. | 21.252 | 1,91 | 1.424 | -18,49 | ||||
| 2026-02-12 | 13F | Skandinaviska Enskilda Banken AB (publ) | 301.887 | 30,63 | 20.229 | 4,45 | ||||
| 2026-02-05 | 13F | Elyxium Wealth, LLC | 17 | 1 | ||||||
| 2026-04-13 | 13F | Mather Group, Llc. | 211 | 12 | ||||||
| 2026-01-27 | 13F | Regions Financial Corp | 40.522 | 0,58 | 2.715 | -19,58 | ||||
| 2026-01-23 | 13F | Inlight Wealth Management, LLC | 82 | 0,00 | 5 | -16,67 | ||||
| 2026-02-13 | 13F | Cornerstone Financial Management LLC | 27 | 2 | ||||||
| 2026-02-18 | 13F | First Citizens Bank & Trust Co | 8.457 | -2,12 | 567 | -21,82 | ||||
| 2026-02-13 | 13F | AlTi Global, Inc. | 29.935 | -0,32 | 2.006 | -20,31 | ||||
| 2026-02-09 | 13F | Fisher Asset Management, LLC | 301.756 | 320,38 | 20.221 | 236,16 | ||||
| 2026-02-17 | 13F | EFG International AG | 108.706 | 7.286 | ||||||
| 2026-02-17 | 13F | Two Sigma Investments, Lp | 700.678 | 5.992,85 | 46.952 | 4.775,60 | ||||
| 2026-04-08 | 13F | TrimTabs Asset Management, LLC | 0 | -100,00 | 0 | -100,00 | ||||
| 2026-04-24 | 13F | Yousif Capital Management, Llc | 93.027 | -4,32 | 5.492 | -19,37 | ||||
| 2026-02-13 | 13F | Brown Advisory Inc | 105.414 | 32,93 | 7.064 | 6,27 | ||||
| 2026-02-12 | 13F | California Public Employees Retirement System | 542.116 | -1,50 | 36.327 | -21,24 | ||||
| 2026-04-28 | 13F | Raleigh Capital Management Inc. | 328 | -16,33 | 19 | -26,92 | ||||
| 2026-02-03 | 13F | Harel Insurance Investments & Financial Services Ltd. | 10.000 | -88,28 | 1 | -100,00 | ||||
| 2026-02-04 | 13F | Pacer Advisors, Inc. | 0 | -100,00 | 0 | -100,00 | ||||
| 2026-02-13 | 13F | Aviso Financial Inc. | 0 | -100,00 | 0 | |||||
| 2026-02-13 | 13F | Edgestream Partners, L.P. | 0 | -100,00 | 0 | |||||
| 2026-04-28 | 13F | Bogart Wealth, LLC | 23 | 9,52 | 1 | 0,00 | ||||
| 2026-04-20 | 13F | Moody Aldrich Partners Llc | 3.438 | -2,16 | 203 | -14,04 | ||||
| 2026-02-13 | 13F | Ieq Capital, Llc | 207.081 | 47,21 | 13.876 | 17,70 | ||||
| 2026-02-11 | 13F | ARK Investment Management LLC | 398.100 | 14,70 | 26.677 | -8,30 | ||||
| 2026-02-09 | 13F | Integrity Alliance, Llc. | 8.818 | 591 | ||||||
| 2026-04-29 | 13F | Envestnet Portfolio Solutions, Inc. | 10.903 | -15,45 | 644 | -25,58 | ||||
| 2026-04-30 | 13F | Torren Management, LLC | 32 | 0,00 | 2 | -50,00 | ||||
| 2026-02-12 | 13F | South Dakota Investment Council | 27.765 | -54,88 | 2 | -80,00 | ||||
| 2026-04-15 | 13F | Exchange Traded Concepts, Llc | 176.756 | 88,44 | 10.436 | 66,03 | ||||
| 2026-02-17 | 13F | Cetera Investment Advisers | 93.083 | 0,35 | 6.237 | -19,77 | ||||
| 2026-02-17 | 13F | Cetera Investment Advisers | Call | 1.000 | 1 | |||||
| 2026-02-17 | 13F | Royal Bank Of Canada | 1.315.893 | 31,99 | 88.178 | 5,53 | ||||
| 2026-02-10 | 13F | Ellevest, Inc. | 3.000 | 201 | ||||||
| 2026-02-13 | 13F | Victory Capital Management Inc | 3.121.252 | 21,32 | 209.155 | 3,25 | ||||
| 2026-04-27 | 13F | Sierra Summit Advisors Llc | 6.097 | 37,88 | 360 | 21,28 | ||||
| 2026-02-17 | 13F | Lighthouse Investment Partners, LLC | 8.413 | 564 | ||||||
| 2026-01-29 | 13F | Quest 10 Wealth Builders, Inc. | 18 | 1 | ||||||
| 2026-04-07 | 13F | Comprehensive Financial Planning, Inc./PA | 1 | 0,00 | 0 | |||||
| 2026-02-13 | 13F | Sienna Gestion | 101.038 | -14,12 | 6.815 | -24,19 | ||||
| 2026-02-13 | 13F | Resources Investment Advisors, LLC. | 5.694 | 18,92 | 382 | -4,99 | ||||
| 2025-11-14 | 13F | Wetherby Asset Management Inc | 10.416 | 0,70 | 873 | 46,55 | ||||
| 2026-04-27 | 13F | New York State Teachers Retirement System | 283.492 | -4,47 | 17 | -15,79 | ||||
| 2026-02-09 | 13F | Quest Partners LLC | 622 | -6,89 | 42 | -25,45 | ||||
| 2026-04-10 | 13F | Country Trust Bank | 119 | 7 | ||||||
| 2026-02-03 | 13F | Generali Asset Management SPA SGR | 0 | -100,00 | 0 | |||||
| 2026-04-27 | 13F | HB Wealth Management, LLC | 12.897 | 18,07 | 761 | 4,10 | ||||
| 2026-02-17 | 13F | Advisory Services Network, LLC | 21.558 | 64,06 | 1.445 | 31,15 | ||||
| 2025-11-14 | 13F | Texas Permanent School Fund | 0 | -100,00 | 0 | |||||
| 2026-02-13 | 13F | Ossiam | 4.999 | -33,47 | 335 | -46,90 | ||||
| 2026-02-17 | 13F | Glenmede Trust Co Na | 24.671 | -86,50 | 1.653 | -79,56 | ||||
| 2026-02-11 | 13F | Commonwealth Retirement Investments LLC | 100 | 7 | ||||||
| 2026-02-11 | 13F | Franklin Resources Inc | 3.007.431 | 28,50 | 201.528 | 2,74 | ||||
| 2026-02-17 | 13F | Quantitative Investment Management, LLC | 33.311 | 2 | ||||||
| 2026-04-27 | 13F | Argos Wealth Advisors, LLC | 14.984 | -7,21 | 885 | -18,30 | ||||
| 2026-02-17 | 13F | Polymer Capital Management (US) LLC | 11.896 | 797 | ||||||
| 2025-11-14 | 13F | Royal Bank Of Canada | Call | 0 | -100,00 | 0 | -100,00 | |||
| 2026-02-03 | 13F | F/M Investments LLC | 4.443 | -16,04 | 298 | -32,96 | ||||
| 2026-04-09 | 13F | Cliftonlarsonallen Wealth Advisors, Llc | 13.142 | 776 | ||||||
| 2026-04-27 | 13F | Td Private Client Wealth Llc | 25 | 47,06 | 1 | 0,00 | ||||
| 2026-01-29 | 13F | UBS Group AG | Put | 290.300 | 13,71 | 19.453 | -9,08 | |||
| 2026-02-12 | 13F | State Board Of Administration Of Florida Retirement System | 282.199 | -0,56 | 18.910 | -20,50 | ||||
| 2026-02-12 | 13F | Cloud Capital Management, LLC | 0 | -100,00 | 0 | |||||
| 2026-02-13 | 13F | Great West Life Assurance Co /can/ | 224.348 | -0,83 | 15 | -16,67 | ||||
| 2026-02-17 | 13F | Nissay Asset Management Corp /japan/ /adv | 39.915 | 1,89 | 2.675 | -18,55 | ||||
| 2026-02-12 | 13F | Turiya Advisors Asia Ltd | 1.000.000 | 67.010 | ||||||
| 2026-04-30 | 13F | Hsbc Holdings Plc | 163.460 | 27,12 | 9.653 | 11,93 | ||||
| 2026-02-13 | 13F | 1248 Management, LLC | 3.822 | 0,00 | 256 | -20,00 | ||||
| 2026-02-10 | 13F | State of Wyoming | 2.255 | 34,79 | 151 | 7,86 | ||||
| 2026-04-20 | 13F | Assenagon Asset Management S.A. | 90.150 | -26,91 | 5.322 | -35,60 | ||||
| 2026-04-14 | 13F | Zrc Wealth Management, Llc | 0 | -100,00 | 0 | |||||
| 2026-04-28 | 13F | Oversea-Chinese Banking CORP Ltd | 0 | -100,00 | 0 | |||||
| 2026-04-07 | 13F | Retirement Wealth Solutions LLC | 53 | -15,87 | 3 | -25,00 | ||||
| 2026-02-10 | 13F | Dynasty Wealth Management, Llc | 2.995 | 1,70 | 201 | -18,70 | ||||
| 2026-02-11 | 13F | Arrowpoint Investment Partners (Singapore) Pte. Ltd. | 0 | -100,00 | 0 | |||||
| 2026-04-23 | 13F | Bigelow Investment Advisors, LLC | 3.914 | 231 | ||||||
| 2026-04-30 | 13F | Kornitzer Capital Management Inc /ks | 22.000 | 1.299 | ||||||
| 2026-02-04 | 13F | Ameritas Advisory Services, LLC | 0 | -100,00 | 0 | -100,00 | ||||
| 2026-02-17 | 13F | Maryland State Retirement & Pension System | 15.107 | 0,00 | 1.012 | -20,06 | ||||
| 2026-04-23 | 13F | Interchange Capital Partners, LLC | Call | 600 | 6 | |||||
| 2026-04-23 | 13F | Interchange Capital Partners, LLC | 9.118 | 3,86 | 406 | -30,95 | ||||
| 2026-04-29 | 13F | Dsm Capital Partners Llc | 1.174.778 | 69.359 | ||||||
| 2026-02-10 | 13F | Norges Bank | 3.959.514 | 265.327 | ||||||
| 2026-02-11 | 13F | Fox Run Management, L.l.c. | 3.186 | 213 | ||||||
| 2026-02-06 | 13F | Americana Partners, LLC | 0 | -100,00 | 0 | |||||
| 2026-02-17 | 13F | Captrust Financial Advisors | 61.066 | -3,88 | 4.092 | -23,14 | ||||
| 2026-01-22 | 13F | Venturi Wealth Management, LLC | 0 | -100,00 | 0 | -100,00 | ||||
| 2026-02-05 | 13F | Allworth Financial LP | 45.205 | 37,69 | 3.029 | 10,11 | ||||
| 2026-02-09 | 13F | Clearwater Capital Advisors, LLC | 3.671 | -4,10 | 246 | -23,44 | ||||
| 2026-02-17 | 13F | Point72 Asset Management, L.P. | Put | 115.000 | 7.706 | |||||
| 2026-02-12 | 13F | Penserra Capital Management LLC | 1.687 | 0,12 | 0 | |||||
| 2026-02-17 | 13F | Point72 Asset Management, L.P. | Call | 127.800 | 8.564 | |||||
| 2026-02-17 | 13F | Brevan Howard Capital Management LP | 5.336 | -5,57 | 358 | -24,52 | ||||
| 2026-01-22 | 13F | Mechanics Financial Corp | 440 | 0,00 | 29 | -19,44 | ||||
| 2026-04-07 | 13F | CoreCap Advisors, LLC | 735 | 49,69 | 43 | 34,38 | ||||
| 2026-04-09 | 13F | DHJJ Financial Advisors, Ltd. | 250 | 0,00 | 15 | -12,50 | ||||
| 2026-04-17 | 13F | Webster Bank, N. A. | 100 | 0,00 | 6 | -16,67 | ||||
| 2026-04-15 | 13F | Journey Strategic Wealth Llc | 4.679 | 6,34 | 276 | -6,12 | ||||
| 2026-04-28 | 13F | Stephens Inc /ar/ | 6.584 | 13,22 | 389 | -0,26 | ||||
| 2026-02-18 | 13F | Achmea Investment Management B.V. | 22.418 | -62,18 | 2 | -75,00 | ||||
| 2026-05-01 | 13F | Rakuten Securities, Inc. | 208 | -19,07 | 12 | -29,41 | ||||
| 2026-02-04 | 13F | BCJ Capital Management, LLC | 0 | -100,00 | 0 | |||||
| 2026-02-13 | 13F | Plum Street Advisors, LLC | 8.753 | 0,00 | 587 | -20,05 | ||||
| 2026-01-29 | 13F | UBS Group AG | Call | 71.700 | 4.805 | |||||
| 2026-02-12 | 13F | Marex Group plc | 5.484 | 367 | ||||||
| 2026-01-29 | 13F | UBS Group AG | 1.424.159 | 7,15 | 95.433 | -14,33 | ||||
| 2026-01-20 | 13F | SOA Wealth Advisors, LLC. | 10 | 0,00 | 1 | |||||
| 2025-11-07 | 13F | Shell Asset Management Co | 5.317 | -93,50 | 0 | -100,00 | ||||
| 2026-01-13 | 13F | Stephens Consulting, LLC | 50 | 0,00 | 3 | -25,00 | ||||
| 2026-01-21 | 13F | Portside Wealth Group, LLC | 6.110 | -26,51 | 409 | -41,24 | ||||
| 2026-04-15 | 13F | Avanza Fonder AB | 4.861 | 3,18 | 287 | -9,21 | ||||
| 2026-02-12 | 13F | Federated Hermes, Inc. | 1.439.940 | 7,98 | 96.490 | -13,66 | ||||
| 2026-01-26 | 13F | Provenance Wealth Advisors, LLC | 0 | -100,00 | 0 | |||||
| 2026-02-10 | 13F | Peapack Gladstone Financial Corp | 5.543 | 0,00 | 0 | |||||
| 2026-04-06 | 13F | Highline Wealth Partners Llc | 28 | 2 | ||||||
| 2026-02-17 | 13F | Tower Research Capital LLC (TRC) | 11.560 | 14,07 | 775 | -8,83 | ||||
| 2026-02-09 | 13F | Coldstream Capital Management Inc | 6.069 | 7,17 | 407 | -14,35 | ||||
| 2026-04-13 | 13F | Wolff Wiese Magana Llc | 354 | 0,00 | 21 | -13,04 | ||||
| 2026-04-30 | 13F | Cherry Creek Investment Advisors, Inc. | 55.404 | -3,28 | 3.271 | -14,77 | ||||
| 2026-04-17 | 13F | Brown, Lisle/cummings, Inc. | 110 | 0,00 | 6 | -14,29 | ||||
| 2026-04-22 | 13F | Clear Creek Financial Management, LLC | 10.333 | 17,94 | 610 | 3,92 | ||||
| 2026-02-17 | 13F | Woodline Partners LP | 5.753 | 386 | ||||||
| 2026-04-20 | 13F | Louisiana State Employees Retirement System | 90.900 | 5,21 | 5.367 | -7,31 | ||||
| 2026-02-03 | 13F | Crossmark Global Holdings, Inc. | 20.628 | 1,33 | 1.382 | -18,99 | ||||
| 2025-11-07 | 13F | Sierra Ocean, Llc | 0 | -100,00 | 0 | |||||
| 2026-04-21 | 13F | Outfitter Financial LLC | 15.660 | 12,58 | 925 | -0,86 | ||||
| 2026-02-10 | 13F | Semanteon Capital Management, LP | 0 | -100,00 | 0 | -100,00 | ||||
| 2026-02-17 | 13F | Fred Alger Management, Llc | 0 | -100,00 | 0 | |||||
| 2026-02-11 | 13F | Vestcor Inc | 9.834 | 55,48 | 1 | |||||
| 2026-02-17 | 13F | Susquehanna Portfolio Strategies, LLC | 47.223 | 0,00 | 3.164 | -20,04 | ||||
| 2026-02-13 | 13F | Verition Fund Management LLC | 9.113 | -74,15 | 611 | -79,35 | ||||
| 2026-04-20 | 13F | Banque Cantonale Vaudoise | 6.420 | 453,45 | 380 | 387,18 | ||||
| 2026-04-29 | 13F | Taylor Frigon Capital Management LLC | 32.696 | -0,68 | 1.930 | -12,51 | ||||
| 2026-01-23 | 13F | Freestone Capital Holdings, LLC | 7.368 | 0,00 | 494 | -20,10 | ||||
| 2026-04-15 | 13F | Financial Management Professionals, Inc. | 13 | 0,00 | 1 | |||||
| 2026-02-13 | 13F | Verition Fund Management LLC | Put | 14.700 | -23,83 | 985 | -39,08 | |||
| 2026-04-30 | 13F | Kestra Advisory Services, LLC | 21.126 | -27,45 | 1.247 | -36,08 | ||||
| 2026-01-21 | 13F | Prime Capital Investment Advisors, LLC | 0 | -100,00 | 0 | -100,00 | ||||
| 2026-05-01 | 13F | Fifth Third Bancorp | 141.651 | 1.983,41 | 8.363 | 1.738,02 | ||||
| 2026-02-13 | 13F | Entropy Technologies, LP | 17.860 | 500,74 | 1.197 | 380,32 | ||||
| 2026-04-29 | 13F | CVA Family Office, LLC | 577 | 21,99 | 34 | 9,68 | ||||
| 2026-04-29 | 13F | Montag A & Associates Inc | 40 | 0,00 | 2 | 0,00 | ||||
| 2026-01-27 | 13F | TD Waterhouse Canada Inc. | 17.884 | 381,01 | 1.198 | 276,73 | ||||
| 2026-02-09 | 13F | Frazier Financial Advisors, LLC | 59 | 0,00 | 4 | -25,00 | ||||
| 2026-01-30 | 13F | Archer Investment Corp | 2.819 | 0,00 | 189 | -20,34 | ||||
| 2026-02-05 | 13F | Northwestern Mutual Investment Management Company, Llc | 69.853 | 0,93 | 4.681 | -19,31 | ||||
| 2026-04-29 | 13F | Klp Kapitalforvaltning As | 169.400 | 6,61 | 10.001 | -6,07 | ||||
| 2026-04-24 | 13F | Essex LLC | 0 | -100,00 | 0 | |||||
| 2026-02-11 | 13F | Meeder Advisory Services, Inc. | 9.543 | 639 | ||||||
| 2026-04-13 | 13F | IFP Advisors, Inc | 8.931 | -5,52 | 527 | -16,75 | ||||
| 2026-02-13 | 13F | Towarzystwo Funduszy Inwestycyjnych Pzu Sa | 0 | -100,00 | 0 | |||||
| 2026-02-17 | 13F | Toronto Dominion Bank | 194.319 | 284,30 | 13.021 | 207,32 | ||||
| 2026-02-17 | 13F | Liontrust Investment Partners LLP | 102.283 | 17,31 | 6.854 | -6,21 | ||||
| 2026-04-06 | 13F | GAMMA Investing LLC | 7.386 | 6,46 | 436 | -6,03 | ||||
| 2026-02-12 | 13F | Renaissance Technologies Llc | 3.757.034 | -1,97 | 251.759 | -21,62 | ||||
| 2026-02-17 | 13F | Point72 Asset Management, L.P. | 0 | -100,00 | 0 | |||||
| 2026-02-10 | 13F | Bank of New York Mellon Corp | 2.151.520 | -9,40 | 144.173 | -27,56 | ||||
| 2026-02-10 | 13F | Fideuram Asset Management (Ireland) dac | 54 | 4 | ||||||
| 2026-02-19 | 13F | Mcguire Capital Advisors Inc | 17 | 1 | ||||||
| 2026-02-17 | 13F | KCM Capital Inc | 16.737 | 1.122 | ||||||
| 2025-11-14 | 13F | Concentric Capital Strategies, LP | 0 | -100,00 | 0 | |||||
| 2026-01-27 | 13F | Graphene Investments SAS | 40.800 | 31,19 | 2.734 | 4,91 | ||||
| 2026-02-09 | 13F | Kestra Investment Management, LLC | 18.046 | 1,55 | 1.209 | -18,80 | ||||
| 2026-02-13 | 13F | Thornburg Investment Management Inc | 193.748 | -15,04 | 12.983 | -32,07 | ||||
| 2026-05-01 | 13F | Anchor Investment Management, LLC | 40 | 0,00 | 2 | 0,00 | ||||
| 2026-02-19 | 13F | Evansbrook LLC | 5.078 | 340 | ||||||
| 2026-02-17 | 13F | Signature Equity Partners, LLC | 321 | 22 | ||||||
| 2026-04-20 | 13F | MBM Wealth Consultants, LLC | 12.146 | 6,82 | 717 | -5,78 | ||||
| 2026-02-09 | 13F | Geode Capital Management, Llc | 7.716.158 | 2,76 | 515.972 | -17,83 | ||||
| 2026-05-01 | 13F | Royal London Asset Management Ltd | 146.393 | 0,23 | 8.643 | -11,69 | ||||
| 2026-02-11 | 13F | Illinois Municipal Retirement Fund | 60.251 | -8,16 | 4.037 | -26,57 | ||||
| 2026-02-17 | 13F | Gotham Asset Management, LLC | 38.344 | -9,28 | 2.569 | -27,47 | ||||
| 2026-04-21 | 13F | Pallas Capital Advisors LLC | 10.853 | -0,28 | 641 | -12,21 | ||||
| 2026-04-28 | 13F | ORG Wealth Partners, LLC | 50 | 0,00 | 3 | -33,33 | ||||
| 2026-02-11 | 13F | Coastwise Capital Group, LLC | 0 | -100,00 | 0 | |||||
| 2026-02-12 | 13F | Counterpoint Mutual Funds LLC | 0 | -100,00 | 0 | |||||
| 2026-04-16 | 13F | Triad Wealth Partners, LLC | 5.795 | -0,21 | 342 | -12,08 | ||||
| 2026-02-19 | 13F | Atomi Financial Group, Inc. | 0 | -100,00 | 0 | -100,00 | ||||
| 2026-04-24 | 13F | Profund Advisors Llc | 7.846 | 12,57 | 463 | -0,86 | ||||
| 2026-02-17 | 13F | Altshuler Shaham Ltd | 140 | 9 | ||||||
| 2026-02-11 | 13F | Financiere des Professionnels - Fonds d,investissement inc. | 3.565 | -34,99 | 239 | -48,15 | ||||
| 2026-04-27 | 13F | Fjarde Ap-fonden /fourth Swedish National Pension Fund | 97.400 | 36,03 | 5.750 | 19,87 | ||||
| 2026-02-05 | 13F | Center for Financial Planning, Inc. | 170 | 0,00 | 11 | -21,43 | ||||
| 2026-01-20 | 13F | Savvy Advisors, Inc. | 3.151 | 211 | ||||||
| 2026-02-06 | 13F | Vestmark Advisory Solutions, Inc. | 3.981 | 267 | ||||||
| 2025-11-14 | 13F | Mount Yale Investment Advisors, LLC | 0 | -100,00 | 0 | -100,00 | ||||
| 2025-11-14 | 13F | WealthTrak Capital Management LLC | 0 | -100,00 | 0 | |||||
| 2026-02-10 | 13F | Fort Sheridan Advisors Llc | 8.792 | 0,00 | 589 | -19,97 | ||||
| 2025-11-06 | 13F | Integrity Wealth Solutions LLC | 0 | -100,00 | 0 | -100,00 | ||||
| 2026-02-17 | 13F | Credit Agricole S A | 53.728 | 220,19 | 3.600 | 156,05 | ||||
| 2026-02-12 | 13F | Qtron Investments LLC | 0 | -100,00 | 0 | |||||
| 2026-04-30 | 13F | Cromwell Holdings LLC | 57 | 72,73 | 3 | 50,00 | ||||
| 2026-02-14 | 13F | American Trust | 0 | -100,00 | 0 | |||||
| 2026-01-16 | 13F | Crowley Wealth Management, Inc. | 0 | -100,00 | 0 | -100,00 | ||||
| 2026-04-02 | 13F | Crumly & Associates Inc. | 8.306 | 23,45 | 490 | 8,89 | ||||
| 2026-02-09 | 13F | Jefferies Financial Group Inc. | 0 | -100,00 | 0 | |||||
| 2026-04-23 | 13F | American National Bank | 738 | 0,00 | 44 | -12,24 | ||||
| 2026-02-09 | 13F | Berkshire Capital Holdings Inc | 10 | 0,00 | 1 | |||||
| 2026-04-23 | 13F | GraniteShares Advisors LLC | 7.045 | 1,84 | 416 | -10,37 | ||||
| 2026-02-18 | 13F | Financial Advisory Service, Inc. | 3.667 | 246 | ||||||
| 2026-01-16 | 13F | FNY Investment Advisers, LLC | Call | 0 | -100,00 | 0 | ||||
| 2026-02-12 | 13F | Chilton Capital Management Llc | 17 | 1 | ||||||
| 2026-02-11 | 13F | Jpmorgan Chase & Co | 1.692.738 | 20,06 | 113.430 | -4,01 | ||||
| 2026-01-20 | 13F | Cigna Investments Inc /new | 3.036 | 0,00 | 0 | |||||
| 2026-04-22 | 13F | Spirepoint Private Client, Llc | 90.440 | 0,00 | 5.340 | -11,90 | ||||
| 2026-04-24 | 13F | Keybank National Association/oh | 20.015 | -40,04 | 1.182 | -47,18 | ||||
| 2026-02-13 | 13F | Barclays Plc | Call | 62.700 | 4.202 | |||||
| 2026-02-13 | 13F | Barclays Plc | 445.930 | -8,14 | 29.882 | -26,56 | ||||
| 2026-02-13 | 13F | Barclays Plc | Put | 35.000 | 2.345 | |||||
| 2026-02-11 | 13F | Flagship Wealth Advisors, Llc | 50 | 0,00 | 3 | -25,00 | ||||
| 2026-04-22 | 13F | Union Bancaire Privee, UBP SA | 26.850 | 9,11 | 1.584 | -5,94 | ||||
| 2026-04-08 | 13F | Arlington Trust Co LLC | 13 | 1 | ||||||
| 2026-02-17 | 13F | Optiver Holding B.V. | 0 | -100,00 | 0 | |||||
| 2026-02-11 | 13F | Zions Bancorporation, National Association /ut/ | 135 | 9 | ||||||
| 2026-02-17 | 13F | Driehaus Capital Management Llc | 106.289 | 7.122 | ||||||
| 2026-02-12 | 13F | Swiss Re Ltd | 60 | 4 | ||||||
| 2026-01-29 | 13F | D.a. Davidson & Co. | 7.065 | 0,43 | 473 | -19,69 | ||||
| 2025-11-14 | 13F | Petrus Trust Company, LTA | 0 | -100,00 | 0 | |||||
| 2026-02-13 | 13F | National Bank Of Canada /fi/ | 4.869 | 108,61 | 326 | 66,67 | ||||
| 2025-11-12 | 13F | APG Asset Management US Inc. | 0 | -100,00 | 0 | |||||
| 2025-11-14 | 13F | Full Sail Capital, LLC | 3.008 | 252 | ||||||
| 2026-01-28 | 13F | Universal- Beteiligungs- und Servicegesellschaft mbH | 187.197 | 8,13 | 12.574 | -13,35 | ||||
| 2026-03-17 | 13F | Forty-three Eighteen Advisors, LLC | 13.039 | 874 | ||||||
| 2025-11-14 | 13F | Spears Abacus Advisors LLC | 0 | -100,00 | 0 | |||||
| 2026-04-30 | 13F | Sumitomo Mitsui Trust Holdings, Inc. | 1.774.273 | 0,83 | 104.753 | -11,16 | ||||
| 2026-02-13 | 13F | Bridgewater Associates, LP | 110.266 | 54,93 | 7.389 | 23,88 | ||||
| 2026-02-13 | 13F | Knollwood Investment Advisory, LLC | 5.300 | 0,00 | 355 | -20,05 | ||||
| 2026-04-02 | 13F | Aspect Partners, LLC | 129 | 0,00 | 8 | -12,50 | ||||
| 2026-02-17 | 13F | Atreides Management, LP | 4.177.675 | 1,93 | 279.946 | -18,50 | ||||
| 2025-11-04 | 13F | Guerra Advisors Inc | 30 | 3 | ||||||
| 2026-02-17 | 13F | Atreides Management, LP | Call | 1.500.000 | 100.515 | |||||
| 2026-04-17 | 13F | Sara-Bay Financial | 199.096 | -3,05 | 11.755 | -15,57 | ||||
| 2026-02-13 | 13F | Schroder Investment Management Group | 1.016.927 | 68,63 | 68.937 | 37,88 | ||||
| 2025-11-14 | 13F | Point72 (DIFC) Ltd | 34.828 | 2.919 | ||||||
| 2026-02-13 | 13F | Public Employees Retirement Association Of Colorado | 30.690 | 0,00 | 2 | 0,00 | ||||
| 2026-02-13 | 13F | Ubs Asset Management Americas Inc | 2.653.998 | 7,70 | 177.844 | -13,89 | ||||
| 2026-02-11 | 13F | Rise Advisors, LLC | 0 | -100,00 | 0 | |||||
| 2026-02-13 | 13F | Sei Investments Co | 243.501 | -52,14 | 16.317 | -61,73 | ||||
| 2026-02-17 | 13F | Disciplined Growth Investors Inc /mn | 4.897.406 | -5,09 | 328.175 | -24,12 | ||||
| 2026-02-12 | 13F/A | Pinebridge Investments Llc | 43.415 | 2.909 | ||||||
| 2026-01-29 | 13F | IMC-Chicago, LLC | 69.437 | 4.653 | ||||||
| 2026-01-29 | 13F | IMC-Chicago, LLC | Put | 219.500 | 114,36 | 14.709 | 71,38 | |||
| 2026-01-29 | 13F | IMC-Chicago, LLC | Call | 312.500 | -8,38 | 20.941 | -26,75 | |||
| 2026-02-17 | 13F | Trexquant Investment LP | 117.155 | -42,77 | 7.851 | -54,25 | ||||
| 2026-02-17 | 13F | Jones Financial Companies Lllp | 11.562 | 69,36 | 775 | 37,72 | ||||
| 2026-02-09 | 13F | Emerald Advisers, Llc | 7.417 | -31,59 | 497 | -45,26 | ||||
| 2026-02-11 | 13F | Buckingham Strategic Partners | 9.656 | -27,97 | 647 | -46,44 | ||||
| 2026-02-10 | 13F | Quantbot Technologies LP | 0 | -100,00 | 0 | |||||
| 2026-02-06 | 13F | Gsa Capital Partners Llp | 5.407 | 0 | ||||||
| 2025-11-14 | 13F | EFG Asset Management (Americas) Corp. | 39.621 | 5,46 | 3.321 | 53,49 | ||||
| 2026-02-17 | 13F | Tortoise Capital Advisors, L.l.c. | 35.806 | 98,20 | 2.399 | 58,45 | ||||
| 2026-02-04 | 13F | Greenwood Gearhart Inc | 3.650 | 0,00 | 245 | -20,00 | ||||
| 2026-02-17 | 13F | Canada Pension Plan Investment Board | 165.800 | -47,58 | 11.110 | -58,09 | ||||
| 2026-04-28 | 13F | UNICOM Systems, Inc. | 484.467 | 0,00 | 28.603 | -11,90 | ||||
| 2026-04-24 | 13F | Acorn Financial Advisory Services Inc /adv | 8.749 | -2,10 | 517 | -13,71 | ||||
| 2026-04-28 | 13F | PFA Pension, Forsikringsaktieselskab | 231.391 | 43,28 | 13.661 | 24,78 | ||||
| 2026-02-17 | 13F | Guggenheim Capital Llc | 27.592 | 2,98 | 1.849 | -17,68 | ||||
| 2026-02-12 | 13F | Pitcairn Co | 0 | -100,00 | 0 | |||||
| 2026-04-24 | 13F | ProShare Advisors LLC | 13.176 | 1,14 | 778 | -11,00 | ||||
| 2026-02-09 | 13F | Clear Investment Research, Llc | 0 | -100,00 | 0 | |||||
| 2026-02-13 | 13F | Seneschal Advisors, LLC | 3 | 0,00 | 0 | |||||
| 2025-11-14 | 13F | Point72 Hong Kong Ltd | 135.912 | 11.391 | ||||||
| 2026-04-23 | 13F | Marquette Asset Management, LLC | 0 | -100,00 | 0 | |||||
| 2026-02-13 | 13F | Wilkerson Advisory Group LLC | 20 | 1 | ||||||
| 2026-04-23 | 13F | Kohmann Bosshard Financial Services, LLC | 0 | -100,00 | 0 | |||||
| 2026-02-17 | 13F | Mercer Global Advisors Inc /adv | 50.497 | -4,05 | 3.384 | -23,29 | ||||
| 2026-02-02 | 13F | Danske Bank A/s | 315.082 | 5,45 | 21.114 | -15,69 | ||||
| 2026-01-30 | 13F | Catalytic Wealth RIA, LLC | 0 | -100,00 | 0 | |||||
| 2026-02-17 | 13F | Voleon Capital Management Lp | 0 | -100,00 | 0 | -100,00 | ||||
| 2026-04-22 | 13F | Caldwell Trust Co | 42 | 2 | ||||||
| 2026-02-11 | 13F | O'shaughnessy Asset Management, Llc | 19.049 | 16,96 | 1.276 | -6,52 | ||||
| 2026-02-10 | 13F | Globeflex Capital L P | 0 | -100,00 | 0 | |||||
| 2026-02-10 | 13F | MainStreet Investment Advisors LLC | 9.885 | -3,12 | 662 | -22,57 | ||||
| 2026-04-20 | 13F | Heritage Wealth Management, Inc. | 8.950 | 0,00 | 528 | -11,85 | ||||
| 2026-02-13 | 13F | Alyeska Investment Group, L.P. | 744.885 | 49.915 | ||||||
| 2026-01-12 | 13F | Moody National Bank Trust Division | 0 | -100,00 | 0 | -100,00 | ||||
| 2026-02-18 | 13F | Mackenzie Financial Corp | 22.592 | -26,48 | 1.528 | -40,66 | ||||
| 2026-02-12 | 13F | Quadrant Capital Group Llc | 19.145 | 1,02 | 1.283 | -19,27 | ||||
| 2026-02-12 | 13F | Ensign Peak Advisors, Inc | 125.440 | 0,55 | 8.406 | -19,61 | ||||
| 2026-02-17 | 13F | Aquatic Capital Management LLC | 0 | -100,00 | 0 | |||||
| 2026-04-27 | 13F | Ethic Inc. | 23.494 | -20,13 | 1.387 | -29,63 | ||||
| 2026-02-13 | 13F | JustInvest LLC | 40.038 | 2,27 | 2.683 | -18,26 | ||||
| 2026-01-23 | 13F | Gibbs Wealth Management | 8.273 | -26,65 | 554 | -41,38 | ||||
| 2026-02-12 | 13F | UniSuper Management Pty Ltd | 6.200 | 16,98 | 415 | -6,53 | ||||
| 2026-02-13 | 13F | Missouri Trust & Investment Co | 75 | 0,00 | 5 | -16,67 | ||||
| 2026-02-13 | 13F | Van Eck Associates Corp | 0 | -100,00 | 0 | |||||
| 2026-02-17 | 13F | Millennium Management Llc | Put | 341.100 | 14,69 | 22.857 | -8,30 | |||
| 2026-02-13 | 13F | Rafferty Asset Management, LLC | 5.247 | -2,18 | 352 | -21,83 | ||||
| 2026-02-17 | 13F | Millennium Management Llc | Call | 221.100 | 32,00 | 14.816 | 5,53 | |||
| 2026-02-13 | 13F | Ostrum Asset Management | 3.058 | -24,90 | 205 | -40,18 | ||||
| 2026-02-17 | 13F | Millennium Management Llc | 577.005 | -21,28 | 38.665 | -37,06 | ||||
| 2026-04-15 | 13F | Activest Wealth Management | 4 | -98,61 | 0 | -100,00 | ||||
| 2026-04-10 | 13F | Pure Financial Advisors, Inc. | 22.161 | -1,63 | 1.308 | -13,32 | ||||
| 2025-11-03 | 13F | EFG Asset Management (North America) Corp. | 46.666 | 0,02 | 3.910 | 45,59 | ||||
| 2026-02-17 | 13F | Advisor Group Holdings, Inc. | Call | 1 | 0,00 | 3 | -25,00 | |||
| 2026-02-17 | 13F | Fullerton Fund Management Co Ltd | 4.971 | 333 | ||||||
| 2026-02-12 | 13F | APG Asset Management N.V. | 18.850 | 1.076 | ||||||
| 2025-11-14 | 13F | PineBridge Investments, L.P. | 23.295 | -86,55 | 1.952 | -80,42 | ||||
| 2026-02-17 | 13F | Snowden Capital Advisors LLC | 3.433 | -8,38 | 230 | -26,75 | ||||
| 2026-04-30 | 13F | Teacher Retirement System Of Texas | 4.670 | -54,80 | 276 | -60,26 | ||||
| 2026-02-18 | 13F | State of Tennessee, Treasury Department | 118.843 | -4,11 | 8.264 | -20,43 | ||||
| 2025-11-12 | 13F | Close Asset Management Ltd | 0 | -100,00 | 0 | |||||
| 2026-02-17 | 13F | Price T Rowe Associates Inc /md/ | 1.322.584 | -2,20 | 89 | -22,12 | ||||
| 2026-02-13 | 13F | Caitong International Asset Management Co., Ltd | 0 | -100,00 | 0 | |||||
| 2025-11-04 | 13F | Twenty Acre Capital LP | 0 | -100,00 | 0 | -100,00 | ||||
| 2026-02-10 | 13F | Future Fund LLC | 20.755 | 40,71 | 1.391 | 12,46 | ||||
| 2026-02-11 | 13F | SOUTH STATE Corp | 527 | -5,05 | 35 | -23,91 | ||||
| 2026-02-13 | 13F | Truvestments Capital Llc | 10.142 | 11,08 | 680 | -11,24 | ||||
| 2026-04-29 | 13F | Cordatus Wealth Management LLC | 0 | -100,00 | 0 | |||||
| 2026-02-13 | 13F | Bridgefront Capital, LLC | 0 | -100,00 | 0 | |||||
| 2026-02-17 | 13F | Adams Wealth Management | 0 | -100,00 | 0 | |||||
| 2026-02-13 | 13F | Walleye Capital LLC | 54.757 | 114,47 | 3.669 | 71,53 | ||||
| 2026-02-13 | 13F | Walleye Capital LLC | Call | 36.900 | 28,12 | 2.473 | 2,45 | |||
| 2026-04-23 | 13F | Accurate Wealth Management, LLC | 3.632 | 5,61 | 221 | -3,91 | ||||
| 2026-02-17 | 13F | Boothbay Fund Management, Llc | 6.787 | 58,87 | 455 | 26,82 | ||||
| 2026-04-28 | 13F | LGT Group Foundation | 91.563 | -4,81 | 5.406 | -17,10 | ||||
| 2026-02-06 | 13F | BOK Financial Private Wealth, Inc. | 12.225 | -0,62 | 819 | -20,49 | ||||
| 2026-02-05 | 13F | North Dakota State Investment Board | 19.804 | 1.327 | ||||||
| 2026-04-23 | 13F | SJS Investment Consulting Inc. | 421 | 613,56 | 25 | 700,00 | ||||
| 2026-02-13 | 13F | Transamerica Financial Advisors, Inc. | 508 | 34 | ||||||
| 2026-04-16 | 13F | E. Ohman J:or Asset Management AB | 11.015 | 0,00 | 650 | -11,92 | ||||
| 2026-02-17 | 13F | Public Employees Retirement System Of Ohio | 93.979 | -3,67 | 6.298 | -22,98 | ||||
| 2026-01-21 | 13F | Newbridge Financial Services Group, Inc. | 1.192 | -26,19 | 80 | -41,48 | ||||
| 2026-05-01 | 13F | Compass Financial Services Inc | 0 | -100,00 | 0 | |||||
| 2026-02-11 | 13F | United Financial Planning Group LLC | 4 | 0 | ||||||
| 2026-01-28 | 13F | Chicago Partners Investment Group LLC | 5.224 | 3,04 | 364 | -24,64 | ||||
| 2026-02-13 | 13F | Marshall Wace, Llp | 0 | -100,00 | 0 | |||||
| 2026-04-15 | 13F | Register Financial Advisors LLC | 8.600 | 508 | ||||||
| 2026-02-10 | 13F | Goldman Sachs Group Inc | 1.554.240 | 20,63 | 104.150 | -3,55 | ||||
| 2026-02-11 | 13F | Ameritas Investment Partners, Inc. | 57.217 | 3.834 | ||||||
| 2026-02-18 | 13F/A | Empowered Funds, LLC | 9.089 | 30,61 | 609 | 4,46 | ||||
| 2026-02-06 | 13F | Tredje AP-fonden | 31.967 | 2.142 | ||||||
| 2026-02-12 | 13F | Cornerstone Capital, Inc. | 4.250 | 0,00 | 285 | -20,22 | ||||
| 2026-04-29 | 13F | Frank, Rimerman Advisors LLC | 0 | -100,00 | 0 | |||||
| 2026-04-24 | 13F | Sumitomo Mitsui DS Asset Management Company, Ltd | 47.854 | 2,41 | 2.825 | -9,77 | ||||
| 2025-11-12 | 13F | Total Clarity Wealth Management, Inc. | 0 | -100,00 | 0 | |||||
| 2026-04-16 | 13F | Stanley-Laman Group, Ltd. | 60.081 | 24,13 | 3.547 | 9,37 | ||||
| 2026-04-29 | 13F | Cary Street Partner Investment Advisory Llc | 784 | 191,45 | 46 | 155,56 | ||||
| 2026-02-06 | 13F | Pnc Financial Services Group, Inc. | 18.200 | -0,66 | 1.220 | -20,59 | ||||
| 2026-01-26 | 13F | Cwm, Llc | 75.853 | 15,15 | 5 | 0,00 | ||||
| 2026-02-13 | 13F | Sargent Investment Group, LLC | 16.027 | 0,37 | 1.074 | -19,81 | ||||
| 2026-04-10 | 13F/A | OP Asset Management Ltd | 30.232 | -49,44 | 1.785 | -55,47 | ||||
| 2026-02-12 | 13F | Xponance, Inc. | 76.254 | -6,12 | 5.110 | -24,94 | ||||
| 2026-04-17 | 13F | Vermillion Wealth Management, Inc. | 9 | 1 | ||||||
| 2026-02-11 | 13F | Erste Asset Management GmbH | 420.247 | 28.211 | ||||||
| 2026-04-20 | 13F | Tower View Investment Management & Research LLC | 90 | 0,00 | 5 | -16,67 | ||||
| 2026-02-13 | 13F | Colony Group, LLC | 176.957 | 1.364,88 | 11.858 | 1.071,64 | ||||
| 2025-11-13 | 13F | Total Investment Management Inc | 0 | -100,00 | 0 | |||||
| 2026-02-10 | 13F | National Pension Service | 665.667 | 782,93 | 44.606 | 606,01 | ||||
| 2026-02-11 | 13F | Capital World Investors | 0 | -100,00 | 0 | |||||
| 2026-04-23 | 13F | Peregrine Capital Management Llc | 138.473 | -3,97 | 8.175 | -15,39 | ||||
| 2026-02-11 | 13F | Allianz Asset Management GmbH | 12.761 | -18,51 | 855 | -34,83 | ||||
| 2026-02-09 | 13F | Allstate Corp | 23.968 | 108,85 | 1.606 | 67,12 | ||||
| 2026-05-01 | 13F | Sovran Advisors, LLC | 2.811 | 0,00 | 201 | -1,48 | ||||
| 2026-02-13 | 13F | Dymon Asia Capital (singapore) Pte. Ltd. | 9.766 | 654 | ||||||
| 2026-02-13 | 13F | 1832 Asset Management L.P. | 34.498 | 6,92 | 2.312 | -14,53 | ||||
| 2026-02-12 | 13F | Paradigm Capital Management Inc/ny | 27.000 | 0,00 | 1.809 | -20,03 | ||||
| 2026-02-11 | 13F | Deutsche Bank Ag\ | 713.438 | 3,71 | 47.807 | -17,08 | ||||
| 2026-02-13 | 13F | Integrated Wealth Concepts LLC | 8.237 | -53,68 | 552 | -63,02 | ||||
| 2026-02-17 | 13F | J. Goldman & Co LP | 6.301 | -75,94 | 422 | -80,77 | ||||
| 2025-11-14 | 13F | Point72 Europe (London) LLP | 2.222 | 186 | ||||||
| 2026-04-23 | 13F | North Star Investment Management Corp. | 16 | 1 | ||||||
| 2026-03-27 | 13F | Prosperity Wealth Management, Inc. | 7.025 | 471 | ||||||
| 2026-02-06 | 13F | Mizuho Markets Cayman LP | 4.120 | 0,00 | 276 | -20,00 | ||||
| 2026-02-17 | 13F | Coastal Bridge Advisors, LLC | 32.894 | -0,31 | 2.204 | -20,29 | ||||
| 2026-04-28 | 13F | Walser Wealth Management Company, A Ltd Liability Co | 3.668 | 217 | ||||||
| 2025-11-13 | 13F | Dynamic Technology Lab Private Ltd | 0 | -100,00 | 0 | -100,00 | ||||
| 2026-02-17 | 13F | Jump Financial, LLC | 6.278 | 421 | ||||||
| 2026-02-17 | 13F | Wellington Management Group Llp | 0 | -100,00 | 0 | |||||
| 2026-03-26 | 13F | Leonteq Securities AG | Call | 0 | -100,00 | 0 | -100,00 | |||
| 2026-02-17 | 13F | Ardsley Advisory Partners Lp | 0 | -100,00 | 0 | |||||
| 2026-03-04 | 13F | SHP Wealth Management | 533 | 36 | ||||||
| 2026-02-05 | 13F | S&co Inc | 190.420 | 0,00 | 13 | -20,00 | ||||
| 2026-02-17 | 13F | Laird Norton Trust Company, Llc | 13.629 | 913 | ||||||
| 2026-02-17 | 13F | Capital Fund Management S.a. | Put | 41.900 | 125,27 | 2.808 | 80,17 | |||
| 2026-04-21 | 13F | HCR Wealth Advisors | 0 | -100,00 | 0 | |||||
| 2026-02-17 | 13F | Capital Fund Management S.a. | Call | 21.700 | 1.454 | |||||
| 2026-02-17 | 13F | Ardsley Advisory Partners Lp | Call | 0 | -100,00 | 0 | ||||
| 2026-02-09 | 13F | Harbour Investments, Inc. | 7.077 | 0,51 | 474 | -19,66 | ||||
| 2026-05-01 | 13F | Citizens Financial Group Inc/ri | 30.911 | 4,58 | 1.825 | -7,88 | ||||
| 2026-02-11 | 13F | Cerity Partners LLC | 94.742 | 91,12 | 6.349 | 52,82 | ||||
| 2026-04-28 | 13F | SBI Securities Co., Ltd. | 0 | -100,00 | 0 | |||||
| 2026-02-17 | 13F | Man Group plc | 358.069 | -13,15 | 23.994 | -30,56 | ||||
| 2026-02-12 | 13F | Gerber Kawasaki Wealth & Investment Management | 7.075 | -8,47 | 474 | -26,74 | ||||
| 2026-02-05 | 13F | Mission Wealth Management, Lp | Put | 20.000 | 0,00 | 1.340 | -20,05 | |||
| 2026-02-17 | 13F | Bayesian Capital Management, LP | 0 | -100,00 | 0 | |||||
| 2026-02-05 | 13F | Mission Wealth Management, Lp | 20.698 | 1,00 | 1.387 | -19,28 | ||||
| 2026-02-05 | 13F | High Note Wealth, LLC | 93 | -2,11 | 6 | -14,29 | ||||
| 2026-02-13 | 13F | Financial Network Wealth Advisors LLC | 134 | -28,34 | 9 | -46,67 | ||||
| 2026-02-06 | 13F | Summit Creek Advisors LLC | 157.918 | -3,71 | 10.582 | -23,01 | ||||
| 2026-04-13 | 13F | Midway Capital Research & Management | 280 | 17 | ||||||
| 2026-03-02 | 13F | Tobam | 20.882 | 66,80 | 1 | 0,00 | ||||
| 2026-02-17 | 13F | Russell Investments Group, Ltd. | 331.231 | 39,14 | 22.255 | 11,55 | ||||
| 2026-02-13 | 13F | Neuberger Berman Group LLC | 503.966 | 10,61 | 33.771 | -11,56 | ||||
| 2026-04-14 | 13F | USA Financial Portformulas Corp | 6 | 0,00 | 0 | |||||
| 2026-01-30 | 13F | State of New Jersey Common Pension Fund D | 109.003 | -0,87 | 7.304 | -20,74 | ||||
| 2026-02-13 | 13F | SRS Capital Advisors, Inc. | 26.499 | -63,20 | 1.776 | -70,58 | ||||
| 2026-02-17 | 13F | FIL Ltd | 10.970 | -44,81 | 735 | -55,86 | ||||
| 2026-02-13 | 13F | Parkside Financial Bank & Trust | 71 | -68,72 | 5 | -78,95 | ||||
| 2026-01-26 | 13F | Mirae Asset Global Investments Co., Ltd. | 12.557 | 82,57 | 841 | 46,01 | ||||
| 2026-02-17 | 13F | Creative Planning | 75.155 | 20,17 | 5.036 | -3,91 | ||||
| 2026-01-12 | 13F | Rialto Wealth Management, LLC | 26 | -7,14 | 2 | -50,00 | ||||
| 2026-02-12 | 13F | Rossby Financial, LCC | 83 | 118,42 | 6 | 66,67 | ||||
| 2026-01-29 | 13F | Comerica Bank | 143.481 | -73,84 | 9.615 | -79,08 | ||||
| 2026-02-13 | 13F | Smartleaf Asset Management LLC | 749 | 60,04 | 51 | 31,58 | ||||
| 2026-02-13 | 13F | Toroso Investments, LLC | 90.854 | 136,92 | 6.088 | 89,48 | ||||
| 2025-11-21 | 13F/A | CIBC Bancorp USA Inc. | 11.133 | 933 | ||||||
| 2026-02-17 | 13F | Utah Retirement Systems | 51.337 | 0,00 | 3.440 | -20,04 | ||||
| 2026-04-21 | 13F | Aaron Wealth Advisors LLC | 0 | -100,00 | 0 | |||||
| 2025-11-14 | 13F | AXA Investment Managers S.A. | 53.306 | 4.468 | ||||||
| 2026-02-12 | 13F | Cibc World Markets Corp | 10.833 | -16,00 | 726 | -2,29 | ||||
| 2026-02-12 | 13F | Pembroke Management, LTD | 598.966 | -10,15 | 40.137 | -28,16 | ||||
| 2026-02-06 | 13F | Bare Financial Services, Inc | 94 | 0,00 | 6 | -14,29 | ||||
| 2026-02-13 | 13F | Inspire Advisors, LLC | 6.658 | -20,43 | 446 | -36,38 | ||||
| 2026-02-10 | 13F | Envestnet Asset Management Inc | 126.984 | -31,64 | 8.509 | -45,34 | ||||
| 2026-04-27 | 13F | Pensionmark Financial Group, Llc | 7.557 | -2,33 | 446 | -13,90 | ||||
| 2026-02-17 | 13F | Diker Management Llc | 15.000 | 1.005 | ||||||
| 2026-02-11 | 13F | Winton Capital Group Ltd | 14.886 | -5,67 | 998 | -24,58 | ||||
| 2026-04-15 | 13F | Seacrest Wealth Management, Llc | 4.063 | 0,00 | 240 | -14,03 | ||||
| 2026-01-22 | 13F | Ofi Invest Asset Management | 2.541 | 145 | ||||||
| 2026-02-17 | 13F | Strive Financial Group ,LLC | 534 | 36 | ||||||
| 2026-02-17 | 13F | Investment Management Corp of Ontario | 27.656 | 89,18 | 1.853 | 51,27 | ||||
| 2026-02-12 | 13F | Callan Family Office, LLC | 6.506 | 21,11 | 436 | -3,33 | ||||
| 2026-02-09 | 13F | Employees Retirement System of Texas | 2.865 | 0,00 | 0 | |||||
| 2026-02-11 | 13F | Prestige Wealth Management Group LLC | 41 | 0,00 | 3 | -33,33 | ||||
| 2026-02-11 | 13F | Group One Trading, L.p. | 0 | -100,00 | 0 | -100,00 | ||||
| 2025-12-16 | 13F | Garde Capital, Inc. | 0 | -100,00 | 0 | |||||
| 2026-04-24 | 13F | Retirement Systems of Alabama | 411.342 | 9,78 | 24.286 | -3,28 | ||||
| 2026-04-24 | 13F | UMA Financial Services, Inc. | 16 | 33,33 | 1 | |||||
| 2026-02-12 | 13F | Swiss National Bank | 855.600 | -4,40 | 57.334 | -23,57 | ||||
| 2026-01-21 | 13F | Future Financial Wealth Managment LLC | 0 | -100,00 | 0 | -100,00 | ||||
| 2026-02-10 | 13F | Connor, Clark & Lunn Investment Management Ltd. | 342.825 | -68,60 | 22.973 | -74,90 | ||||
| 2026-04-17 | 13F | CENTRAL TRUST Co | 3.246 | 2,82 | 192 | -9,48 | ||||
| 2026-01-30 | 13F | WoodTrust Financial Corp | 33.415 | -0,24 | 2 | 0,00 | ||||
| 2026-02-02 | 13F | Mutual Advisors, LLC | 8.383 | 9,45 | 562 | -21,76 | ||||
| 2026-02-17 | 13F | Advisor Group Holdings, Inc. | 133.780 | -33,06 | 8.965 | -45,66 | ||||
| 2026-02-06 | 13F | Meiji Yasuda Asset Management Co Ltd. | 48.124 | 507,86 | 3.225 | 386,27 | ||||
| 2025-11-13 | 13F | Goodman Advisory Group, LLC | 0 | -100,00 | 0 | |||||
| 2026-01-28 | 13F | Trail Ridge Investment Advisors, LLC | 9.907 | -20,20 | 664 | -36,25 | ||||
| 2026-04-22 | 13F | Stone House Investment Management, LLC | 5 | 25,00 | 0 | |||||
| 2026-04-13 | 13F | Gateway Investment Advisers Llc | 5.406 | -40,09 | 319 | -47,19 | ||||
| 2026-02-06 | 13F | Covestor Ltd | 387 | -24,71 | 0 | |||||
| 2026-03-03 | 13F | NWF Advisory Services Inc. | 7.916 | 0,00 | 530 | -20,06 | ||||
| 2026-02-02 | 13F | Cornerstone Planning Group LLC | 388 | 2.884,62 | 29 | 2.700,00 | ||||
| 2026-02-13 | 13F | Banque Transatlantique SA | 0 | -100,00 | 0 | |||||
| 2026-02-13 | 13F | Wexford Capital Lp | 0 | -100,00 | 0 | |||||
| 2026-02-03 | 13F | Mitsubishi UFJ Kokusai Asset Management Co., Ltd. | 336.961 | 9,68 | 23.254 | -9,69 | ||||
| 2026-02-06 | 13F | Intrust Bank Na | 8.215 | 10,45 | 550 | -11,72 | ||||
| 2026-02-11 | 13F | Nikko Asset Management Americas, Inc. | 1.081.806 | 72.492 | ||||||
| 2026-05-01 | 13F | Sachetta, LLC | 96 | 39,13 | 6 | 25,00 | ||||
| 2026-02-12 | 13F | Sycomore Asset Management | 187.874 | 0,00 | 9 | 0,00 | ||||
| 2026-04-30 | 13F | Nisa Investment Advisors, Llc | 8.792 | -16,36 | 519 | -26,28 | ||||
| 2026-04-23 | 13F | Lansforsakringar Fondforvaltning AB (publ) | 92.155 | -3,02 | 5.441 | -14,56 | ||||
| 2026-02-13 | 13F | MAI Capital Management | 11.523 | -4,94 | 772 | -23,94 | ||||
| 2026-04-27 | 13F | Albion Financial Group /ut | 125 | 0,00 | 7 | -12,50 | ||||
| 2026-02-10 | 13F | Private Wealth Asset Management, LLC | 10 | 0,00 | 1 | |||||
| 2026-02-13 | 13F | Bank Of Nova Scotia | 38.865 | 329,16 | 2.604 | 243,54 | ||||
| 2026-05-01 | 13F | Hantz Financial Services, Inc. | 15.118 | -84,62 | 1 | -100,00 | ||||
| 2026-02-05 | 13F | Atria Investments Llc | 13.578 | 27,45 | 910 | 1,91 | ||||
| 2026-02-17 | 13F | Schonfeld Strategic Advisors LLC | 11.592 | -89,90 | 777 | -91,94 | ||||
| 2026-04-28 | 13F | Steigerwald, Gordon & Koch Inc. | 100 | 0,00 | 6 | -16,67 | ||||
| 2026-04-29 | 13F | Rye Brook Capital LLC | 10.976 | 1 | ||||||
| 2026-05-01 | 13F | Securian Asset Management, Inc | 23.120 | 1,62 | 1.365 | -10,43 | ||||
| 2026-04-20 | 13F | Fiduciary Alliance LLC | 13.875 | 23,88 | 900 | 20,00 | ||||
| 2026-02-06 | 13F | VSM Wealth Advisory, LLC | 200 | 0,00 | 13 | -18,75 | ||||
| 2026-04-22 | 13F | Sendero Wealth Management, LLC | 33.874 | 2.000 | ||||||
| 2026-02-03 | 13F | Legacy Wealth Managment, LLC/ID | 100 | 0,00 | 7 | -25,00 | ||||
| 2026-04-24 | 13F | Root Financial Partners, LLC | 304 | 21,12 | 18 | 6,25 | ||||
| 2026-02-17 | 13F | Dark Forest Capital Management Lp | 0 | -100,00 | 0 | |||||
| 2026-02-17 | 13F | Frontier Capital Management Co Llc | 880.925 | 3,18 | 59.031 | -17,50 | ||||
| 2026-04-22 | 13F | Pictet Asset Management Holding SA | 157.702 | 22,90 | 9.302 | 8,15 | ||||
| 2026-02-12 | 13F | Aviva Plc | 260.032 | 5,65 | 17.425 | -15,53 | ||||
| 2026-02-17 | 13F | Verdad Advisers, LP | 6.693 | 448 | ||||||
| 2026-02-13 | 13F | Kayne Anderson Rudnick Investment Management Llc | 339.177 | 783,34 | 22.728 | 606,28 | ||||
| 2026-02-11 | 13F | Motley Fool Asset Management LLC | 9.671 | 1,25 | 648 | -19,00 | ||||
| 2026-02-23 | 13F | Virtu Financial LLC | 0 | -100,00 | 0 | -100,00 | ||||
| 2026-02-10 | 13F | Natixis Advisors, L.p. | 90.775 | -21,28 | 6 | -33,33 | ||||
| 2026-02-17 | 13F | Rakuten Investment Management, Inc. | 13.225 | 231,95 | 905 | -26,98 | ||||
| 2026-02-13 | 13F | Ashford Capital Management Inc | 24.568 | -27,24 | 1.646 | -41,84 | ||||
| 2026-04-16 | 13F | Diversified Trust Co | 39.147 | 65,45 | 2.311 | 45,80 | ||||
| 2026-02-19 | 13F | Invesco Ltd. | 725.535 | 15,43 | 48.618 | -7,71 | ||||
| 2026-04-30 | 13F | Mn Services Vermogensbeheer B.V. | 117.396 | 0,00 | 7 | -14,29 | ||||
| 2026-02-09 | 13F | Bleakley Financial Group, LLC | 11.117 | 745 | ||||||
| 2026-05-01 | 13F | Commonwealth Of Pennsylvania Public School Empls Retrmt Sys | 78.590 | 0,59 | 4.640 | -11,38 | ||||
| 2026-02-17 | 13F | Capital Fund Management S.a. | 38.898 | -28,70 | 2.607 | -43,00 | ||||
| 2026-04-15 | 13F | DAVENPORT & Co LLC | 69.437 | -0,03 | 4.100 | -11,93 | ||||
| 2026-02-09 | 13F | Huntington National Bank | 2.113 | -0,94 | 142 | -20,79 | ||||
| 2026-02-05 | 13F | Left Brain Wealth Management, LLC | 0 | -100,00 | 0 | |||||
| 2025-11-14 | 13F | Centiva Capital, LP | 0 | -100,00 | 0 | |||||
| 2026-04-28 | 13F | Whittier Trust Co | 157.961 | 10,40 | 9.662 | -2,17 | ||||
| 2026-04-23 | 13F | Oppenheimer Asset Management Inc. | 0 | -100,00 | 0 | |||||
| 2026-02-03 | 13F | Crestwood Advisors Group LLC | 0 | -100,00 | 0 | |||||
| 2026-04-08 | 13F | DiNuzzo Private Wealth, Inc. | 26 | 4,00 | 2 | 0,00 | ||||
| 2026-01-15 | 13F | Allspring Global Investments Holdings, LLC | 3.507 | 242 | ||||||
| 2026-04-17 | 13F | Bell Investment Advisors, Inc | 172 | 0,00 | 10 | -9,09 | ||||
| 2026-02-13 | 13F | Baird Financial Group, Inc. | 5.276 | -0,49 | 354 | -20,50 | ||||
| 2026-02-12 | 13F | Triumph Capital Management | 200 | 13 | ||||||
| 2026-04-07 | 13F | Green Alpha Advisors, LLC | 11.073 | -3,25 | 654 | -14,75 | ||||
| 2026-02-13 | 13F | Arete Wealth Advisors, LLC | 0 | -100,00 | 0 | |||||
| 2026-02-13 | 13F | Walleye Trading LLC | Call | 201.000 | 31,12 | 13.469 | 4,83 | |||
| 2025-11-21 | 13F | Nebula Research & Development LLC | 0 | -100,00 | 0 | |||||
| 2026-02-13 | 13F | Walleye Trading LLC | Put | 156.700 | 46,04 | 10.500 | 16,77 | |||
| 2026-01-27 | 13F | Brighton Jones Llc | 0 | -100,00 | 0 | |||||
| 2026-02-12 | 13F | Elo Mutual Pension Insurance Co | 40.278 | 42,78 | 2.699 | 14,17 | ||||
| 2025-11-14 | 13F | Oxford Asset Management Llp | 0 | -100,00 | 0 | -100,00 | ||||
| 2026-02-05 | 13F | Baader Bank INC | 20.000 | -44,56 | 1.340 | -55,67 | ||||
| 2025-11-14 | 13F | Davidson Kempner Capital Management Lp | 0 | -100,00 | 0 | -100,00 | ||||
| 2026-02-10 | 13F/A | Northwestern Mutual Wealth Management Co | 29.537 | 9,57 | 1.979 | -12,39 | ||||
| 2026-04-21 | 13F | Pinnacle Associates Ltd | 4.430 | 9,25 | 262 | -3,69 | ||||
| 2026-01-28 | 13F | DekaBank Deutsche Girozentrale | 7.522 | 0,00 | 0 | |||||
| 2026-04-30 | 13F | LRI Investments, LLC | 0 | -100,00 | 0 | |||||
| 2025-11-14 | 13F | Point72 Asia (Singapore) Pte. Ltd. | 3.938 | 330 | ||||||
| 2026-02-17 | 13F | California State Teachers Retirement System | 493.584 | -0,34 | 33.075 | -20,31 | ||||
| 2026-04-09 | 13F | Veracity Capital LLC | 8.067 | 2,73 | 476 | -9,51 | ||||
| 2026-04-23 | 13F | iA Global Asset Management Inc. | 0 | -100,00 | 0 | |||||
| 2026-02-12 | 13F | Proficio Capital Partners LLC | 8.520 | 571 | ||||||
| 2026-04-21 | 13F | Robeco Institutional Asset Management B.V. | 137.420 | -69,89 | 8.113 | -73,47 | ||||
| 2026-02-10 | 13F | United Super Pty Ltd in its capacity as Trustee for the Construction & Building Unions Superannuation Fund | 7.800 | -50,00 | 523 | -60,06 | ||||
| 2026-02-11 | 13F | Dorsey & Whitney Trust CO LLC | 0 | -100,00 | 0 | |||||
| 2026-02-13 | 13F | Champlain Investment Partners, LLC | 0 | -100,00 | 0 | |||||
| 2026-02-13 | 13F | Dymon Asia Capital (singapore) Pte. Ltd. | Put | 0 | -100,00 | 0 | ||||
| 2026-02-10 | 13F | Lido Advisors, LLC | 2.956 | 218 | ||||||
| 2026-02-09 | 13F | New Age Alpha Advisors, LLC | 50.385 | 3.376 | ||||||
| 2026-02-13 | 13F | Mariner, LLC | 2.679.161 | 3,08 | 179.538 | -17,57 | ||||
| 2026-02-06 | 13F | Larson Financial Group LLC | 2.420 | 8,52 | 162 | -12,90 | ||||
| 2026-04-30 | 13F | Equitable Trust Co | 36.028 | 8,64 | 2.127 | -4,28 | ||||
| 2026-02-13 | 13F | Dymon Asia Capital (singapore) Pte. Ltd. | Call | 0 | -100,00 | 0 | ||||
| 2026-02-17 | 13F | Equitable Holdings, Inc. | 8.145 | 546 | ||||||
| 2026-02-09 | 13F | Malaga Cove Capital, LLC | 7.629 | 511 | ||||||
| 2026-04-28 | 13F | Everence Capital Management Inc | 9.384 | 4,04 | 1 | |||||
| 2026-02-12 | 13F | Bradley Foster & Sargent Inc/ct | 3.262 | -4,79 | 219 | -24,04 | ||||
| 2026-02-17 | 13F | Cresset Asset Management, LLC | 177.186 | 1,76 | 11.873 | -18,64 | ||||
| 2025-11-06 | 13F | Abich Financial Wealth Management LLC | 1.624 | 1.035,66 | 136 | 1.842,86 | ||||
| 2026-02-10 | 13F | Td Asset Management Inc | 392.800 | -27,01 | 26.322 | -41,64 | ||||
| 2026-02-11 | 13F | Meiji Yasuda Life Insurance Co | 12.500 | 838 | ||||||
| 2026-02-13 | 13F | Walleye Capital LLC | Put | 80.300 | 162,42 | 5.381 | 109,83 | |||
| 2026-02-17 | 13F | Cresset Asset Management, LLC | Put | 10.700 | 38,96 | 717 | 11,16 | |||
| 2026-01-27 | 13F | Asset Management One Co., Ltd. | 128.586 | 2,05 | 8.797 | -16,70 | ||||
| 2026-02-13 | 13F | Rhumbline Advisers | 876.489 | -2,52 | 58.733 | -22,06 | ||||
| 2026-01-16 | 13F | Trust Co Of Vermont | 27 | 2 | ||||||
| 2026-01-29 | 13F | Calamos Advisors LLC | 31.426 | -5,61 | 2.106 | -24,55 | ||||
| 2026-04-14 | 13F | Nbc Securities, Inc. | 0 | -100,00 | 0 | |||||
| 2026-04-14 | 13F | Nbc Securities, Inc. | Put | 0 | -100,00 | 0 | ||||
| 2026-04-09 | 13F | Wedmont Private Capital | 5.040 | 10,02 | 314 | -0,32 | ||||
| 2026-04-22 | 13F | Janney Montgomery Scott LLC | 28.138 | 45,97 | 2 | 0,00 | ||||
| 2026-02-17 | 13F | Wealth Watch Advisors, INC | 51 | -7,27 | 3 | -25,00 | ||||
| 2026-04-14 | 13F | Bay Harbor Wealth Management, LLC | 34 | 112,50 | 2 | 100,00 | ||||
| 2026-04-06 | 13F | CX Institutional | 196 | 0 | ||||||
| 2026-02-13 | 13F | Hurley Capital, LLC | 326 | 18,98 | 22 | -4,55 | ||||
| 2026-04-29 | 13F | Police & Firemen's Retirement System of New Jersey | 134.319 | 1,69 | 7.930 | -10,41 | ||||
| 2026-05-01 | 13F | 180 Wealth Advisors, Llc | 59.806 | 0,95 | 3.531 | -11,08 | ||||
| 2026-02-17 | 13F | Citadel Advisors Llc | Put | 205.200 | 0,24 | 13.750 | -19,85 | |||
| 2026-02-17 | 13F | Citadel Advisors Llc | 428.967 | 88,38 | 28.745 | 50,62 | ||||
| 2025-11-14 | 13F | Eqis Capital Management, Inc. | 0 | -100,00 | 0 | |||||
| 2026-04-24 | 13F | Washington Capital Management Inc | 8.660 | 5,61 | 511 | -6,92 | ||||
| 2026-02-17 | 13F | Citadel Advisors Llc | Call | 450.000 | -1,23 | 30.154 | -21,03 | |||
| 2026-04-22 | 13F | RBA Wealth Management, LLC | 80.285 | 3,20 | 4.740 | -9,07 | ||||
| 2026-02-11 | 13F | Harvest Fund Management Co., Ltd | 0 | -100,00 | 0 | |||||
| 2026-01-30 | 13F | Mitsubishi UFJ Trust & Banking Corp | 128.133 | -6,10 | 8.586 | -24,92 | ||||
| 2026-04-06 | 13F | Versant Capital Management, Inc | 3.909 | 91,15 | 231 | 67,88 | ||||
| 2026-02-17 | 13F | D. E. Shaw & Co., Inc. | Put | 21.000 | 0,00 | 1.407 | -20,06 | |||
| 2026-02-18 | 13F | CacheTech Inc. | 0 | -100,00 | 0 | -100,00 | ||||
| 2026-02-17 | 13F | D. E. Shaw & Co., Inc. | 34.670 | 46,88 | 2.323 | 17,44 | ||||
| 2026-04-15 | 13F | Norden Group Llc | 5.614 | -47,02 | 331 | -53,38 | ||||
| 2026-04-29 | 13F | American Capital Advisory, LLC | 24 | -11,11 | 1 | 0,00 | ||||
| 2026-04-30 | 13F | Nuveen, LLC | 951.610 | 13,08 | 56.183 | -0,37 | ||||
| 2026-04-16 | 13F | Capital Advisors, Ltd. LLC | 50 | 0,00 | 0 | |||||
| 2026-01-27 | 13F | Atlantic Edge Private Wealth Management, LLC | 0 | -100,00 | 0 | |||||
| 2026-02-13 | 13F | Fayez Sarofim & Co | 10.000 | 0,00 | 670 | -20,05 | ||||
| 2026-01-30 | 13F/A | M&t Bank Corp | 7.961 | 69,20 | 533 | 35,03 | ||||
| 2026-02-14 | 13F | Rockefeller Capital Management L.P. | 101.394 | 2,80 | 6.794 | -17,81 | ||||
| 2026-04-14 | 13F | Pictet & Cie (Europe) SA | 72.822 | 13,82 | 4.299 | 0,28 | ||||
| 2026-01-28 | 13F | Salomon & Ludwin, LLC | 383 | 108,15 | 27 | 73,33 | ||||
| 2026-02-13 | 13F | Stifel Financial Corp | 77.370 | -2,74 | 5.185 | -22,23 | ||||
| 2026-04-28 | 13F | Whittier Trust Co Of Nevada Inc | 78.762 | 3,99 | 4.818 | -7,86 | ||||
| 2026-04-30 | 13F | Sequoia Financial Advisors, LLC | 9.235 | 53,07 | 545 | 34,90 | ||||
| 2026-02-17 | 13F | Chilton Investment Co Llc | 5.700 | 382 | ||||||
| 2026-02-06 | 13F | Abn Amro Investment Solutions | 156.730 | 82,93 | 10.502 | 46,27 | ||||
| 2026-02-12 | 13F | Commonwealth Equity Services, Llc | 29.931 | -1,84 | 2.006 | 100.150,00 | ||||
| 2026-01-23 | 13F | Ogorek Anthony Joseph /ny/ /adv | 12 | 0,00 | 0 | |||||
| 2026-01-27 | 13F | Seeds Investor Llc | 5.487 | -5,74 | 368 | -24,64 | ||||
| 2026-02-10 | 13F | CIBC World Markets Inc. | 21.794 | 1,86 | 1.460 | -18,57 | ||||
| 2026-02-13 | 13F | Eventide Asset Management, Llc | 22.576 | 0,00 | 1.513 | -20,08 | ||||
| 2026-04-20 | 13F | Segment Wealth Management, LLC | 15.456 | -0,04 | 913 | -11,97 | ||||
| 2026-04-23 | 13F | J.w. Cole Advisors, Inc. | 6.088 | 10,97 | 359 | 2,57 | ||||
| 2026-02-13 | 13F | Jacobs Levy Equity Management, Inc | 0 | -100,00 | 0 | |||||
| 2026-04-22 | 13F | Sterling Capital Management LLC | 17.875 | -9,99 | 1.055 | -20,68 | ||||
| 2026-04-16 | 13F | SG Americas Securities, LLC | 277.645 | -11,12 | 16 | -20,00 | ||||
| 2026-02-10 | 13F | Gulf International Bank (UK) Ltd | 17.495 | 0,51 | 1 | 0,00 | ||||
| 2026-02-17 | 13F | Two Sigma Advisers, Lp | 281.300 | 187,04 | 18.850 | 129,50 | ||||
| 2026-02-09 | 13F | Annis Gardner Whiting Capital Advisors, LLC | 10 | 0,00 | 1 | |||||
| 2026-02-17 | 13F | Aqr Capital Management Llc | 3.414.715 | 62,65 | 228.820 | 30,05 | ||||
| 2026-04-20 | 13F | Ronald Blue Trust, Inc. | 1.661 | -10,70 | 98 | -20,97 | ||||
| 2026-01-23 | 13F | FSM Wealth Advisors, LLC | 0 | -100,00 | 0 | |||||
| 2026-01-26 | 13F | PFG Investments, LLC | 0 | -100,00 | 0 | |||||
| 2026-04-28 | 13F | Quent Capital, LLC | 830 | 66,33 | 49 | 48,48 | ||||
| 2026-01-26 | 13F | Asset Dedication, LLC | 75 | 0,00 | 5 | -16,67 | ||||
| 2026-02-11 | 13F | Winnow Wealth Llc | 0 | -100,00 | 0 | |||||
| 2026-04-23 | 13F | Forum Financial Management, LP | 0 | -100,00 | 0 | |||||
| 2026-02-17 | 13F | Janus Henderson Group Plc | 171.272 | 367,71 | 11.478 | 274,12 | ||||
| 2026-01-23 | 13F | Assetmark, Inc | 461 | 35,19 | 31 | 7,14 | ||||
| 2026-04-08 | 13F | Legacy Wealth Asset Management, LLC | 0 | -100,00 | 0 | |||||
| 2026-04-22 | 13F | Arcadia Investment Management Corp/mi | 80.030 | 7,31 | 4.725 | -5,46 | ||||
| 2026-02-11 | 13F | Los Angeles Capital Management Llc | 265.947 | 33,62 | 25.800 | 54,67 | ||||
| 2026-02-17 | 13F | Symmetry Peak Management Llc | Call | 0 | -100,00 | 0 | ||||
| 2026-02-09 | 13F | Catalyst Funds Management Pty Ltd | 0 | -100,00 | 0 | |||||
| 2026-01-29 | 13F | Vanguard Group Inc | 33.125.015 | -2,26 | 2.219.707 | -21,85 | ||||
| 2026-02-17 | 13F | Blair William & Co/il | 3.053.622 | -1,02 | 204.623 | -20,86 | ||||
| 2026-02-10 | 13F | Forsta Ap-fonden | 66.000 | -1,93 | 4.423 | -21,60 | ||||
| 2026-04-28 | 13F | Flagship Harbor Advisors, Llc | 0 | -100,00 | 0 | |||||
| 2026-02-11 | 13F | IMA Wealth, Inc. | 52.483 | -0,15 | 3.517 | -20,18 | ||||
| 2026-02-17 | 13F | State Of Wisconsin Investment Board | 157.306 | -10,44 | 10.541 | -28,39 | ||||
| 2026-01-28 | 13F | B. Metzler seel. Sohn & Co. AG | 7.808 | 0,00 | 523 | -20,03 | ||||
| 2026-04-28 | 13F | Indiana Trust & Investment Management CO | 375 | 0,00 | 22 | -12,00 | ||||
| 2026-02-20 | 13F | Sunbelt Securities, Inc. | 529 | 60,79 | 35 | 29,63 | ||||
| 2026-04-29 | 13F/A | Salem Investment Counselors Inc | 3 | 0 | ||||||
| 2026-04-29 | 13F | Hughes Financial Services, LLC | 57 | -37,36 | 3 | -50,00 | ||||
| 2026-02-13 | 13F | Osmosis Investment Management UK Ltd | 14.362 | 962 | ||||||
| 2026-02-05 | 13F | Bessemer Group Inc | 18.252 | -50,77 | 1 | -66,67 | ||||
| 2026-02-12 | 13F | Wealthspire Advisors, LLC | 0 | -100,00 | 0 | -100,00 | ||||
| 2026-02-12 | 13F | Principal Securities, Inc. | 0 | -100,00 | 0 | |||||
| 2026-01-27 | 13F | Evergreen Capital Management Llc | 5.636 | -36,08 | 378 | -48,92 | ||||
| 2026-01-27 | 13F | Evergreen Capital Management Llc | Call | 500 | 34 | |||||
| 2026-04-09 | 13F | Park Place Capital Corp | 0 | -100,00 | 0 | |||||
| 2026-04-28 | 13F | LGT Fund Management Co Ltd. | 84.162 | 4.969 | ||||||
| 2026-02-05 | 13F | DnB Asset Management AS | 60.193 | 1,64 | 4.034 | -18,74 | ||||
| 2026-02-10 | 13F | Hazlett, Burt & Watson, Inc. | 4.215 | 39,57 | 0 | |||||
| 2026-02-13 | 13F | Needham Investment Management Llc | 5.000 | -50,00 | 335 | -60,02 | ||||
| 2026-02-17 | 13F | Prelude Capital Management, Llc | 4.346 | 291 | ||||||
| 2026-04-14 | 13F | Prospera Financial Services Inc | 8.548 | -26,99 | 505 | -35,71 | ||||
| 2026-04-29 | 13F | Standard Life Aberdeen plc | 269.090 | 5,47 | 15.887 | -7,07 | ||||
| 2026-01-26 | 13F | KBC Group NV | 125.613 | 1,87 | 8 | -20,00 | ||||
| 2026-04-03 | 13F | Hickory Point Bank & Trust | 1.000 | 59 | ||||||
| 2026-04-29 | 13F | Journey Retirement Planning & Investment Management Llc | 3.699 | 248 | ||||||
| 2026-02-04 | 13F | Bailard, Inc. | 101.031 | -16,19 | 6.770 | -32,99 | ||||
| 2026-02-12 | 13F | Davy Global Fund Management Ltd | 72.627 | 18,91 | 4.867 | -4,92 | ||||
| 2026-02-13 | 13F | Pathstone Holdings, LLC | 33.845 | 0,89 | 2.268 | -19,35 | ||||
| 2026-02-13 | 13F | Atlas Capital Advisors Llc | 17.973 | 1.204 | ||||||
| 2026-01-23 | 13F | Rsm Us Wealth Management Llc | 0 | -100,00 | 0 | |||||
| 2026-02-12 | 13F | MetLife Investment Management, LLC | 165.364 | -3,97 | 11.081 | -23,21 | ||||
| 2026-02-05 | 13F | Mesirow Financial Investment Management, Inc. | 0 | -100,00 | 0 | |||||
| 2026-04-29 | 13F | McLaughlin Asset Management, Inc. | 7.144 | -3,25 | 422 | -14,78 | ||||
| 2026-02-03 | 13F | Strengthening Families & Communities, LLC | 42.295 | 2,46 | 2.834 | -18,07 | ||||
| 2026-04-13 | 13F | True Wealth Design, LLC | 1.500 | 54,32 | 89 | 35,38 | ||||
| 2026-02-04 | 13F | Dogwood Wealth Management LLC | 0 | -100,00 | 0 | |||||
| 2026-02-17 | 13F | Tudor Investment Corp Et Al | Call | 40.100 | 2.687 | |||||
| 2026-02-17 | 13F | Tudor Investment Corp Et Al | Put | 71.600 | 4.798 | |||||
| 2026-02-04 | 13F | Plato Investment Management Ltd | 5.739 | -38,32 | 386 | -50,06 | ||||
| 2026-04-17 | 13F | AdvisorNet Financial, Inc | 672 | -16,00 | 40 | -26,42 | ||||
| 2026-02-10 | 13F | Daiwa Securities Group Inc. | 34.200 | 13,25 | 2 | 0,00 | ||||
| 2026-04-07 | 13F | Farther Finance Advisors, LLC | 5.041 | -17,12 | 308 | -24,57 | ||||
| 2026-02-11 | 13F | Livforsakringsbolaget Skandia, Omsesidigt | 2.300 | 0,00 | 154 | -19,79 | ||||
| 2026-02-13 | 13F | Pinnacle Wealth Planning Services, Inc. | 247 | 17 | ||||||
| 2026-02-13 | 13F | Evelyn Partners Investment Management (Europe) Ltd | 1.650 | 0,00 | 111 | -20,29 | ||||
| 2026-02-10 | 13F | CIBC Asset Management Inc | 15.389 | 54,76 | 1.031 | 23,77 | ||||
| 2026-02-04 | 13F | Versor Investments LP | 14.451 | 968 | ||||||
| 2026-04-17 | 13F | Fifth Third Wealth Advisors LLC | 10.154 | 4,41 | 599 | -7,99 | ||||
| 2026-01-15 | 13F | J. Safra Sarasin Holding AG | 5.895 | 395 | ||||||
| 2026-02-17 | 13F | Clark Capital Management Group, Inc. | 5.365 | 1,82 | 360 | -18,59 | ||||
| 2025-11-10 | 13F | Axq Capital, Lp | 0 | -100,00 | 0 | |||||
| 2026-01-27 | 13F | Belpointe Asset Management LLC | 0 | -100,00 | 0 | |||||
| 2026-02-17 | 13F | Two Sigma Securities, Llc | 0 | -100,00 | 0 | |||||
| 2026-02-12 | 13F | Dimensional Fund Advisors Lp | 1.099.252 | -5,03 | 73.665 | -24,05 | ||||
| 2026-04-30 | 13F | First Horizon Corp | 589 | 35 | ||||||
| 2026-02-12 | 13F | DRW Securities, LLC | 14.988 | -48,30 | 1.004 | -58,67 | ||||
| 2026-02-17 | 13F | Hancock Whitney Corp | 24.454 | 1,27 | 1.639 | -19,03 | ||||
| 2026-02-12 | 13F | DRW Securities, LLC | Put | 11.500 | -77,67 | 771 | -82,16 | |||
| 2026-02-18 | 13F | Vident Advisory, LLC | 21.388 | 2,31 | 1.433 | -18,21 | ||||
| 2026-02-13 | 13F | Verition Fund Management LLC | Call | 0 | -100,00 | 0 | -100,00 | |||
| 2026-02-17 | 13F | Worldquant Millennium Advisors Llc | 0 | -100,00 | 0 | |||||
| 2025-11-14 | 13F | Wolverine Trading, Llc | Call | 138.500 | 3,44 | 11.483 | 54,80 | |||
| 2025-11-14 | 13F | Wolverine Trading, Llc | Put | 70.400 | 31,10 | 5.837 | 96,23 | |||
| 2026-02-13 | 13F | BNP Paribas Asset Management Holding S.A. | 3.068.027 | -14,44 | 206 | -31,67 | ||||
| 2026-01-06 | 13F | Leibman Financial Services, Inc. | 0 | -100,00 | 0 | -100,00 | ||||
| 2026-02-12 | 13F | Brinker Capital Investments, LLC | 11.549 | -0,51 | 774 | -20,47 | ||||
| 2026-01-07 | 13F | Next Level Private LLC | 0 | -100,00 | 0 | -100,00 | ||||
| 2026-02-17 | 13F | ClearAlpha Technologies LP | 14.491 | 971 | ||||||
| 2026-02-19 | 13F | CI Private Wealth, LLC | 48.663 | 272,27 | 2.730 | 149,22 | ||||
| 2026-04-16 | 13F | BI Asset Management Fondsmaeglerselskab A/S | 33.004 | -71,18 | 2 | -85,71 | ||||
| 2026-02-17 | 13F | Quantinno Capital Management LP | 441.565 | 41,35 | 29.589 | 13,02 | ||||
| 2026-04-08 | 13F | Wealth Enhancement Advisory Services, Llc | 52.273 | 20,26 | 2.981 | -0,57 | ||||
| 2026-04-30 | 13F | Candriam Luxembourg S.C.A. | 15.832 | -11,08 | 935 | -21,71 | ||||
| 2026-01-15 | 13F | McGlone Suttner Wealth Management, Inc. | 0 | -100,00 | 0 | |||||
| 2025-11-13 | 13F | Inceptionr Llc | 0 | -100,00 | 0 | |||||
| 2026-04-17 | 13F | Cache Advisors, LLC | 23.400 | 0,00 | 1.382 | -11,93 | ||||
| 2026-01-14 | 13F | ORG Partners LLC | 14 | 1 | ||||||
| 2026-02-13 | 13F | Wells Fargo & Company/mn | 912.115 | 16,74 | 61.121 | -6,66 | ||||
| 2026-02-11 | 13F | Syon Capital Llc | 4.998 | 335 | ||||||
| 2026-04-20 | 13F | Jfs Wealth Advisors, Llc | 80 | -52,94 | 5 | -63,64 | ||||
| 2025-11-10 | 13F | Hillsdale Investment Management Inc. | 0 | -100,00 | 0 | |||||
| 2026-04-27 | 13F | Qrg Capital Management, Inc. | 13.112 | 6,20 | 774 | -6,41 | ||||
| 2026-04-21 | 13F | Vise Technologies, Inc. | 3.336 | 0,00 | 224 | 0,00 | ||||
| 2026-04-20 | 13F | City State Bank | 650 | 0,00 | 38 | -11,63 | ||||
| 2026-02-05 | 13F | Bank Julius Baer & Co. Ltd, Zurich | 30.806 | -13,85 | 2.083 | -30,51 | ||||
| 2026-02-12 | 13F | Bank Of Montreal /can/ | 77.794 | -8,82 | 5.213 | -27,10 | ||||
| 2026-02-10 | 13F | Mutual Of America Capital Management Llc | 129.931 | -9,39 | 8.707 | -27,55 | ||||
| 2026-02-17 | 13F | Alliancebernstein L.p. | 730.740 | 23,53 | 48.967 | -1,24 | ||||
| 2026-04-27 | 13F | New England Capital Financial Advisors LLC | 100 | 0,00 | 6 | -16,67 | ||||
| 2026-04-30 | 13F | Cambridge Investment Research Advisors, Inc. | 35.236 | 11,56 | 2 | 0,00 | ||||
| 2026-02-11 | 13F | Manchester Capital Management LLC | 1.070 | 72 | ||||||
| 2026-02-17 | 13F | Fmr Llc | 49.525.737 | 0,47 | 3.318.720 | -19,67 | ||||
| 2026-01-27 | 13F | Bayforest Capital Ltd | 0 | -100,00 | 0 | |||||
| 2026-02-13 | 13F | Macquarie Group Ltd | 17.164 | -87,12 | 1.150 | -89,70 | ||||
| 2026-04-29 | 13F | Cary Street Partners Financial Llc | 58.059 | -0,66 | 3.428 | -12,49 | ||||
| 2026-04-16 | 13F | Evolve Private Wealth, Llc | 3.731 | -14,60 | 220 | -24,66 | ||||
| 2026-04-30 | 13F | Resona Asset Management Co.,Ltd. | 90.797 | -0,88 | 5.331 | -13,42 | ||||
| 2026-02-11 | 13F | 111 Capital | 0 | -100,00 | 0 | -100,00 | ||||
| 2026-02-13 | 13F | Southeast Asset Advisors Inc. | 3.820 | 256 | ||||||
| 2025-11-14 | 13F | Walleye Trading LLC | 0 | -100,00 | 0 | -100,00 | ||||
| 2026-04-17 | 13F | Michael S. Ryan, Inc. | 4.238 | -3,92 | 250 | -15,25 | ||||
| 2026-02-09 | 13F | Legal & General Group Plc | 1.975.473 | -3,68 | 132.376 | -22,99 | ||||
| 2026-02-10 | 13F | Performa Ltd (US), LLC | 70 | 0,00 | 5 | -20,00 | ||||
| 2026-02-05 | 13F | Amalgamated Bank | 147.841 | -1,36 | 10 | -25,00 | ||||
| 2026-02-13 | 13F | K2 Principal Fund, L.p. | 5.102 | 342 | ||||||
| 2026-02-12 | 13F | Brown Brothers Harriman & Co | 70 | -14,63 | 5 | -33,33 | ||||
| 2026-02-13 | 13F | First Trust Advisors Lp | 2.023.248 | 4,84 | 135.578 | -16,18 | ||||
| 2026-02-17 | 13F | MIRAE ASSET GLOBAL ETFS HOLDINGS Ltd. | 4.788 | 4,66 | 321 | -16,45 | ||||
| 2026-02-13 | 13F | K2 Principal Fund, L.p. | Put | 20.000 | 1.340 | |||||
| 2026-02-13 | 13F | State Street Corp | 10.953.501 | 0,82 | 733.994 | -19,39 | ||||
| 2025-11-06 | 13F | Bryce Point Capital, LLC | 7.076 | 593 | ||||||
| 2026-02-06 | 13F | Pinnbrook Capital Management Lp | 0 | -100,00 | 0 | |||||
| 2026-02-10 | 13F | New Mexico Educational Retirement Board | 62.800 | 0,00 | 4 | -20,00 | ||||
| 2026-04-15 | 13F | Merit Financial Group, LLC | 28.060 | 9,73 | 1.657 | -3,33 | ||||
| 2026-05-01 | 13F | Avion Wealth | 84 | 10,53 | 0 | |||||
| 2026-02-06 | 13F | Global Retirement Partners, LLC | Call | 1.500 | 0 | |||||
| 2026-01-29 | 13F | DecisionPoint Financial, LLC | 412 | 0,00 | 28 | -22,86 | ||||
| 2026-02-17 | 13F | Caisse De Depot Et Placement Du Quebec | 105.871 | 7.094 | ||||||
| 2026-02-13 | 13F/A | Ontario Teachers Pension Plan Board | 0 | -100,00 | 0 | |||||
| 2026-04-08 | 13F | Thompson Investment Management, Inc. | 10.665 | 54,23 | 630 | 35,85 | ||||
| 2026-02-13 | 13F | Squarepoint Ops LLC | Put | 55.700 | 10,08 | 3.732 | -11,98 | |||
| 2026-02-12 | 13F | Andra AP-fonden | 87.277 | 268,62 | 5.848 | 194,76 | ||||
| 2026-02-12 | 13F | Caerus Investment Advisors, LLC | 3.317 | 26,41 | 222 | 1,37 | ||||
| 2026-02-13 | 13F | Squarepoint Ops LLC | 457.975 | 644,58 | 30.689 | 495,42 | ||||
| 2026-02-17 | 13F | Amundi | 1.982.489 | -3,84 | 132.847 | -28,66 | ||||
| 2026-01-29 | 13F | Sanctuary Advisors, LLC | 21.966 | 14,16 | 1.472 | -8,75 | ||||
| 2026-04-20 | 13F | Kestra Private Wealth Services, Llc | 6.360 | 1,08 | 375 | -10,93 | ||||
| 2026-02-13 | 13F | Squarepoint Ops LLC | Call | 53.600 | -23,65 | 3.592 | -38,96 | |||
| 2026-02-17 | 13F | Ancora Advisors, LLC | 138 | 0,00 | 9 | -18,18 | ||||
| 2026-02-17 | 13F | Magnetar Financial LLC | 0 | -100,00 | 0 | |||||
| 2026-02-13 | 13F | BRITISH COLUMBIA INVESTMENT MANAGEMENT Corp | 55.386 | 24,11 | 3.711 | -0,78 | ||||
| 2025-11-12 | 13F | NewSquare Capital LLC | 0 | -100,00 | 0 | |||||
| 2026-01-26 | 13F | Covenant Partners, LLC | 3.652 | 0,00 | 245 | -20,26 | ||||
| 2026-02-04 | 13F | Independent Advisor Alliance | 18.771 | -4,41 | 1.258 | -23,59 | ||||
| 2026-02-17 | 13F | Siemens Fonds Invest GmbH | 4.251 | 0,00 | 288 | -19,10 | ||||
| 2026-01-07 | 13F | Procyon Private Wealth Partners, LLC | 8.162 | 2,82 | 547 | -17,89 | ||||
| 2026-02-13 | 13F | Caxton Associates Llp | 31.006 | 2.078 | ||||||
| 2026-02-10 | 13F | Savant Capital, LLC | 0 | -100,00 | 0 | |||||
| 2026-01-20 | 13F | Relyea Zuckerberg Hanson LLC | 0 | -100,00 | 0 | -100,00 | ||||
| 2026-02-11 | 13F | CenterBook Partners LP | 0 | -100,00 | 0 | -100,00 | ||||
| 2026-01-30 | 13F | Rogco, Lp | 337 | 0,00 | 23 | -21,43 | ||||
| 2026-04-17 | 13F | Krilogy Financial LLC | 9.532 | 11,54 | 646 | 3,86 | ||||
| 2026-01-16 | 13F | Beaumont Financial Advisors, LLC | 4.422 | 30,60 | 296 | 4,59 | ||||
| 2026-01-30 | 13F | Us Bancorp \de\ | 117.444 | 2,77 | 7.870 | -17,83 | ||||
| 2026-02-11 | 13F | Simplex Trading, Llc | Put | 147.300 | 17,65 | 9.871 | 98.600,00 | |||
| 2026-02-10 | 13F | Machina Capital S.a.s. | 0 | -100,00 | 0 | -100,00 | ||||
| 2026-02-11 | 13F | Simplex Trading, Llc | 18.146 | 1.216 | ||||||
| 2026-02-17 | 13F | XTX Topco Ltd | 19.825 | 127,90 | 1.328 | 82,17 | ||||
| 2026-02-13 | 13F | Glen Eagle Advisors, LLC | 39 | 0,00 | 3 | -33,33 | ||||
| 2026-04-10 | 13F | Quaker Wealth Management, LLC | 7 | -22,22 | 0 | |||||
| 2026-02-11 | 13F | Simplex Trading, Llc | Call | 165.000 | -44,61 | 11.057 | 45.966,67 | |||
| 2026-04-29 | 13F/A | Farmers & Merchants Trust Co of Chambersburg PA | 20 | 0 | ||||||
| 2026-02-24 | 13F | MidFirst Bank | 118 | 8 | ||||||
| 2026-02-17 | 13F | Northern Trust Corp | 2.839.986 | -2,69 | 190.307 | -22,20 | ||||
| 2026-04-14 | 13F | OV Management LLC | 2.545 | -85,20 | 150 | -86,98 | ||||
| 2026-01-27 | 13F | Tokio Marine Asset Management Co Ltd | 13.374 | 896 | ||||||
| 2026-02-12 | 13F | Foster Dykema Cabot & Partners, Llc | 0 | -100,00 | 0 | |||||
| 2026-02-13 | 13F | Mml Investors Services, Llc | 10.759 | -20,62 | 721 | -36,56 | ||||
| 2026-02-13 | 13F | Silicon Valley Capital Partners | 612 | 0,00 | 41 | -19,61 | ||||
| 2026-02-13 | 13F | Bullseye Asset Management LLC | 0 | -100,00 | 0 | |||||
| 2025-11-14 | 13F | Freestone Grove Partners LP | 0 | -100,00 | 0 | |||||
| 2026-02-10 | 13F | O'Neil Global Advisors, Inc. | 0 | -100,00 | 0 | |||||
| 2026-04-15 | 13F | Fortitude Family Office, LLC | 70 | 62,79 | 4 | 100,00 | ||||
| 2026-02-02 | 13F | Principal Financial Group Inc | 757.052 | -2,35 | 50.730 | -21,92 | ||||
| 2026-02-06 | 13F | Global Retirement Partners, LLC | 2.059 | 34,58 | 138 | 7,03 | ||||
| 2026-02-17 | 13F | Zacks Investment Management | 153.378 | -42,79 | 10.278 | -54,26 | ||||
| 2026-01-28 | 13F | Geneos Wealth Management Inc. | 755 | 2,03 | 51 | -19,35 | ||||
| 2026-04-27 | 13F | Leonteq Securities AG | 14.697 | 37,11 | 868 | 20,75 | ||||
| 2026-01-29 | 13F | Dunhill Financial, LLC | 7 | 0 | ||||||
| 2026-02-17 | 13F | Holocene Advisors, LP | 259.155 | 17.366 | ||||||
| 2026-02-04 | 13F | Ag2r La Mondiale Gestion D'actifs | 17.149 | 1.149 | ||||||
| 2026-02-17 | 13F | Engineers Gate Manager LP | 415.037 | 158,07 | 27.812 | 106,34 | ||||
| 2026-02-13 | 13F | Tairen Capital Ltd | 80.000 | 5.361 | ||||||
| 2026-02-02 | 13F | Horizon Investments, LLC | 12 | -99,56 | 1 | -100,00 | ||||
| 2026-04-30 | 13F | Private Trust Co Na | 354 | -1,39 | 21 | -16,67 | ||||
| 2026-02-10 | 13F | Allred Capital Management, LLC | 0 | -100,00 | 0 | |||||
| 2026-02-13 | 13F | OMERS ADMINISTRATION Corp | 18.192 | -47,91 | 1.219 | -58,34 | ||||
| 2026-02-17 | 13F | Balyasny Asset Management Llc | Call | 3.400 | -93,09 | 228 | -94,49 | |||
| 2026-04-28 | 13F | GM Advisory Group, Inc. | 14.670 | 51,71 | 866 | 33,85 | ||||
| 2026-02-17 | 13F | Balyasny Asset Management Llc | Put | 15.000 | -89,08 | 1.005 | -91,27 | |||
| 2025-11-14 | 13F | Capstone Investment Advisors, Llc | 7.218 | -42,69 | 605 | -16,69 | ||||
| 2026-02-02 | 13F | Alliance Wealth Advisors, LLC /UT | 0 | -100,00 | 0 | -100,00 | ||||
| 2026-02-17 | 13F | Symmetry Peak Management Llc | Put | 0 | -100,00 | 0 | ||||
| 2026-02-17 | 13F | Graham Capital Management, L.P. | 4.098 | 275 | ||||||
| 2025-11-13 | 13F | Summit X, LLC | 0 | -100,00 | 0 | |||||
| 2026-01-13 | 13F | Trust Point Inc. | 0 | -100,00 | 0 | -100,00 | ||||
| 2025-11-06 | 13F | MQS Management LLC | 0 | -100,00 | 0 | -100,00 | ||||
| 2025-11-14 | 13F | Cubist Systematic Strategies, LLC | Put | 117.700 | -3,92 | 9.864 | 39,86 | |||
| 2026-01-26 | 13F | AE Wealth Management LLC | 9.308 | 30,60 | 624 | 4,36 | ||||
| 2026-04-30 | 13F | Oak Ridge Investments Llc | 0 | -100,00 | 0 | |||||
| 2026-04-15 | 13F | Atwood & Palmer Inc | 13 | 1 | ||||||
| 2025-11-14 | 13F | Cubist Systematic Strategies, LLC | Call | 125.300 | -7,12 | 10.501 | 35,20 | |||
| 2025-11-14 | 13F | Cubist Systematic Strategies, LLC | 201.136 | 16.857 | ||||||
| 2026-02-10 | 13F | Intech Investment Management Llc | 325.907 | 685,22 | 21.839 | 527,92 | ||||
| 2026-02-17 | 13F | Balyasny Asset Management Llc | 739.567 | 1.562,02 | 49.558 | 1.228,99 | ||||
| 2026-02-13 | 13F | Umb Bank N A/mo | 4.484 | 12,66 | 300 | -9,91 |