Grundlæggende statistik
| Institutionelle aktier (lange) | 70.868.126 - 102,32% (ex 13D/G) - change of -10,16MM shares -12,54% MRQ |
| Institutionel værdi (lang) | $ 19.504.422 USD ($1000) |
Institutionelt ejerskab og aktionærer
Insulet Corporation (US:PODD) har 830 institutionelle ejere og aktionærer, der har indsendt 13D/G- eller 13F-formularer til Securities Exchange Commission (SEC). Disse institutioner har i alt 70,868,126 aktier. Største aktionærer omfatter Vanguard Group Inc, BlackRock, Inc., Fmr Llc, Capital Research Global Investors, State Street Corp, Baillie Gifford & Co, Geode Capital Management, Llc, American Century Companies Inc, Invesco Ltd., and Clearbridge Investments, LLC .
Insulet Corporation (NasdaqGS:PODD) institutionel ejerskabsstruktur viser aktuelle positioner i virksomheden efter institutioner og fonde, samt seneste ændringer i positionsstørrelse. Større aktionærer kan omfatte individuelle investorer, investeringsforeninger, hedgefonde eller institutioner. Skema 13D angiver, at investoren besidder (eller besidder) mere end 5 % af virksomheden og har til hensigt (eller har til hensigt at) aktivt at forfølge en ændring i forretningsstrategi. Skema 13G indikerer en passiv investering på over 5%.
The share price as of April 24, 2026 is 189,56 / share. Previously, on April 28, 2025, the share price was 259,52 / share. This represents a decline of 26,96% over that period.

Fondens stemningsscore
Fund Sentiment Score (fka Ownership Accumulation Score) finder de aktier, der bliver mest købt af fonde. Det er resultatet af en sofistikeret, multi-faktor kvantitativ model, der identificerer virksomheder med de højeste niveauer af institutionel akkumulering. Scoringsmodellen bruger en kombination af den samlede stigning i oplyste ejere, ændringerne i porteføljeallokeringer i disse ejere og andre målinger. Tallet går fra 0 til 100, hvor højere tal indikerer et højere niveau af akkumulering for sine jævnaldrende, og 50 er gennemsnittet.
Opdateringsfrekvens: Dagligt
Se Ownership Explorer, som giver en liste over højest rangerende virksomheder.
AI+ Ask Fintel’s AI assistant about Insulet Corporation.
Select a question to share a public post with an AI-crafted answer.
Thinking of good questions…
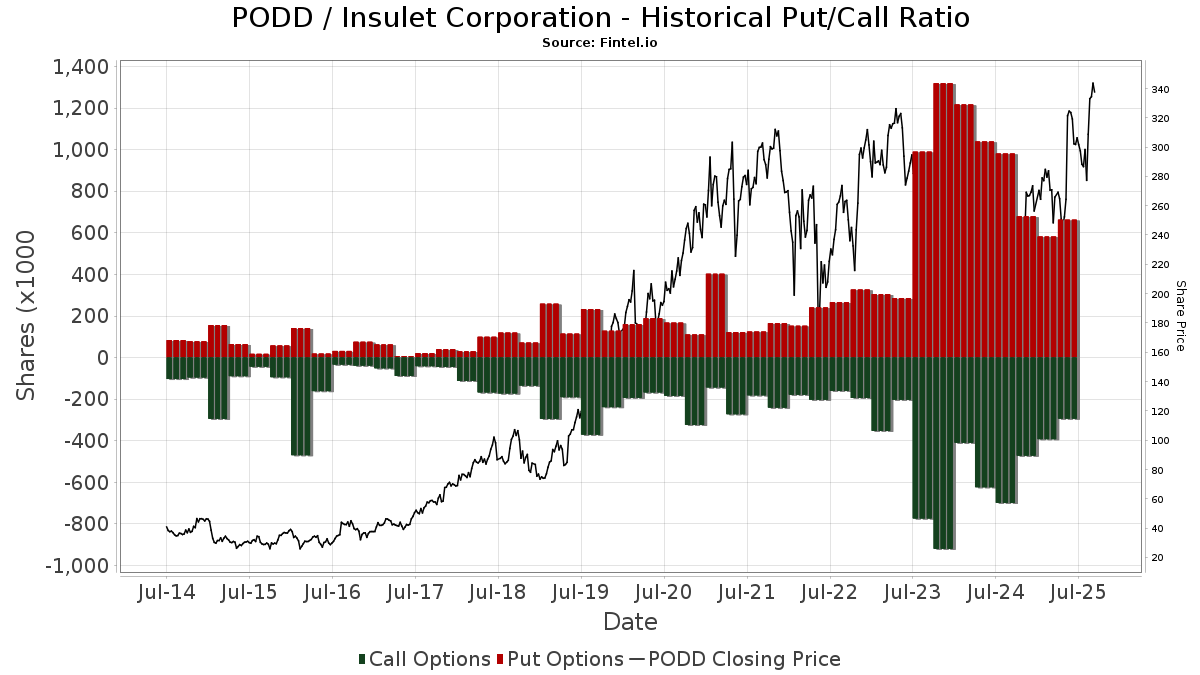
Institutionel Put/Call-forhold
Ud over at indberette standardaktie- og gældsudstedelser skal institutter med mere end 100 mill. aktiver under forvaltning også oplyse deres put- og call-optionsbeholdninger. Da salgsoptioner generelt indikerer negativ stemning, og købsoptioner indikerer positiv stemning, kan vi få en fornemmelse af den overordnede institutionelle stemning ved at plotte forholdet mellem put og kald. Diagrammet til højre viser det historiske put/call-forhold for dette instrument.
Brug af Put/Call Ratio som en indikator for investorernes stemning overvinder en af de vigtigste mangler ved at bruge totalt institutionelt ejerskab, som er, at en betydelig mængde af aktiver under forvaltning investeres passivt for at spore indekser. Passivt forvaltede fonde køber typisk ikke optioner, så indikatoren for put/call-forholdet følger mere nøje følelsen af aktivt forvaltede fonde.
13D/G-arkivering
Vi præsenterer 13D/G ansøgninger separat fra 13F ansøgninger på grund af den forskellige behandling af SEC. 13D/G-ansøgninger kan indgives af grupper af investorer (med én ledende), hvorimod 13F-ansøgninger ikke kan. Dette resulterer i situationer, hvor en investor kan indsende en 13D/G, der rapporterer én værdi for de samlede aktier (der repræsenterer alle de aktier, der ejes af investorgruppen), men derefter indsender en 13F, der rapporterer en anden værdi for de samlede aktier (der udelukkende repræsenterer deres egne) ejendomsret). Det betyder, at aktieejerskab af 13D/G-arkiver og 13F-arkiveringer ofte ikke er direkte sammenlignelige, så vi præsenterer dem separat.
Bemærk: Fra den 16. maj 2021 viser vi ikke længere ejere, der ikke har indsendt en 13D/G inden for det seneste år. Tidligere viste vi den fulde historie af 13D/G-arkiver. Generelt skal enheder, der er forpligtet til at indgive 13D/G-ansøgninger, indgive mindst årligt, før de indsender en afsluttende ansøgning. Dog forlader fonde nogle gange positioner uden at indsende en afsluttende ansøgning (dvs. de afvikler), så visning af den fulde historie resulterede nogle gange i forvirring om det nuværende ejerskab. For at undgå forvirring viser vi nu kun 'aktuelle' ejere - det vil sige - ejere, der har anmeldt inden for det seneste år.
Upgrade to unlock premium data.
| Fil dato | Form | Investor | Forrige Aktier |
Seneste Aktier |
Δ Aktier (Procent) |
Ejendomsret (Procent) |
Δ Ejerskab (Procent) |
|
|---|---|---|---|---|---|---|---|---|
| 2026-02-05 | FMR LLC | 8,068,635 | 6,306,853 | -21.83 | 9.00 | -21.62 | ||
| 2025-10-30 | VANGUARD GROUP INC | 8,029,608 | 8,796,200 | 9.55 | 12.49 | 8.61 | ||
| 2025-08-13 | Capital Research Global Investors | 6,076,540 | 4,736,127 | -22.06 | 6.70 | -22.99 |
13F og NPORT arkivering
Detaljer om 13F-arkivering er gratis. Detaljer om NP-ansøgninger kræver et premium-medlemskab. Grønne rækker angiver nye positioner. Røde rækker angiver lukkede positioner. Klik på linket ikon for at se den fulde transaktionshistorik.
Opgrader
for at låse premium-data op og eksportere til Excel ![]() .
.
Important Note
In an effort to reduce load times for our mobile users, we are testing some ways to deliver lighter pages.
In this first test, we will deliver only the most recent 750 transactions (out of 1041 for this stock). If you are interested in loading *all* the transactions for this company, click the "load all" button below. This is just a test and if you don't like it, please let us know by submitting some gentle feedback via the link at the bottom of this page.
Load All| Fil dato | Kilde | Investor | Type | Gennemsnitlig pris (Øst) |
Aktier | Δ Aktier (%) |
Rapporteret Værdi ($1000) |
Δ Værdi (%) |
Port Alloc (%) |
|
|---|---|---|---|---|---|---|---|---|---|---|
| 2025-11-12 | 13F | 111 Capital | 0 | -100,00 | 0 | |||||
| 2026-02-12 | 13F | BRYN MAWR TRUST Co | 250 | 0,00 | 71 | -7,79 | ||||
| 2025-11-07 | 13F | Sierra Ocean, Llc | 0 | -100,00 | 0 | |||||
| 2026-02-06 | 13F | Leonteq Securities AG | 202 | 0,00 | 57 | -8,06 | ||||
| 2026-02-17 | 13F | Toronto Dominion Bank | 41.229 | 59,15 | 11.719 | 46,51 | ||||
| 2026-02-12 | 13F | APG Asset Management US Inc. | 0 | -100,00 | 0 | |||||
| 2025-11-14 | 13F | WealthTrak Capital Management LLC | 0 | -100,00 | 0 | |||||
| 2026-02-12 | 13F | State Board Of Administration Of Florida Retirement System | 65.237 | -2,14 | 18.543 | -9,91 | ||||
| 2026-02-10 | 13F | Rothschild Investment Llc | 227 | 5,58 | 64 | -3,03 | ||||
| 2026-04-13 | 13F | Hm Payson & Co | 410 | 0,00 | 86 | -25,86 | ||||
| 2026-02-17 | 13F | Citadel Advisors Llc | Put | 61.800 | -0,64 | 17.566 | -8,52 | |||
| 2026-02-17 | 13F | Citadel Advisors Llc | Call | 89.600 | 87,45 | 25.468 | 72,58 | |||
| 2026-02-12 | 13F | Skandinaviska Enskilda Banken AB (publ) | 66.083 | 31,23 | 18.778 | 20,78 | ||||
| 2025-11-14 | 13F | Teza Capital Management LLC | 0 | -100,00 | 0 | |||||
| 2026-02-17 | 13F | Citadel Advisors Llc | 97.363 | -72,37 | 27.674 | -74,57 | ||||
| 2026-02-17 | 13F | Tcw Group Inc | 5.011 | 1.424 | ||||||
| 2026-02-17 | 13F | Royal Bank Of Canada | 360.514 | 7,92 | 102.472 | -0,64 | ||||
| 2026-02-17 | 13F | Mercer Global Advisors Inc /adv | 5.684 | 27,79 | 1.616 | 17,63 | ||||
| 2026-02-10 | 13F | Core Wealth Advisors, Llc | 8 | 2 | ||||||
| 2026-02-13 | 13F | Candriam Luxembourg S.C.A. | 66.502 | 83,32 | 18.903 | 68,79 | ||||
| 2026-02-11 | 13F | Fjarde Ap-fonden /fourth Swedish National Pension Fund | 12.798 | -1,54 | 3.638 | 90.825,00 | ||||
| 2026-02-17 | 13F | Brevan Howard Capital Management LP | 3.362 | 8,63 | 956 | 0,00 | ||||
| 2026-04-14 | 13F | Congress Asset Management Co /ma | 105.228 | 4,69 | 22.081 | -22,72 | ||||
| 2026-02-12 | 13F | Advisors Asset Management, Inc. | 1.089 | 83,95 | 310 | 69,78 | ||||
| 2026-01-29 | 13F | State Of Michigan Retirement System | 18.400 | -3,16 | 5.230 | -10,83 | ||||
| 2026-02-10 | 13F | Principia Wealth Advisory, LLC | 4 | 33,33 | 1 | |||||
| 2026-02-09 | 13F | Knights of Columbus Asset Advisors LLC | 4.503 | -1,42 | 1.280 | -9,29 | ||||
| 2026-04-17 | 13F | Hanson & Doremus Investment Management | 50 | 0,00 | 0 | |||||
| 2026-02-13 | 13F | Neo Ivy Capital Management | 1.054 | 300 | ||||||
| 2026-04-09 | 13F | Moody National Bank Trust Division | 2.140 | 2,05 | 449 | -24,66 | ||||
| 2025-10-29 | 13F | HHM Wealth Advisors, LLC | 0 | -100,00 | 0 | |||||
| 2026-02-05 | 13F | Plante Moran Financial Advisors, LLC | 85 | 6,25 | 24 | 0,00 | ||||
| 2026-01-28 | 13F | Mowery & Schoenfeld Wealth Management, LLC | 11 | 0,00 | 3 | 0,00 | ||||
| 2026-02-04 | 13F | Swiss Life Asset Management Ltd | 13.865 | 14,84 | 3.941 | 5,72 | ||||
| 2026-04-20 | 13F | Banque Cantonale Vaudoise | 9.870 | 68,26 | 2.071 | 24,16 | ||||
| 2026-02-12 | 13F | Graetz Wealth LLC | 775 | 220 | ||||||
| 2026-04-20 | 13F | Jfs Wealth Advisors, Llc | 17 | -37,04 | 4 | -57,14 | ||||
| 2026-02-06 | 13F | EverSource Wealth Advisors, LLC | 323 | 3,86 | 92 | -5,21 | ||||
| 2025-11-14 | 13F | Iron Triangle Partners LP | 0 | -100,00 | 0 | |||||
| 2026-04-24 | 13F | Strs Ohio | 22.677 | -0,01 | 4.759 | -26,19 | ||||
| 2026-02-12 | 13F | Loomis Sayles & Co L P | 2.009 | 432,89 | 571 | 392,24 | ||||
| 2026-02-13 | 13F | Nicholas Investment Partners, LP | 1.862 | 0,00 | 529 | -7,84 | ||||
| 2026-02-17 | 13F | NEOS Investment Management LLC | 5.057 | 14,88 | 1.437 | 5,74 | ||||
| 2026-04-21 | 13F | Financial Consulate, Inc | 24 | 4,35 | 5 | -16,67 | ||||
| 2026-02-09 | 13F | Redmond Asset Management, LLC | 20.455 | -1,43 | 5.814 | -9,24 | ||||
| 2026-02-09 | 13F | Coldstream Capital Management Inc | 1.704 | -13,28 | 484 | -20,13 | ||||
| 2026-02-12 | 13F | M&G Plc | 47.807 | 9,39 | 13.577 | 0,54 | ||||
| 2026-02-17 | 13F | Holocene Advisors, LP | 0 | -100,00 | 0 | |||||
| 2026-02-13 | 13F | MAI Capital Management | 1.537 | 2,67 | 437 | -5,63 | ||||
| 2026-02-12 | 13F | Meiji Yasuda America Inc | 12.816 | 3.643 | ||||||
| 2026-02-13 | 13F | Walleye Capital LLC | 263 | -97,68 | 75 | -97,89 | ||||
| 2026-02-17 | 13F | Prelude Capital Management, Llc | 0 | -100,00 | 0 | |||||
| 2026-04-07 | 13F | Park Avenue Securities Llc | 2.298 | 48,26 | 0 | |||||
| 2026-02-11 | 13F | Ing Groep Nv | 8.291 | -52,08 | 2.357 | -55,89 | ||||
| 2026-04-20 | 13F | Louisiana State Employees Retirement System | 3.600 | 0,00 | 755 | -26,20 | ||||
| 2026-01-21 | 13F | Sound Income Strategies, LLC | 5 | 0,00 | 1 | 0,00 | ||||
| 2026-02-13 | 13F | Walleye Capital LLC | Call | 1.600 | 433,33 | 455 | 393,48 | |||
| 2026-02-17 | 13F | TCG Advisory Services, LLC | 1.079 | 40,68 | 307 | 29,66 | ||||
| 2026-02-13 | 13F | Walleye Capital LLC | Put | 4.100 | 1.165 | |||||
| 2026-02-11 | 13F | Scholtz & Company, Llc | 12.976 | 15,26 | 3.688 | 6,13 | ||||
| 2026-01-30 | 13F | Camden Capital, LLC | 1.321 | 6,70 | 375 | -1,83 | ||||
| 2026-01-26 | 13F | Cwm, Llc | 5.274 | 11,90 | 1 | 0,00 | ||||
| 2025-11-14 | 13F | Wetherby Asset Management Inc | 1.511 | 5,44 | 466 | 3,56 | ||||
| 2026-01-26 | 13F | Moran Wealth Management, LLC | 18.252 | 5.188 | ||||||
| 2026-04-01 | 13F | Bangor Savings Bank | 17 | 0,00 | 4 | -25,00 | ||||
| 2026-02-12 | 13F | EntryPoint Capital, LLC | 851 | 0,00 | 242 | -8,02 | ||||
| 2026-02-11 | 13F | Deutsche Bank Ag\ | 308.447 | 33,90 | 87.673 | 23,28 | ||||
| 2026-03-12 | 13F/A | Peak6 Llc | Put | 2.200 | -87,36 | 625 | -88,36 | |||
| 2025-11-06 | 13F | Whipplewood Advisors, LLC | 0 | -100,00 | 0 | |||||
| 2026-02-04 | 13F | LRI Investments, LLC | 68 | 0,00 | 19 | -5,00 | ||||
| 2026-02-13 | 13F | Rhumbline Advisers | 156.028 | 2,35 | 44.349 | -5,76 | ||||
| 2026-01-07 | 13F | New England Research & Management, Inc. | 3.600 | 1.023 | ||||||
| 2026-02-17 | 13F | Graham Capital Management, L.P. | 0 | -100,00 | 0 | |||||
| 2026-01-28 | 13F | Retirement Planning Co of New England, Inc. | 2.492 | 0,00 | 708 | -7,93 | ||||
| 2026-02-17 | 13F | Farringdon Capital, Ltd. | 2.579 | -18,80 | 733 | -25,20 | ||||
| 2026-02-12 | 13F | Federated Hermes, Inc. | 767.834 | 9,59 | 218.249 | 0,90 | ||||
| 2026-04-14 | 13F | Zrc Wealth Management, Llc | 17 | -15,00 | 4 | -40,00 | ||||
| 2026-04-14 | 13F | Nbc Securities, Inc. | 95 | 20 | ||||||
| 2026-02-17 | 13F | EFG International AG | 189 | 54 | ||||||
| 2026-02-13 | 13F | Blueshift Asset Management, LLC | 1.651 | 12,39 | 469 | 3,53 | ||||
| 2026-02-06 | 13F | Tortoise Investment Management, LLC | 0 | -100,00 | 0 | |||||
| 2026-02-17 | 13F | Wealth Watch Advisors, INC | 0 | -100,00 | 0 | |||||
| 2026-01-21 | 13F | Oak Thistle LLC | 0 | -100,00 | 0 | |||||
| 2026-02-09 | 13F | Huntington National Bank | 731 | -8,85 | 208 | -16,19 | ||||
| 2026-02-17 | 13F | Zacks Investment Management | 0 | -100,00 | 0 | -100,00 | ||||
| 2026-04-10 | 13F | Linden Thomas Advisory Services, LLC | 9.290 | 5,44 | 1.949 | -22,16 | ||||
| 2026-02-03 | 13F | Anfield Capital Management, LLC | 20 | 0,00 | 6 | -16,67 | ||||
| 2026-02-02 | 13F | Wolverine Asset Management Llc | Put | 6.200 | 0,00 | 1.762 | -7,94 | |||
| 2026-02-03 | 13F | Bokf, Na | 1.333 | -41,51 | 379 | -46,23 | ||||
| 2026-02-13 | 13F | Smartleaf Asset Management LLC | 514 | 3,01 | 148 | -5,16 | ||||
| 2026-01-14 | 13F | USA Financial Portformulas Corp | 0 | -100,00 | 0 | |||||
| 2026-02-17 | 13F | Delaware Management Holdings, Inc. | 420.832 | 119.617 | ||||||
| 2026-02-17 | 13F | Bank Of America Corp /de/ | 457.809 | -0,56 | 130.128 | -8,45 | ||||
| 2026-02-03 | 13F | Sequoia Financial Advisors, LLC | 2.527 | 3,95 | 718 | -4,27 | ||||
| 2026-02-13 | 13F | SRS Capital Advisors, Inc. | 420 | -75,01 | 119 | -77,03 | ||||
| 2026-04-24 | 13F | Abacus Wealth Partners, LLC | 0 | -100,00 | 0 | |||||
| 2025-11-07 | 13F | Atticus Wealth Management, Llc | 0 | -100,00 | 0 | |||||
| 2026-02-12 | 13F | California Public Employees Retirement System | 123.138 | -0,95 | 35.001 | -8,81 | ||||
| 2026-02-17 | 13F | Twinbeech Capital Lp | 0 | -100,00 | 0 | |||||
| 2025-10-30 | 13F | Traub Capital Management LLC | 0 | -100,00 | 0 | |||||
| 2026-02-10 | 13F | Baker Avenue Asset Management, LP | 1.153 | 26,98 | 328 | 16,79 | ||||
| 2026-01-28 | 13F | Klp Kapitalforvaltning As | 24.600 | 0,00 | 6.992 | -7,93 | ||||
| 2026-01-27 | 13F | TD Waterhouse Canada Inc. | 450 | 1,35 | 128 | -5,93 | ||||
| 2026-02-17 | 13F | Norinchukin Bank, The | 4.358 | 7,58 | 1.239 | -0,96 | ||||
| 2026-02-11 | 13F | Capital World Investors | 168.000 | 0,00 | 47.752 | -7,93 | ||||
| 2026-02-12 | 13F | Andra AP-fonden | 77.140 | -10,72 | 21.926 | -17,80 | ||||
| 2026-02-13 | 13F | Acumen Wealth Advisors, LLC | 2 | 1 | ||||||
| 2026-02-17 | 13F | Gotham Asset Management, LLC | 17.887 | 14,40 | 5.084 | 5,32 | ||||
| 2026-02-06 | 13F | Envestnet Portfolio Solutions, Inc. | 946 | 269 | ||||||
| 2026-01-27 | 13F | WealthCollab, LLC | 20 | 0,00 | 6 | -16,67 | ||||
| 2026-02-11 | 13F | O'shaughnessy Asset Management, Llc | 9.173 | -2,13 | 2.607 | -9,89 | ||||
| 2026-02-10 | 13F | Mutual Of America Capital Management Llc | 10.831 | 17,27 | 3.079 | 7,96 | ||||
| 2026-04-23 | 13F | MQS Management LLC | 0 | -100,00 | 0 | |||||
| 2026-02-17 | 13F | Aquatic Capital Management LLC | 9.168 | 121,50 | 2.606 | 103,99 | ||||
| 2026-01-22 | 13F | V-Square Quantitative Management LLC | 2.044 | 581 | ||||||
| 2026-02-10 | 13F | Eurizon Capital SGR S.p.A. | 27.215 | 7.741 | ||||||
| 2026-04-20 | 13F | Ronald Blue Trust, Inc. | 37 | 2,78 | 8 | -30,00 | ||||
| 2025-11-07 | 13F | Synovus Financial Corp | 4.423 | -0,34 | 1.366 | -2,08 | ||||
| 2026-02-09 | 13F | Fisher Asset Management, LLC | 52.735 | 13,96 | 14.989 | 4,93 | ||||
| 2026-02-05 | 13F | Td Private Client Wealth Llc | 201 | 1,01 | 57 | -6,56 | ||||
| 2026-01-29 | 13F | IMC-Chicago, LLC | Put | 21.800 | -60,65 | 6.196 | -63,77 | |||
| 2026-01-29 | 13F | IMC-Chicago, LLC | Call | 22.900 | -1,72 | 6.509 | -9,51 | |||
| 2026-02-17 | 13F | Polar Capital Holdings Plc | 148.299 | 150,01 | 42.153 | 130,19 | ||||
| 2026-04-14 | 13F | SNS Financial Group, LLC | 0 | -100,00 | 0 | |||||
| 2026-01-23 | 13F | Optima Capital Llc | 2 | 1 | ||||||
| 2026-02-09 | 13F | Harbour Investments, Inc. | 49 | -2,00 | 14 | -13,33 | ||||
| 2026-02-11 | 13F | Prudential Plc | 19.977 | 287,38 | 5.678 | 256,66 | ||||
| 2026-02-11 | 13F | Prestige Wealth Management Group LLC | 10 | 0,00 | 3 | -33,33 | ||||
| 2025-11-12 | 13F | Creekmur Asset Management LLC | 25 | 0,00 | 8 | 0,00 | ||||
| 2026-02-17 | 13F | Boothbay Fund Management, Llc | 0 | -100,00 | 0 | |||||
| 2026-02-17 | 13F | Osterweis Capital Management Inc | 163 | 0,00 | 46 | -8,00 | ||||
| 2026-02-13 | 13F | Ossiam | 1.856 | -16,77 | 528 | -23,40 | ||||
| 2026-02-04 | 13F | Valeo Financial Advisors, LLC | 839 | 0,00 | 238 | -8,11 | ||||
| 2026-02-13 | 13F | Toroso Investments, LLC | 10.123 | 4,64 | 2.877 | -3,65 | ||||
| 2026-02-04 | 13F | C WorldWide Group Holding A/S | 84.908 | -10,54 | 24 | -17,24 | ||||
| 2026-02-13 | 13F | Neuberger Berman Group LLC | 9.517 | -0,91 | 2.705 | -8,74 | ||||
| 2026-02-13 | 13F | Towarzystwo Funduszy Inwestycyjnych Pzu Sa | 0 | -100,00 | 0 | |||||
| 2025-11-13 | 13F | GeoWealth Management, LLC | 0 | -100,00 | 0 | |||||
| 2026-02-11 | 13F | LPL Financial LLC | 31.847 | -1,58 | 9.052 | -9,39 | ||||
| 2026-02-11 | 13F | Vestcor Inc | 4.459 | -18,08 | 1 | 0,00 | ||||
| 2025-11-13 | 13F | Panagora Asset Management Inc | 0 | -100,00 | 0 | |||||
| 2026-02-12 | 13F | Colonial Trust Co / SC | 1 | 0,00 | 0 | |||||
| 2026-02-17 | 13F | Trexquant Investment LP | 90.985 | 9,77 | 25.862 | 1,06 | ||||
| 2026-02-10 | 13F | Daiwa Securities Group Inc. | 19.071 | 17,45 | 5 | 0,00 | ||||
| 2026-04-22 | 13F | Janney Montgomery Scott LLC | 5.002 | -65,16 | 1 | -75,00 | ||||
| 2026-01-27 | 13F | First Horizon Corp | 52 | 0,00 | 15 | -12,50 | ||||
| 2026-02-17 | 13F | Raymond James Financial Inc | 371.616 | -6,31 | 106.405 | -13,11 | ||||
| 2026-04-22 | 13F | WestEnd Advisors, LLC | 2 | 0,00 | 0 | |||||
| 2026-02-17 | 13F | Man Group plc | 434.568 | -5,86 | 123.522 | -13,32 | ||||
| 2026-04-20 | 13F | Assenagon Asset Management S.A. | 257.719 | 64,17 | 54.080 | 21,20 | ||||
| 2026-02-11 | 13F | Fox Run Management, L.l.c. | 5.977 | -22,03 | 1.699 | -28,23 | ||||
| 2026-02-04 | 13F | Clark Wealth Partners | 8 | 0,00 | 2 | 0,00 | ||||
| 2026-04-24 | 13F | IFM Investors Pty Ltd | 16.459 | 7,04 | 3.454 | 86.225,00 | ||||
| 2026-02-17 | 13F | Rtw Investments, Lp | 324.600 | 92.264 | ||||||
| 2026-01-20 | 13F | Cigna Investments Inc /new | 0 | -100,00 | 0 | |||||
| 2026-04-20 | 13F | Inscription Capital, LLC | 0 | -100,00 | 0 | |||||
| 2026-01-30 | 13F | Jennison Associates Llc | 105.512 | 5,66 | 29.991 | -2,72 | ||||
| 2026-02-13 | 13F | Banco Santander, S.A. | 5.640 | 1.603 | ||||||
| 2026-02-06 | 13F | FourThought Financial Partners, LLC | 750 | -6,25 | 213 | -13,41 | ||||
| 2026-02-17 | 13F | Parkman Healthcare Partners LLC | 140.860 | 21,18 | 40.038 | 11,57 | ||||
| 2026-01-27 | 13F | Proffitt & Goodson Inc | 0 | -100,00 | 0 | -100,00 | ||||
| 2026-02-03 | 13F | Navigoe, LLC | 7 | 0,00 | 0 | |||||
| 2025-11-07 | 13F | Shell Asset Management Co | 0 | -100,00 | 0 | |||||
| 2026-01-28 | 13F | Geneos Wealth Management Inc. | 35.924 | 4,86 | 10.211 | -3,46 | ||||
| 2026-02-17 | 13F | Advanced Portfolio Management, LLC | 0 | -100,00 | 0 | |||||
| 2026-02-17 | 13F | Clear Street Markets Llc | 104 | -14,05 | 30 | -21,62 | ||||
| 2026-02-19 | 13F | Invesco Ltd. | 1.480.562 | 10,54 | 420.835 | 1,77 | ||||
| 2026-03-17 | 13F | Employees Provident Fund Board | 0 | -100,00 | 0 | |||||
| 2026-01-29 | 13F | China Universal Asset Management Co., Ltd. | 600 | 171 | ||||||
| 2026-02-17 | 13F | Creative Planning | 9.472 | -0,35 | 2.692 | -8,25 | ||||
| 2026-04-16 | 13F | Paladin Wealth, LLC | 1.861 | -1,43 | 391 | -27,24 | ||||
| 2026-02-12 | 13F | Commonwealth Equity Services, Llc | 14.088 | 1,80 | 4.004 | 100.000,00 | ||||
| 2026-02-10 | 13F | Kentucky Retirement Systems | 4.402 | 0,00 | 1.251 | -7,95 | ||||
| 2026-02-17 | 13F | Freestone Grove Partners LP | 198.490 | 236,10 | 56.419 | 209,44 | ||||
| 2026-02-05 | 13F | AustralianSuper Pty Ltd | 316.883 | -0,24 | 90.071 | -8,16 | ||||
| 2026-01-28 | 13F | Cornerstone Advisory, LLC | 0 | -100,00 | 0 | |||||
| 2026-02-09 | 13F | Investors Portfolio Services LLC | 2 | 0 | ||||||
| 2026-01-22 | 13F | Hager Investment Management Services, Llc | 79 | 0,00 | 22 | -8,33 | ||||
| 2026-02-11 | 13F | Meeder Advisory Services, Inc. | 878 | 250 | ||||||
| 2026-02-05 | 13F | Northwestern Mutual Investment Management Company, Llc | 2.247 | 0,13 | 639 | -7,80 | ||||
| 2026-02-17 | 13F | Price T Rowe Associates Inc /md/ | 275.880 | 17,10 | 78 | 8,33 | ||||
| 2026-04-15 | 13F | Activest Wealth Management | 77 | 7.600,00 | 16 | |||||
| 2026-01-06 | 13F | Arlington Capital Management, Inc. | 758 | 8,29 | 215 | -0,46 | ||||
| 2026-02-13 | 13F | Public Employees Retirement Association Of Colorado | 50.840 | 643,27 | 14 | 600,00 | ||||
| 2026-02-17 | 13F | Guggenheim Capital Llc | 33.514 | 5,51 | 9.526 | -2,86 | ||||
| 2026-02-06 | 13F | ProShare Advisors LLC | 17.993 | 44,22 | 5.114 | 32,80 | ||||
| 2026-02-10 | 13F | Axq Capital, Lp | 1.249 | 355 | ||||||
| 2026-02-06 | 13F | Larson Financial Group LLC | 88 | 114,63 | 25 | 108,33 | ||||
| 2026-02-18 | 13F | Mackenzie Financial Corp | 11.160 | 29,27 | 3.197 | 19,92 | ||||
| 2026-04-16 | 13F | Toth Financial Advisory Corp | 2 | -99,80 | 0 | -100,00 | ||||
| 2026-04-20 | 13F | State of Alaska, Department of Revenue | 6.938 | 0,00 | 1 | 0,00 | ||||
| 2026-02-09 | 13F | Williamson Legacy Group, LLC | 1.196 | -74,38 | 340 | -76,47 | ||||
| 2026-02-17 | 13F | Snowden Capital Advisors LLC | 1.042 | -32,69 | 296 | -37,95 | ||||
| 2025-11-06 | 13F | Financial Advocates Investment Management | 0 | -100,00 | 0 | |||||
| 2026-04-15 | 13F | Gf Fund Management Co. Ltd. | 1.970 | 0,00 | 413 | -26,12 | ||||
| 2026-02-18 | 13F | GWM Advisors LLC | 0 | -100,00 | 0 | |||||
| 2026-01-27 | 13F | Symmetry Partners, LLC | 2.881 | -9,00 | 819 | -16,27 | ||||
| 2026-01-23 | 13F | Legacy Bridge, LLC | 17 | 5 | ||||||
| 2026-02-24 | 13F | MidFirst Bank | 1.385 | 7 | ||||||
| 2026-02-10 | 13F | Norges Bank | 1.058.238 | 300.794 | ||||||
| 2026-02-17 | 13F | Susquehanna Portfolio Strategies, LLC | 31.950 | 20,05 | 9.081 | 10,53 | ||||
| 2025-12-01 | 13F/A | Polar Asset Management Partners Inc. | 0 | -100,00 | 0 | -100,00 | ||||
| 2026-04-24 | 13F | CHICAGO TRUST Co NA | 970 | 0,00 | 204 | -26,18 | ||||
| 2026-02-06 | 13F | Handelsbanken Fonder AB | 29.502 | 40,38 | 8 | 33,33 | ||||
| 2026-02-17 | 13F | Fmr Llc | 6.325.354 | -16,44 | 1.797.919 | -23,07 | ||||
| 2026-02-03 | 13F | Arcadia Wealth Management, LLC | 0 | -100,00 | 0 | |||||
| 2026-04-14 | 13F | Yarbrough Capital, LLC | 0 | -100,00 | 0 | |||||
| 2026-04-24 | 13F | Ledyard National Bank | 1.117 | -8,96 | 234 | -32,76 | ||||
| 2026-01-28 | 13F | Universal- Beteiligungs- und Servicegesellschaft mbH | 137.158 | 9,76 | 39.080 | 1,30 | ||||
| 2026-02-17 | 13F | Fred Alger Management, Llc | 11.077 | 4,98 | 3.149 | -3,35 | ||||
| 2026-02-13 | 13F | Headlands Technologies LLC | 8.488 | 2.413 | ||||||
| 2026-02-17 | 13F | Maryland State Retirement & Pension System | 3.408 | 0,00 | 969 | -7,98 | ||||
| 2026-02-11 | 13F | Metis Global Partners, LLC | 2.237 | -41,36 | 636 | -46,05 | ||||
| 2026-02-12 | 13F | Ensign Peak Advisors, Inc | 27.877 | -30,59 | 7.924 | -36,10 | ||||
| 2026-02-13 | 13F | Dynamic Technology Lab Private Ltd | 7.034 | 221,33 | 1.999 | 195,71 | ||||
| 2026-02-13 | 13F | Cornerstone Financial Management LLC | 4 | 1 | ||||||
| 2026-02-17 | 13F | Integrated Advisors Network LLC | 45.967 | -1,43 | 13.066 | -9,25 | ||||
| 2026-04-15 | 13F | Merit Financial Group, LLC | 5.307 | 375,54 | 1.114 | 251,10 | ||||
| 2026-02-10 | 13F | Fideuram Asset Management (Ireland) dac | 144 | 47 | ||||||
| 2026-02-05 | 13F | Elyxium Wealth, LLC | 100 | 28 | ||||||
| 2026-04-09 | 13F | Generali Investments, Management Co LLC | 1.706 | 49,26 | 358 | 10,19 | ||||
| 2026-02-13 | 13F | Greenline Wealth Management LLC | 10 | 3 | ||||||
| 2026-02-23 | 13F | Virtu Financial LLC | 4.628 | 126,53 | 1 | |||||
| 2026-02-06 | 13F | Gsa Capital Partners Llp | 2.494 | -36,00 | 1 | -100,00 | ||||
| 2026-02-17 | 13F | Woodline Partners LP | 38.616 | 3,95 | 10.976 | -4,29 | ||||
| 2025-11-14 | 13F | Wolverine Trading, Llc | 13.704 | 393,13 | 4.257 | 389,20 | ||||
| 2025-11-14 | 13F | Wolverine Trading, Llc | Call | 6.400 | -23,81 | 1.988 | -24,42 | |||
| 2026-02-10 | 13F | Peak Retirement Planning, Inc. | 9.742 | 52,70 | 2.769 | 40,63 | ||||
| 2026-02-13 | 13F | Kilter Group LLC | 6 | -40,00 | 2 | -66,67 | ||||
| 2025-11-14 | 13F | Wolverine Trading, Llc | Put | 27.600 | 32,69 | 8.573 | 31,65 | |||
| 2025-11-14 | 13F | Principal Street Partners, LLC | 0 | -100,00 | 0 | -100,00 | ||||
| 2026-02-18 | 13F | State of Tennessee, Treasury Department | 43.117 | 247,47 | 11.030 | 187,89 | ||||
| 2025-11-10 | 13F | Dearborn Partners Llc | 0 | -100,00 | 0 | |||||
| 2026-02-20 | 13F | Kovitz Investment Group Partners, LLC | 10.672 | -27,42 | 3.034 | -33,18 | ||||
| 2026-02-06 | 13F | GPS Wealth Strategies Group, LLC | 0 | -100,00 | 0 | |||||
| 2026-02-13 | 13F | Dai-Ichi Life Insurance Company, Ltd | 19.209 | 588,99 | 5.460 | 534,77 | ||||
| 2026-04-21 | 13F | Trilogy Capital Inc. | 13.820 | 10,94 | 2.900 | -18,11 | ||||
| 2026-01-28 | 13F | Teacher Retirement System Of Texas | 77.373 | -9,05 | 21.993 | -16,26 | ||||
| 2026-04-24 | 13F | Raiffeisen Bank International AG | 427 | 14,78 | 89 | -16,98 | ||||
| 2026-02-17 | 13F | Magnetar Financial LLC | 7.462 | -67,65 | 2.121 | -70,23 | ||||
| 2026-02-09 | 13F | William Blair Investment Management, Llc | 145.811 | -50,32 | 41.445 | -54,26 | ||||
| 2026-04-21 | 13F | Venturi Wealth Management, LLC | 1.392 | -12,73 | 292 | -35,54 | ||||
| 2026-02-13 | 13F | JustInvest LLC | 15.500 | -2,94 | 4.406 | -10,65 | ||||
| 2026-02-11 | 13F | Havemeyer Place LP | 2.256 | 641 | ||||||
| 2026-04-13 | 13F | Clayton Financial Group LLC | 5 | 0,00 | 1 | 0,00 | ||||
| 2026-04-14 | 13F | Banque Pictet & Cie Sa | 8.912 | 350,33 | 1.870 | 232,74 | ||||
| 2026-04-23 | 13F | Private Wealth Management Group, LLC | 4 | 0,00 | 1 | -100,00 | ||||
| 2026-02-13 | 13F | Colony Group, LLC | 14.367 | 93,91 | 4.084 | 78,53 | ||||
| 2026-02-17 | 13F | Glenmede Trust Co Na | 2.551 | 13,53 | 725 | 22,88 | ||||
| 2026-02-03 | 13F | Crossmark Global Holdings, Inc. | 3.268 | 13,31 | 929 | 4,27 | ||||
| 2026-02-10 | 13F | Rational Advisors Llc | 0 | -100,00 | 0 | -100,00 | ||||
| 2025-11-26 | 13F | Vermillion & White Wealth Management Group, LLC | 0 | -100,00 | 0 | |||||
| 2026-02-11 | 13F | Illinois Municipal Retirement Fund | 8.833 | -17,73 | 2.511 | -24,26 | ||||
| 2026-02-17 | 13F | Signature Equity Partners, LLC | 1.233 | 350 | ||||||
| 2026-02-17 | 13F | Vinva Investment Management Ltd | 123.971 | 1.986,35 | 35.735 | 1.836,80 | ||||
| 2026-02-11 | 13F | Cerity Partners LLC | 13.206 | 5,42 | 3.754 | -2,95 | ||||
| 2026-04-23 | 13F | Farmers & Merchants Investments Inc | 48 | 0,00 | 10 | -23,08 | ||||
| 2026-02-13 | 13F | Marshall Wace, Llp | 324.717 | 92.298 | ||||||
| 2026-02-11 | 13F | Cookson Peirce & Co Inc | 1.056 | 300 | ||||||
| 2026-02-13 | 13F | Parkside Financial Bank & Trust | 260 | -0,38 | 74 | -8,75 | ||||
| 2026-04-23 | 13F | North Star Investment Management Corp. | 0 | -100,00 | 0 | |||||
| 2026-02-04 | 13F | Virginia Retirement Systems Et Al | 53.980 | 10,84 | 15.343 | 2,05 | ||||
| 2026-02-10 | 13F | State of Wyoming | 211 | -63,75 | 60 | -67,04 | ||||
| 2026-02-13 | 13F | Great West Life Assurance Co /can/ | 35.333 | -12,19 | 10 | -16,67 | ||||
| 2026-02-11 | 13F | Hughes Financial Services, LLC | 3 | 50,00 | 1 | |||||
| 2026-02-13 | 13F | Walleye Trading LLC | Call | 2.200 | 144,44 | 625 | 125,63 | |||
| 2026-02-09 | 13F | Thrive Capital Management, LLC | 11.525 | 67,15 | 3.276 | 53,90 | ||||
| 2026-02-13 | 13F | Walleye Trading LLC | Put | 5.100 | -73,44 | 1.450 | -75,55 | |||
| 2026-02-11 | 13F | Sharpepoint Llc | 1.017 | 289 | ||||||
| 2026-02-13 | 13F | Seneschal Advisors, LLC | 1 | 0,00 | 0 | |||||
| 2026-02-12 | 13F | Quadrant Capital Group Llc | 5.235 | 0,25 | 1.488 | -7,75 | ||||
| 2026-01-15 | 13F | Allspring Global Investments Holdings, LLC | 3.123 | -0,79 | 884 | -8,31 | ||||
| 2026-01-23 | 13F | Assetmark, Inc | 703 | 3,08 | 200 | -5,24 | ||||
| 2026-04-17 | 13F | Outlook Wealth Advisors, LLC | 0 | -100,00 | 0 | |||||
| 2026-03-03 | 13F/A | Caitong International Asset Management Co., Ltd | 442 | -45,83 | 126 | -50,20 | ||||
| 2026-02-13 | 13F | Formula Growth Ltd | 12.035 | -20,02 | 3.421 | -26,37 | ||||
| 2026-04-16 | 13F | Aegon Asset Management Uk Plc | 0 | -100,00 | 0 | |||||
| 2026-01-30 | 13F | Us Bancorp \de\ | 15.725 | 2,74 | 4.470 | -5,42 | ||||
| 2026-02-03 | 13F | Ethic Inc. | 7.683 | 1,17 | 2.184 | -6,87 | ||||
| 2026-02-13 | 13F | Squarepoint Ops LLC | 11.830 | -94,79 | 3.363 | -95,21 | ||||
| 2026-02-17 | 13F | Jain Global LLC | 36.124 | -66,15 | 10.268 | -68,83 | ||||
| 2026-04-13 | 13F | Wolff Wiese Magana Llc | 253 | 0,00 | 53 | -25,35 | ||||
| 2026-02-12 | 13F | Cibc World Markets Corp | 9.787 | 10,61 | 2.782 | 0,07 | ||||
| 2026-02-10 | 13F | Quantbot Technologies LP | 19.282 | -27,46 | 5.481 | -33,22 | ||||
| 2026-04-17 | 13F | Webster Bank, N. A. | 22 | 0,00 | 5 | -33,33 | ||||
| 2026-02-13 | 13F | Police & Firemen's Retirement System of New Jersey | 10.738 | -4,91 | 3.052 | -12,45 | ||||
| 2025-11-10 | 13F | Fortis Capital Management LLC | 0 | -100,00 | 0 | -100,00 | ||||
| 2026-04-08 | 13F | Arlington Trust Co LLC | 49 | 10 | ||||||
| 2025-11-13 | 13F | Quadrature Capital Ltd | 0 | -100,00 | 0 | |||||
| 2025-10-31 | 13F | Intact Investment Management Inc. | 0 | -100,00 | 0 | |||||
| 2026-02-18 | 13F | VGI Partners Ltd | 900 | 0,00 | 256 | -7,94 | ||||
| 2026-02-12 | 13F | Xponance, Inc. | 17.527 | 5,00 | 4.982 | -3,34 | ||||
| 2026-02-14 | 13F | American Trust | 1.087 | 63,21 | 309 | 50,24 | ||||
| 2026-02-17 | 13F | Brown Financial Advisors | 3.720 | 11,54 | 1.057 | 2,72 | ||||
| 2026-01-30 | 13F | Citizens Financial Group Inc/ri | 1.881 | -3,44 | 535 | -11,15 | ||||
| 2026-01-23 | 13F | Sumitomo Mitsui Trust Holdings, Inc. | 161.004 | -1,18 | 45.764 | -9,02 | ||||
| 2026-04-23 | 13F | Oppenheimer Asset Management Inc. | 20.056 | -2,84 | 4.209 | -28,28 | ||||
| 2026-02-06 | 13F | Covestor Ltd | 149 | -69,78 | 0 | |||||
| 2026-02-17 | 13F | Tudor Investment Corp Et Al | 13.447 | 3.822 | ||||||
| 2026-02-09 | 13F | Atlantic Trust, LLC | 10 | 100,00 | 3 | 100,00 | ||||
| 2026-01-16 | 13F | Crewe Advisors LLC | 7 | 2 | ||||||
| 2026-02-17 | 13F | Tudor Investment Corp Et Al | Call | 10.500 | 2.985 | |||||
| 2025-11-14 | 13F | EFG Asset Management (Americas) Corp. | 6.090 | -10,77 | 1.880 | -12,31 | ||||
| 2026-04-16 | 13F | CPR Investments Inc. | 0 | -100,00 | 0 | |||||
| 2026-02-17 | 13F | Northern Trust Corp | 712.601 | 0,48 | 202.550 | -7,49 | ||||
| 2026-01-29 | 13F | Munich Reinsurance Co Stock Corp in Munich | 20.218 | 5.803 | ||||||
| 2026-02-10 | 13F | Lido Advisors, LLC | 3.483 | -2,60 | 1.049 | -5,07 | ||||
| 2026-04-15 | 13F | Avanza Fonder AB | 8.074 | 0,00 | 1.694 | -26,16 | ||||
| 2026-02-06 | 13F | Vestmark Advisory Solutions, Inc. | 4.813 | 374,65 | 1.368 | 337,06 | ||||
| 2026-02-17 | 13F | Capstone Investment Advisors, Llc | 0 | -100,00 | 0 | -100,00 | ||||
| 2026-02-13 | 13F | Strategic Global Advisors, LLC | 5.443 | 1.547 | ||||||
| 2026-02-17 | 13F | Tremblant Capital Group | 108.469 | 30.831 | ||||||
| 2026-01-30 | 13F | State of New Jersey Common Pension Fund D | 24.415 | 0,00 | 6.940 | -7,93 | ||||
| 2026-04-17 | 13F | Stephenson National Bank & Trust | 0 | -100,00 | 0 | |||||
| 2026-02-17 | 13F | Credit Agricole S A | 30.260 | 162,08 | 8.601 | 141,33 | ||||
| 2026-02-13 | 13F | Rafferty Asset Management, LLC | 7.573 | -3,06 | 2.153 | -10,74 | ||||
| 2026-02-23 | 13F | Mv Capital Management, Inc. | 103 | 3,00 | 29 | -6,45 | ||||
| 2026-04-06 | 13F | GAMMA Investing LLC | 2.923 | -9,78 | 613 | -33,37 | ||||
| 2026-01-20 | 13F | Wealth Management Associates, Inc. | 0 | -100,00 | 0 | |||||
| 2026-02-09 | 13F | Smithfield Trust Co | 30 | 0,00 | 0 | |||||
| 2026-01-12 | 13F | VisionPoint Advisory Group, LLC | 774 | 220 | ||||||
| 2026-01-23 | 13F | Gibbs Wealth Management | 720 | 2,42 | 208 | -4,15 | ||||
| 2025-11-14 | 13F | Texas Permanent School Fund | 0 | -100,00 | 0 | |||||
| 2026-02-02 | 13F | Fifth Third Bancorp | 8.584 | 0,87 | 2.440 | -7,16 | ||||
| 2025-11-07 | 13F | CenterBook Partners LP | 0 | -100,00 | 0 | |||||
| 2026-02-12 | 13F | APG Asset Management N.V. | 40.852 | -3,54 | 9.887 | -11,15 | ||||
| 2026-02-12 | 13F | Mount Yale Investment Advisors, LLC | 1.148 | 326 | ||||||
| 2026-02-11 | 13F | Allianz Asset Management GmbH | 286.104 | -14,45 | 81.322 | -21,24 | ||||
| 2026-04-20 | 13F | ABLE Financial Group, LLC | 0 | -100,00 | 0 | |||||
| 2026-04-22 | 13F | Spire Wealth Management | 52 | -85,27 | 11 | -90,00 | ||||
| 2026-01-15 | 13F | Nisa Investment Advisors, Llc | 5.293 | 20,62 | 1.504 | 11,08 | ||||
| 2026-02-13 | 13F | Chevy Chase Trust Holdings, Inc. | 35.669 | -0,71 | 10.139 | -8,59 | ||||
| 2026-02-17 | 13F | Mirabella Financial Services Llp | 788 | 224 | ||||||
| 2026-02-04 | 13F | Oregon Public Employees Retirement Fund | 8.058 | 0,22 | 2.290 | -7,74 | ||||
| 2026-03-04 | 13F | SHP Wealth Management | 3 | 1 | ||||||
| 2026-02-18 | 13F/A | Alberta Investment Management Corp | 15.100 | 4,14 | 4.292 | -4,11 | ||||
| 2025-11-07 | 13F | Avestar Capital, LLC | 0 | -100,00 | 0 | |||||
| 2026-04-21 | 13F | Aaron Wealth Advisors LLC | 1.955 | -50,39 | 410 | -63,39 | ||||
| 2026-01-30 | 13F | Trifecta Capital Advisors, LLC | 0 | -100,00 | 0 | |||||
| 2026-01-26 | 13F | Mirae Asset Global Investments Co., Ltd. | 17.570 | 15,18 | 4.994 | 6,05 | ||||
| 2026-04-21 | 13F | Pallas Capital Advisors LLC | 2.901 | 167,62 | 609 | 97,40 | ||||
| 2026-04-22 | 13F | Portus Wealth Advisors, LLC | 4 | 1 | ||||||
| 2026-02-03 | 13F | Luken Investment Analytics, LLC | 1 | 0 | ||||||
| 2025-11-13 | 13F | Fuller & Thaler Asset Management, Inc. | 0 | -100,00 | 0 | |||||
| 2026-04-10 | 13F | M & L Capital Management Ltd | 0 | -100,00 | 0 | |||||
| 2026-02-10 | 13F | Eurizon SLJ Capital Ltd | 1.227 | 349 | ||||||
| 2026-01-12 | 13F | Rialto Wealth Management, LLC | 2 | -50,00 | 1 | -100,00 | ||||
| 2026-01-26 | 13F | Provenance Wealth Advisors, LLC | 0 | -100,00 | 0 | |||||
| 2026-02-17 | 13F | Aqr Capital Management Llc | 459.115 | 161,65 | 130.499 | 142,01 | ||||
| 2026-04-22 | 13F | Joel Isaacson & Co., LLC | 6.671 | 0,00 | 1.400 | -26,21 | ||||
| 2026-02-13 | 13F | Transamerica Financial Advisors, Inc. | 6 | 2 | ||||||
| 2026-04-06 | 13F | Highline Wealth Partners Llc | 2 | 0,00 | 0 | |||||
| 2026-02-13 | 13F | Bridgewater Associates, LP | 57.344 | 171,85 | 16.299 | 150,29 | ||||
| 2026-02-17 | 13F | Jump Financial, LLC | 28.561 | -60,34 | 8.118 | -63,49 | ||||
| 2026-02-17 | 13F | Two Sigma Investments, Lp | 366.722 | 46,22 | 104.237 | 34,62 | ||||
| 2026-02-11 | 13F | Inceptionr Llc | 3.785 | 32,16 | 1.076 | 21,61 | ||||
| 2026-02-13 | 13F | Adams Diversified Equity Fund, Inc. | 0 | -100,00 | 0 | |||||
| 2026-02-12 | 13F | BlackRock, Inc. | 6.578.887 | -0,21 | 1.869.983 | -8,12 | ||||
| 2026-02-17 | 13F | Bank Of America Corp /de/ | Call | 0 | -100,00 | 0 | ||||
| 2026-02-17 | 13F | DAFNA Capital Management LLC | 6.870 | 0,00 | 1.953 | -7,92 | ||||
| 2026-02-11 | 13F | Zions Bancorporation, National Association /ut/ | 359 | 107,51 | 102 | 92,45 | ||||
| 2026-02-13 | 13F | Citigroup Inc | 95.252 | 5,97 | 27.074 | -2,43 | ||||
| 2026-04-14 | 13F | Beacon Investment Advisory Services, Inc. | 68.396 | -4,94 | 14.352 | -29,82 | ||||
| 2026-02-17 | 13F | D. E. Shaw & Co., Inc. | 28.004 | 7.960 | ||||||
| 2026-02-17 | 13F | Polymer Capital Management (US) LLC | 3.413 | 970 | ||||||
| 2026-02-06 | 13F | Resona Asset Management Co.,Ltd. | 22.413 | -4,58 | 6.384 | -12,07 | ||||
| 2026-02-03 | 13F | Mitsubishi UFJ Kokusai Asset Management Co., Ltd. | 147.449 | 5,87 | 41.716 | -2,98 | ||||
| 2026-04-13 | 13F | Mather Group, Llc. | 1.063 | -22,75 | 223 | -42,82 | ||||
| 2026-02-13 | 13F | Ausdal Financial Partners, Inc. | 4.604 | 25,11 | 1.309 | 15,14 | ||||
| 2026-02-17 | 13F | Nissay Asset Management Corp /japan/ /adv | 9.050 | 0,95 | 2.572 | -7,05 | ||||
| 2026-02-10 | 13F | Globeflex Capital L P | 500 | 0,00 | 142 | -7,79 | ||||
| 2026-02-13 | 13F | Schroder Investment Management Group | 5.949 | 9,20 | 1.708 | 1,55 | ||||
| 2026-02-13 | 13F | Ostrum Asset Management | 1.106 | -24,97 | 314 | -30,99 | ||||
| 2026-01-21 | 13F | Azzad Asset Management Inc /adv | 14.620 | -0,65 | 4.156 | -8,54 | ||||
| 2026-02-12 | 13F | UniSuper Management Pty Ltd | 8.708 | -10,92 | 2.475 | -17,99 | ||||
| 2026-02-11 | 13F | Group One Trading, L.p. | Put | 7.400 | -28,16 | 2.103 | -33,85 | |||
| 2026-02-11 | 13F | Group One Trading, L.p. | Call | 10.200 | 117,02 | 2.899 | 99,79 | |||
| 2026-01-21 | 13F | Portside Wealth Group, LLC | 1.392 | 9,26 | 396 | 0,51 | ||||
| 2026-01-15 | 13F | Mn Services Vermogensbeheer B.V. | 26.968 | 1,38 | 8 | -12,50 | ||||
| 2026-04-24 | 13F | Yousif Capital Management, Llc | 8.758 | -0,51 | 1.838 | -26,58 | ||||
| 2026-02-02 | 13F | Danske Bank A/s | 43.829 | 26,11 | 12.458 | 16,11 | ||||
| 2026-02-13 | 13F | Thornburg Investment Management Inc | 14.242 | -2,74 | 4.048 | -10,44 | ||||
| 2026-04-22 | 13F | Braun Stacey Associates Inc | 51.858 | -7,14 | 10.882 | -31,45 | ||||
| 2026-04-07 | 13F | Farther Finance Advisors, LLC | 1.262 | 14,83 | 261 | -16,35 | ||||
| 2026-01-16 | 13F | Marquette Asset Management, LLC | 0 | -100,00 | 0 | |||||
| 2026-02-13 | 13F | Virtus ETF Advisers LLC | 51 | 0,00 | 14 | -6,67 | ||||
| 2026-02-12 | 13F | Front Row Advisors LLC | 40 | 0,00 | 11 | -8,33 | ||||
| 2026-02-10 | 13F | Kentucky Retirement Systems Insurance Trust Fund | 1.845 | 0,00 | 524 | -7,91 | ||||
| 2026-02-10 | 13F | Basepoint Wealth LLC | 2 | 1 | ||||||
| 2026-02-13 | 13F | Pathstone Holdings, LLC | 7.873 | -16,32 | 2.238 | -22,97 | ||||
| 2026-04-24 | 13F | Sumitomo Mitsui DS Asset Management Company, Ltd | 8.980 | 0,00 | 1.884 | -26,18 | ||||
| 2026-02-13 | 13F | Rosenblum Silverman Sutton S F Inc /ca | 0 | -100,00 | 0 | |||||
| 2026-02-02 | 13F | Sachetta, LLC | 9 | 0,00 | 3 | 0,00 | ||||
| 2026-02-17 | 13F | Hilltop Holdings Inc. | 2.835 | -2,11 | 806 | -9,96 | ||||
| 2026-02-17 | 13F | Blair William & Co/il | 131.434 | -8,33 | 37.359 | -15,60 | ||||
| 2026-03-02 | 13F | Tobam | 3.041 | -0,20 | 1 | |||||
| 2026-02-12 | 13F | Voya Investment Management Llc | 400.870 | 531,80 | 113.943 | 481,70 | ||||
| 2026-02-03 | 13F | Morse Asset Management, Inc | 15 | 0,00 | 4 | 0,00 | ||||
| 2026-02-04 | 13F | Pier 88 Investment Partners Llc | 900 | -86,38 | 256 | -87,50 | ||||
| 2026-02-17 | 13F | Balyasny Asset Management Llc | 1.416 | 402 | ||||||
| 2026-02-17 | 13F | Balyasny Asset Management Llc | Call | 1.900 | 26,67 | 540 | 16,63 | |||
| 2026-02-17 | 13F | Dark Forest Capital Management Lp | 9.887 | 366,81 | 2.810 | 330,32 | ||||
| 2026-02-17 | 13F | Quantitative Investment Management, LLC | 0 | -100,00 | 0 | |||||
| 2026-04-07 | 13F | Eastern Bank | 420 | -8,50 | 88 | -32,31 | ||||
| 2026-04-15 | 13F | Bayforest Capital Ltd | 308 | -60,26 | 65 | -70,91 | ||||
| 2026-01-23 | 13F | Rsm Us Wealth Management Llc | 2.495 | 0,52 | 716 | -6,53 | ||||
| 2025-11-21 | 13F/A | CIBC Bancorp USA Inc. | 9.711 | 2.998 | ||||||
| 2026-04-15 | 13F | Steinberganna Wealth Management | 6.058 | -47,15 | 1.271 | -60,98 | ||||
| 2026-02-13 | 13F | 1832 Asset Management L.P. | 1.438 | -80,44 | 409 | -82,02 | ||||
| 2025-11-04 | 13F | Guerra Advisors Inc | 5 | 2 | ||||||
| 2025-11-14 | 13F | Mbb Public Markets I Llc | 0 | -100,00 | 0 | |||||
| 2026-01-16 | 13F | Trust Co Of Vermont | 14 | 0,00 | 4 | -25,00 | ||||
| 2026-02-12 | 13F | Penserra Capital Management LLC | 6 | 100,00 | 0 | |||||
| 2026-02-10 | 13F | Natixis Advisors, L.p. | 59.524 | -10,77 | 17 | -20,00 | ||||
| 2026-02-11 | 13F | J.w. Cole Advisors, Inc. | 0 | -100,00 | 0 | |||||
| 2026-02-17 | 13F | Public Employees Retirement System Of Ohio | 38.892 | -4,29 | 11.055 | -11,89 | ||||
| 2026-02-18 | 13F/A | Empowered Funds, LLC | 2.085 | 6,87 | 593 | -1,66 | ||||
| 2026-02-17 | 13F | American Capital Management Inc | 18.890 | -0,74 | 5.369 | -8,61 | ||||
| 2026-01-12 | 13F | CVA Family Office, LLC | 249 | 0,00 | 71 | -7,89 | ||||
| 2026-01-22 | 13F | Bartlett & Co. Wealth Management Llc | 50 | -5,66 | 14 | -12,50 | ||||
| 2026-01-21 | 13F | Signature Resources Capital Management, LLC | 11 | 3 | ||||||
| 2026-02-10 | 13F | Td Asset Management Inc | 44.119 | 11,50 | 12.540 | 2,66 | ||||
| 2026-02-20 | 13F | Sunbelt Securities, Inc. | 60 | -1,64 | 17 | -5,56 | ||||
| 2026-02-12 | 13F | Alps Advisors Inc | 4.231 | 8,18 | 1.203 | -0,41 | ||||
| 2025-11-13 | 13F | Total Investment Management Inc | 0 | -100,00 | 0 | |||||
| 2026-02-10 | 13F | Smith Group Asset Management, LLC | 1.309 | 372 | ||||||
| 2026-02-17 | 13F | Private Advisor Group, LLC | 5.209 | -13,08 | 1.481 | -20,00 | ||||
| 2025-11-13 | 13F | Meridiem Capital Partners LP | 0 | -100,00 | 0 | |||||
| 2026-02-17 | 13F | State Of Wisconsin Investment Board | 44.097 | -24,68 | 12.534 | -30,66 | ||||
| 2026-02-02 | 13F | Cornerstone Planning Group LLC | 12 | 9,09 | 3 | 0,00 | ||||
| 2026-02-05 | 13F | Baader Bank INC | 0 | -100,00 | 0 | |||||
| 2026-02-11 | 13F | Erste Asset Management GmbH | 21.889 | 6.268 | ||||||
| 2026-04-10 | 13F | Revolve Wealth Partners, LLC | 1.567 | 5,17 | 329 | -22,46 | ||||
| 2026-02-13 | 13F | Royal London Asset Management Ltd | 31.272 | -3,22 | 8.889 | -10,90 | ||||
| 2025-11-14 | 13F | Cubist Systematic Strategies, LLC | Put | 1.300 | 0,00 | 401 | -1,72 | |||
| 2026-02-06 | 13F | Cumberland Partners Ltd | 7.500 | -16,67 | 2.132 | -23,29 | ||||
| 2025-11-14 | 13F | Cubist Systematic Strategies, LLC | Call | 3.800 | 18,75 | 1.173 | 16,72 | |||
| 2026-04-22 | 13F | Patton Fund Management, Inc. | 0 | -100,00 | 0 | |||||
| 2026-02-12 | 13F | Steward Partners Investment Advisory, Llc | 1.447 | -5,18 | 411 | -12,74 | ||||
| 2026-02-03 | 13F | SBI Securities Co., Ltd. | 121 | 0,00 | 34 | -8,11 | ||||
| 2026-02-12 | 13F | Bank Of Montreal /can/ | 69.089 | 48,71 | 19.638 | 36,91 | ||||
| 2026-01-28 | 13F | Chicago Partners Investment Group LLC | 1.262 | -5,47 | 343 | -20,83 | ||||
| 2026-02-11 | 13F | First Command Advisory Services, Inc. | 7 | 600,00 | 2 | |||||
| 2026-02-13 | 13F | Mml Investors Services, Llc | 5.079 | 59,82 | 1.444 | 47,09 | ||||
| 2026-02-12 | 13F | Marex Group plc | 2.006 | 570 | ||||||
| 2026-04-08 | 13F | Wealth Enhancement Advisory Services, Llc | 18.000 | 273,52 | 3.201 | 125,74 | ||||
| 2026-02-17 | 13F | Schonfeld Strategic Advisors LLC | 45.892 | 112,17 | 13.044 | 95,36 | ||||
| 2026-04-02 | 13F | Ares Financial Consulting, LLC | 109 | 373,91 | 23 | 266,67 | ||||
| 2026-04-17 | 13F | BAM Wealth Management, LLC | 1.285 | 25,37 | 270 | -7,56 | ||||
| 2026-02-17 | 13F | Banco Bilbao Vizcaya Argentaria, S.a. | 0 | -100,00 | 0 | |||||
| 2026-02-11 | 13F | GW&K Investment Management, LLC | 346 | 0 | ||||||
| 2026-02-17 | 13F | Cetera Investment Advisers | 14.358 | -1,77 | 4.081 | -9,55 | ||||
| 2026-04-14 | 13F | Kozak & Associates, Inc. | 108 | 0,00 | 21 | -32,26 | ||||
| 2026-02-13 | 13F | Inspire Advisors, LLC | 2.038 | -2,44 | 579 | -10,09 | ||||
| 2026-02-09 | 13F | Genus Capital Management Inc. | 1.271 | -91,70 | 361 | -92,37 | ||||
| 2026-04-02 | 13F | Aspect Partners, LLC | 3 | 0,00 | 1 | |||||
| 2026-02-05 | 13F | New York Life Investment Management Llc | 9.670 | 0,74 | 2.749 | -7,26 | ||||
| 2026-02-23 | 13F | Beaird Harris Wealth Management, LLC | 3 | 0,00 | 1 | |||||
| 2026-04-15 | 13F | Covea Finance | 10.200 | 2.140 | ||||||
| 2026-02-11 | 13F | RWC Asset Management LLP | 0 | -100,00 | 0 | |||||
| 2026-02-11 | 13F | Jpmorgan Chase & Co | 244.831 | -12,02 | 69.591 | -18,99 | ||||
| 2026-04-23 | 13F | American National Bank | 15 | 3 | ||||||
| 2026-01-28 | 13F | DekaBank Deutsche Girozentrale | 11.720 | 0,00 | 2 | -33,33 | ||||
| 2026-02-13 | 13F | Baird Financial Group, Inc. | 122.997 | -14,31 | 34.961 | -21,11 | ||||
| 2026-02-12 | 13F | Triumph Capital Management | 1 | 0 | ||||||
| 2026-01-20 | 13F | Sheets Smith Wealth Management | 0 | -100,00 | 0 | |||||
| 2026-02-17 | 13F | Voleon Capital Management Lp | 0 | -100,00 | 0 | |||||
| 2026-01-29 | 13F | Quent Capital, LLC | 154 | -3,75 | 44 | -12,24 | ||||
| 2026-02-11 | 13F | Rise Advisors, LLC | 0 | -100,00 | 0 | |||||
| 2026-02-13 | 13F | Advyzon Investment Management, LLC | 3.968 | 25,73 | 1.128 | 15,71 | ||||
| 2025-11-14 | 13F | Hawk Ridge Capital Management Lp | 0 | -100,00 | 0 | |||||
| 2026-02-12 | 13F | MetLife Investment Management, LLC | 20.242 | -2,60 | 5.754 | -10,33 | ||||
| 2026-02-05 | 13F | Atria Investments Llc | 5.542 | -7,36 | 1.575 | -14,68 | ||||
| 2025-11-14 | 13F | AXA Investment Managers S.A. | 103.658 | 32.002 | ||||||
| 2026-02-17 | 13F | Bamco Inc /ny/ | 7.886 | 38,35 | 2.242 | 27,40 | ||||
| 2025-11-14 | 13F | Bayesian Capital Management, LP | 0 | -100,00 | 0 | |||||
| 2026-04-15 | 13F | Tema Etfs Llc | 3.853 | 15,08 | 809 | -15,04 | ||||
| 2025-11-14 | 13F | Petrus Trust Company, LTA | 0 | -100,00 | 0 | -100,00 | ||||
| 2025-11-13 | 13F | Texas Capital Bancshares Inc/tx | 4 | 1 | ||||||
| 2025-11-14 | 13F | Lazard Asset Management Llc | 0 | -100,00 | 0 | |||||
| 2026-01-23 | 13F | Reuter James Wealth Management, Llc | 0 | -100,00 | 0 | |||||
| 2026-01-29 | 13F | Impax Asset Management Group plc | 9.667 | 0,00 | 2.748 | -7,94 | ||||
| 2026-02-10 | 13F | Commonwealth Of Pennsylvania Public School Empls Retrmt Sys | 16.363 | -3,20 | 4.651 | -10,87 | ||||
| 2026-02-12 | 13F | Swiss National Bank | 192.900 | -4,88 | 54.830 | -12,43 | ||||
| 2026-02-05 | 13F | Bessemer Group Inc | 3.582 | -2,56 | 1 | 0,00 | ||||
| 2026-04-09 | 13F | Zevenbergen Capital Investments Llc | 139.407 | 23,28 | 29.253 | -8,99 | ||||
| 2026-02-11 | 13F | Financiere des Professionnels - Fonds d,investissement inc. | 1.727 | 0,00 | 491 | -8,07 | ||||
| 2026-02-17 | 13F | Balyasny Asset Management Llc | Put | 0 | -100,00 | 0 | ||||
| 2026-02-17 | 13F | Driehaus Capital Management Llc | 49.372 | -49,36 | 14.033 | -53,38 | ||||
| 2026-02-17 | 13F | California State Teachers Retirement System | 106.782 | -2,73 | 30.352 | -10,45 | ||||
| 2025-11-13 | 13F | Riggs Asset Managment Co. Inc. | 0 | -100,00 | 0 | |||||
| 2026-01-16 | 13F | Standard Life Aberdeen plc | 225.429 | 45,61 | 64.076 | 34,05 | ||||
| 2026-04-23 | 13F | CWM Advisors, LLC | 1.581 | 37,60 | 332 | 1,53 | ||||
| 2026-01-29 | 13F | Advisors Capital Management, LLC | 2.129 | -20,17 | 605 | -26,49 | ||||
| 2026-02-02 | 13F | Truist Financial Corp | 1.697 | 31,65 | 482 | 21,41 | ||||
| 2026-01-29 | 13F | Teachers Retirement System Of The State Of Kentucky | 31.048 | -6,75 | 9 | -20,00 | ||||
| 2026-04-13 | 13F | Loring Wolcott & Coolidge Fiduciary Advisors Llp/ma | 1.030 | -3,47 | 203 | -28,37 | ||||
| 2025-11-13 | 13F | FORA Capital, LLC | 0 | -100,00 | 0 | -100,00 | ||||
| 2026-02-09 | 13F/A | Swedbank AB | 85.988 | 10,97 | 24.441 | 2,17 | ||||
| 2026-04-22 | 13F | Sterling Capital Management LLC | 562 | -93,77 | 118 | -95,43 | ||||
| 2026-02-11 | 13F | Dorsey & Whitney Trust CO LLC | 1.094 | -3,44 | 311 | -11,17 | ||||
| 2026-02-12 | 13F | JPL Wealth Management, LLC | 0 | -100,00 | 0 | |||||
| 2026-02-17 | 13F | Utah Retirement Systems | 11.529 | 0,00 | 3.277 | -7,92 | ||||
| 2026-02-17 | 13F | Munro Partners | 26.470 | -88,35 | 7.524 | -89,28 | ||||
| 2026-02-11 | 13F | Parallel Advisors, LLC | 842 | 4,60 | 240 | -3,63 | ||||
| 2026-02-13 | 13F | Pinnacle Wealth Planning Services, Inc. | 775 | -0,39 | 220 | -8,33 | ||||
| 2026-02-03 | 13F | Credit Capital Investments LLC | 1.400 | 0,00 | 398 | -8,10 | ||||
| 2026-02-10 | 13F | Bnp Paribas Arbitrage, Sa | 74.466 | -38,30 | 21.166 | -43,20 | ||||
| 2026-02-13 | 13F | Healthcare Of Ontario Pension Plan Trust Fund | 2.780 | -0,25 | 790 | -8,14 | ||||
| 2026-02-17 | 13F | Kemnay Advisory Services Inc. | 479 | 136 | ||||||
| 2026-02-17 | 13F | Algert Global Llc | 23.886 | 38,88 | 7 | 20,00 | ||||
| 2026-01-12 | 13F | Lvm Capital Management Ltd/mi | 0 | -100,00 | 0 | |||||
| 2026-02-17 | 13F | PDT Partners, LLC | 0 | -100,00 | 0 | |||||
| 2025-11-17 | 13F | LGT Financial Advisors LLC | 0 | -100,00 | 0 | |||||
| 2026-02-13 | 13F | State Street Corp | 3.155.489 | 2,11 | 896.916 | -5,99 | ||||
| 2026-04-13 | 13F | Massmutual Trust Co Fsb/adv | 350 | 7,69 | 73 | -20,65 | ||||
| 2026-02-04 | 13F | Sentry Investment Management Llc | 152 | 0,00 | 0 | |||||
| 2026-02-17 | 13F | Laird Norton Trust Company, Llc | 3.362 | 956 | ||||||
| 2026-02-17 | 13F | Susquehanna International Group, Llp | Put | 70.200 | -68,45 | 19.954 | -70,95 | |||
| 2026-04-01 | 13F | Signature Wealth Management Group | 5.385 | 210,37 | 1.130 | 129,01 | ||||
| 2026-02-17 | 13F | Susquehanna International Group, Llp | Call | 97.300 | -9,24 | 27.657 | -16,43 | |||
| 2026-02-12 | 13F/A | Pinebridge Investments Llc | 19.113 | 5.433 | ||||||
| 2026-02-17 | 13F | Susquehanna International Group, Llp | 36.491 | -16,81 | 10.372 | -23,40 | ||||
| 2026-02-17 | 13F | FIL Ltd | 1.106.455 | -0,39 | 314.499 | -8,29 | ||||
| 2025-11-10 | 13F | Semanteon Capital Management, LP | 0 | -100,00 | 0 | -100,00 | ||||
| 2026-02-13 | 13F | Knollwood Investment Advisory, LLC | 2.867 | 0,00 | 815 | -8,02 | ||||
| 2026-02-13 | 13F | Morgan Stanley | 1.134.583 | -10,60 | 322.495 | -17,69 | ||||
| 2026-02-19 | 13F | Mcguire Capital Advisors Inc | 101 | 29 | ||||||
| 2026-02-11 | 13F | Ameritas Investment Partners, Inc. | 642 | 182 | ||||||
| 2026-02-05 | 13F | Wakefield Asset Management LLLP | 965 | 0,10 | 274 | -7,74 | ||||
| 2026-04-06 | 13F | CX Institutional | 853 | -23,22 | 0 | |||||
| 2026-02-12 | 13F | Chilton Capital Management Llc | 2 | 1 | ||||||
| 2026-02-13 | 13F | National Bank Of Canada /fi/ | 45.746 | 5,07 | 13.002 | -3,27 | ||||
| 2026-02-05 | 13F | Mission Wealth Management, Lp | 2.101 | -0,28 | 597 | -8,15 | ||||
| 2025-11-03 | 13F | EFG Asset Management (North America) Corp. | 8.610 | -12,88 | 2.658 | -14,37 | ||||
| 2026-04-07 | 13F | Central Pacific Bank - Trust Division | 465 | 0,00 | 98 | -26,52 | ||||
| 2026-02-13 | 13F | First Trust Advisors Lp | 82.943 | -23,60 | 23.576 | -29,66 | ||||
| 2026-02-10 | 13F | KERR FINANCIAL PLANNING Corp | 29 | 0,00 | 7 | -22,22 | ||||
| 2026-02-12 | 13F | Aviva Plc | 58.694 | 5,57 | 16.683 | -2,80 | ||||
| 2025-11-05 | 13F | Optimize Financial Inc | 0 | -100,00 | 0 | |||||
| 2026-02-11 | 13F | Cedar Mountain Advisors, LLC | 9 | 0,00 | 3 | 0,00 | ||||
| 2026-04-20 | 13F | Kestra Private Wealth Services, Llc | 0 | -100,00 | 0 | |||||
| 2026-02-12 | 13F | Cloud Capital Management, LLC | 0 | -100,00 | 0 | |||||
| 2026-02-13 | 13F | Arkadios Wealth Advisors | 1.741 | -5,33 | 495 | -12,87 | ||||
| 2026-02-17 | 13F | Pinnacle Financial Partners, Inc. | 4.960 | 1.410 | ||||||
| 2026-02-10 | 13F | CIBC Asset Management Inc | 16.526 | 70,28 | 4.697 | 56,78 | ||||
| 2026-02-02 | 13F | Principal Financial Group Inc | 81.033 | 2,37 | 23.033 | -5,76 | ||||
| 2026-02-17 | 13F | NorthRock Partners, LLC | 0 | -100,00 | 0 | |||||
| 2026-02-10 | 13F | CIBC World Markets Inc. | 5.286 | 1.502 | ||||||
| 2025-11-14 | 13F | Perceptive Advisors Llc | 0 | -100,00 | 0 | |||||
| 2026-02-12 | 13F | Adviser Investments LLC | 0 | -100,00 | 0 | |||||
| 2026-01-30 | 13F/A | M&t Bank Corp | 10.289 | 8,94 | 2.924 | 0,27 | ||||
| 2026-02-12 | 13F | Callan Family Office, LLC | 1.462 | 34,38 | 416 | 23,88 | ||||
| 2026-02-17 | 13F | Advisory Services Network, LLC | 0 | -100,00 | 0 | |||||
| 2026-04-07 | 13F | CoreCap Advisors, LLC | 9 | -10,00 | 2 | -50,00 | ||||
| 2026-02-09 | 13F | Hartland & Co., LLC | 745 | 200,40 | 212 | 177,63 | ||||
| 2026-01-26 | 13F | KBC Group NV | 111.502 | 80,58 | 32 | 63,16 | ||||
| 2026-02-10 | 13F | Bridges Investment Management Inc | 1.102 | 37,41 | 313 | 26,72 | ||||
| 2026-02-19 | 13F | Claris Financial LLC | 2.000 | 0,00 | 568 | -7,94 | ||||
| 2026-04-14 | 13F | Perpetual Ltd | 1.695 | 40,20 | 356 | 3,50 | ||||
| 2026-02-12 | 13F | Hudock, Inc. | 785 | 0,00 | 223 | -7,85 | ||||
| 2026-02-02 | 13F | Kornitzer Capital Management Inc /ks | 18.500 | 0,00 | 5.258 | -7,93 | ||||
| 2025-11-14 | 13F | PineBridge Investments, L.P. | 0 | -100,00 | 0 | |||||
| 2026-02-05 | 13F | Allworth Financial LP | 396 | -1,49 | 113 | -9,68 | ||||
| 2026-02-17 | 13F | Qube Research & Technologies Ltd | 498.131 | -13,27 | 141.589 | -20,15 | ||||
| 2026-02-17 | 13F | D. E. Shaw & Co., Inc. | Put | 0 | -100,00 | 0 | ||||
| 2026-04-13 | 13F | IFP Advisors, Inc | 1.434 | -9,01 | 301 | -32,89 | ||||
| 2026-02-11 | 13F | Meiji Yasuda Life Insurance Co | 7.137 | -0,76 | 2.029 | -8,65 | ||||
| 2026-02-12 | 13F | Dimensional Fund Advisors Lp | 355.117 | 8,06 | 100.946 | -0,51 | ||||
| 2025-11-05 | 13F | SlateStone Wealth, LLC | 0 | -100,00 | 0 | |||||
| 2026-04-16 | 13F | Brookstone Capital Management | 3.499 | 39,35 | 734 | 2,95 | ||||
| 2026-02-12 | 13F | Sit Investment Associates Inc | 0 | -100,00 | 0 | |||||
| 2026-04-22 | 13F | James Hambro & Partners | 0 | -100,00 | 0 | |||||
| 2026-04-13 | 13F | Gradient Investments LLC | 72.658 | 5,06 | 15.247 | -22,44 | ||||
| 2026-01-30 | 13F | Catalytic Wealth RIA, LLC | 0 | -100,00 | 0 | |||||
| 2026-02-19 | 13F | CI Private Wealth, LLC | 112.245 | 938,06 | 4.133 | 23,82 | ||||
| 2026-02-11 | 13F | Winnow Wealth Llc | 3.067 | 9,97 | 874 | 1,51 | ||||
| 2026-02-17 | 13F | Millennium Management Llc | Call | 0 | -100,00 | 0 | ||||
| 2026-02-06 | 13F | Empirical Asset Management, LLC | 0 | -100,00 | 0 | -100,00 | ||||
| 2026-02-13 | 13F | Bank Of Nova Scotia | 74.403 | 758,86 | 21.148 | 690,88 | ||||
| 2026-02-17 | 13F | Ancora Advisors, LLC | 68 | 19 | ||||||
| 2025-11-14 | 13F | Volterra Technologies LP | Call | 0 | -100,00 | 0 | -100,00 | |||
| 2026-02-13 | 13F | Umb Bank N A/mo | 294 | 2,80 | 84 | -5,68 | ||||
| 2026-02-13 | 13F | Palisade Asset Management, LLC | 0 | -100,00 | 0 | |||||
| 2026-02-05 | 13F | Stephens Investment Management Group LLC | 141.052 | 0,16 | 40.093 | -7,78 | ||||
| 2026-02-13 | 13F | Y-Intercept (Hong Kong) Ltd | 14.338 | 8,31 | 4.075 | -0,27 | ||||
| 2026-01-28 | 13F | Arizona State Retirement System | 19.288 | -7,87 | 5.482 | -15,18 | ||||
| 2026-02-17 | 13F | Ameriflex Group, Inc. | 13 | -50,00 | 4 | -62,50 | ||||
| 2026-02-13 | 13F | Resources Investment Advisors, LLC. | 26.966 | 14,03 | 7.665 | 4,99 | ||||
| 2026-02-17 | 13F | Alliancebernstein L.p. | 89.603 | -4,17 | 25.469 | -11,78 | ||||
| 2026-02-12 | 13F | Jane Street Group, Llc | Call | 20.600 | -41,48 | 5.855 | -46,12 | |||
| 2026-02-12 | 13F | Jane Street Group, Llc | 81.346 | -60,99 | 23.122 | -64,09 | ||||
| 2026-02-02 | 13F | Alliance Wealth Advisors, LLC /UT | 2.601 | -27,41 | 739 | -33,18 | ||||
| 2026-01-23 | 13F | Nbt Bank N A /ny | 140 | -15,15 | 40 | -22,00 | ||||
| 2026-02-12 | 13F | Jane Street Group, Llc | Put | 51.700 | -56,26 | 14.695 | -59,73 | |||
| 2026-02-17 | 13F | Numerai GP LLC | 0 | -100,00 | 0 | |||||
| 2026-01-23 | 13F | Sage Mountain Advisors LLC | 0 | -100,00 | 0 | -100,00 | ||||
| 2026-01-27 | 13F | Lecap Asset Management Ltd | 8.929 | 2.538 | ||||||
| 2026-01-28 | 13F | Salomon & Ludwin, LLC | 1 | -96,88 | 0 | -100,00 | ||||
| 2026-02-13 | 13F | Integrated Wealth Concepts LLC | 1.967 | -46,26 | 559 | -50,53 | ||||
| 2026-02-17 | 13F | Two Sigma Securities, Llc | 0 | -100,00 | 0 | |||||
| 2026-02-13 | 13F | University Of Texas/texas Am Investment Managment Co | 92 | 26 | ||||||
| 2026-02-03 | 13F | Fulcrum Asset Management LLP | 7.808 | 4.556 | ||||||
| 2026-02-13 | 13F | Sargent Investment Group, LLC | 2.370 | 674 | ||||||
| 2026-02-13 | 13F | Silvant Capital Management LLC | 15.620 | 1,40 | 4.440 | -6,65 | ||||
| 2026-04-16 | 13F | Diversified Trust Co | 1.841 | -77,28 | 386 | -83,23 | ||||
| 2026-02-10 | 13F | Intech Investment Management Llc | 25.214 | -48,40 | 7.167 | -52,50 | ||||
| 2026-04-24 | 13F | Keybank National Association/oh | 1.323 | 52,60 | 278 | 12,60 | ||||
| 2026-02-04 | 13F | Katamaran Capital LLP | 18.260 | 5.190 | ||||||
| 2026-03-12 | 13F/A | Peak6 Llc | Call | 0 | -100,00 | 0 | -100,00 | |||
| 2026-04-16 | 13F | E. Ohman J:or Asset Management AB | 2.100 | -20,75 | 441 | -41,57 | ||||
| 2026-03-12 | 13F/A | Peak6 Llc | 0 | -100,00 | 0 | |||||
| 2026-01-26 | 13F | Reyes Financial Architecture, Inc. | 292 | -17,75 | 83 | -24,77 | ||||
| 2026-02-02 | 13F | Breakwater Investment Management | 0 | -100,00 | 0 | |||||
| 2026-04-23 | 13F | iA Global Asset Management Inc. | 10.710 | 45,20 | 2 | 0,00 | ||||
| 2025-11-26 | 13F/A | Evelyn Partners Investment Management LLP | 0 | -100,00 | 0 | -100,00 | ||||
| 2026-02-06 | 13F | Global Retirement Partners, LLC | 391 | 57,03 | 111 | 46,05 | ||||
| 2026-04-07 | 13F | Signaturefd, Llc | 1.815 | 6,26 | 381 | -21,65 | ||||
| 2026-02-17 | 13F | Ameriprise Financial Inc | 492.860 | -0,37 | 140.090 | -8,26 | ||||
| 2026-02-17 | 13F | Two Sigma Advisers, Lp | 87.380 | 48,35 | 24.837 | 36,58 | ||||
| 2026-02-17 | 13F | Quantinno Capital Management LP | 166.563 | 38,49 | 47.344 | 27,51 | ||||
| 2026-02-03 | 13F | Alecta Pensionsforsakring, Omsesidigt | 365.000 | 0,00 | 103.700 | -7,97 | ||||
| 2026-04-08 | 13F | Sax Wealth Advisors, Llc | 2.398 | -22,60 | 682 | -22,61 | ||||
| 2026-02-03 | 13F | Ballentine Partners, LLC | 2.001 | -1,19 | 569 | -9,12 | ||||
| 2026-02-11 | 13F | Capital Research Global Investors | 4.408.972 | -3,08 | 1.253.224 | -10,77 | ||||
| 2026-02-12 | 13F | CIBC Private Wealth Group, LLC | 4.508 | -6,24 | 1.281 | -13,68 | ||||
| 2026-02-10 | 13F | Private Wealth Asset Management, LLC | 1 | 0,00 | 0 | |||||
| 2026-02-13 | 13F | BNP Paribas Asset Management Holding S.A. | 258.775 | 74 | ||||||
| 2026-02-12 | 13F | Nuveen, LLC | 234.485 | 1,17 | 66.650 | -6,86 | ||||
| 2026-02-17 | 13F | MIRAE ASSET GLOBAL ETFS HOLDINGS Ltd. | 19.044 | -9,62 | 5.413 | -16,77 | ||||
| 2026-01-05 | 13F | Chesapeake Asset Management Llc | 1 | 0,00 | 0 | |||||
| 2026-02-23 | 13F | Kera Capital Partners, Inc. | 1.966 | 91,99 | 503 | 58,86 | ||||
| 2026-02-13 | 13F | Kayne Anderson Rudnick Investment Management Llc | 134.760 | -19,34 | 38.304 | -25,74 | ||||
| 2026-01-26 | 13F | MOKAN Wealth Management Inc. | 916 | 39,85 | 260 | 28,71 | ||||
| 2025-10-31 | 13F | Symphony Financial, Ltd. Co. | 0 | -100,00 | 0 | -100,00 | ||||
| 2026-02-10 | 13F | Ellevest, Inc. | 0 | -100,00 | 0 | |||||
| 2026-02-17 | 13F | XTX Topco Ltd | 13.521 | 204,73 | 3.843 | 180,72 | ||||
| 2026-02-17 | 13F | Janus Henderson Group Plc | 91.104 | 1.160,43 | 25.895 | 1.060,65 | ||||
| 2026-02-05 | 13F | North Dakota State Investment Board | 2.404 | 683 | ||||||
| 2026-02-24 | 13F/A | Pacer Advisors, Inc. | 5.556 | -6,70 | 1.579 | -14,09 | ||||
| 2026-02-17 | 13F | Bellevue Group AG | 186.699 | -11,94 | 53.067 | -18,92 | ||||
| 2026-01-29 | 13F | Sanctuary Advisors, LLC | 2.926 | -8,10 | 832 | -15,38 | ||||
| 2026-02-10 | 13F | Main Management ETF Advisors, LLC | 5.481 | 1,03 | 2 | 0,00 | ||||
| 2026-02-09 | 13F | Legal & General Group Plc | 331.147 | -2,05 | 94.125 | -9,82 | ||||
| 2025-11-14 | 13F | Science & Technology Partners, L.P. | 0 | -100,00 | 0 | |||||
| 2026-02-04 | 13F | Securian Asset Management, Inc | 1.903 | -44,78 | 541 | -49,20 | ||||
| 2026-02-12 | 13F | Qtron Investments LLC | 0 | -100,00 | 0 | |||||
| 2026-02-09 | 13F | Allstate Corp | 5.247 | 110,30 | 1.491 | 93,64 | ||||
| 2026-02-09 | 13F | New Age Alpha Advisors, LLC | 3.850 | 0,23 | 1.094 | -7,68 | ||||
| 2026-02-05 | 13F | S&co Inc | 6.385 | 0,00 | 2 | 0,00 | ||||
| 2026-02-12 | 13F | Soleus Capital Management, L.P. | 150.000 | 42.636 | ||||||
| 2026-02-11 | 13F | SOUTH STATE Corp | 5 | -50,00 | 1 | -66,67 | ||||
| 2026-02-13 | 13F | Itau Unibanco Holding S.A. | 0 | -100,00 | 0 | |||||
| 2026-04-23 | 13F | Interchange Capital Partners, LLC | 0 | -100,00 | 0 | |||||
| 2026-02-06 | 13F | Tredje AP-fonden | 7.742 | -13,02 | 2.201 | -19,94 | ||||
| 2026-02-10 | 13F | National Pension Service | 4.008 | 184,46 | 1.139 | 161,84 | ||||
| 2026-02-12 | 13F | Rossby Financial, LCC | 16 | 60,00 | 5 | 33,33 | ||||
| 2026-02-06 | 13F | HighTower Advisors, LLC | 7.921 | 211,36 | 2.251 | 186,75 | ||||
| 2026-02-12 | 13F | Great Lakes Advisors, Llc | 2.784 | 1,46 | 791 | -6,61 | ||||
| 2026-02-19 | 13F/A | Vancity Investment Management Ltd | 1.908 | -19,93 | 1 | |||||
| 2026-01-26 | 13F | Whittier Trust Co Of Nevada Inc | 88 | -32,82 | 26 | -37,50 | ||||
| 2026-04-22 | 13F | Goodman Advisory Group, LLC | 8.620 | 31,40 | 1.809 | -3,00 | ||||
| 2026-04-23 | 13F | Ami Asset Management Corp | 150.335 | -3,21 | 31.546 | -28,55 | ||||
| 2026-02-13 | 13F | Wealth Alliance | 936 | -3,01 | 266 | -10,44 | ||||
| 2026-01-27 | 13F | Asset Management One Co., Ltd. | 76.594 | 99,46 | 21.948 | 85,11 | ||||
| 2026-02-13 | 13F | Alyeska Investment Group, L.P. | 0 | -100,00 | 0 | |||||
| 2026-04-15 | 13F | Hartford Investment Management Co | 4.025 | -1,18 | 845 | -27,05 | ||||
| 2026-02-06 | 13F | Bare Financial Services, Inc | 7 | 0,00 | 2 | -50,00 | ||||
| 2026-02-10 | 13F | SBI Okasan Asset Management Co.Ltd. | 5.836 | 1.677 | ||||||
| 2026-02-13 | 13F | Entropy Technologies, LP | 0 | -100,00 | 0 | |||||
| 2026-02-10 | 13F | Forsta Ap-fonden | 46.220 | 53,55 | 13.138 | 41,38 | ||||
| 2026-01-30 | 13F | WoodTrust Financial Corp | 2.665 | 0,00 | 1 | |||||
| 2026-02-05 | 13F | DnB Asset Management AS | 58.161 | 21,14 | 16.532 | 11,52 | ||||
| 2026-02-10 | 13F | Vantus Wealth LLC | 799 | 227 | ||||||
| 2026-02-12 | 13F | Brown Brothers Harriman & Co | 168 | -25,99 | 48 | -32,86 | ||||
| 2025-11-14 | 13F | Axa S.a. | 0 | -100,00 | 0 | -100,00 | ||||
| 2026-02-13 | 13F | Aigen Investment Management, Lp | 1.020 | 290 | ||||||
| 2026-02-11 | 13F | Livforsakringsbolaget Skandia, Omsesidigt | 600 | 0,00 | 170 | -8,11 | ||||
| 2026-02-09 | 13F | Jefferies Financial Group Inc. | 13.361 | 132,00 | 3.798 | 113,67 | ||||
| 2026-01-23 | 13F | Ogorek Anthony Joseph /ny/ /adv | 67 | 1.575,00 | 0 | |||||
| 2026-02-13 | 13F | Brown Advisory Inc | 29.080 | 10,56 | 8.266 | 1,79 | ||||
| 2026-04-23 | 13F | Harbor Investment Advisory, Llc | 0 | -100,00 | 0 | |||||
| 2025-11-14 | 13F | First Turn Management, LLC | 0 | -100,00 | 0 | |||||
| 2026-02-10 | 13F | Gulf International Bank (UK) Ltd | 3.466 | 0,00 | 1 | -100,00 | ||||
| 2026-02-04 | 13F | Plato Investment Management Ltd | 2.356 | 0,00 | 673 | -6,80 | ||||
| 2026-02-13 | 13F | A4 Wealth Advisors LLC | 0 | -100,00 | 0 | |||||
| 2026-02-03 | 13F | Everence Capital Management Inc | 890 | -65,61 | 0 | |||||
| 2026-04-02 | 13F | MJT & Associates Financial Advisory Group, Inc. | 13 | 18,18 | 3 | -33,33 | ||||
| 2026-02-17 | 13F | Tower Research Capital LLC (TRC) | 1.060 | -44,73 | 301 | -49,16 | ||||
| 2026-02-13 | 13F | Osmosis Investment Management UK Ltd | 3.132 | 890 | ||||||
| 2026-02-17 | 13F | Deerfield Management Company, L.p. (series C) | 10.616 | 136,96 | 3.017 | 118,15 | ||||
| 2026-02-17 | 13F | Worldquant Millennium Advisors Llc | 299.735 | 29,90 | 85.197 | 19,60 | ||||
| 2026-02-12 | 13F | Principal Securities, Inc. | 0 | -100,00 | 0 | -100,00 | ||||
| 2026-02-06 | 13F | Meiji Yasuda Asset Management Co Ltd. | 15.696 | -7,09 | 4.461 | -14,46 | ||||
| 2026-01-16 | 13F | Empirical Financial Services, LLC d.b.a. Empirical Wealth Management | 979 | 278 | ||||||
| 2026-01-30 | 13F | Torren Management, LLC | 19 | 5 | ||||||
| 2026-02-11 | 13F | Primecap Management Co/ca/ | 103.580 | -16,54 | 29.442 | -23,16 | ||||
| 2026-02-17 | 13F | Scientech Research LLC | 2.143 | -57,31 | 609 | -60,68 | ||||
| 2026-02-17 | 13F | Cinctive Capital Management LP | 5.546 | -74,40 | 1.576 | -76,43 | ||||
| 2026-04-17 | 13F | Fifth Third Wealth Advisors LLC | 1.605 | 11,23 | 337 | -18,05 | ||||
| 2026-02-13 | 13F | Change Path, LLC | 4.321 | 20,83 | 1.228 | 11,23 | ||||
| 2026-02-02 | 13F | Horizon Investments, LLC | 3.235 | -58,16 | 920 | -61,48 | ||||
| 2026-02-06 | 13F | Addison Advisors LLC | 0 | -100,00 | 0 | |||||
| 2026-02-13 | 13F | Charles Schwab Investment Management Inc | 522.470 | 2,03 | 148.507 | -6,06 | ||||
| 2026-02-13 | 13F | Bridgefront Capital, LLC | 0 | -100,00 | 0 | |||||
| 2026-04-13 | 13F | Creative Financial Designs Inc /adv | 533 | 14,87 | 112 | -15,27 | ||||
| 2026-02-17 | 13F | Angeles Wealth Management, Llc | 2.589 | 0,50 | 736 | -7,55 | ||||
| 2026-04-21 | 13F | PDS Planning, Inc | 0 | -100,00 | 0 | |||||
| 2026-02-17 | 13F | Coastal Bridge Advisors, LLC | 0 | -100,00 | 0 | |||||
| 2026-02-17 | 13F | Advisor Group Holdings, Inc. | 26.155 | -14,57 | 7.434 | -23,12 | ||||
| 2025-11-14 | 13F | Truvestments Capital Llc | 0 | -100,00 | 0 | |||||
| 2026-01-23 | 13F | Avion Wealth | 26 | 8,33 | 0 | |||||
| 2026-01-30 | 13F | New York State Teachers Retirement System | 61.330 | -1,12 | 17 | -10,53 | ||||
| 2026-02-06 | 13F | Abn Amro Investment Solutions | 2.928 | 242,06 | 832 | 215,15 | ||||
| 2026-04-20 | 13F | Contravisory Investment Management, Inc. | 0 | -100,00 | 0 | |||||
| 2026-04-21 | 13F | Robeco Institutional Asset Management B.V. | 180.695 | -16,16 | 37.917 | -38,10 | ||||
| 2026-01-26 | 13F | Consolidated Portfolio Review Corp | 0 | -100,00 | 0 | |||||
| 2026-04-14 | 13F | Bay Harbor Wealth Management, LLC | 6 | 0,00 | 1 | 0,00 | ||||
| 2026-02-05 | 13F | LGT Fund Management Co Ltd. | 0 | -100,00 | 0 | |||||
| 2026-01-30 | 13F | Wealthfront Advisers Llc | 5.738 | -27,16 | 1.631 | -32,98 | ||||
| 2026-02-17 | 13F | Adage Capital Partners Gp, L.l.c. | 3.500 | -75,18 | 995 | -77,17 | ||||
| 2026-02-13 | 13F | Evelyn Partners Investment Management Services Ltd | 425 | 0,00 | 121 | -8,40 | ||||
| 2026-02-06 | 13F | Cullen/frost Bankers, Inc. | 2 | 1 | ||||||
| 2026-04-16 | 13F | SG Americas Securities, LLC | Put | 293.000 | 62,78 | 5 | ||||
| 2026-02-03 | 13F | Strengthening Families & Communities, LLC | 4 | 0,00 | 1 | 0,00 | ||||
| 2026-04-20 | 13F | Yorktown Management & Research Co Inc | 1.300 | 273 | ||||||
| 2026-02-17 | 13F | Amundi | 390.693 | 13,54 | 111.051 | 3,54 | ||||
| 2026-01-15 | 13F | J. Safra Sarasin Holding AG | 7.473 | 2.124 | ||||||
| 2026-01-28 | 13F | B. Metzler seel. Sohn & Co. AG | 5.210 | 40,32 | 1.481 | 29,14 | ||||
| 2026-02-10 | 13F | Goldman Sachs Group Inc | 768.066 | 1,35 | 218.315 | -6,69 | ||||
| 2025-11-10 | 13F | Advisors Preferred, LLC | 0 | -100,00 | 0 | |||||
| 2026-04-24 | 13F | Root Financial Partners, LLC | 94 | 11,90 | 20 | -17,39 | ||||
| 2026-02-12 | 13F | Wealthspire Advisors, LLC | 0 | -100,00 | 0 | |||||
| 2026-02-09 | 13F | Geode Capital Management, Llc | 2.006.413 | 2,09 | 568.274 | -5,99 | ||||
| 2026-04-14 | 13F | Juncture Wealth Strategies, Llc | 0 | -100,00 | 0 | |||||
| 2025-11-14 | 13F | Strategic Wealth Partners, Ltd. | 559 | 173 | ||||||
| 2026-01-29 | 13F | IMC-Chicago, LLC | 0 | -100,00 | 0 | -100,00 | ||||
| 2026-01-30 | 13F | Bogart Wealth, LLC | 39.499 | 15,75 | 11.227 | 6,57 | ||||
| 2026-02-14 | 13F | Rockefeller Capital Management L.P. | 3.343 | 488,56 | 950 | 442,86 | ||||
| 2026-02-17 | 13F | SageView Advisory Group, LLC | 50 | 14 | ||||||
| 2026-01-21 | 13F | Prime Capital Investment Advisors, LLC | 902 | 10,13 | 256 | 1,59 | ||||
| 2026-02-12 | 13F | Brinker Capital Investments, LLC | 1.569 | 2,15 | 446 | -6,12 | ||||
| 2026-02-09 | 13F | Employees Retirement System of Texas | 8.342 | 15,06 | 2 | 0,00 | ||||
| 2026-02-03 | 13F | Garner Asset Management Corp | 75 | 21 | ||||||
| 2026-03-06 | 13F | Hsbc Holdings Plc | 124.514 | -32,29 | 35.424 | -37,58 | ||||
| 2026-02-10 | 13F | Bank of New York Mellon Corp | 398.735 | -2,52 | 113.336 | -10,26 | ||||
| 2026-02-09 | 13F | Hantz Financial Services, Inc. | 804 | 1,39 | 0 | |||||
| 2026-04-17 | 13F | Vermillion Wealth Management, Inc. | 3 | 1 | ||||||
| 2026-02-09 | 13F | Mizuho Securities Usa Llc | 5.122 | -0,10 | 1.676 | -3,85 | ||||
| 2026-02-17 | 13F | Howard Hughes Medical Institute | 15 | 0,00 | 4 | 0,00 |