Grundlæggende statistik
| Institutionelle aktier (lange) | 70.188.178 - 108,67% (ex 13D/G) - change of -4,73MM shares -6,32% MRQ |
| Institutionel værdi (lang) | $ 2.422.198 USD ($1000) |
Institutionelt ejerskab og aktionærer
Kinetik Holdings Inc. (US:KNTK) har 310 institutionelle ejere og aktionærer, der har indsendt 13D/G- eller 13F-formularer til Securities Exchange Commission (SEC). Disse institutioner har i alt 70,188,178 aktier. Største aktionærer omfatter Blackstone Group Inc, BlackRock, Inc., Vanguard Group Inc, Goldman Sachs Group Inc, Morgan Stanley, Zimmer Partners, LP, Neuberger Berman Group LLC, Cohen & Steers, Inc., Cushing Asset Management, Lp, and Invesco Ltd. .
Kinetik Holdings Inc. (NYSE:KNTK) institutionel ejerskabsstruktur viser aktuelle positioner i virksomheden efter institutioner og fonde, samt seneste ændringer i positionsstørrelse. Større aktionærer kan omfatte individuelle investorer, investeringsforeninger, hedgefonde eller institutioner. Skema 13D angiver, at investoren besidder (eller besidder) mere end 5 % af virksomheden og har til hensigt (eller har til hensigt at) aktivt at forfølge en ændring i forretningsstrategi. Skema 13G indikerer en passiv investering på over 5%.
The share price as of March 24, 2026 is 46,77 / share. Previously, on March 25, 2025, the share price was 53,14 / share. This represents a decline of 11,99% over that period.

Fondens stemningsscore
Fund Sentiment Score (fka Ownership Accumulation Score) finder de aktier, der bliver mest købt af fonde. Det er resultatet af en sofistikeret, multi-faktor kvantitativ model, der identificerer virksomheder med de højeste niveauer af institutionel akkumulering. Scoringsmodellen bruger en kombination af den samlede stigning i oplyste ejere, ændringerne i porteføljeallokeringer i disse ejere og andre målinger. Tallet går fra 0 til 100, hvor højere tal indikerer et højere niveau af akkumulering for sine jævnaldrende, og 50 er gennemsnittet.
Opdateringsfrekvens: Dagligt
Se Ownership Explorer, som giver en liste over højest rangerende virksomheder.
AI+ Ask Fintel’s AI assistant about Kinetik Holdings Inc..
Select a question to share a public post with an AI-crafted answer.
Thinking of good questions…
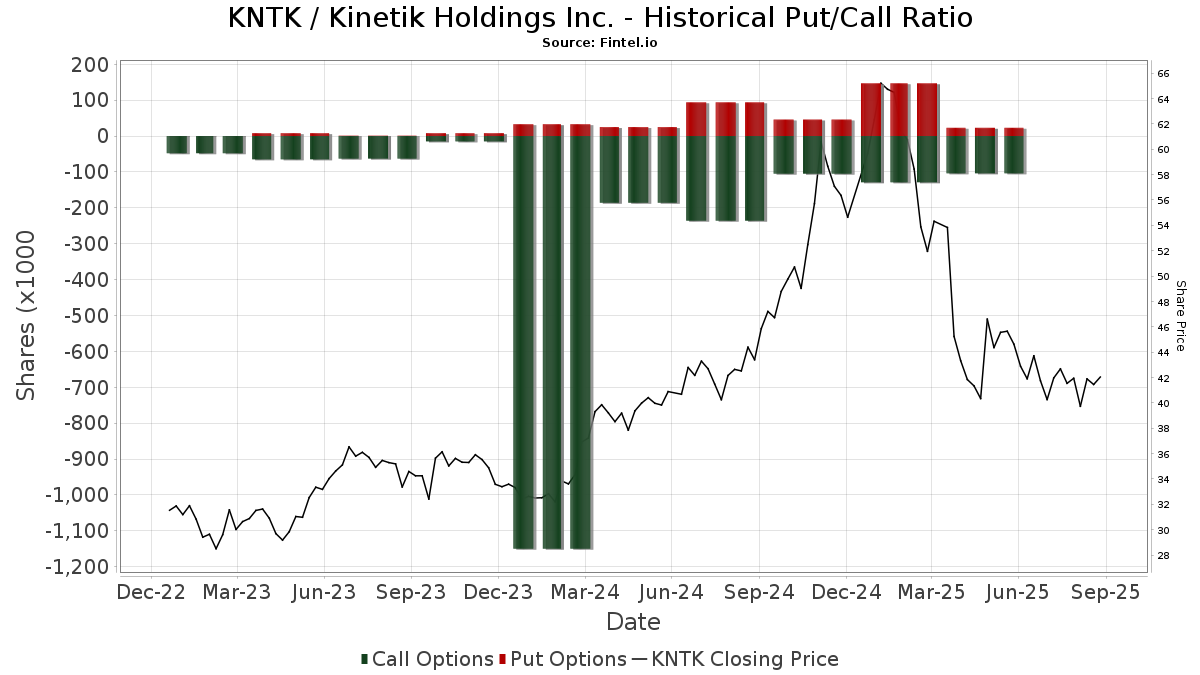
Institutionel Put/Call-forhold
Ud over at indberette standardaktie- og gældsudstedelser skal institutter med mere end 100 mill. aktiver under forvaltning også oplyse deres put- og call-optionsbeholdninger. Da salgsoptioner generelt indikerer negativ stemning, og købsoptioner indikerer positiv stemning, kan vi få en fornemmelse af den overordnede institutionelle stemning ved at plotte forholdet mellem put og kald. Diagrammet til højre viser det historiske put/call-forhold for dette instrument.
Brug af Put/Call Ratio som en indikator for investorernes stemning overvinder en af de vigtigste mangler ved at bruge totalt institutionelt ejerskab, som er, at en betydelig mængde af aktiver under forvaltning investeres passivt for at spore indekser. Passivt forvaltede fonde køber typisk ikke optioner, så indikatoren for put/call-forholdet følger mere nøje følelsen af aktivt forvaltede fonde.
13D/G-arkivering
Vi præsenterer 13D/G ansøgninger separat fra 13F ansøgninger på grund af den forskellige behandling af SEC. 13D/G-ansøgninger kan indgives af grupper af investorer (med én ledende), hvorimod 13F-ansøgninger ikke kan. Dette resulterer i situationer, hvor en investor kan indsende en 13D/G, der rapporterer én værdi for de samlede aktier (der repræsenterer alle de aktier, der ejes af investorgruppen), men derefter indsender en 13F, der rapporterer en anden værdi for de samlede aktier (der udelukkende repræsenterer deres egne) ejendomsret). Det betyder, at aktieejerskab af 13D/G-arkiver og 13F-arkiveringer ofte ikke er direkte sammenlignelige, så vi præsenterer dem separat.
Bemærk: Fra den 16. maj 2021 viser vi ikke længere ejere, der ikke har indsendt en 13D/G inden for det seneste år. Tidligere viste vi den fulde historie af 13D/G-arkiver. Generelt skal enheder, der er forpligtet til at indgive 13D/G-ansøgninger, indgive mindst årligt, før de indsender en afsluttende ansøgning. Dog forlader fonde nogle gange positioner uden at indsende en afsluttende ansøgning (dvs. de afvikler), så visning af den fulde historie resulterede nogle gange i forvirring om det nuværende ejerskab. For at undgå forvirring viser vi nu kun 'aktuelle' ejere - det vil sige - ejere, der har anmeldt inden for det seneste år.
Upgrade to unlock premium data.
| Fil dato | Form | Investor | Forrige Aktier |
Seneste Aktier |
Δ Aktier (Procent) |
Ejendomsret (Procent) |
Δ Ejerskab (Procent) |
|
|---|---|---|---|---|---|---|---|---|
| 2026-03-02 | ISQ Global Fund II GP LLC | 24,169,892 | 20,169,892 | -16.55 | 23.10 | -16.00 | ||
| 2025-10-31 | VANGUARD GROUP INC | 3,929,472 | 4,657,200 | 18.52 | 7.57 | 15.22 | ||
| 2025-09-04 | BlackRock, Inc. | 3,515,124 | 6,421,844 | 82.69 | 10.40 | 76.27 | ||
| 2025-08-14 | GOLDMAN SACHS ASSET MANAGEMENT, L.P. | 4,615,445 | 7.60 | |||||
| 2025-05-06 | MORGAN STANLEY | 4,093,752 | 253,506 | -93.81 | 0.40 | -93.75 |
13F og NPORT arkivering
Detaljer om 13F-arkivering er gratis. Detaljer om NP-ansøgninger kræver et premium-medlemskab. Grønne rækker angiver nye positioner. Røde rækker angiver lukkede positioner. Klik på linket ikon for at se den fulde transaktionshistorik.
Opgrader
for at låse premium-data op og eksportere til Excel ![]() .
.
| Fil dato | Kilde | Investor | Type | Gennemsnitlig pris (Øst) |
Aktier | Δ Aktier (%) |
Rapporteret Værdi ($1000) |
Δ Værdi (%) |
Port Alloc (%) |
|
|---|---|---|---|---|---|---|---|---|---|---|
| 2026-02-17 | 13F | Wellington Management Group Llp | 1.608.403 | 149,65 | 57.983 | 110,57 | ||||
| 2025-11-14 | 13F | Credit Agricole S A | 0 | -100,00 | 0 | |||||
| 2026-01-26 | 13F | Duff & Phelps Investment Management Co | 171.094 | 380,90 | 6.168 | 305,72 | ||||
| 2026-02-11 | 13F | Janney Montgomery Scott LLC | 52.556 | -17,01 | 2 | -50,00 | ||||
| 2026-02-12 | 13F | Ci Investments Inc. | 0 | -100,00 | 0 | |||||
| 2026-02-05 | 13F | Td Private Client Wealth Llc | 33 | 0,00 | 1 | 0,00 | ||||
| 2026-02-13 | 13F | Ubs Asset Management Americas Inc | 83.014 | -3,77 | 2.993 | -18,83 | ||||
| 2026-02-17 | 13F | Russell Investments Group, Ltd. | 54.949 | -3,58 | 1.981 | -18,69 | ||||
| 2025-11-14 | 13F | Unisphere Establishment | 0 | -100,00 | 0 | |||||
| 2026-02-13 | 13F | Macquarie Group Ltd | 0 | -100,00 | 0 | |||||
| 2025-11-14 | 13F | Petrus Trust Company, LTA | 0 | -100,00 | 0 | |||||
| 2025-09-26 | NP | JHMM - John Hancock Multifactor Mid Cap ETF | 14.018 | -0,50 | 608 | 4,47 | ||||
| 2026-01-28 | 13F | Arizona State Retirement System | 12.917 | -4,46 | 466 | -19,41 | ||||
| 2026-02-17 | 13F | Interval Partners, LP | 53.622 | 26,06 | 1.933 | 6,38 | ||||
| 2025-11-13 | 13F | Hsbc Holdings Plc | 0 | -100,00 | 0 | |||||
| 2026-02-17 | 13F | MIRAE ASSET GLOBAL ETFS HOLDINGS Ltd. | 481.339 | 13,83 | 17.352 | -3,98 | ||||
| 2026-02-12 | 13F | Gould Capital, LLC | 0 | -100,00 | 0 | |||||
| 2026-02-12 | 13F | Nuveen, LLC | 81.568 | -3,79 | 2.941 | -18,85 | ||||
| 2025-09-25 | NP | JPSE - JPMorgan Diversified Return U.S. Small Cap Equity ETF | 21.307 | 21,32 | 924 | 27,27 | ||||
| 2025-09-26 | NP | BlackRock Funds II - BlackRock Dynamic High Income Portfolio Investor A This fund is a listed as child fund of BlackRock, Inc. and if that institution has disclosed ownership in this security, then these positions will not be double counted when calculating total shares and total value | 2.092 | 91 | ||||||
| 2026-02-17 | 13F | California State Teachers Retirement System | 44.773 | -7,13 | 1.614 | -21,65 | ||||
| 2025-10-31 | 13F | JustInvest LLC | 0 | -100,00 | 0 | -100,00 | ||||
| 2026-02-05 | 13F | Bessemer Group Inc | 0 | -100,00 | 0 | |||||
| 2026-01-28 | 13F | CAPROCK Group, Inc. | 0 | -100,00 | 0 | |||||
| 2026-01-14 | 13F | WESPAC Advisors, LLC | 21.896 | 789 | ||||||
| 2025-11-14 | 13F | T. Rowe Price Investment Management, Inc. | 0 | -100,00 | 0 | |||||
| 2026-02-17 | 13F | NEOS Investment Management LLC | 26.725 | 963 | ||||||
| 2026-02-17 | 13F | Captrust Financial Advisors | 8.420 | 4,86 | 304 | -11,66 | ||||
| 2026-02-12 | 13F | Castleark Management Llc | 10.370 | -29,50 | 374 | -40,61 | ||||
| 2026-01-28 | 13F | Salomon & Ludwin, LLC | 362 | 1,40 | 13 | 0,00 | ||||
| 2026-02-05 | 13F | Thrivent Financial For Lutherans | 31.236 | -0,80 | 1 | 0,00 | ||||
| 2025-09-26 | NP | FSSNX - Fidelity Small Cap Index Fund This fund is a listed as child fund of Fmr Llc and if that institution has disclosed ownership in this security, then these positions will not be double counted when calculating total shares and total value | 446.257 | 15,10 | 19.359 | 20,78 | ||||
| 2026-02-05 | 13F | HFM Investment Advisors, LLC | 1 | -50,00 | 0 | |||||
| 2026-02-12 | 13F | BlackRock, Inc. | 7.343.975 | 0,66 | 264.750 | -15,09 | ||||
| 2026-01-05 | 13F | GAMMA Investing LLC | 1.761 | 569,58 | 63 | 472,73 | ||||
| 2026-02-10 | 13F | Waterloo Capital, L.P. | 11.999 | -7,53 | 433 | -22,02 | ||||
| 2025-11-14 | 13F | Walleye Capital LLC | 0 | -100,00 | 0 | |||||
| 2026-01-28 | 13F | Teacher Retirement System Of Texas | 0 | -100,00 | 0 | |||||
| 2025-09-29 | NP | INVESCO ACTIVELY MANAGED EXCHANGE-TRADED FUND TRUST - Invesco SteelPath MLP & Energy Infrastructure ETF | 23.453 | 119,99 | 1.017 | 131,14 | ||||
| 2026-01-22 | 13F | Red Tortoise LLC | 49 | 0,00 | 2 | -50,00 | ||||
| 2026-02-09 | 13F | Legal & General Group Plc | 117.720 | 0,52 | 4.244 | -15,22 | ||||
| 2025-09-26 | NP | Ultimus Managers Trust - Westwood Salient Enhanced Midstream Income ETF | 89.544 | 53,43 | 3.884 | 61,03 | ||||
| 2026-01-22 | 13F | Bartlett & Co. Wealth Management Llc | 675 | 0,00 | 24 | -14,29 | ||||
| 2026-01-16 | 13F | Louisiana State Employees Retirement System | 20.800 | 3,48 | 750 | -12,81 | ||||
| 2026-02-03 | 13F | Farmers & Merchants Investments Inc | 20 | 0,00 | 1 | |||||
| 2026-02-02 | 13F | Cornerstone Planning Group LLC | 0 | -100,00 | 0 | |||||
| 2026-02-12 | 13F | Dividend Asset Capital, Llc | 17.563 | 7,12 | 633 | -9,57 | ||||
| 2026-01-23 | 13F | Diversify Advisory Services, LLC | 32.389 | 4,10 | 1.252 | 5,84 | ||||
| 2026-02-17 | 13F | Balyasny Asset Management Llc | 49.532 | 33,16 | 1.786 | 12,33 | ||||
| 2026-02-11 | 13F | LPL Financial LLC | 12.816 | 23,93 | 462 | 4,76 | ||||
| 2026-02-12 | 13F | Wealthspire Advisors, LLC | 0 | -100,00 | 0 | |||||
| 2026-02-13 | 13F | Recurrent Investment Advisors LLC | 11.700 | 422 | ||||||
| 2026-02-17 | 13F | Janus Henderson Group Plc | 20.406 | 0,00 | 736 | -15,61 | ||||
| 2026-02-10 | 13F | Essex Financial Services, Inc. | 18.542 | -4,19 | 668 | -19,23 | ||||
| 2025-11-14 | 13F | DRW Securities, LLC | 0 | -100,00 | 0 | -100,00 | ||||
| 2026-02-13 | 13F | BNP Paribas Asset Management Holding S.A. | 1.268 | 42,31 | 0 | |||||
| 2026-02-17 | 13F | Raymond James Financial Inc | 204.247 | 2,74 | 7.363 | -13,34 | ||||
| 2026-02-11 | 13F | Ameritas Investment Partners, Inc. | 3.703 | 133 | ||||||
| 2025-11-14 | 13F | Brevan Howard Capital Management LP | 0 | -100,00 | 0 | |||||
| 2026-02-10 | 13F | Intech Investment Management Llc | 17.690 | 0,81 | 638 | -15,07 | ||||
| 2026-02-12 | 13F | Federated Hermes, Inc. | 76.219 | -13,94 | 2.748 | -27,42 | ||||
| 2026-02-13 | 13F | Charles Schwab Investment Management Inc | 408.747 | 4,01 | 14.735 | -12,27 | ||||
| 2026-02-09 | 13F | Jefferies Financial Group Inc. | 0 | -100,00 | 0 | |||||
| 2026-02-17 | 13F | State Of Wisconsin Investment Board | 126.479 | 4,47 | 4.560 | -11,89 | ||||
| 2025-11-21 | 13F | Bell Investment Advisors, Inc | 0 | -100,00 | 0 | -100,00 | ||||
| 2025-09-29 | NP | USAI - Pacer American Energy Independence ETF | 44.725 | 14,41 | 1.940 | 20,05 | ||||
| 2025-09-29 | NP | PRFZ - Invesco FTSE RAFI US 1500 Small-Mid ETF This fund is a listed as child fund of Invesco Ltd. and if that institution has disclosed ownership in this security, then these positions will not be double counted when calculating total shares and total value | 4.903 | 110,97 | 213 | 120,83 | ||||
| 2026-02-11 | 13F | Empowered Funds, LLC | 0 | -100,00 | 0 | |||||
| 2026-02-18 | 13F | Papamarkou Wellner Asset Management inc. | 0 | -100,00 | 0 | |||||
| 2025-11-14 | 13F | Wolverine Trading, Llc | Call | 7.300 | 325 | |||||
| 2026-02-24 | 13F/A | Pacer Advisors, Inc. | 44.218 | 1,71 | 1.594 | -14,21 | ||||
| 2026-01-12 | 13F | Chickasaw Capital Management Llc | 1.137.460 | 3,55 | 41 | -10,87 | ||||
| 2026-01-08 | 13F | Versant Capital Management, Inc | 1.814 | 600,39 | 65 | 490,91 | ||||
| 2026-01-30 | 13F | Caldwell Securities, Inc | 73.235 | 0,72 | 2.640 | -15,03 | ||||
| 2026-02-17 | 13F | XTX Topco Ltd | 0 | -100,00 | 0 | |||||
| 2026-02-17 | 13F | Delaware Management Holdings, Inc. | 1.188.405 | 42.842 | ||||||
| 2025-11-14 | 13F | Wolverine Trading, Llc | 11.471 | 118,20 | 511 | 120,78 | ||||
| 2026-01-28 | 13F | Klp Kapitalforvaltning As | 17.400 | 6,10 | 627 | -10,43 | ||||
| 2026-02-13 | 13F | Caitong International Asset Management Co., Ltd | 227 | -8,47 | 8 | -20,00 | ||||
| 2026-02-17 | 13F | Zimmer Partners, LP | 2.735.400 | 98.611 | ||||||
| 2026-02-17 | 13F | Longaeva Partners L.P. | 86.364 | 8.757,85 | 3.113 | 7.492,68 | ||||
| 2026-02-17 | 13F | Massar Capital Management, LP | 11.386 | 410 | ||||||
| 2026-02-10 | 13F | Connor, Clark & Lunn Investment Management Ltd. | 37.806 | -74,84 | 1.363 | -78,79 | ||||
| 2026-02-17 | 13F | Jones Financial Companies Lllp | 100 | 4 | ||||||
| 2026-01-20 | 13F | Harbor Capital Advisors, Inc. | 267 | -1,84 | 0 | |||||
| 2025-09-26 | NP | FXSCX - Fidelity Flex Small Cap Focused Index Fund | 25 | 1 | ||||||
| 2026-01-30 | 13F | BancorpSouth Bank | 187.136 | -0,11 | 6.746 | -15,74 | ||||
| 2026-01-23 | 13F | Assetmark, Inc | 2.450 | 30.525,00 | 88 | |||||
| 2026-01-09 | 13F | SG Americas Securities, LLC | 142.476 | 641,44 | 5 | |||||
| 2025-09-29 | NP | SUNAMERICA SERIES TRUST - SA Small Cap Index Portfolio Class 1 | 5.040 | 15,97 | 219 | 21,79 | ||||
| 2025-11-14 | 13F | Engineers Gate Manager LP | 0 | -100,00 | 0 | |||||
| 2025-11-14 | 13F | Capstone Investment Advisors, Llc | 17.031 | -18,04 | 728 | -20,55 | ||||
| 2026-02-13 | 13F | Prudential Financial Inc | 42.250 | -3,87 | 1.523 | -18,90 | ||||
| 2025-11-14 | 13F | Two Sigma Advisers, Lp | 0 | -100,00 | 0 | |||||
| 2026-02-17 | 13F | Brave Warrior Advisors, LLC | 0 | -100,00 | 0 | |||||
| 2026-02-13 | 13F | Cohen & Steers, Inc. | 1.843.506 | 82,47 | 66 | 53,49 | ||||
| 2026-02-04 | 13F | Ameritas Advisory Services, LLC | 0 | -100,00 | 0 | |||||
| 2026-01-29 | 13F | Dunhill Financial, LLC | 1 | 0 | ||||||
| 2026-02-10 | 13F | Goldman Sachs Group Inc | 4.528.640 | -5,23 | 163.257 | -20,07 | ||||
| 2026-02-10 | 13F | Bnp Paribas Arbitrage, Sa | 9.782 | -3,27 | 353 | -18,52 | ||||
| 2026-02-06 | 13F | Principle Wealth Partners Llc | 0 | -100,00 | 0 | |||||
| 2025-11-14 | 13F | Wolverine Trading, Llc | Put | 0 | -100,00 | 0 | -100,00 | |||
| 2025-11-13 | 13F | Acadian Asset Management Llc | 0 | -100,00 | 0 | |||||
| 2026-02-17 | 13F | Northern Trust Corp | 439.618 | -13,60 | 15.848 | -27,13 | ||||
| 2026-02-12 | 13F | Commonwealth Equity Services, Llc | 42.568 | -4,02 | 1.535 | 153.300,00 | ||||
| 2026-01-28 | 13F | Eagle Global Advisors Llc | 668.961 | 48,66 | 24.116 | 25,40 | ||||
| 2026-02-17 | 13F | Advisory Services Network, LLC | 8.480 | 560,95 | 306 | 464,81 | ||||
| 2026-02-12 | 13F | Jane Street Group, Llc | Call | 105.600 | -30,75 | 3.807 | -41,60 | |||
| 2026-02-10 | 13F | Catalyst Capital Advisors LLC | 401.767 | -5,84 | 14.484 | -20,58 | ||||
| 2026-02-12 | 13F | Jane Street Group, Llc | Put | 7.700 | 50,98 | 278 | 27,65 | |||
| 2026-01-20 | 13F | Monticello Wealth Management, Llc | 8.982 | 0,00 | 324 | -15,67 | ||||
| 2026-01-23 | 13F | Farther Finance Advisors, LLC | 342 | 32,56 | 12 | 9,09 | ||||
| 2026-02-02 | 13F | Chung Wu Investment Group, LLC | 1.040 | -17,46 | 37 | -30,19 | ||||
| 2025-11-12 | 13F | Principal Securities, Inc. | 0 | -100,00 | 0 | |||||
| 2026-02-13 | 13F | Kestra Advisory Services, LLC | 910 | 33 | ||||||
| 2025-09-26 | NP | SMMV - iShares Edge MSCI Min Vol USA Small-Cap ETF | 0 | -100,00 | 0 | -100,00 | ||||
| 2026-02-09 | 13F | Annis Gardner Whiting Capital Advisors, LLC | 0 | -100,00 | 0 | |||||
| 2025-09-26 | NP | MGNR - American Beacon GLG Natural Resources ETF | 76.280 | -15,52 | 3.309 | -11,33 | ||||
| 2026-02-17 | 13F | Amundi | 11.870 | 428 | ||||||
| 2025-09-26 | NP | UAPIX - Ultrasmall-cap Profund Investor Class | 491 | 24,94 | 21 | 31,25 | ||||
| 2025-11-12 | 13F | TCG Advisory Services, LLC | 0 | -100,00 | 0 | -100,00 | ||||
| 2026-02-13 | 13F | Neo Ivy Capital Management | 0 | -100,00 | 0 | |||||
| 2025-09-26 | NP | EGLAX - Eagle MLP Strategy Fund Class A Shares | 107.590 | 0,61 | 4.667 | 5,59 | ||||
| 2026-02-17 | 13F | Glenmede Trust Co Na | 17.863 | 26,12 | 644 | -12,52 | ||||
| 2026-02-17 | 13F | Crawford Investment Counsel Inc | 0 | -100,00 | 0 | |||||
| 2026-02-17 | 13F | Guggenheim Capital Llc | 8.809 | 318 | ||||||
| 2026-02-17 | 13F | BlueCrest Capital Management Ltd | 0 | -100,00 | 0 | -100,00 | ||||
| 2025-09-26 | NP | GYLD - Arrow Dow Jones Global Yield ETF | 4.199 | 59,48 | 182 | 68,52 | ||||
| 2026-01-08 | 13F | Sl Advisors, Llc | 36.197 | 62,27 | 1.305 | 36,83 | ||||
| 2026-01-22 | 13F | Apollon Wealth Management, LLC | 7.579 | 26,53 | 273 | 6,64 | ||||
| 2025-09-26 | NP | John Hancock Tax-advantaged Dividend Income Fund | 255.000 | 628,57 | 11.062 | 724,83 | ||||
| 2026-02-13 | 13F | Citigroup Inc | 10.676 | -65,90 | 385 | -71,30 | ||||
| 2026-02-17 | 13F | Qube Research & Technologies Ltd | 0 | -100,00 | 0 | |||||
| 2025-11-14 | 13F | Jane Street Group, Llc | 0 | -100,00 | 0 | -100,00 | ||||
| 2026-02-09 | 13F | Huntington National Bank | 1.222 | 139,14 | 44 | 109,52 | ||||
| 2026-01-27 | 13F | First Horizon Corp | 32 | 0,00 | 1 | 0,00 | ||||
| 2026-02-12 | 13F | CIBC Private Wealth Group, LLC | 381.299 | -40,73 | 13.746 | -50,01 | ||||
| 2025-11-17 | 13F | Caxton Associates Llp | 0 | -100,00 | 0 | -100,00 | ||||
| 2026-02-10 | 13F | SBI Okasan Asset Management Co.Ltd. | 1.300 | 47 | ||||||
| 2026-02-13 | 13F | Parkside Financial Bank & Trust | 415 | 0,00 | 15 | -17,65 | ||||
| 2026-02-13 | 13F | Public Employees Retirement Association Of Colorado | 9.440 | 0,00 | 0 | |||||
| 2025-09-26 | NP | ISCG - iShares Morningstar Small-Cap Growth ETF | 3.322 | 25,69 | 144 | 32,11 | ||||
| 2025-09-26 | NP | TIEIX - TIAA-CREF Equity Index Fund Institutional Class | 21.638 | 67,22 | 939 | 75,66 | ||||
| 2026-02-04 | 13F | Versor Investments LP | 5.700 | -70,77 | 205 | -75,39 | ||||
| 2026-02-10 | 13F | Norges Bank | 16.438 | 593 | ||||||
| 2025-11-14 | 13F | Hughes Financial Services, LLC | 0 | -100,00 | 0 | |||||
| 2026-01-29 | 13F | Teachers Retirement System Of The State Of Kentucky | 9.500 | 0,00 | 0 | |||||
| 2026-02-18 | 13F | State of Tennessee, Treasury Department | 9.658 | -7,32 | 395 | -11,24 | ||||
| 2026-02-17 | 13F | Maryland State Retirement & Pension System | 6.612 | 5,37 | 238 | -11,19 | ||||
| 2026-02-12 | 13F | Federation des caisses Desjardins du Quebec | 3.104 | 19,02 | 112 | 0,00 | ||||
| 2026-02-12 | 13F | Voya Investment Management Llc | 7.881 | 0,00 | 284 | -15,48 | ||||
| 2025-09-25 | NP | DFEOX - U.s. Core Equity 1 Portfolio - Institutional Class This fund is a listed as child fund of Dimensional Fund Advisors Lp and if that institution has disclosed ownership in this security, then these positions will not be double counted when calculating total shares and total value | 40.972 | 12,59 | 1.777 | 18,15 | ||||
| 2025-11-12 | 13F | Catalyst Funds Management Pty Ltd | 0 | -100,00 | 0 | |||||
| 2026-02-11 | 13F | Los Angeles Capital Management Llc | 1.099 | 40 | ||||||
| 2026-02-13 | 13F | Brookfield Asset Management Inc. | 319.973 | 16,53 | 11.535 | -1,70 | ||||
| 2026-01-29 | 13F | Sanctuary Advisors, LLC | 7.682 | 0,76 | 277 | -15,08 | ||||
| 2025-09-25 | NP | DFUS - Dimensional U.S. Equity ETF | 10.825 | 0,00 | 470 | 4,92 | ||||
| 2026-01-28 | 13F | Universal- Beteiligungs- und Servicegesellschaft mbH | 8.229 | 47,34 | 297 | 24,37 | ||||
| 2026-02-17 | 13F | Ameriprise Financial Inc | 547.288 | 600,27 | 19.730 | 490,69 | ||||
| 2025-09-25 | NP | QDF - FlexShares Quality Dividend Index Fund | 195.804 | 8.494 | ||||||
| 2026-02-10 | 13F | Evolution Wealth Management Inc. | 80 | 3 | ||||||
| 2026-02-12 | 13F | Cibc World Markets Corp | 0 | -100,00 | 0 | |||||
| 2026-01-29 | 13F | Comerica Bank | 10.286 | -23,64 | 371 | -35,65 | ||||
| 2026-02-17 | 13F | Private Advisor Group, LLC | 10.543 | -11,66 | 380 | -25,49 | ||||
| 2026-02-12 | 13F | Quadrant Capital Group Llc | 442 | -17,38 | 16 | -31,82 | ||||
| 2026-02-13 | 13F | Cornerstone Financial Management LLC | 14 | 1 | ||||||
| 2026-02-12 | 13F | Woodley Farra Manion Portfolio Management Inc | 84.827 | -5,22 | 3.058 | -20,05 | ||||
| 2026-01-29 | 13F | Vanguard Group Inc | 5.096.786 | 9,44 | 183.739 | -7,69 | ||||
| 2026-02-11 | 13F | Parallel Advisors, LLC | 223 | -26,16 | 8 | -33,33 | ||||
| 2026-02-17 | 13F | Two Sigma Investments, Lp | 0 | -100,00 | 0 | |||||
| 2026-01-13 | 13F | Fort Washington Investment Advisors Inc /oh/ | 28.697 | -53,49 | 1.035 | -60,77 | ||||
| 2026-02-10 | 13F | Envestnet Asset Management Inc | 59.179 | -3,24 | 2.133 | -18,40 | ||||
| 2026-01-27 | 13F | Cushing Asset Management, Lp | 1.843.400 | 86,50 | 66.455 | 57,31 | ||||
| 2026-02-17 | 13F | Optiver Holding B.V. | 0 | -100,00 | 0 | |||||
| 2026-02-02 | 13F | Principal Financial Group Inc | 1.018.692 | 382,83 | 36.724 | 307,26 | ||||
| 2026-02-02 | 13F | Mutual Advisors, LLC | 8.883 | -2,19 | 320 | -13,04 | ||||
| 2025-11-14 | 13F | Voloridge Investment Management, Llc | 0 | -100,00 | 0 | |||||
| 2026-02-17 | 13F | Quantinno Capital Management LP | 29.970 | 409,26 | 1.080 | 330,28 | ||||
| 2025-11-21 | 13F/A | CIBC Bancorp USA Inc. | 4.725 | 202 | ||||||
| 2026-02-12 | 13F | Bank Of Montreal /can/ | 63.145 | 2.276 | ||||||
| 2026-02-17 | 13F | Burkehill Global Management, LP | 0 | -100,00 | 0 | |||||
| 2026-02-17 | 13F | Royal Bank Of Canada | 43.809 | -75,41 | 1.580 | -79,25 | ||||
| 2026-01-12 | 13F | Gilman Hill Asset Management, LLC | 225.551 | -8,91 | 8.131 | -23,17 | ||||
| 2026-01-21 | 13F | Graham Capital Wealth Management, Llc | 22.057 | -2,64 | 795 | -17,87 | ||||
| 2026-02-13 | 13F | Rhumbline Advisers | 124.529 | -2,03 | 4.489 | -17,36 | ||||
| 2025-11-14 | 13F | Trexquant Investment LP | 0 | -100,00 | 0 | -100,00 | ||||
| 2026-02-02 | 13F | Bay Harbor Wealth Management, LLC | 0 | -100,00 | 0 | |||||
| 2025-09-25 | NP | DFQTX - U.s. Core Equity 2 Portfolio - Institutional Class This fund is a listed as child fund of Dimensional Fund Advisors Lp and if that institution has disclosed ownership in this security, then these positions will not be double counted when calculating total shares and total value | 30.453 | 0,00 | 1.321 | 5,01 | ||||
| 2026-02-11 | 13F | Rise Advisors, LLC | 0 | -100,00 | 0 | |||||
| 2026-02-12 | 13F | Steward Partners Investment Advisory, Llc | 426 | 0,00 | 15 | -16,67 | ||||
| 2026-03-16 | 13F/A | Rockefeller Capital Management L.P. | 50.328 | -6,92 | 1.814 | -21,51 | ||||
| 2025-09-29 | NP | PXI - Invesco DWA Energy Momentum ETF This fund is a listed as child fund of Invesco Ltd. and if that institution has disclosed ownership in this security, then these positions will not be double counted when calculating total shares and total value | 14.569 | -20,78 | 632 | -16,84 | ||||
| 2026-02-13 | 13F | Pathstone Holdings, LLC | 0 | -100,00 | 0 | |||||
| 2026-01-09 | 13F | IFS Advisors, LLC | 200 | 0,00 | 7 | -12,50 | ||||
| 2025-09-26 | NP | SLPIX - Small-cap Profund Investor Class | 40 | 8,11 | 2 | 0,00 | ||||
| 2025-10-31 | 13F | Y-Intercept (Hong Kong) Ltd | 0 | -100,00 | 0 | -100,00 | ||||
| 2025-11-14 | 13F | Susquehanna Fundamental Investments, Llc | 0 | -100,00 | 0 | -100,00 | ||||
| 2026-02-12 | 13F | Mark Sheptoff Financial Planning, Llc | 200 | 7 | ||||||
| 2026-01-30 | 13F | Us Bancorp \de\ | 131 | 0,00 | 5 | -20,00 | ||||
| 2026-02-17 | 13F | Tricadia Capital Management, LLC | 120.000 | 0,00 | 4.326 | -15,64 | ||||
| 2026-02-02 | 13F | Oppenheimer Asset Management Inc. | 0 | -100,00 | 0 | |||||
| 2026-02-03 | 13F | SBI Securities Co., Ltd. | 273 | 155,14 | 10 | 125,00 | ||||
| 2025-11-13 | 13F | Renaissance Technologies Llc | 0 | -100,00 | 0 | |||||
| 2026-02-09 | 13F | Kingsview Wealth Management, LLC | 24.419 | 880 | ||||||
| 2026-02-13 | 13F | Van Eck Associates Corp | 14.037 | -22,76 | 1 | |||||
| 2026-02-09 | 13F | Cary Street Partner Investment Advisory Llc | 0 | -100,00 | 0 | |||||
| 2025-09-26 | NP | FZIPX - Fidelity ZERO Extended Market Index Fund This fund is a listed as child fund of Fmr Llc and if that institution has disclosed ownership in this security, then these positions will not be double counted when calculating total shares and total value | 11.709 | 3,20 | 508 | 8,10 | ||||
| 2025-09-25 | NP | DFAS - Dimensional U.S. Small Cap ETF | 134.906 | 0,00 | 5.852 | 0,00 | ||||
| 2026-02-17 | 13F | Citadel Advisors Llc | Call | 30.500 | -30,52 | 1.100 | -41,42 | |||
| 2026-02-17 | 13F | Citadel Advisors Llc | 1.585.292 | 3.321,44 | 57.150 | 2.786,31 | ||||
| 2026-02-06 | 13F | Larson Financial Group LLC | 203 | 0,00 | 7 | -12,50 | ||||
| 2026-02-17 | 13F | Citadel Advisors Llc | Put | 12.500 | 160,42 | 451 | 119,51 | |||
| 2026-02-17 | 13F | Clear Street Markets Llc | 0 | -100,00 | 0 | |||||
| 2026-02-12 | 13F | State Board Of Administration Of Florida Retirement System | 0 | -100,00 | 0 | |||||
| 2026-02-11 | 13F | Deutsche Bank Ag\ | 32.216 | -57,14 | 1.161 | -63,85 | ||||
| 2026-02-17 | 13F | DV Trading LLC | 200 | 7 | ||||||
| 2025-11-13 | 13F | Quadrature Capital Ltd | 0 | -100,00 | 0 | -100,00 | ||||
| 2026-02-11 | 13F | Illinois Municipal Retirement Fund | 21.332 | 7,70 | 769 | -9,10 | ||||
| 2025-11-14 | 13F | Webs Creek Capital Management LP | 0 | -100,00 | 0 | |||||
| 2026-02-02 | 13F | Strs Ohio | 100 | 0,00 | 4 | -25,00 | ||||
| 2026-02-06 | 13F | Pnc Financial Services Group, Inc. | 239 | -12,45 | 9 | -27,27 | ||||
| 2026-01-30 | 13F | Keybank National Association/oh | 6.510 | 1,12 | 235 | -14,91 | ||||
| 2026-02-13 | 13F | First Trust Advisors Lp | 0 | -100,00 | 0 | |||||
| 2026-02-12 | 13F | Barnett & Company, Inc. | 8.140 | -25,93 | 293 | -37,53 | ||||
| 2026-02-02 | 13F | Fifth Third Bancorp | 2.133 | 35,95 | 77 | 13,43 | ||||
| 2026-02-13 | 13F | Wbi Investments, Inc. | 0 | -100,00 | 0 | |||||
| 2026-02-13 | 13F | Neuberger Berman Group LLC | 2.068.184 | 3,75 | 74.558 | -12,50 | ||||
| 2025-09-25 | NP | NFRA - FlexShares STOXX Global Broad Infrastructure Index Fund | 13.755 | 8,55 | 597 | 13,96 | ||||
| 2026-01-30 | 13F | New York State Teachers Retirement System | 20.962 | 64,65 | 1 | |||||
| 2025-09-26 | NP | BlackRock Funds II - BLACKROCK MULTI-ASSET INCOME PORTFOLIO INVESTOR C SHARES | 63.666 | 2.762 | ||||||
| 2025-11-14 | 13F | Aristeia Capital Llc | 0 | -100,00 | 0 | |||||
| 2025-11-07 | 13F | Gsa Capital Partners Llp | 0 | -100,00 | 0 | |||||
| 2026-02-17 | 13F | Susquehanna International Group, Llp | Put | 22.400 | 187,18 | 808 | 142,34 | |||
| 2026-01-16 | 13F | Trust Co Of Vermont | 0 | -100,00 | 0 | -100,00 | ||||
| 2026-02-12 | 13F | New York State Common Retirement Fund | 18.706 | 14,72 | 674 | -3,16 | ||||
| 2026-02-17 | 13F | Susquehanna International Group, Llp | Call | 134.800 | -26,30 | 4.860 | -37,84 | |||
| 2026-01-12 | 13F | Rialto Wealth Management, LLC | 600 | -2,60 | 22 | -19,23 | ||||
| 2026-01-15 | 13F | Spirit Of America Management Corp/ny | 2.500 | -75,00 | 90 | -78,92 | ||||
| 2026-02-17 | 13F | Aquatic Capital Management LLC | 3.757 | -93,85 | 135 | -94,83 | ||||
| 2026-02-17 | 13F | Susquehanna International Group, Llp | 5.892 | -88,71 | 212 | -90,49 | ||||
| 2026-02-17 | 13F | Bramshill Investments, LLC | 24.323 | 0,65 | 877 | -15,12 | ||||
| 2026-02-12 | 13F | Alps Advisors Inc | 136.339 | 14,70 | 4.915 | -3,25 | ||||
| 2026-02-10 | 13F | Bank of New York Mellon Corp | 305.907 | -52,68 | 11.028 | -60,09 | ||||
| 2026-02-17 | 13F | Tower Research Capital LLC (TRC) | 4.454 | 36,71 | 161 | 15,11 | ||||
| 2026-02-17 | 13F | Advisor Group Holdings, Inc. | 11.967 | -6,60 | 431 | -20,77 | ||||
| 2026-02-17 | 13F | Blackstone Group Inc | 11.914.273 | 0,00 | 429.510 | -15,65 | ||||
| 2026-02-12 | 13F | Ankerstar Wealth, LLC | 9 | 0 | ||||||
| 2026-02-12 | 13F | RR Advisors, LLC | 577.936 | 9,04 | 20.835 | 94.600,00 | ||||
| 2026-02-13 | 13F | SIR Capital Management, L.P. | 672.090 | 195,14 | 24.229 | 148,95 | ||||
| 2026-02-13 | 13F | Manufacturers Life Insurance Company, The | 0 | -100,00 | 0 | |||||
| 2026-02-13 | 13F | Sterling Capital Management LLC | 927 | -0,64 | 33 | -15,38 | ||||
| 2026-02-12 | 13F | BRYN MAWR TRUST Co | 0 | -100,00 | 0 | -100,00 | ||||
| 2026-01-14 | 13F | Exchange Traded Concepts, Llc | 100.683 | 3,83 | 3.630 | -12,43 | ||||
| 2026-02-13 | 13F | Morgan Stanley | 2.957.971 | -6,72 | 106.635 | -21,32 | ||||
| 2026-01-29 | 13F | UBS Group AG | 754.056 | 61,70 | 27.184 | 36,39 | ||||
| 2025-09-29 | NP | RSSL - Global X Russell 2000 ETF | 22.659 | -2,58 | 983 | 2,19 | ||||
| 2026-02-05 | 13F | Allworth Financial LP | 207 | 48,92 | 7 | 40,00 | ||||
| 2025-11-13 | 13F | EntryPoint Capital, LLC | 0 | -100,00 | 0 | -100,00 | ||||
| 2026-02-09 | 13F | Cary Street Partners Financial Llc | 0 | -100,00 | 0 | |||||
| 2026-02-17 | 13F | Westwood Holdings Group Inc | 774.045 | -21,55 | 27.904 | -33,83 | ||||
| 2026-02-13 | 13F | Alyeska Investment Group, L.P. | 652.228 | 64,82 | 23.513 | 39,02 | ||||
| 2026-02-18 | 13F | Vident Advisory, LLC | 61.246 | 0,82 | 2.208 | -14,98 | ||||
| 2026-02-18 | 13F | GWM Advisors LLC | 0 | -100,00 | 0 | |||||
| 2026-01-15 | 13F | Fortitude Family Office, LLC | 0 | -100,00 | 0 | |||||
| 2026-02-06 | 13F | Hardy Reed LLC | 10.451 | 54,81 | 377 | 30,56 | ||||
| 2025-09-25 | NP | DFAU - Dimensional US Core Equity Market ETF | 9.204 | 0,85 | 399 | 5,84 | ||||
| 2026-02-05 | 13F | Amalgamated Bank | 13.177 | 5,62 | 0 | |||||
| 2026-02-11 | 13F | Jpmorgan Chase & Co | 53.631 | -5,05 | 1.933 | -19,93 | ||||
| 2026-01-26 | 13F | KBC Group NV | 1.825 | 0,00 | 0 | |||||
| 2025-11-14 | 13F | Susquehanna Portfolio Strategies, LLC | 0 | -100,00 | 0 | |||||
| 2025-09-26 | NP | FLXSX - Fidelity Flex Small Cap Index Fund This fund is a listed as child fund of Fmr Llc and if that institution has disclosed ownership in this security, then these positions will not be double counted when calculating total shares and total value | 8.427 | 15,58 | 366 | 21,26 | ||||
| 2026-02-17 | 13F | Creative Planning | 36.081 | 77,60 | 1.301 | 49,77 | ||||
| 2026-01-29 | 13F | Advisors Capital Management, LLC | 645.383 | 2,06 | 23.266 | -13,92 | ||||
| 2026-02-13 | 13F | Public Sector Pension Investment Board | 0 | -100,00 | 0 | |||||
| 2026-02-12 | 13F | Brinker Capital Investments, LLC | 21.531 | 1,00 | 776 | -14,82 | ||||
| 2026-02-13 | 13F | Wells Fargo & Company/mn | 114.254 | 221,72 | 4.119 | 171,46 | ||||
| 2026-01-13 | 13F | Mather Group, Llc. | 0 | -100,00 | 0 | |||||
| 2026-02-17 | 13F | SageView Advisory Group, LLC | 9.592 | -74,48 | 346 | -78,52 | ||||
| 2026-02-13 | 13F | MAI Capital Management | 500 | 5,93 | 18 | -10,00 | ||||
| 2026-02-17 | 13F | Infrastructure Capital Advisors, Llc | 258.622 | 9.323 | ||||||
| 2026-02-06 | 13F | EverSource Wealth Advisors, LLC | 108 | -22,30 | 4 | -40,00 | ||||
| 2026-01-27 | 13F | Fractal Investments LLC | 27.502 | 0,00 | 991 | -15,66 | ||||
| 2026-02-12 | 13F | Cloud Capital Management, LLC | 0 | -100,00 | 0 | |||||
| 2026-01-16 | 13F | DiNuzzo Private Wealth, Inc. | 5 | 0,00 | 0 | |||||
| 2026-02-11 | 13F | Franklin Resources Inc | 0 | -100,00 | 0 | |||||
| 2026-02-13 | 13F | Bridgefront Capital, LLC | 0 | -100,00 | 0 | |||||
| 2025-09-26 | NP | EBIT - Harbor AlphaEdge Small Cap Earners ETF | 269 | -5,28 | 12 | 0,00 | ||||
| 2026-02-11 | 13F | Cerity Partners LLC | 73.841 | -10,47 | 2.662 | -24,51 | ||||
| 2026-02-09 | 13F | Geode Capital Management, Llc | 1.049.603 | 1,92 | 37.845 | -14,03 | ||||
| 2026-02-17 | 13F | Dark Forest Capital Management Lp | 0 | -100,00 | 0 | |||||
| 2026-02-13 | 13F | Toroso Investments, LLC | 17.436 | 112,95 | 629 | 79,94 | ||||
| 2026-02-06 | 13F | HighTower Advisors, LLC | 102.906 | 33,07 | 3.710 | 12,22 | ||||
| 2026-01-29 | 13F | Rakuten Securities, Inc. | 94 | 4.600,00 | 3 | |||||
| 2026-01-26 | 13F | Merit Financial Group, LLC | 0 | -100,00 | 0 | |||||
| 2025-10-24 | 13F | Hemington Wealth Management | 62 | 5,08 | 0 | |||||
| 2026-01-27 | 13F | Tred Avon Family Wealth, Llc | 17.076 | -12,10 | 616 | -25,90 | ||||
| 2026-02-17 | 13F | Man Group plc | 104.807 | 5,57 | 3.778 | -10,96 | ||||
| 2026-02-17 | 13F | Millennium Management Llc | 11.358 | 409 | ||||||
| 2025-09-26 | NP | SMLPX - Westwood Salient MLP & Energy Infrastructure Fund Institutional Shares | 763.454 | 0,00 | 33.119 | 4,93 | ||||
| 2025-09-29 | NP | CFMCX - Column Mid Cap Fund | 233 | 0,00 | 10 | -10,00 | ||||
| 2026-01-29 | 13F | Pictet Asset Management Holding SA | 176.587 | -65,40 | 6.366 | -70,82 | ||||
| 2026-02-13 | 13F | Healthcare Of Ontario Pension Plan Trust Fund | 0 | -100,00 | 0 | |||||
| 2026-02-13 | 13F | Squarepoint Ops LLC | 0 | -100,00 | 0 | |||||
| 2026-02-12 | 13F | American Financial Group Inc | 16.000 | 5,26 | 577 | -11,25 | ||||
| 2026-02-10 | 13F/A | Northwestern Mutual Wealth Management Co | 47 | 2 | ||||||
| 2025-11-13 | 13F | Mackenzie Financial Corp | 0 | -100,00 | 0 | |||||
| 2026-02-11 | 13F | Cedar Mountain Advisors, LLC | 9 | 0 | ||||||
| 2025-09-26 | NP | BKMC - BNY Mellon US Mid Cap Core Equity ETF | 4.958 | 14,37 | 215 | 20,11 | ||||
| 2026-01-23 | 13F | State of Alaska, Department of Revenue | 37.313 | 70,02 | 1 | |||||
| 2026-01-30 | 13F | Jennison Associates Llc | 270.126 | 32,98 | 9.738 | 12,18 | ||||
| 2026-02-09 | 13F | Harbour Investments, Inc. | 12 | 0,00 | 0 | |||||
| 2026-02-11 | 13F | Fox Run Management, L.l.c. | 6.182 | 223 | ||||||
| 2026-02-09 | 13F | Hantz Financial Services, Inc. | 1.943 | 481,74 | 0 | |||||
| 2026-02-13 | 13F | Sei Investments Co | 15.254 | -3,81 | 550 | -18,91 | ||||
| 2026-02-12 | 13F | Rossby Financial, LCC | 379 | -85,38 | 14 | -87,62 | ||||
| 2025-09-26 | NP | USMIX - Extended Market Index Fund | 4.632 | 14,63 | 201 | 19,76 | ||||
| 2025-09-26 | NP | ISCV - iShares Morningstar Small-Cap Value ETF | 2.034 | 18,60 | 88 | 25,71 | ||||
| 2026-01-26 | 13F | Cwm, Llc | 744 | 89,80 | 0 | |||||
| 2026-02-13 | 13F | HITE Hedge Asset Management LLC | 0 | -100,00 | 0 | |||||
| 2026-02-10 | 13F | Rothschild Investment Llc | 5 | -80,00 | 0 | -100,00 | ||||
| 2025-11-17 | 13F | PDT Partners, LLC | 0 | -100,00 | 0 | |||||
| 2026-02-13 | 13F | Police & Firemen's Retirement System of New Jersey | 11.352 | -7,50 | 409 | -21,95 | ||||
| 2026-02-06 | 13F | ProShare Advisors LLC | 8.633 | 3,53 | 311 | -12,64 | ||||
| 2026-02-11 | 13F | Gilpin Wealth Management, Llc | 6 | 0 | ||||||
| 2026-02-13 | 13F | Victory Capital Management Inc | 73.365 | 0,86 | 2.645 | -14,93 | ||||
| 2025-09-25 | NP | BBSC - JPMorgan BetaBuilders U.S. Small Cap Equity ETF | 8.135 | 25,42 | 353 | 31,34 | ||||
| 2026-02-13 | 13F | Quarry LP | 17 | -58,54 | 1 | -100,00 | ||||
| 2026-02-03 | 13F | Everence Capital Management Inc | 6.761 | 0 | ||||||
| 2026-02-13 | 13F | SRS Capital Advisors, Inc. | 157 | 6 | ||||||
| 2025-11-10 | 13F | Td Asset Management Inc | 0 | -100,00 | 0 | |||||
| 2026-02-17 | 13F | Cetera Investment Advisers | 28.409 | 42,09 | 1.024 | 19,91 | ||||
| 2025-09-25 | NP | DFA INVESTMENT DIMENSIONS GROUP INC - U.S. Social Core Equity 2 Portfolio Shares | 2.731 | 0,00 | 118 | 5,36 | ||||
| 2026-02-13 | 13F | State Street Corp | 1.643.532 | 5,08 | 59.249 | -11,37 | ||||
| 2026-02-13 | 13F | Centiva Capital, LP | 6.000 | 216 | ||||||
| 2026-02-13 | 13F | Pinnacle Wealth Planning Services, Inc. | 16 | 1 | ||||||
| 2026-02-17 | 13F | Adage Capital Partners Gp, L.l.c. | 0 | -100,00 | 0 | |||||
| 2026-01-28 | 13F | Geneos Wealth Management Inc. | 21.666 | 7,37 | 781 | -9,40 | ||||
| 2025-11-14 | 13F | Round Rock Advisors, LLC | 0 | -100,00 | 0 | |||||
| 2026-02-11 | 13F | Clearbridge Investments, LLC | 25.960 | 38,38 | 936 | 16,73 | ||||
| 2026-02-19 | 13F | Invesco Ltd. | 1.775.216 | 22,43 | 63.997 | 3,27 | ||||
| 2026-02-12 | 13F | Swiss National Bank | 90.900 | 2,60 | 3.277 | -13,47 | ||||
| 2025-11-14 | 13F | Ghisallo Capital Management LLC | 0 | -100,00 | 0 | -100,00 | ||||
| 2026-02-13 | 13F | Panagora Asset Management Inc | 16.519 | -0,30 | 596 | -15,96 | ||||
| 2026-02-17 | 13F | Fmr Llc | 5.152 | 30,07 | 186 | 9,47 | ||||
| 2025-11-13 | 13F | Marshall Wace, Llp | 6.109 | -91,18 | 261 | -91,45 | ||||
| 2026-02-17 | 13F | Alliancebernstein L.p. | 60.928 | 13,91 | 2.196 | -3,89 | ||||
| 2026-02-17 | 13F | Point72 Asset Management, L.P. | 0 | -100,00 | 0 | |||||
| 2026-02-12 | 13F | Pinnacle Holdings, LLC | 94.371 | 3,55 | 3.402 | -12,66 | ||||
| 2025-11-14 | 13F | Point72 Europe (London) LLP | 3.142 | 134 | ||||||
| 2025-09-25 | NP | DXUV - Dimensional US Vector Equity ETF | 202 | 0,00 | 9 | 0,00 | ||||
| 2026-02-12 | 13F | MetLife Investment Management, LLC | 25.132 | -4,90 | 906 | -19,75 | ||||
| 2026-02-17 | 13F | Covalis Capital Llp | 0 | -100,00 | 0 | |||||
| 2025-09-26 | NP | TISBX - TIAA-CREF Small-Cap Blend Index Fund Institutional Class | 58.257 | 17,16 | 2.527 | 22,97 | ||||
| 2026-02-06 | 13F | Covestor Ltd | 30 | -21,05 | 0 | |||||
| 2026-01-27 | 13F | Zurcher Kantonalbank (Zurich Cantonalbank) | 19.618 | -14,77 | 707 | -28,08 | ||||
| 2026-02-10 | 13F | Commonwealth Of Pennsylvania Public School Empls Retrmt Sys | 11.254 | 1,24 | 406 | -14,74 | ||||
| 2026-01-21 | 13F | Yousif Capital Management, Llc | 12.091 | -9,44 | 468 | -18,07 | ||||
| 2026-02-04 | 13F | Oregon Public Employees Retirement Fund | 10.387 | 5,99 | 374 | -10,53 | ||||
| 2025-09-29 | NP | KCXIX - Knights of Columbus U.S. All Cap Index Fund I Shares | 195 | 25,81 | 8 | 33,33 | ||||
| 2025-11-14 | 13F | Tudor Investment Corp Et Al | 0 | -100,00 | 0 | |||||
| 2026-02-12 | 13F | Advisors Asset Management, Inc. | 256.331 | -4,22 | 9.241 | -19,22 | ||||
| 2026-01-29 | 13F | UMA Financial Services, Inc. | 0 | -100,00 | 0 | |||||
| 2026-01-07 | 13F | Massmutual Trust Co Fsb/adv | 4 | 0,00 | 0 | |||||
| 2025-09-26 | NP | RGIAX - Global Infrastructure Fund Class A | 7.578 | 0,00 | 329 | 4,79 | ||||
| 2026-01-14 | 13F | Jfs Wealth Advisors, Llc | 22 | 4,76 | 1 | |||||
| 2026-02-17 | 13F | Jump Financial, LLC | 0 | -100,00 | 0 | |||||
| 2026-02-09 | 13F | Keating Financial Advisory Services, Inc. | 1 | 0 | ||||||
| 2026-02-10 | 13F | Root Financial Partners, LLC | 11 | -82,81 | 0 | -100,00 | ||||
| 2026-02-17 | 13F/A | Laurion Capital Management LP | 21.043 | 759 | ||||||
| 2026-02-11 | 13F | Allianz Asset Management GmbH | 21.440 | 4,90 | 773 | -11,57 | ||||
| 2026-02-13 | 13F | Barclays Plc | 473.980 | 50,14 | 17.087 | 26,63 | ||||
| 2026-02-17 | 13F | Aster Capital Management (DIFC) Ltd | 1.170 | -6,55 | 42 | -20,75 | ||||
| 2025-09-25 | NP | ISCB - iShares Morningstar Small-Cap ETF | 1.027 | 11,39 | 45 | 15,79 | ||||
| 2026-02-17 | 13F | Aqr Capital Management Llc | 11.922 | 71,34 | 430 | 44,44 | ||||
| 2026-01-20 | 13F | Signaturefd, Llc | 802 | 101,51 | 29 | 64,71 | ||||
| 2026-01-27 | 13F | Miller Howard Investments Inc /ny | 86.375 | 3,82 | 3.114 | -12,43 | ||||
| 2025-11-14 | 13F | Algert Global Llc | 0 | -100,00 | 0 | |||||
| 2026-02-17 | 13F | Aventail Capital Group, LP | 122.612 | 122,22 | 4.420 | 87,45 | ||||
| 2025-11-14 | 13F | Numerai GP LLC | 0 | -100,00 | 0 | |||||
| 2026-02-17 | 13F | Yaupon Capital Management LP | 158.069 | 5.698 | ||||||
| 2026-02-17 | 13F | Bank Of America Corp /de/ | 935.575 | 83,84 | 33.727 | 55,06 | ||||
| 2026-02-17 | 13F | Tortoise Capital Advisors, L.l.c. | 362.879 | -0,05 | 13.082 | -15,70 | ||||
| 2026-01-08 | 13F | Wealth Enhancement Advisory Services, Llc | 6.023 | -2,27 | 215 | -11,93 | ||||
| 2025-11-13 | 13F | Glenmede Investment Management, LP | 15.363 | 8,47 | 657 | 5,30 | ||||
| 2026-02-17 | 13F | Boothbay Fund Management, Llc | 8.319 | 40,52 | 300 | 18,18 | ||||
| 2026-01-23 | 13F | U.S. Capital Wealth Advisors, LLC | 0 | -100,00 | 0 | |||||
| 2025-09-26 | NP | RMYAX - Multi-Strategy Income Fund Class A | 838 | 0,00 | 36 | 5,88 | ||||
| 2026-02-03 | 13F | Sequoia Financial Advisors, LLC | 0 | -100,00 | 0 | |||||
| 2026-02-06 | 13F | Global Retirement Partners, LLC | 36 | 0,00 | 1 | 0,00 | ||||
| 2026-02-17 | 13F | Kemnay Advisory Services Inc. | 387 | 14 | ||||||
| 2025-09-25 | NP | DFAC - Dimensional U.S. Core Equity 2 ETF | 57.595 | 9,52 | 2.498 | 14,90 | ||||
| 2025-11-13 | 13F | Dynamic Technology Lab Private Ltd | 0 | -100,00 | 0 | -100,00 | ||||
| 2026-02-13 | 13F | Verition Fund Management LLC | 41.200 | -8,94 | 1.485 | -23,18 | ||||
| 2026-02-12 | 13F | Dimensional Fund Advisors Lp | 679.040 | -0,24 | 24.479 | -15,87 | ||||
| 2026-02-10 | 13F | Mutual Of America Capital Management Llc | 0 | -100,00 | 0 | |||||
| 2026-02-09 | 13F | Quest Partners LLC | 17.427 | 118,41 | 628 | 84,16 | ||||
| 2026-02-17 | 13F | Virtus Investment Advisers, Inc. | 4.705 | 170 | ||||||
| 2026-02-17 | 13F | Price T Rowe Associates Inc /md/ | 46.392 | 27,15 | 2 | 0,00 | ||||
| 2026-02-13 | 13F | Smartleaf Asset Management LLC | 243 | 406,25 | 9 | 300,00 | ||||
| 2026-02-17 | 13F/A | Uniplan Investment Counsel, Inc. | 53.140 | -8,90 | 1.916 | -23,18 | ||||
| 2025-10-31 | 13F | Resona Asset Management Co.,Ltd. | 0 | -100,00 | 0 | -100,00 | ||||
| 2026-01-15 | 13F | Nisa Investment Advisors, Llc | 324 | -46,36 | 12 | -56,00 | ||||
| 2026-01-21 | 13F | SJS Investment Consulting Inc. | 2 | -50,00 | 0 | |||||
| 2026-02-17 | 13F | Silvercrest Asset Management Group Llc | 27.498 | -11,35 | 991 | -25,21 | ||||
| 2025-11-13 | 13F | BTG Pactual Asset Management US LLC | 0 | -100,00 | 0 | |||||
| 2026-01-13 | 13F | Dakota Wealth Management | 19.684 | -4,89 | 710 | -19,80 | ||||
| 2025-09-26 | NP | FZROX - Fidelity ZERO Total Market Index Fund This fund is a listed as child fund of Fmr Llc and if that institution has disclosed ownership in this security, then these positions will not be double counted when calculating total shares and total value | 18.789 | 8,92 | 815 | 14,31 | ||||
| 2025-09-26 | NP | JHML - John Hancock Multifactor Large Cap ETF | 289 | 0,00 | 13 | 9,09 | ||||
| 2026-01-08 | 13F | True Wealth Design, LLC | 0 | -100,00 | 0 | |||||
| 2025-09-25 | NP | DCOR - Dimensional US Core Equity 1 ETF | 3.172 | 4,14 | 138 | 9,60 | ||||
| 2025-09-25 | NP | DFSTX - U.s. Small Cap Portfolio - Institutional Class This fund is a listed as child fund of Dimensional Fund Advisors Lp and if that institution has disclosed ownership in this security, then these positions will not be double counted when calculating total shares and total value | 209.829 | 1,32 | 9.102 | 6,32 | ||||
| 2026-02-17 | 13F | D. E. Shaw & Co., Inc. | Call | 6.100 | 220 | |||||
| 2025-10-29 | 13F | Custom Index Systems, Llc | 0 | -100,00 | 0 | |||||
| 2025-11-14 | 13F | Skopos Labs, Inc. | 0 | -100,00 | 0 | |||||
| 2026-01-16 | 13F | Ronald Blue Trust, Inc. | 4.300 | 2,82 | 155 | -12,92 | ||||
| 2026-01-07 | 13F | Mfg Wealth Management, Inc. | 27.560 | 994 | ||||||
| 2026-02-06 | 13F | IFP Advisors, Inc | 1.580 | -40,89 | 57 | -50,88 | ||||
| 2026-02-13 | 13F | Icon Wealth Advisors, LLC | 0 | -100,00 | 0 |