Grundlæggende statistik
| Institutionelle ejere | 361 total, 361 long only, 0 short only, 0 long/short - change of 5,81% MRQ |
| Gennemsnitlig porteføljeallokering | 0.7844 % - change of -4,07% MRQ |
| Institutionelle aktier (lange) | 50.959.969 (ex 13D/G) - change of 1,62MM shares 3,27% MRQ |
| Institutionel værdi (lang) | $ 4.411.732 USD ($1000) |
Institutionelt ejerskab og aktionærer
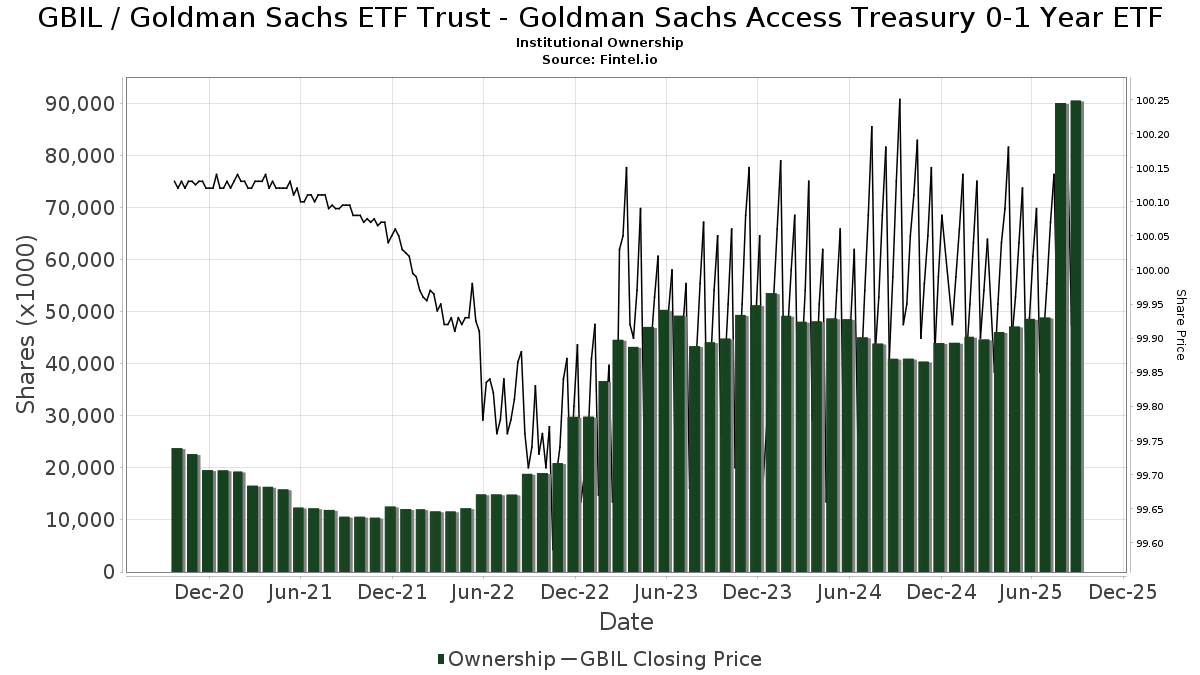
Goldman Sachs ETF Trust - Goldman Sachs Access Treasury 0-1 Year ETF (US:GBIL) har 361 institutionelle ejere og aktionærer, der har indsendt 13D/G- eller 13F-formularer til Securities Exchange Commission (SEC). Disse institutioner har i alt 50,959,969 aktier. Største aktionærer omfatter ACR Alpine Capital Research, LLC, Betterment LLC, Morgan Stanley, Goldman Sachs Group Inc, Bank Of America Corp /de/, Wells Fargo & Company/mn, LPL Financial LLC, Oppenheimer Asset Management Inc., Envestnet Asset Management Inc, and Royal Bank Of Canada .
Goldman Sachs ETF Trust - Goldman Sachs Access Treasury 0-1 Year ETF (ARCA:GBIL) institutionel ejerskabsstruktur viser aktuelle positioner i virksomheden efter institutioner og fonde, samt seneste ændringer i positionsstørrelse. Større aktionærer kan omfatte individuelle investorer, investeringsforeninger, hedgefonde eller institutioner. Skema 13D angiver, at investoren besidder (eller besidder) mere end 5 % af virksomheden og har til hensigt (eller har til hensigt at) aktivt at forfølge en ændring i forretningsstrategi. Skema 13G indikerer en passiv investering på over 5%.
The share price as of April 17, 2026 is 100,09 / share. Previously, on April 21, 2025, the share price was 100,07 / share. This represents an increase of 0,02% over that period.
Fondens stemningsscore
Fund Sentiment Score (fka Ownership Accumulation Score) finder de aktier, der bliver mest købt af fonde. Det er resultatet af en sofistikeret, multi-faktor kvantitativ model, der identificerer virksomheder med de højeste niveauer af institutionel akkumulering. Scoringsmodellen bruger en kombination af den samlede stigning i oplyste ejere, ændringerne i porteføljeallokeringer i disse ejere og andre målinger. Tallet går fra 0 til 100, hvor højere tal indikerer et højere niveau af akkumulering for sine jævnaldrende, og 50 er gennemsnittet.
Opdateringsfrekvens: Dagligt
Se Ownership Explorer, som giver en liste over højest rangerende virksomheder.
AI+ Ask Fintel’s AI assistant about Goldman Sachs ETF Trust - Goldman Sachs Access Treasury 0-1 Year ETF.
Select a question to share a public post with an AI-crafted answer.
Thinking of good questions…
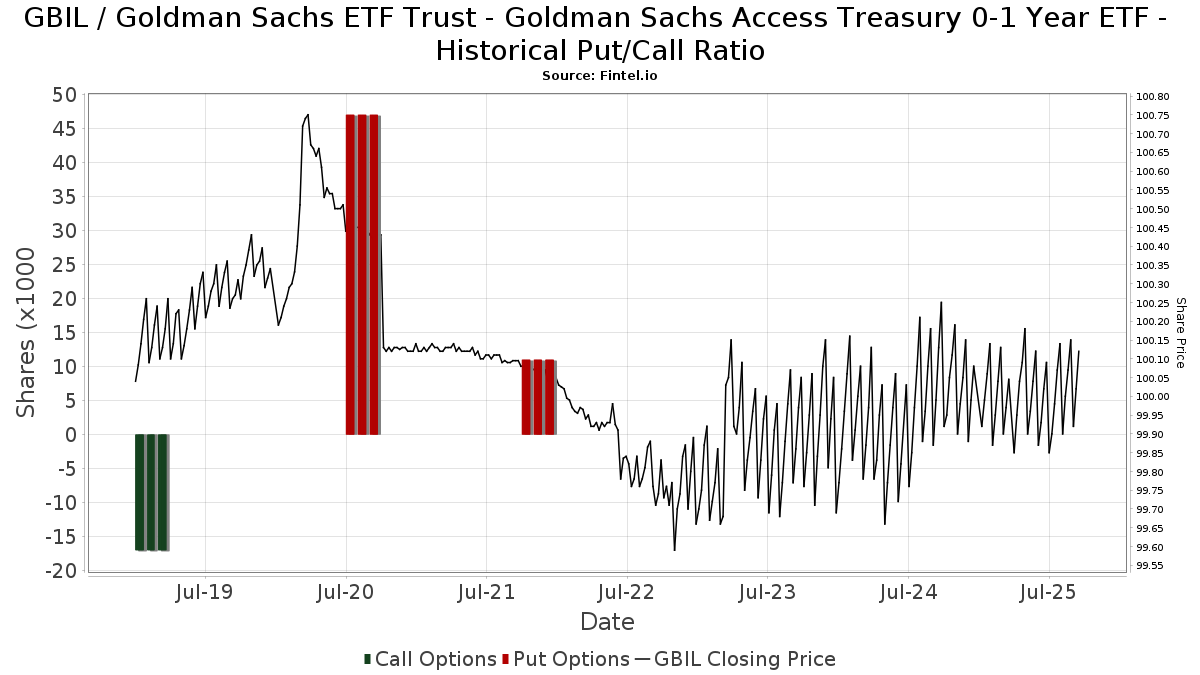
Institutionel Put/Call-forhold
Ud over at indberette standardaktie- og gældsudstedelser skal institutter med mere end 100 mill. aktiver under forvaltning også oplyse deres put- og call-optionsbeholdninger. Da salgsoptioner generelt indikerer negativ stemning, og købsoptioner indikerer positiv stemning, kan vi få en fornemmelse af den overordnede institutionelle stemning ved at plotte forholdet mellem put og kald. Diagrammet til højre viser det historiske put/call-forhold for dette instrument.
Brug af Put/Call Ratio som en indikator for investorernes stemning overvinder en af de vigtigste mangler ved at bruge totalt institutionelt ejerskab, som er, at en betydelig mængde af aktiver under forvaltning investeres passivt for at spore indekser. Passivt forvaltede fonde køber typisk ikke optioner, så indikatoren for put/call-forholdet følger mere nøje følelsen af aktivt forvaltede fonde.
13F og NPORT arkivering
Detaljer om 13F-arkivering er gratis. Detaljer om NP-ansøgninger kræver et premium-medlemskab. Grønne rækker angiver nye positioner. Røde rækker angiver lukkede positioner. Klik på linket ikon for at se den fulde transaktionshistorik.
Opgrader
for at låse premium-data op og eksportere til Excel ![]() .
.
| Fil dato | Kilde | Investor | Type | Gennemsnitlig pris (Øst) |
Aktier | Δ Aktier (%) |
Rapporteret Værdi ($1000) |
Δ Værdi (%) |
Port Alloc (%) |
|
|---|---|---|---|---|---|---|---|---|---|---|
| 2026-04-20 | 13F | FSC Wealth Advisors, LLC | 0 | -100,00 | 0 | |||||
| 2026-02-05 | 13F | ACR Alpine Capital Research, LLC | 8.115.451 | 70,18 | 811.058 | 69,69 | ||||
| 2026-04-17 | 13F | Legacy Wealth Partners, LLC | 7.377 | -8,42 | 739 | -8,20 | ||||
| 2026-02-13 | 13F | Morgan Stanley | 4.882.355 | -1,70 | 487.943 | -1,98 | ||||
| 2026-04-07 | 13F | Pathway Financial Advisors LLC | 958.193 | 1,63 | 95.762 | 1,60 | ||||
| 2026-02-12 | 13F | Hollencrest Capital Management | 150 | -74,62 | 15 | -76,27 | ||||
| 2026-02-12 | 13F | Brinker Capital Investments, LLC | 3.093 | -4,54 | 309 | -4,63 | ||||
| 2026-02-03 | 13F | Encompass More Asset Management | 0 | -100,00 | 0 | |||||
| 2026-01-29 | 13F | Advisors Capital Management, LLC | 0 | -100,00 | 0 | |||||
| 2026-02-04 | 13F | Rock Point Advisors, LLC | 5.488 | -8,35 | 548 | -8,67 | ||||
| 2026-02-13 | 13F | Maia Wealth LLC | 0 | -100,00 | 0 | |||||
| 2026-02-06 | 13F | GPS Wealth Strategies Group, LLC | 15.150 | 1.577,74 | 1.514 | 1.582,22 | ||||
| 2026-02-13 | 13F | Level Four Advisory Services, Llc | 162.032 | -17,66 | 16.194 | -17,90 | ||||
| 2026-04-15 | 13F | Occidental Asset Management, LLC | 7.302 | 0,00 | 732 | 0,27 | ||||
| 2026-03-05 | 13F | Mengis Capital Management, Inc. | 7.332 | 23,10 | 733 | 22,82 | ||||
| 2026-01-29 | 13F | Bravias Capital Group, LLC | 7.898 | -0,49 | 789 | -0,75 | ||||
| 2026-04-17 | 13F | Mezzasalma Advisors, LLC | 28.641 | -0,77 | 2.870 | -0,55 | ||||
| 2026-02-10 | 13F | Adapt Wealth Advisors, Llc | 3.320 | 0,00 | 332 | -0,30 | ||||
| 2026-01-22 | 13F | Apollon Wealth Management, LLC | 21.942 | -12,99 | 2.193 | -13,26 | ||||
| 2026-02-12 | 13F | IFC Advisors LLC | 7.507 | 750 | ||||||
| 2026-01-23 | 13F | Actinver Wealth Management, Inc. | 6.382 | -7,14 | 638 | -7,41 | ||||
| 2026-02-13 | 13F | Mariner, LLC | 241.000 | 21,42 | 24.086 | 21,07 | ||||
| 2026-01-22 | 13F | Vicus Capital | 24.984 | 2,06 | 2.497 | 1,75 | ||||
| 2026-02-03 | 13F | Acorn Financial Advisory Services Inc /adv | 0 | -100,00 | 0 | |||||
| 2026-02-09 | 13F | Hantz Financial Services, Inc. | 0 | -100,00 | 0 | |||||
| 2026-02-09 | 13F | Kestra Investment Management, LLC | 2.653 | 265 | ||||||
| 2026-02-17 | 13F | Pinnacle Financial Partners, Inc. | 3.337 | 334 | ||||||
| 2025-11-05 | 13F | Canvas Wealth Advisors, LLC | 0 | -100,00 | 0 | |||||
| 2026-02-13 | 13F | Gts Securities Llc | 2.825 | 282 | ||||||
| 2026-04-17 | 13F | Baker Ellis Asset Management LLC | 100.621 | -7,00 | 10.081 | -6,76 | ||||
| 2026-01-29 | 13F | UBS Group AG | 1.118.945 | 1,59 | 111.827 | 1,30 | ||||
| 2025-10-27 | 13F | Q3 Asset Management | 0 | -100,00 | 0 | |||||
| 2026-02-11 | 13F | Symphony Financial, Ltd. Co. | 8.738 | -79,94 | 873 | -79,99 | ||||
| 2026-02-02 | 13F | VanWeelden Wealth Management, LLC | 144.432 | 4,88 | 14.435 | 4,58 | ||||
| 2026-02-10 | 13F | Waterloo Capital, L.P. | 192.862 | -16,58 | 19.275 | -16,82 | ||||
| 2026-02-10 | 13F | Coyle Financial Counsel LLC | 8.590 | 7,63 | 858 | 7,38 | ||||
| 2026-02-11 | 13F | Tradition Wealth Management, LLC | 5.114 | 2,28 | 511 | 2,00 | ||||
| 2026-01-14 | 13F | Global View Capital Management LLC | 12.222 | -0,01 | 1.221 | -0,33 | ||||
| 2026-01-26 | 13F | Private Trust Co Na | 5.074 | 23,67 | 507 | 23,36 | ||||
| 2026-02-13 | 13F | Acorns Advisers, LLC | 511.400 | 2,20 | 51 | 2,00 | ||||
| 2026-02-17 | 13F | Asset One Wealth Management LLC | 5.755 | 575 | ||||||
| 2026-02-12 | 13F | Moneta Group Investment Advisors Llc | 2.123 | 212 | ||||||
| 2026-02-13 | 13F | Brian Low Financial Group, Llc | 0 | -100,00 | 0 | |||||
| 2025-11-14 | 13F | Citadel Advisors Llc | 0 | -100,00 | 0 | |||||
| 2026-02-10 | 13F | NorthStar Asset Management LLC /NJ/ | 70.648 | -1,53 | 7.061 | -1,82 | ||||
| 2026-02-13 | 13F | Colony Group, LLC | 46.316 | 12,09 | 4.629 | 11,76 | ||||
| 2026-04-20 | 13F | Friedenthal Financial | 1.195 | 171,59 | 120 | 176,74 | ||||
| 2026-04-17 | 13F | Tectonic Advisors Llc | 63.978 | 197,42 | 6.410 | 198,23 | ||||
| 2026-01-23 | 13F | Reuter James Wealth Management, Llc | 5.264 | 40,41 | 526 | 40,27 | ||||
| 2026-02-09 | 13F | Narus Financial Partners, LLC | 11.639 | -0,50 | 1.163 | -0,77 | ||||
| 2026-02-17 | 13F | Raymond James Financial Inc | 196.923 | 15,35 | 19.680 | 15,01 | ||||
| 2026-02-17 | 13F | Waterway Wealth Management, LLC | 213.026 | 1,93 | 17.998 | 1,03 | ||||
| 2026-02-11 | 13F | Janney Montgomery Scott LLC | 198.832 | -42,63 | 20 | -44,12 | ||||
| 2025-11-14 | 13F | Strategic Wealth Partners, Ltd. | 51.539 | -3,09 | 5.166 | -3,02 | ||||
| 2026-02-11 | 13F | LPL Financial LLC | 1.726.922 | 7,72 | 172.589 | 7,41 | ||||
| 2026-02-12 | 13F | Commonwealth Equity Services, Llc | 384.220 | 0,16 | 38.399 | 100.947,37 | ||||
| 2026-02-12 | 13F | Concorde Asset Management, LLC | 4.677 | 467 | ||||||
| 2026-02-04 | 13F | GGM Financials LLC | 22 | -18,52 | 2 | 0,00 | ||||
| 2026-02-10 | 13F | Holderness Investments Co | 2.200 | 0,41 | 220 | 0,00 | ||||
| 2026-02-12 | 13F | Bank Of Montreal /can/ | 0 | -100,00 | 0 | |||||
| 2026-01-21 | 13F | Hunter Associates Investment Management Llc | 28.753 | 152,71 | 3 | 100,00 | ||||
| 2026-01-26 | 13F | Main Street Group, LTD | 14.128 | -76,09 | 1.412 | -76,17 | ||||
| 2026-02-24 | 13F | Tru Independence Asset Management 2, Llc | 30.831 | 0,00 | 3.092 | 0,03 | ||||
| 2026-02-13 | 13F | Capital Financial Group Inc\co\ /adv | 37.983 | 3.796 | ||||||
| 2026-01-28 | 13F | Geneos Wealth Management Inc. | 4.012 | 48,59 | 401 | 48,15 | ||||
| 2026-02-06 | 13F | Kingdom Financial Group LLC. | 240 | 24 | ||||||
| 2026-04-15 | 13F | Blue Square Asset Management, Llc | 147.926 | 60,53 | 14.821 | 60,93 | ||||
| 2026-04-17 | 13F/A | Founders Financial Securities Llc | 6.015 | -6,44 | 601 | -6,39 | ||||
| 2026-02-03 | 13F | Legacy Wealth Managment, LLC/ID | 24.475 | -20,60 | 2.446 | -20,82 | ||||
| 2026-01-27 | 13F | Evergreen Capital Management Llc | 41.852 | -18,28 | 4.196 | -18,25 | ||||
| 2025-10-20 | 13F | Motive Wealth Advisors | 0 | -100,00 | 0 | |||||
| 2026-02-17 | 13F | Two Sigma Securities, Llc | 8.462 | -6,79 | 846 | -7,04 | ||||
| 2026-01-30 | 13F | Sage Rhino Capital Llc | 167.191 | -18,12 | 16.709 | -18,35 | ||||
| 2026-02-06 | 13F | Orin Green Financial, LLC | 20.106 | 0,00 | 2.009 | -0,30 | ||||
| 2025-11-07 | 13F | Synovus Financial Corp | 6.415 | 1,78 | 643 | 1,90 | ||||
| 2026-04-07 | 13F | Blueline Advisors Llc | 65 | 8,33 | 6 | 20,00 | ||||
| 2026-02-12 | 13F | Strive Asset Management, LLC | 0 | -100,00 | 0 | |||||
| 2026-01-20 | 13F | Cohalo Advisory LLC | 1.703 | -0,58 | 170 | -0,58 | ||||
| 2026-01-20 | 13F | Sugar Maple Asset Management, LLC | 12.620 | -1,87 | 1.261 | -2,10 | ||||
| 2026-02-05 | 13F | Peak Asset Management, LLC | 14.114 | 18,62 | 1.411 | 18,29 | ||||
| 2026-01-23 | 13F | KG&L Capital Management,LLC | 26.876 | 15,83 | 2.686 | 15,48 | ||||
| 2026-02-17 | 13F | Fmr Llc | 214 | 160,98 | 21 | 162,50 | ||||
| 2026-02-09 | 13F | Allen Capital Group, LLC | 39.400 | 0,74 | 3.938 | 0,46 | ||||
| 2026-02-17 | 13F | National Asset Management, Inc. | 85.322 | 10,51 | 8.527 | 10,20 | ||||
| 2026-02-19 | 13F | CI Private Wealth, LLC | 862.645 | -1,83 | 86.214 | -2,11 | ||||
| 2026-02-10 | 13F | Essex Financial Services, Inc. | 7.058 | -0,48 | 705 | -0,70 | ||||
| 2026-02-17 | 13F | United Capital Financial Advisers, Llc | 6.383 | -6,59 | 638 | -6,87 | ||||
| 2026-02-17 | 13F | Synergy Financial Group, LTD | 4.372 | 21,48 | 437 | 21,11 | ||||
| 2026-02-03 | 13F | Falcon Wealth Planning | 3.432 | 54,94 | 343 | 54,05 | ||||
| 2025-11-07 | 13F | GenTrust, LLC | 0 | -100,00 | 0 | |||||
| 2026-02-03 | 13F | Morton Capital Management LLC/CA | 3.202 | 0,06 | 320 | -0,31 | ||||
| 2026-02-10 | 13F | Goldman Sachs Group Inc | 2.195.862 | -6,11 | 219.454 | -6,38 | ||||
| 2026-01-23 | 13F | Guidance Capital, Inc | 104.980 | 13,52 | 10.511 | 13,45 | ||||
| 2026-04-01 | 13F | Beacon Financial Group | 12.476 | -27,47 | 1.247 | -27,73 | ||||
| 2025-11-19 | 13F/A | Regions Financial Corp | 0 | -100,00 | 0 | |||||
| 2026-04-07 | 13F | Farther Finance Advisors, LLC | 40.811 | -21,29 | 4.077 | -21,32 | ||||
| 2026-04-20 | 13F | Inscription Capital, LLC | 10.805 | -7,44 | 1.083 | -7,20 | ||||
| 2026-02-17 | 13F | Cahill Financial Advisors Inc | 45.923 | 9,39 | 4.590 | 9,08 | ||||
| 2025-11-14 | 13F | Fort Point Capital Partners LLC | 0 | -100,00 | 0 | |||||
| 2026-02-06 | 13F | Pnc Financial Services Group, Inc. | 0 | -100,00 | 0 | |||||
| 2026-02-13 | 13F | Venture Visionary Partners LLC | 37.958 | -0,17 | 3.794 | -0,47 | ||||
| 2026-02-12 | 13F | Rossby Financial, LCC | 0 | -100,00 | 0 | |||||
| 2026-02-18 | 13F | GWM Advisors LLC | 0 | -100,00 | 0 | |||||
| 2026-01-20 | 13F | Coastal Investment Advisors, Inc. | 4 | 0,00 | 0 | |||||
| 2026-01-30 | 13F | Delta Investment Management, LLC | 11.452 | -10,83 | 1.144 | -11,11 | ||||
| 2025-11-10 | 13F | Hartland & Co., LLC | 0 | -100,00 | 0 | |||||
| 2026-02-10 | 13F | Ted Buchan & Co | 4.000 | 0,00 | 400 | -0,25 | ||||
| 2026-02-06 | 13F | Eqis Capital Management, Inc. | 0 | -100,00 | 0 | |||||
| 2026-04-08 | 13F | Fermata Advisors, LLC | 14.958 | 166,16 | 1.499 | 167,02 | ||||
| 2026-02-13 | 13F | Aptus Capital Advisors, LLC | 2.484 | 23,40 | 248 | 23,38 | ||||
| 2026-02-12 | 13F | Hibernia Wealth Partners, LLC | 3.135 | 313 | ||||||
| 2026-04-10 | 13F | Perigon Wealth Management, LLC | 72.702 | 17,77 | 7.284 | 18,07 | ||||
| 2026-01-20 | 13F | Pflug Koory, LLC | 19.081 | -1,96 | 1.907 | -2,26 | ||||
| 2026-02-13 | 13F | Wells Fargo & Company/mn | 2.018.945 | -3,08 | 201.773 | -3,36 | ||||
| 2026-02-10 | 13F | Envestnet Asset Management Inc | 1.329.465 | -7,03 | 132.867 | -7,30 | ||||
| 2026-02-12 | 13F | Jane Street Group, Llc | 10.035 | -42,71 | 1.003 | -42,91 | ||||
| 2026-02-02 | 13F | Oppenheimer Asset Management Inc. | 1.667.225 | 38,66 | 166.622 | 38,26 | ||||
| 2026-01-15 | 13F | Victory Financial Group, Llc | 14.862 | -9,11 | 1.485 | -9,34 | ||||
| 2026-04-13 | 13F | Mather Group, Llc. | 512 | 51 | ||||||
| 2026-04-17 | 13F | Bell Investment Advisors, Inc | 643.921 | 1,73 | 64.514 | 1,98 | ||||
| 2026-02-10 | 13F | Bnp Paribas Arbitrage, Sa | 10 | -99,97 | 1 | -100,00 | ||||
| 2026-02-02 | 13F | Oppenheimer & Co Inc | 81.808 | -14,41 | 8.176 | -14,67 | ||||
| 2026-01-16 | 13F | RHS Financial, LLC | 3.663 | -12,31 | 366 | -12,44 | ||||
| 2026-04-16 | 13F | Spartan Planning & Wealth Management | 74.051 | 7.419 | ||||||
| 2026-01-28 | 13F | CAPROCK Group, Inc. | 19.545 | 273,28 | 1.960 | 273,85 | ||||
| 2026-01-28 | 13F | Migdal Insurance & Financial Holdings Ltd. | 1.025 | 0,00 | 0 | |||||
| 2026-02-11 | 13F | Jpmorgan Chase & Co | 35.813 | -57,22 | 3.579 | -57,34 | ||||
| 2026-02-12 | 13F | Principal Securities, Inc. | 0 | -100,00 | 0 | -100,00 | ||||
| 2026-01-26 | 13F | Kelman-Lazarov, Inc. | 5.283 | -18,46 | 528 | -18,80 | ||||
| 2026-01-15 | 13F | Hara Capital LLC | 25.388 | -40,47 | 2.546 | -40,45 | ||||
| 2026-04-15 | 13F | Redhawk Wealth Advisors, Inc. | 178.311 | 730,78 | 17.865 | 732,82 | ||||
| 2026-01-20 | 13F | Stratos Wealth Partners, LTD. | 9.805 | 21,80 | 980 | 21,46 | ||||
| 2026-02-04 | 13F | Strategic Family Wealth Counselors, L.L.C. | 3.588 | 62,21 | 359 | 62,44 | ||||
| 2026-02-12 | 13F | Saiph Capital, LLC | 0 | -100,00 | 0 | |||||
| 2026-02-13 | 13F | Blueprint Financial Advisors LLC | 43.888 | -26,76 | 4.386 | -26,97 | ||||
| 2026-01-27 | 13F | Belpointe Asset Management LLC | 5.326 | 87,60 | 532 | 87,32 | ||||
| 2026-01-27 | 13F | Silver Coast Investments LLC | 7.375 | -21,91 | 737 | -22,09 | ||||
| 2026-02-05 | 13F | IMG Wealth Management, Inc. | 324 | 0,93 | 32 | 0,00 | ||||
| 2026-02-03 | 13F | International Assets Investment Management, Llc | 6.143 | 94,09 | 614 | 94,60 | ||||
| 2026-01-06 | 13F | Tucker Asset Management Llc | 0 | -100,00 | 0 | |||||
| 2026-02-12 | 13F | Hohimer Wealth Management, Llc | 0 | -100,00 | 0 | |||||
| 2025-12-16 | 13F | Garde Capital, Inc. | 0 | -100,00 | 0 | |||||
| 2026-01-14 | 13F | Spire Wealth Management | 1.676 | 0,00 | 167 | 0,00 | ||||
| 2026-02-04 | 13F | Sloy Dahl & Holst, LLC | 42.772 | 12,73 | 4.275 | 12,38 | ||||
| 2026-02-05 | 13F | HFM Investment Advisors, LLC | 157 | 27,64 | 16 | 25,00 | ||||
| 2025-11-10 | 13F | Choate Investment Advisors | 0 | -100,00 | 0 | -100,00 | ||||
| 2026-02-14 | 13F | Rockefeller Capital Management L.P. | 85.766 | 48,68 | 8.576 | 48,35 | ||||
| 2026-02-10 | 13F | David R. Rahn & Associates Inc. | 23.327 | -11,03 | 2.331 | -11,27 | ||||
| 2026-04-07 | 13F | Investment Partners Asset Management, Inc. | 5.241 | -3,68 | 525 | -3,31 | ||||
| 2026-02-10 | 13F | Moors & Cabot, Inc. | 2.700 | 0,00 | 270 | -0,37 | ||||
| 2026-04-03 | 13F | Investors Research Corp | 1.846 | 3,07 | 185 | 3,37 | ||||
| 2026-04-08 | 13F | Castle Rock Wealth Management, LLC | 81.564 | -4,21 | 8.151 | -4,22 | ||||
| 2026-02-09 | 13F | Key FInancial Inc | 1 | -95,45 | 0 | -100,00 | ||||
| 2026-04-17 | 13F | Guyasuta Investment Advisors Inc | 24.849 | 11,54 | 2.490 | 11,81 | ||||
| 2026-02-05 | 13F | Cambridge Investment Research Advisors, Inc. | 93.329 | 174,89 | 9 | 200,00 | ||||
| 2026-02-17 | 13F | Aqr Capital Management Llc | 39.812 | 3.979 | ||||||
| 2026-01-29 | 13F | Concurrent Investment Advisors, LLC | 8.004 | 172,24 | 800 | 171,77 | ||||
| 2025-11-14 | 13F | Prosperity Consulting Group, LLC | 0 | -100,00 | 0 | |||||
| 2026-02-17 | 13F | Imprint Wealth LLC | 11 | -50,00 | 1 | -50,00 | ||||
| 2026-02-05 | 13F | Blume Capital Management, Inc. | 15.181 | -75,55 | 1.517 | -75,62 | ||||
| 2026-01-29 | 13F | Kestra Private Wealth Services, Llc | 26.643 | -3,75 | 2.663 | -4,04 | ||||
| 2026-02-13 | 13F | Retirement Capital Strategies | 63.706 | 7,31 | 6.367 | 6,99 | ||||
| 2026-01-30 | 13F | Wealthfront Advisers Llc | 1.319.398 | 87,89 | 131.861 | 87,35 | ||||
| 2026-02-02 | 13F | Cairn Investment Group, Inc. | 7.920 | -1,00 | 1 | |||||
| 2026-02-02 | 13F | Tevis Investment Management | 68.207 | 0,00 | 6.836 | 0,00 | ||||
| 2026-02-09 | 13F | Leavell Investment Management, Inc. | 43.622 | 31,75 | 4.374 | 31,83 | ||||
| 2026-02-04 | 13F | Beverly Hills Private Wealth, LLC | 58.971 | 0,00 | 5.911 | 0,00 | ||||
| 2026-02-13 | 13F | Fiduciary Trust Co | 2.666 | -3,62 | 266 | -3,97 | ||||
| 2026-04-16 | 13F | Blue Zone Wealth Advisors, LLC | 0 | -100,00 | 0 | |||||
| 2026-01-26 | 13F | Cwm, Llc | 20.755 | -10,93 | 2 | 0,00 | ||||
| 2026-01-06 | 13F | Canal Capital Management, LLC | 0 | -100,00 | 0 | |||||
| 2026-02-05 | 13F | AlphaCore Capital LLC | 3.219 | 49,65 | 323 | 49,77 | ||||
| 2026-02-10 | 13F | WealthTrak Capital Management LLC | 153.933 | 571,11 | 15.384 | 569,45 | ||||
| 2026-04-10 | 13F | Salvus Wealth Management, LLC | 52.374 | 257,11 | 5.247 | 258,16 | ||||
| 2026-01-20 | 13F | Stratos Wealth Advisors, LLC | 8.747 | 41,72 | 874 | 41,42 | ||||
| 2026-02-11 | 13F | Cornerstone Advisors Asset Management, Inc | 28.189 | -0,47 | 2.818 | -0,74 | ||||
| 2026-02-10 | 13F | Beto Financial Group, Llc | 7.474 | 747 | ||||||
| 2026-04-09 | 13F | Curated Wealth Partners LLC | 4.530 | -85,02 | 454 | -85,01 | ||||
| 2026-02-06 | 13F | Global Retirement Partners, LLC | 8.690 | 42,34 | 869 | 42,06 | ||||
| 2026-02-13 | 13F | Wilkerson Advisory Group LLC | 68.093 | 6.805 | ||||||
| 2025-10-30 | 13F | Envestnet Portfolio Solutions, Inc. | 0 | -100,00 | 0 | |||||
| 2026-04-15 | 13F | Activest Wealth Management | 8.505 | 0,89 | 852 | 1,19 | ||||
| 2026-01-14 | 13F | Accurate Wealth Management, LLC | 44.139 | 48,41 | 4.415 | 48,37 | ||||
| 2026-01-20 | 13F | Ethos Financial Group, LLC | 0 | -100,00 | 0 | -100,00 | ||||
| 2026-04-13 | 13F | Successful Portfolios LLC | 21.256 | -0,67 | 2.130 | -0,51 | ||||
| 2026-02-17 | 13F | Advisor Group Holdings, Inc. | 145.623 | -23,09 | 14.556 | -23,31 | ||||
| 2026-02-03 | 13F | SFG Wealth Management, LLC. | 15.381 | 1.537 | ||||||
| 2026-02-09 | 13F | Frazier Financial Advisors, LLC | 0 | -100,00 | 0 | |||||
| 2026-04-16 | 13F | BridgePort Financial Solutions, LLC | 19.588 | 0,90 | 1.963 | 1,13 | ||||
| 2026-01-21 | 13F | Prime Capital Investment Advisors, LLC | 8.685 | 59,30 | 868 | 58,97 | ||||
| 2026-02-09 | 13F | Premier Financial Group | 0 | -100,00 | 0 | |||||
| 2025-11-14 | 13F | SRS Capital Advisors, Inc. | 0 | -100,00 | 0 | |||||
| 2026-04-15 | 13F | Adamsbrown Wealth Consultants Llc | 0 | -100,00 | 0 | |||||
| 2026-02-11 | 13F | Syon Capital Llc | 42.743 | 4.272 | ||||||
| 2026-02-10 | 13F | Resolute Capital, Llc | 182.687 | 18.258 | ||||||
| 2026-02-11 | 13F | Eldridge Investment Advisors, Inc. | 93.499 | -4,29 | 9.344 | -4,23 | ||||
| 2026-04-09 | 13F | C2P Capital Advisory Group, LLC d.b.a. Prosperity Capital Advisors | 7.769 | -9,48 | 778 | -9,22 | ||||
| 2026-01-21 | 13F | Cane Capital Partners, LLC | 2.050 | 205 | ||||||
| 2026-01-23 | 13F | Altfest L J & Co Inc | 44.220 | -51,01 | 4.419 | -51,15 | ||||
| 2026-02-17 | 13F | Redwood Park Advisors LLC | 491.082 | -0,78 | 49.079 | -1,06 | ||||
| 2026-02-10 | 13F | North Berkeley Wealth Management, LLC | 5.515 | 551 | ||||||
| 2026-01-20 | 13F | Princeton Global Asset Management LLC | 905 | 0,00 | 90 | 0,00 | ||||
| 2026-01-30 | 13F | United Community Bank | 0 | -100,00 | 0 | -100,00 | ||||
| 2026-02-13 | 13F | Citigroup Inc | 28.377 | 24,40 | 2.836 | 24,06 | ||||
| 2026-04-14 | 13F | Arvest Investments, Inc. | 17.656 | 4,36 | 1.769 | 4,67 | ||||
| 2026-02-12 | 13F | Mount Yale Investment Advisors, LLC | 21.274 | 1,43 | 2.133 | 1,47 | ||||
| 2026-02-12 | 13F | BlackRock, Inc. | 8.086 | 39,87 | 808 | 39,55 | ||||
| 2025-11-05 | 13F | Fullcircle Wealth Llc | 45.560 | 17,33 | 4.552 | 17,38 | ||||
| 2026-01-29 | 13F | Comerica Bank | 9.228 | -51,41 | 922 | -51,55 | ||||
| 2026-02-10 | 13F | One Capital Management, LLC | 90.532 | -68,96 | 9.048 | -69,05 | ||||
| 2026-04-16 | 13F | EdgeRock Capital LLC | 2.292 | 214 | ||||||
| 2026-04-16 | 13F | Upper Left Wealth Management, LLC | 3.017 | -4,16 | 302 | -3,82 | ||||
| 2026-02-13 | 13F | Mml Investors Services, Llc | 52.031 | 5,25 | 5.200 | 4,95 | ||||
| 2026-04-07 | 13F | U.S. Capital Wealth Advisors, LLC | 10.841 | -2,06 | 1.086 | -1,81 | ||||
| 2026-02-05 | 13F | Stephens Inc /ar/ | 8.672 | -0,64 | 867 | -0,92 | ||||
| 2026-01-21 | 13F | Financial & Tax Architects, LLC | 37.478 | -42,55 | 3.746 | -42,72 | ||||
| 2026-02-02 | 13F | Truist Financial Corp | 52.389 | 4,91 | 5.236 | 4,60 | ||||
| 2026-04-14 | 13F | Baldwin Brothers Inc/ma | 64.847 | 22,11 | 6.497 | 22,42 | ||||
| 2026-02-04 | 13F | St. James Investment Company, LLC | 448.387 | 5,70 | 44.812 | 5,40 | ||||
| 2026-02-12 | 13F | Triumph Capital Management | 7.854 | -21,94 | 785 | -22,22 | ||||
| 2026-04-07 | 13F | Stonekeep Investments, LLC | 2.266 | 227 | ||||||
| 2026-02-17 | 13F | Wiley Bros.-aintree Capital, Llc | 113.838 | 30,45 | 11.377 | 26,96 | ||||
| 2026-02-10 | 13F | Goldstein Advisors, LLC | 63.277 | -7,22 | 6.324 | -7,49 | ||||
| 2026-01-29 | 13F | Financial Life Planners | 0 | -100,00 | 0 | |||||
| 2026-02-05 | 13F | Trevian Wealth Management LLC | 9.085 | 908 | ||||||
| 2026-01-30 | 13F | Caldwell Trust Co | 641 | 64 | ||||||
| 2026-04-08 | 13F | Wealth Enhancement Advisory Services, Llc | 78.791 | -21,93 | 7.874 | -21,95 | ||||
| 2026-01-29 | 13F | Quadcap Wealth Management, LLC | 12.840 | -6,79 | 1.283 | -7,03 | ||||
| 2026-02-17 | 13F | NorthRock Partners, LLC | 4.806 | 480 | ||||||
| 2026-03-13 | 13F/A | Pensionmark Financial Group, Llc | 5.645 | 564 | ||||||
| 2026-04-13 | 13F | Wolff Wiese Magana Llc | 16.266 | 62,11 | 1.630 | 62,57 | ||||
| 2026-04-15 | 13F | Single Point Partners, LLC | 8.304 | 21,03 | 832 | 21,31 | ||||
| 2026-02-13 | 13F | Flow Traders U.s. Llc | 0 | -100,00 | 0 | |||||
| 2026-02-17 | 13F | Cresset Asset Management, LLC | 3.940 | 5,60 | 395 | 5,90 | ||||
| 2026-01-09 | 13F | Capital Asset Advisory Services LLC | 11.181 | -34,88 | 1.118 | -35,06 | ||||
| 2026-02-13 | 13F | Silicon Valley Capital Partners | 7.308 | 32,44 | 730 | 32,01 | ||||
| 2025-11-12 | 13F | Ascent Capital Management, LLC | 11.157 | 0,88 | 1.118 | 0,99 | ||||
| 2026-01-23 | 13F | HBW Advisory Services LLC | 2.017 | 0,80 | 202 | 0,50 | ||||
| 2026-02-13 | 13F | Ieq Capital, Llc | 8.043 | -6,48 | 804 | -6,74 | ||||
| 2026-04-16 | 13F | VVR Holdings LLC | 5.490 | -32,32 | 550 | -32,22 | ||||
| 2026-02-17 | 13F | Russell Investments Group, Ltd. | 6 | 1 | ||||||
| 2026-02-11 | 13F | Parallel Advisors, LLC | 158 | 58,00 | 16 | 50,00 | ||||
| 2026-02-17 | 13F | Mercer Global Advisors Inc /adv | 2.369 | -43,33 | 237 | -43,54 | ||||
| 2026-01-22 | 13F | Networth Advisors, LLC | 140 | 14 | ||||||
| 2026-02-12 | 13F | Summit Financial, LLC | 0 | -100,00 | 0 | |||||
| 2026-02-17 | 13F | Equitable Holdings, Inc. | 80.308 | -7,78 | 8.026 | -8,05 | ||||
| 2026-02-17 | 13F | Cape Investment Advisory, Inc. | 553 | -0,90 | 55 | 0,00 | ||||
| 2026-02-03 | 13F | We Are One Seven, LLC | 42.257 | -8,18 | 4.223 | -8,43 | ||||
| 2026-04-08 | 13F | Miracle Mile Advisors, LLC | 1.144.439 | -10,63 | 114.661 | -10,40 | ||||
| 2026-02-18 | 13F | Beacon Pointe Advisors, LLC | 16.197 | 43,60 | 1.619 | 43,19 | ||||
| 2026-04-13 | 13F | Garrett Investment Advisors LLC | 3.003 | 301 | ||||||
| 2026-01-20 | 13F | Savvy Advisors, Inc. | 4.120 | 2,62 | 412 | 2,24 | ||||
| 2026-02-12 | 13F | Wealthspire Advisors, LLC | 23.968 | -21,07 | 2.395 | -21,29 | ||||
| 2026-04-08 | 13F | Selby Wealth Management, LLC | 14.050 | -2,93 | 1.408 | -2,70 | ||||
| 2026-02-11 | 13F | Curio Wealth, Llc | 158 | 0,00 | 16 | 0,00 | ||||
| 2026-02-06 | 13F | Lloyd Advisory Services, LLC. | 4 | 0 | ||||||
| 2026-01-16 | 13F | Birchcreek Wealth Management, LLC | 16.487 | 34,51 | 1.648 | 34,12 | ||||
| 2026-02-02 | 13F | Robertson Stephens Wealth Management, LLC | 136.656 | -1,27 | 13.705 | -1,22 | ||||
| 2026-02-13 | 13F | Golden State Wealth Management, LLC | 639 | 0,95 | 64 | 0,00 | ||||
| 2026-04-15 | 13F | Nations Financial Group Inc, /ia/ /adv | 7.211 | -6,30 | 722 | -6,11 | ||||
| 2026-01-15 | 13F | Private Advisory Group LLC | 111.027 | 210,82 | 11.096 | 209,94 | ||||
| 2026-04-07 | 13F | G&S Capital LLC | 20.234 | -36,76 | 2.027 | -36,60 | ||||
| 2026-04-13 | 13F | Creative Financial Designs Inc /adv | 570 | 0,00 | 57 | 1,79 | ||||
| 2026-04-17 | 13F | AdvisorNet Financial, Inc | 2.271 | 14,93 | 228 | 15,23 | ||||
| 2026-02-04 | 13F | Objective Capital Management, LLC | 7.148 | 714 | ||||||
| 2026-01-27 | 13F | Measured Risk Portfolios, Inc. | 32.811 | 317,55 | 3.279 | 316,65 | ||||
| 2026-02-05 | 13F | Western Wealth Management, LLC | 6.144 | 614 | ||||||
| 2026-02-09 | 13F | Clearwater Capital Advisors, LLC | 7.460 | -25,03 | 746 | -25,28 | ||||
| 2026-02-13 | 13F | Potentia Wealth | 15.516 | -2,30 | 1.551 | -2,58 | ||||
| 2026-02-04 | 13F | MADDEN SECURITIES Corp | 65.051 | 44,43 | 6.501 | 44,02 | ||||
| 2026-02-12 | 13F | Steward Partners Investment Advisory, Llc | 35.792 | 2,29 | 3.577 | 2,00 | ||||
| 2026-02-11 | 13F | Tiaa Trust, National Association | 8.102 | -13,37 | 810 | -13,66 | ||||
| 2026-04-17 | 13F | Ignite Planners, LLC | 16.578 | -1,74 | 1.666 | -1,48 | ||||
| 2026-02-13 | 13F | Centaurus Financial, Inc. | 20.733 | 12,92 | 2 | 100,00 | ||||
| 2026-01-26 | 13F | Keystone Wealth Services, LLC | 2.611 | -30,41 | 261 | -30,85 | ||||
| 2026-04-07 | 13F | Five Oceans Advisors | 2.584 | 4,19 | 259 | 4,45 | ||||
| 2026-02-09 | 13F | North Forty Two & Co. | 31.710 | 0,79 | 3.169 | 0,51 | ||||
| 2026-02-12 | 13F | Scotia Capital Inc. | 37.466 | -2,05 | 3.744 | -2,35 | ||||
| 2025-11-06 | 13F | Financial Advocates Investment Management | 7.294 | -47,87 | 731 | -47,82 | ||||
| 2026-01-15 | 13F | Allspring Global Investments Holdings, LLC | 779 | 0,00 | 78 | 0,00 | ||||
| 2026-01-23 | 13F | Assetmark, Inc | 494 | 49.300,00 | 49 | |||||
| 2026-04-10 | 13F | Intellectus Partners, LLC | 10.460 | -16,57 | 1.048 | -16,63 | ||||
| 2026-04-10 | 13F | High Probability Advisors, LLC | 4.693 | -3,08 | 470 | -2,69 | ||||
| 2026-02-13 | 13F | Peak Planning Group, LLC | 7.441 | 744 | ||||||
| 2026-04-16 | 13F | Lifelong Wealth Advisors, Inc. | 5.893 | 590 | ||||||
| 2026-01-09 | 13F | Carr Financial Group Corp | 6.293 | -12,49 | 629 | -12,78 | ||||
| 2026-04-20 | 13F | Sowell Financial Services LLC | 34.071 | 7,74 | 3.414 | 8,01 | ||||
| 2026-01-28 | 13F | EPG Wealth Management LLC | 1.597 | 160 | ||||||
| 2026-01-30 | 13F | Us Bancorp \de\ | 23.786 | -6,51 | 2.377 | -6,78 | ||||
| 2026-02-17 | 13F | Bank Of America Corp /de/ | 2.174.787 | -11,52 | 217.348 | -11,78 | ||||
| 2026-02-13 | 13F | Jacobi Capital Management LLC | 15.158 | 27,51 | 1.515 | 27,12 | ||||
| 2026-01-29 | 13F | Golden State Equity Partners | 2.392 | 239 | ||||||
| 2026-02-13 | 13F | Haverford Trust Co | 2.200 | 0,00 | 220 | -0,45 | ||||
| 2026-02-17 | 13F | Cetera Investment Advisers | 214.999 | 41,41 | 21.487 | 41,01 | ||||
| 2026-02-06 | 13F | Vestmark Advisory Solutions, Inc. | 21.274 | 1,43 | 2.126 | 1,14 | ||||
| 2026-01-28 | 13F | Alesco Advisors Llc | 114.500 | 5,93 | 11.443 | 5,63 | ||||
| 2026-02-06 | 13F | Axxcess Wealth Management, Llc | 36.273 | 24,30 | 3.625 | 23,97 | ||||
| 2026-04-15 | 13F | Sightline Wealth Advisors, LLC | 2.355 | -2,40 | 236 | -2,49 | ||||
| 2026-01-29 | 13F | Finhabits Advisors LLC | 68.829 | 6.879 | ||||||
| 2026-02-10 | 13F | Lido Advisors, LLC | 10.568 | 4,44 | 1.059 | 4,13 | ||||
| 2026-02-13 | 13F | Kestra Advisory Services, LLC | 0 | -100,00 | 0 | |||||
| 2026-02-09 | 13F | Cary Street Partners Financial Llc | 2.173 | -2,25 | 217 | -2,25 | ||||
| 2026-04-16 | 13F | Sterneck Capital Management, LLC | 80.943 | -2,55 | 8.110 | -2,30 | ||||
| 2026-01-27 | 13F | Lodestar Private Asset Management Llc | 3.897 | 389 | ||||||
| 2026-01-21 | 13F | MBL Wealth, LLC | 106.312 | -1,05 | 10.625 | -1,34 | ||||
| 2026-02-17 | 13F | Keebeck Wealth Management, LLC | 174.587 | 7,35 | 17.507 | 7,40 | ||||
| 2026-01-22 | 13F | Columbia Advisory Partners Llc | 0 | -100,00 | 0 | |||||
| 2026-01-23 | 13F | Westside Investment Management, Inc. | 17.518 | 1,42 | 1.751 | 1,10 | ||||
| 2025-11-12 | 13F | Ameriflex Group, Inc. | 0 | -100,00 | 0 | |||||
| 2026-01-30 | 13F | Cannon Capital Management, Inc. | 112.871 | 11.280 | ||||||
| 2026-02-13 | 13F | Vivaldi Capital Management, LLC | 159.721 | 13,72 | 15.963 | 13,40 | ||||
| 2026-02-17 | 13F | Advisory Services Network, LLC | 6.214 | 13,54 | 621 | 13,14 | ||||
| 2026-04-09 | 13F | Secure Asset Management, LLC | 2.170 | 217 | ||||||
| 2026-02-05 | 13F | Navalign, LLC | 2.385 | 0,00 | 238 | -0,42 | ||||
| 2026-02-13 | 13F | Harborfront Financial Group LLC | 2.662 | 266 | ||||||
| 2026-01-22 | 13F | Maseco Llp | 246 | 25 | ||||||
| 2026-01-29 | 13F | Camelot Portfolios, LLC | 2.091 | -1,97 | 209 | -2,35 | ||||
| 2026-01-20 | 13F | SOA Wealth Advisors, LLC. | 122 | 1,67 | 12 | 0,00 | ||||
| 2026-04-07 | 13F | CoreCap Advisors, LLC | 758 | -17,52 | 76 | -17,58 | ||||
| 2026-01-29 | 13F | Dunhill Financial, LLC | 2 | 0,00 | ||||||
| 2026-01-29 | 13F | Atlas Legacy Advisors, LLC | 25.382 | 9,96 | 2.537 | 9,64 | ||||
| 2026-01-28 | 13F | Turtle Creek Wealth Advisors, LLC | 18.422 | 184,11 | 1.841 | 183,67 | ||||
| 2026-02-05 | 13F | Atria Investments Llc | 222.554 | 22,76 | 22.242 | 22,41 | ||||
| 2026-02-17 | 13F | Gotham Asset Management, LLC | 49.410 | -0,01 | 4.938 | -0,28 | ||||
| 2026-01-27 | 13F | WealthCollab, LLC | 236 | 0,00 | 24 | 0,00 | ||||
| 2026-01-26 | 13F | Elevation Capital Advisory, LLC | 12.698 | 1.269 | ||||||
| 2026-01-22 | 13F | Vision Financial Markets Llc | 7 | 0,00 | 1 | |||||
| 2026-04-20 | 13F | Ronald Blue Trust, Inc. | 7.459 | -13,35 | 747 | -13,14 | ||||
| 2026-02-09 | 13F | Integrity Alliance, Llc. | 15.419 | 1.541 | ||||||
| 2026-02-09 | 13F | Kingsview Wealth Management, LLC | 2.990 | 32,36 | 299 | 31,86 | ||||
| 2026-01-26 | 13F | Prosperity Financial Group, Inc. | 3.071 | 307 | ||||||
| 2026-02-17 | 13F | Susquehanna International Group, Llp | 2.606 | 260 | ||||||
| 2026-04-09 | 13F | Central Valley Advisors, Llc | 2.145 | 215 | ||||||
| 2026-02-11 | 13F | O'shaughnessy Asset Management, Llc | 1.453 | -36,94 | 145 | -36,96 | ||||
| 2026-02-12 | 13F | Hrt Financial Lp | 17.646 | 141,36 | 2 | |||||
| 2026-02-03 | 13F | Oak Family Advisors, Llc | 0 | -100,00 | 0 | -100,00 | ||||
| 2026-01-26 | 13F | AE Wealth Management LLC | 8.040 | 49,86 | 803 | 49,53 | ||||
| 2026-02-12 | 13F | Gerber Kawasaki Wealth & Investment Management | 18.164 | 502,85 | 1.815 | 500,99 | ||||
| 2026-04-10 | 13F | Magnus Financial Group LLC | 0 | -100,00 | 0 | |||||
| 2026-02-05 | 13F | Allworth Financial LP | 2.956 | 0,00 | 295 | -0,34 | ||||
| 2026-02-12 | 13F | CIBC Private Wealth Group, LLC | 114 | 11 | ||||||
| 2026-02-10 | 13F | Verus Capital Partners, Llc | 121.481 | 22,83 | 12.141 | 22,48 | ||||
| 2026-02-10 | 13F | Titan Global Capital Management Usa Llc | 11.719 | 48,79 | 1.171 | 48,42 | ||||
| 2026-02-17 | 13F | Hilltop Holdings Inc. | 7.599 | 28,56 | 759 | 28,21 | ||||
| 2026-02-09 | 13F | Valued Retirements, Inc. | 0 | -100,00 | 0 | |||||
| 2026-01-29 | 13F | Sanctuary Advisors, LLC | 18.172 | 28,16 | 1.816 | 27,80 | ||||
| 2026-02-12 | 13F | Colonial Trust Advisors | 45 | -8,16 | 5 | 0,00 | ||||
| 2026-02-13 | 13F | Arkadios Wealth Advisors | 6.606 | 88,85 | 660 | 88,57 | ||||
| 2026-02-10 | 13F | Fort Sheridan Advisors Llc | 4.691 | 86,52 | 469 | 85,71 | ||||
| 2026-01-14 | 13F | Chatham Capital Group, Inc. | 7.120 | -10,10 | 712 | -10,34 | ||||
| 2026-02-12 | 13F | Hardworking Capital Advisors, LLC | 17.095 | 1.708 | ||||||
| 2026-02-10 | 13F | Rock Creek Group, LP | 275.894 | -19,45 | 27.573 | -19,68 | ||||
| 2026-02-11 | 13F | Cerity Partners LLC | 0 | -100,00 | 0 | |||||
| 2026-01-21 | 13F | Modera Wealth Management, LLC | 8.124 | 3,58 | 812 | 3,18 | ||||
| 2026-04-10 | 13F | Quaker Wealth Management, LLC | 3 | 0,00 | 0 | |||||
| 2026-02-14 | 13F | Copley Financial Group, Inc. | 10.661 | 125,25 | 1.065 | 124,68 | ||||
| 2025-11-06 | 13F | Naviter Wealth, LLC | 0 | -100,00 | 0 | |||||
| 2025-11-06 | 13F | Midwest Trust Co | 0 | -100,00 | 0 | |||||
| 2026-02-13 | 13F | MAI Capital Management | 486 | -1,82 | 49 | -2,04 | ||||
| 2026-04-13 | 13F | Lake Street Financial Llc | 0 | -100,00 | 0 | |||||
| 2025-11-14 | 13F | Capitolis Liquid Global Markets LLC | 0 | -100,00 | 0 | |||||
| 2026-02-09 | 13F | Putnam Fl Investment Management Co | 0 | -100,00 | 0 | |||||
| 2026-02-17 | 13F | Quantinno Capital Management LP | 233.683 | 2,19 | 23.354 | 1,90 | ||||
| 2026-01-23 | 13F | Burney Co/ | 11.463 | -7,80 | 1.146 | -8,11 | ||||
| 2026-01-29 | 13F | TKG Advisors, LLC | 3.818 | -9,50 | 382 | -9,72 | ||||
| 2026-02-03 | 13F | Winch Advisory Services, LLC | 117.486 | 47,31 | 11.742 | 46,89 | ||||
| 2026-02-13 | 13F | Smartleaf Asset Management LLC | 68 | -15,00 | 7 | -25,00 | ||||
| 2026-02-12 | 13F | Helium Advisors LLC | 48.623 | -27,48 | 4.859 | -27,69 | ||||
| 2026-01-26 | 13F | Valmark Advisers, Inc. | 9.176 | -23,42 | 917 | -23,65 | ||||
| 2026-01-13 | 13F | Kathmere Capital Management, LLC | 2.008 | 0,00 | 201 | -0,50 | ||||
| 2026-02-02 | 13F | Fulcrum Wealth Advisors, Llc | 2.131 | 213 | ||||||
| 2026-02-17 | 13F | Ameriprise Financial Inc | 305.158 | -36,14 | 30.483 | -35,63 | ||||
| 2025-11-13 | 13F | Baird Financial Group, Inc. | 0 | -100,00 | 0 | |||||
| 2026-04-06 | 13F | CX Institutional | 1.081 | -8,85 | 0 | |||||
| 2026-01-23 | 13F | Optima Capital Llc | 59 | 6 | ||||||
| 2026-02-17 | 13F | Warren Averett Asset Management, LLC | 8.240 | 51,89 | 824 | 51,57 | ||||
| 2026-01-07 | 13F | Harbour Capital Advisors, LLC | 11.650 | 1.165 | ||||||
| 2026-02-13 | 13F | Pin Oak Investment Advisors Inc | 2.750 | 0,00 | 0 | -100,00 | ||||
| 2026-02-17 | 13F | Tower Research Capital LLC (TRC) | 688 | 69 | ||||||
| 2026-02-17 | 13F | Blair William & Co/il | 8.099 | 1,89 | 809 | 1,63 | ||||
| 2026-02-09 | 13F | Global Assets Advisory, LLC | 2.666 | 16,06 | 266 | 15,65 | ||||
| 2026-01-28 | 13F | Nicholson Meyer Capital Management, Inc. | 77.554 | 0,71 | 7.751 | 0,41 | ||||
| 2026-02-17 | 13F/A | Kovack Advisors, Inc. | 24.332 | 2.432 | ||||||
| 2026-04-15 | 13F | Retireful, LLC | 0 | -100,00 | 0 | |||||
| 2025-11-13 | 13F | Texas Capital Bancshares Inc/tx | 315 | 32 | ||||||
| 2025-10-24 | 13F | Bristlecone Advisors, LLC | 12.204 | -20,59 | 1.223 | -20,53 | ||||
| 2026-02-13 | 13F | Arete Wealth Advisors, LLC | 2.312 | -37,05 | 0 | |||||
| 2025-11-10 | 13F | Lion Street Advisors, LLC | 0 | -100,00 | 0 | |||||
| 2026-02-25 | 13F | Thryve Wealth Management Llc | 10.412 | 1.041 | ||||||
| 2026-02-12 | 13F | StoneX Group Inc. | 0 | -100,00 | 0 | -100,00 | ||||
| 2026-04-16 | 13F | Capital Advisors, Ltd. LLC | 30.460 | -21,08 | 3 | 0,00 | ||||
| 2026-01-14 | 13F | Barnes Dennig Private Wealth Management LLC | 15.561 | 14,48 | 1.555 | 14,17 | ||||
| 2026-04-13 | 13F | Bourgeon Capital Management Llc | 16.686 | 42,59 | 1.672 | 42,94 | ||||
| 2026-02-17 | 13F | Brooks, Moore & Associates, Inc. | 24.840 | 8,05 | 2.483 | 7,73 | ||||
| 2026-02-12 | 13F | Betterment LLC | 5.862.171 | 3,95 | 586 | 3,54 | ||||
| 2026-01-15 | 13F | Cannon Advisors, Inc. | 9.822 | 48,44 | 983 | 48,34 | ||||
| 2026-02-13 | 13F/A | Archvest Wealth Advisors, Inc. | 7.369 | 88,37 | 736 | 87,76 | ||||
| 2026-02-17 | 13F | Private Advisor Group, LLC | 206.600 | 2,44 | 20.648 | 2,14 | ||||
| 2026-04-17 | 13F | Values First Advisors, Inc. | 2.480 | 0,81 | 249 | 1,22 | ||||
| 2026-02-17 | 13F | Blueprint Investment Partners LLC | 44.205 | -26,24 | 4.418 | -26,46 | ||||
| 2025-11-14 | 13F | Integrated Wealth Concepts LLC | 0 | -100,00 | 0 | |||||
| 2026-04-13 | 13F | IFP Advisors, Inc | 2.896 | -15,05 | 290 | -14,71 | ||||
| 2026-02-04 | 13F | Valeo Financial Advisors, LLC | 8.086 | 808 | ||||||
| 2026-02-10 | 13F | Foundations Investment Advisors, LLC | 3.208 | 321 | ||||||
| 2026-02-09 | 13F | GatePass Capital, LLC | 49.400 | -3,23 | 4.937 | -3,50 | ||||
| 2026-04-14 | 13F | Prospera Financial Services Inc | 2.416 | -1,23 | 242 | -0,82 | ||||
| 2026-02-13 | 13F | Stifel Financial Corp | 359.014 | 8,80 | 35.880 | 8,48 | ||||
| 2026-04-15 | 13F | Atwood & Palmer Inc | 38.925 | 15,19 | 3.900 | 15,46 | ||||
| 2026-02-13 | 13F | Tradewinds, LLC. | 90.144 | 99,19 | 9.009 | 98,61 | ||||
| 2026-04-20 | 13F | TrueMark Investments, LLC | 0 | -100,00 | 0 | |||||
| 2025-10-23 | 13F | Park Avenue Securities Llc | 0 | -100,00 | 0 | |||||
| 2026-02-17 | 13F | Royal Bank Of Canada | 1.323.176 | 6,58 | 132.238 | 6,27 | ||||
| 2026-02-02 | 13F | Everest Management Corp. | 19.242 | -47,54 | 1.923 | -47,69 | ||||
| 2026-01-20 | 13F | Sheets Smith Wealth Management | 0 | -100,00 | 0 | -100,00 | ||||
| 2026-02-06 | 13F | 3EDGE Asset Management, LP | 146.414 | -61,16 | 14.678 | -61,15 | ||||
| 2026-02-19 | 13F | Atomi Financial Group, Inc. | 8.949 | -35,28 | 894 | -35,45 | ||||
| 2026-02-10 | 13F | Acorn Wealth Advisors, LLC | 2.715 | 1,08 | 271 | 0,74 | ||||
| 2026-02-06 | 13F | HighTower Advisors, LLC | 31.255 | -0,88 | 3.124 | -1,17 | ||||
| 2026-01-27 | 13F | PFG Advisors | 2.847 | 0,85 | 285 | 0,71 | ||||
| 2026-02-09 | 13F | Harbour Investments, Inc. | 379 | 0,00 | 38 | 0,00 | ||||
| 2026-01-28 | 13F | Chicago Partners Investment Group LLC | 195.548 | 0,37 | 19.582 | 0,31 | ||||
| 2026-02-10 | 13F/A | Northwestern Mutual Wealth Management Co | 544.518 | -6,87 | 54.419 | -7,14 |