Grundlæggende statistik
| Institutionelle aktier (lange) | 87.128.088 - 85,41% (ex 13D/G) - change of -15,84MM shares -15,39% MRQ |
| Institutionel værdi (lang) | $ 10.137.987 USD ($1000) |
Institutionelt ejerskab og aktionærer
DT Midstream, Inc. (US:DTM) har 666 institutionelle ejere og aktionærer, der har indsendt 13D/G- eller 13F-formularer til Securities Exchange Commission (SEC). Disse institutioner har i alt 87,128,088 aktier. Største aktionærer omfatter Vanguard Group Inc, BlackRock, Inc., State Street Corp, Deutsche Bank Ag\, 59 North Capital Management, LP, Tortoise Capital Advisors, L.l.c., Neuberger Berman Group LLC, Dimensional Fund Advisors Lp, Goldman Sachs Group Inc, and Geode Capital Management, Llc .
DT Midstream, Inc. (NYSE:DTM) institutionel ejerskabsstruktur viser aktuelle positioner i virksomheden efter institutioner og fonde, samt seneste ændringer i positionsstørrelse. Større aktionærer kan omfatte individuelle investorer, investeringsforeninger, hedgefonde eller institutioner. Skema 13D angiver, at investoren besidder (eller besidder) mere end 5 % af virksomheden og har til hensigt (eller har til hensigt at) aktivt at forfølge en ændring i forretningsstrategi. Skema 13G indikerer en passiv investering på over 5%.
The share price as of May 1, 2026 is 147,46 / share. Previously, on May 5, 2025, the share price was 101,60 / share. This represents an increase of 45,14% over that period.

Fondens stemningsscore
Fund Sentiment Score (fka Ownership Accumulation Score) finder de aktier, der bliver mest købt af fonde. Det er resultatet af en sofistikeret, multi-faktor kvantitativ model, der identificerer virksomheder med de højeste niveauer af institutionel akkumulering. Scoringsmodellen bruger en kombination af den samlede stigning i oplyste ejere, ændringerne i porteføljeallokeringer i disse ejere og andre målinger. Tallet går fra 0 til 100, hvor højere tal indikerer et højere niveau af akkumulering for sine jævnaldrende, og 50 er gennemsnittet.
Opdateringsfrekvens: Dagligt
Se Ownership Explorer, som giver en liste over højest rangerende virksomheder.
AI+ Ask Fintel’s AI assistant about DT Midstream, Inc..
Select a question to share a public post with an AI-crafted answer.
Thinking of good questions…
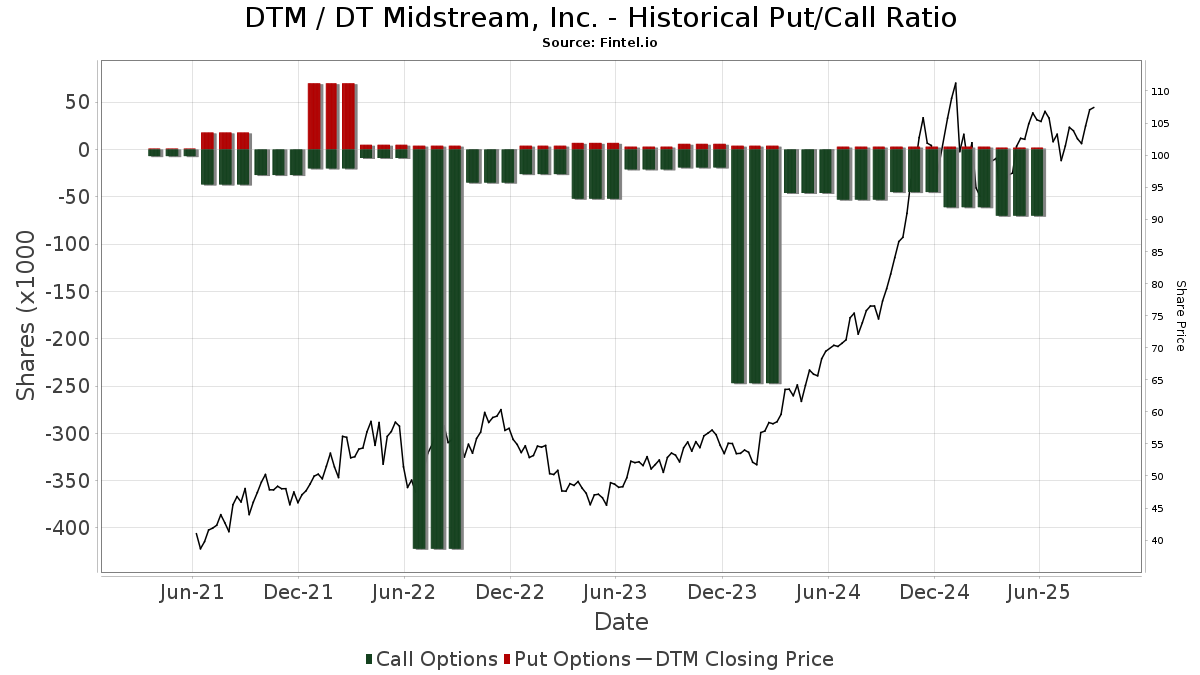
Institutionel Put/Call-forhold
Ud over at indberette standardaktie- og gældsudstedelser skal institutter med mere end 100 mill. aktiver under forvaltning også oplyse deres put- og call-optionsbeholdninger. Da salgsoptioner generelt indikerer negativ stemning, og købsoptioner indikerer positiv stemning, kan vi få en fornemmelse af den overordnede institutionelle stemning ved at plotte forholdet mellem put og kald. Diagrammet til højre viser det historiske put/call-forhold for dette instrument.
Brug af Put/Call Ratio som en indikator for investorernes stemning overvinder en af de vigtigste mangler ved at bruge totalt institutionelt ejerskab, som er, at en betydelig mængde af aktiver under forvaltning investeres passivt for at spore indekser. Passivt forvaltede fonde køber typisk ikke optioner, så indikatoren for put/call-forholdet følger mere nøje følelsen af aktivt forvaltede fonde.
13D/G-arkivering
Vi præsenterer 13D/G ansøgninger separat fra 13F ansøgninger på grund af den forskellige behandling af SEC. 13D/G-ansøgninger kan indgives af grupper af investorer (med én ledende), hvorimod 13F-ansøgninger ikke kan. Dette resulterer i situationer, hvor en investor kan indsende en 13D/G, der rapporterer én værdi for de samlede aktier (der repræsenterer alle de aktier, der ejes af investorgruppen), men derefter indsender en 13F, der rapporterer en anden værdi for de samlede aktier (der udelukkende repræsenterer deres egne) ejendomsret). Det betyder, at aktieejerskab af 13D/G-arkiver og 13F-arkiveringer ofte ikke er direkte sammenlignelige, så vi præsenterer dem separat.
Bemærk: Fra den 16. maj 2021 viser vi ikke længere ejere, der ikke har indsendt en 13D/G inden for det seneste år. Tidligere viste vi den fulde historie af 13D/G-arkiver. Generelt skal enheder, der er forpligtet til at indgive 13D/G-ansøgninger, indgive mindst årligt, før de indsender en afsluttende ansøgning. Dog forlader fonde nogle gange positioner uden at indsende en afsluttende ansøgning (dvs. de afvikler), så visning af den fulde historie resulterede nogle gange i forvirring om det nuværende ejerskab. For at undgå forvirring viser vi nu kun 'aktuelle' ejere - det vil sige - ejere, der har anmeldt inden for det seneste år.
Upgrade to unlock premium data.
| Fil dato | Form | Investor | Forrige Aktier |
Seneste Aktier |
Δ Aktier (Procent) |
Ejendomsret (Procent) |
Δ Ejerskab (Procent) |
|
|---|---|---|---|---|---|---|---|---|
| 2026-04-29 | VANGUARD CAPITAL MANAGEMENT LLC | 5,326,210 | 5.22 | |||||
| 2026-04-29 | VANGUARD PORTFOLIO MANAGEMENT LLC | 5,902,513 | 5.78 | |||||
| 2026-03-26 | VANGUARD GROUP INC | 10,248,563 | 0 | -100.00 | 0.00 | -100.00 | ||
| 2025-10-03 | BlackRock, Inc. | 10,073,651 | 10,282,157 | 2.07 | 10.10 | 2.02 |
13F og NPORT arkivering
Detaljer om 13F-arkivering er gratis. Detaljer om NP-ansøgninger kræver et premium-medlemskab. Grønne rækker angiver nye positioner. Røde rækker angiver lukkede positioner. Klik på linket ikon for at se den fulde transaktionshistorik.
Opgrader
for at låse premium-data op og eksportere til Excel ![]() .
.
| Fil dato | Kilde | Investor | Type | Gennemsnitlig pris (Øst) |
Aktier | Δ Aktier (%) |
Rapporteret Værdi ($1000) |
Δ Værdi (%) |
Port Alloc (%) |
|
|---|---|---|---|---|---|---|---|---|---|---|
| 2026-02-10 | 13F | Savant Capital, LLC | 7.180 | -2,13 | 859 | 3,62 | ||||
| 2026-04-29 | 13F | Envestnet Portfolio Solutions, Inc. | 13.422 | -2,92 | 1.808 | 9,25 | ||||
| 2026-04-16 | 13F | Toth Financial Advisory Corp | 174 | 0,00 | 23 | 15,00 | ||||
| 2026-02-05 | 13F | AlphaCore Capital LLC | 1.838 | 220 | ||||||
| 2026-04-22 | 13F | Spire Wealth Management | 349 | -14,04 | 47 | -2,08 | ||||
| 2026-05-01 | 13F | Thrivent Financial For Lutherans | 40.353 | 0,03 | 5 | 25,00 | ||||
| 2026-04-21 | 13F | Venturi Wealth Management, LLC | 1.100 | 148 | ||||||
| 2026-01-15 | 13F | Burns Matteson Capital Management, LLC | 3.972 | 0,00 | 475 | 5,79 | ||||
| 2026-02-06 | 13F | Covestor Ltd | 897 | 11,15 | 0 | |||||
| 2026-02-13 | 13F | Mariner, LLC | 0 | -100,00 | 0 | |||||
| 2026-02-17 | 13F | Greenland Capital Management LP | 4.000 | 479 | ||||||
| 2026-03-26 | 13F/A | Peak6 Llc | Call | 0 | -100,00 | 0 | -100,00 | |||
| 2026-02-05 | 13F | Allworth Financial LP | 3.349 | 108,92 | 401 | 120,99 | ||||
| 2026-02-10 | 13F | Intech Investment Management Llc | 23.421 | -84,10 | 2.803 | -83,17 | ||||
| 2026-04-27 | 13F | Pensionmark Financial Group, Llc | 0 | -100,00 | 0 | |||||
| 2026-02-05 | 13F | Northwestern Mutual Investment Management Company, Llc | 22.748 | 0,45 | 2.722 | 6,33 | ||||
| 2026-04-27 | 13F | HB Wealth Management, LLC | 5.001 | 14,60 | 674 | 28,93 | ||||
| 2026-04-29 | 13F | Oregon Public Employees Retirement Fund | 20.915 | 2,95 | 2.817 | 15,84 | ||||
| 2026-04-30 | 13F | Acorn Wealth Advisors, LLC | 2.948 | 41,66 | 397 | 59,04 | ||||
| 2026-02-17 | 13F | Susquehanna Portfolio Strategies, LLC | 137.390 | 9,93 | 16.443 | 16,37 | ||||
| 2026-04-13 | 13F | Chickasaw Capital Management Llc | 391.282 | 39,77 | 53 | 57,58 | ||||
| 2026-04-08 | 13F | Wealth Enhancement Advisory Services, Llc | 10.015 | -28,95 | 1.343 | -19,01 | ||||
| 2026-04-23 | 13F | Marquette Asset Management, LLC | 14 | 0,00 | 2 | 0,00 | ||||
| 2026-02-19 | 13F | Mcguire Capital Advisors Inc | 125 | 15 | ||||||
| 2026-04-30 | 13F | Valued Wealth Advisors LLC | 4 | 0,00 | 1 | |||||
| 2026-02-04 | 13F | HighPoint Advisor Group LLC | 7.561 | 4,88 | 905 | 10,92 | ||||
| 2026-04-24 | 13F | Eagle Bay Advisors LLC | 0 | -100,00 | 0 | |||||
| 2026-01-29 | 13F | D.a. Davidson & Co. | 1.968 | 1,60 | 236 | 7,31 | ||||
| 2026-04-10 | 13F | Armstrong Advisory Group, Inc | 50 | 0,00 | 7 | 20,00 | ||||
| 2026-04-13 | 13F | St Germain D J Co Inc | 0 | -100,00 | 0 | |||||
| 2026-02-17 | 13F | Ameriprise Financial Inc | 111.439 | -10,69 | 13.350 | -5,47 | ||||
| 2026-02-12 | 13F | Rossby Financial, LCC | 12 | -14,29 | 1 | 0,00 | ||||
| 2025-11-17 | 13F | Harvest Investment Services, LLC | 0 | -100,00 | 0 | |||||
| 2026-02-13 | 13F | Dockside LLC | 7.972 | 954 | ||||||
| 2026-02-17 | 13F | Snowden Capital Advisors LLC | 1.802 | -2,22 | 217 | 3,33 | ||||
| 2026-02-13 | 13F | Charles Schwab Investment Management Inc | 772.879 | -0,85 | 92.498 | 4,96 | ||||
| 2025-11-12 | 13F | CIBC Bancorp USA Inc. | 383.396 | 43.347 | ||||||
| 2026-04-08 | 13F | Quantum Financial Advisors, LLC | 1.924 | 0,00 | 259 | 12,61 | ||||
| 2026-04-28 | 13F | Cushing Asset Management, Lp | 727.100 | -2,96 | 97.919 | 9,19 | ||||
| 2026-02-11 | 13F | Metis Global Partners, LLC | 10.092 | 14,59 | 1.208 | 21,31 | ||||
| 2026-02-13 | 13F | Toroso Investments, LLC | 1.947 | -82,62 | 233 | -81,60 | ||||
| 2026-04-22 | 13F | Patriot Financial Group Insurance Agency, LLC | 1.540 | 207 | ||||||
| 2026-02-17 | 13F | Boothbay Fund Management, Llc | 0 | -100,00 | 0 | -100,00 | ||||
| 2026-04-23 | 13F | Impact Partnership Wealth, LLC | 0 | -100,00 | 0 | |||||
| 2025-11-14 | 13F | Sofos Investments, Inc. | 0 | -100,00 | 0 | |||||
| 2026-02-17 | 13F | Energy Income Partners, LLC | 425.669 | -57,69 | 50.944 | -55,21 | ||||
| 2026-02-17 | 13F | Price T Rowe Associates Inc /md/ | 80.699 | 2,25 | 10 | 12,50 | ||||
| 2026-02-17 | 13F | Guggenheim Capital Llc | 2.480 | -56,78 | 297 | -54,32 | ||||
| 2026-04-22 | 13F | Fort Washington Investment Advisors Inc /oh/ | 33.613 | -7,22 | 4.527 | 4,41 | ||||
| 2026-02-17 | 13F | Signature Equity Partners, LLC | 25 | 3 | ||||||
| 2026-02-17 | 13F | Numerai GP LLC | 20.560 | 39,46 | 2.461 | 47,66 | ||||
| 2026-04-30 | 13F | Nisa Investment Advisors, Llc | 16.521 | 0,03 | 2.239 | 12,51 | ||||
| 2026-02-13 | 13F | Neuberger Berman Group LLC | 2.782.736 | -0,51 | 333.046 | 5,31 | ||||
| 2026-04-22 | 13F | Retirement Guys Formula Llc | 10.257 | 1.381 | ||||||
| 2026-02-17 | 13F | Maryland State Retirement & Pension System | 100.629 | 1,54 | 12.043 | 7,49 | ||||
| 2026-02-18 | 13F | Mackenzie Financial Corp | 1.884 | -79,71 | 227 | -78,36 | ||||
| 2026-04-15 | 13F | Financial Management Professionals, Inc. | 12 | 0,00 | 2 | 0,00 | ||||
| 2026-02-10 | 13F | Principia Wealth Advisory, LLC | 6 | 0,00 | 1 | |||||
| 2026-02-10 | 13F | Norges Bank | 966.869 | 115.715 | ||||||
| 2026-02-17 | 13F | Zacks Investment Management | 0 | -100,00 | 0 | |||||
| 2026-02-13 | 13F | Public Employees Retirement Association Of Colorado | 7.916 | 0,00 | 1 | |||||
| 2026-02-12 | 13F | Ensign Peak Advisors, Inc | 70.998 | 308,57 | 8.497 | 332,64 | ||||
| 2025-11-14 | 13F | Binnacle Investments Inc | 20 | 81,82 | 2 | 100,00 | ||||
| 2026-01-14 | 13F | Wealthcare Advisory Partners LLC | 0 | -100,00 | 0 | |||||
| 2026-02-17 | 13F | NEOS Investment Management LLC | 12.376 | 1.481 | ||||||
| 2026-02-06 | 13F | EverSource Wealth Advisors, LLC | 4.516 | -4,95 | 540 | 0,56 | ||||
| 2025-11-13 | 13F | Empowered Funds, LLC | 0 | -100,00 | 0 | |||||
| 2026-02-11 | 13F | Krane Funds Advisors LLC | 1.740 | -10,31 | 208 | -0,95 | ||||
| 2026-02-17 | 13F | DV Trading LLC | 100 | 12 | ||||||
| 2026-02-17 | 13F | Glenmede Trust Co Na | 24.596 | -27,16 | 2.944 | -9,64 | ||||
| 2026-02-17 | 13F | Advisor Group Holdings, Inc. | 38.898 | -1,27 | 4.657 | 9,76 | ||||
| 2026-02-17 | 13F | Man Group plc | 91.578 | 69,68 | 10.960 | 79,61 | ||||
| 2026-04-29 | 13F | Skopos Labs, Inc. | 6.572 | 56,70 | 885 | 74,90 | ||||
| 2026-04-07 | 13F | Carolina Wealth Advisors, LLC | 0 | -100,00 | 0 | |||||
| 2026-02-17 | 13F | Shelton Capital Management | 3.389 | -4,94 | 406 | 0,50 | ||||
| 2026-02-13 | 13F | FORA Capital, LLC | 2.619 | 313 | ||||||
| 2026-04-13 | 13F | Hm Payson & Co | 150 | 0,00 | 20 | 17,65 | ||||
| 2026-04-23 | 13F | Private Wealth Management Group, LLC | 49 | 0,00 | 7 | 20,00 | ||||
| 2026-01-30 | 13F | Mitsubishi UFJ Trust & Banking Corp | 650.077 | -13,07 | 77.801 | -7,98 | ||||
| 2026-05-01 | 13F | Anchor Investment Management, LLC | 17 | 0,00 | 2 | 0,00 | ||||
| 2026-02-03 | 13F | Crossmark Global Holdings, Inc. | 8.416 | -3,24 | 1.007 | 2,44 | ||||
| 2026-02-23 | 13F | Wealth Preservation Advisors, LLC | 32 | 0,00 | 4 | 0,00 | ||||
| 2026-01-29 | 13F | State Of Michigan Retirement System | 24.055 | -0,41 | 2.879 | 5,42 | ||||
| 2026-02-13 | 13F | State Street Corp | 3.194.831 | -0,14 | 384.937 | 5,66 | ||||
| 2026-04-27 | 13F | Greenleaf Trust | 2.463 | 2,58 | 332 | 15,33 | ||||
| 2026-02-13 | 13F | Squarepoint Ops LLC | 204.242 | 2.466,18 | 24.444 | 2.618,91 | ||||
| 2026-02-17 | 13F | ISAM Funds (UK) Ltd | 0 | -100,00 | 0 | |||||
| 2026-02-03 | 13F | Mitsubishi UFJ Kokusai Asset Management Co., Ltd. | 215 | 0,00 | 26 | 8,33 | ||||
| 2025-11-14 | 13F | D. E. Shaw & Co., Inc. | 0 | -100,00 | 0 | |||||
| 2026-04-07 | 13F | Mb, Levis & Associates, Llc | 82 | 0,00 | 11 | 22,22 | ||||
| 2026-02-13 | 13F | Aigen Investment Management, Lp | 0 | -100,00 | 0 | |||||
| 2026-04-29 | 13F | Strategic Financial Group, LLC | 3.772 | 508 | ||||||
| 2026-04-13 | 13F | IFP Advisors, Inc | 1.537 | 0,99 | 207 | 13,19 | ||||
| 2026-02-11 | 13F | Invst, LLC | 7.085 | -7,65 | 848 | -2,31 | ||||
| 2026-01-23 | 13F | Assetmark, Inc | 436 | 9,27 | 52 | 15,56 | ||||
| 2026-01-29 | 13F | Copeland Capital Management, LLC | 245.257 | -5,16 | 29.352 | 0,40 | ||||
| 2026-02-17 | 13F | Royal Bank Of Canada | 93.597 | -35,16 | 11.201 | -31,37 | ||||
| 2026-02-18 | 13F | First Citizens Bank & Trust Co | 14.454 | 2,19 | 1.730 | 8,13 | ||||
| 2026-04-30 | 13F | Mascoma Wealth Management LLC | 107 | 0,00 | 14 | 16,67 | ||||
| 2026-02-17 | 13F | Toronto Dominion Bank | 23 | -78,50 | 3 | -83,33 | ||||
| 2026-02-18 | 13F | State of Tennessee, Treasury Department | 28.039 | -4,10 | 3.533 | 6,90 | ||||
| 2026-04-23 | 13F | Oppenheimer Asset Management Inc. | 6.442 | 8,58 | 868 | 22,11 | ||||
| 2026-02-13 | 13F | Kayne Anderson Capital Advisors Lp | 863.526 | -0,40 | 103.347 | 5,43 | ||||
| 2025-11-14 | 13F | Point72 (DIFC) Ltd | 291 | 33 | ||||||
| 2026-02-17 | 13F | Cresset Asset Management, LLC | 8.046 | 220,69 | 968 | 239,65 | ||||
| 2026-04-06 | 13F | CX Institutional | 3.372 | -5,92 | 0 | |||||
| 2026-02-17 | 13F | Credit Agricole S A | 19.955 | 0,00 | 2.388 | 5,85 | ||||
| 2026-04-30 | 13F | Private Trust Co Na | 512 | -13,95 | 69 | -4,23 | ||||
| 2026-02-06 | 13F | Larson Financial Group LLC | 1.108 | 11,13 | 133 | 17,86 | ||||
| 2026-01-23 | 13F | Halbert Hargrove Global Advisors, Llc | 0 | -100,00 | 0 | |||||
| 2026-01-26 | 13F | AE Wealth Management LLC | 12.722 | 10,23 | 1.523 | 16,72 | ||||
| 2026-04-20 | 13F | McKinley Carter Wealth Services, Inc. | 1.848 | 0,00 | 249 | 12,22 | ||||
| 2026-02-12 | 13F | Triumph Capital Management | 4 | 0,00 | 0 | |||||
| 2026-02-17 | 13F | Cape Investment Advisory, Inc. | 13 | 2 | ||||||
| 2026-02-12 | 13F | Swiss National Bank | 200.300 | 1,73 | 23.972 | 7,68 | ||||
| 2026-02-11 | 13F | Ameritas Investment Partners, Inc. | 29.464 | 3.526 | ||||||
| 2025-11-14 | 13F | Point72 Hong Kong Ltd | 21.146 | 8.358,40 | 2.391 | 8.751,85 | ||||
| 2026-01-13 | 13F | Stephens Consulting, LLC | 1.960 | 0,00 | 235 | 5,88 | ||||
| 2026-02-12 | 13F | Dimensional Fund Advisors Lp | 2.624.612 | -1,64 | 314.123 | 4,12 | ||||
| 2026-02-13 | 13F | Thornburg Investment Management Inc | 99.833 | -0,42 | 11.948 | 5,41 | ||||
| 2026-04-13 | 13F | Fractal Investments LLC | 230.999 | 0,00 | 31.109 | 12,53 | ||||
| 2026-04-07 | 13F | Signaturefd, Llc | 2.542 | 5,04 | 342 | 18,34 | ||||
| 2026-05-01 | 13F | Advisors Capital Management, LLC | 1.839 | 0,00 | 248 | 12,27 | ||||
| 2026-02-09 | 13F | Atlantic Trust, LLC | 106 | 0,00 | 13 | 9,09 | ||||
| 2026-02-12 | 13F | CIBC Private Wealth Group, LLC | 383.668 | 0,12 | 45.917 | 5,98 | ||||
| 2026-04-07 | 13F | Park Avenue Securities Llc | 0 | -100,00 | 0 | |||||
| 2026-04-24 | 13F | Profund Advisors Llc | 2.349 | 6,19 | 316 | 19,70 | ||||
| 2026-02-09 | 13F | Smithfield Trust Co | 87 | 0,00 | 0 | |||||
| 2026-01-16 | 13F | Crewe Advisors LLC | 254 | 0,00 | 30 | 7,14 | ||||
| 2026-02-05 | 13F | Integrated Investment Consultants, LLC | 0 | -100,00 | 0 | |||||
| 2026-05-01 | 13F | International Assets Investment Management, Llc | 1.950 | -14,06 | 261 | -3,69 | ||||
| 2026-02-11 | 13F | Commonwealth Retirement Investments LLC | 300 | 36 | ||||||
| 2026-02-17 | 13F | Susquehanna International Group, Llp | 22.309 | -3,18 | 2.670 | 2,46 | ||||
| 2026-02-17 | 13F | Susquehanna International Group, Llp | Call | 27.000 | -2,17 | 3.231 | 3,56 | |||
| 2026-04-14 | 13F | Nbc Securities, Inc. | 52.709 | -0,01 | 7.098 | 12,52 | ||||
| 2026-02-12 | 13F | Xponance, Inc. | 10.311 | -14,45 | 1.234 | -9,40 | ||||
| 2026-04-23 | 13F | Balanced Wealth Group Llc | 1.648 | 222 | ||||||
| 2026-02-09 | 13F | Williamson Legacy Group, LLC | 6.614 | -7,46 | 792 | -2,10 | ||||
| 2026-04-20 | 13F | Louisiana State Employees Retirement System | 29.500 | 4,98 | 3.973 | 18,11 | ||||
| 2026-01-26 | 13F | Cwm, Llc | 34.544 | 517,96 | 4 | |||||
| 2026-02-04 | 13F | Clark Wealth Partners | 64 | 0,00 | 8 | 0,00 | ||||
| 2026-02-11 | 13F | Stonebrook Private Inc. | 2.257 | 270 | ||||||
| 2026-02-12 | 13F | Voya Investment Management Llc | 41.610 | -65,91 | 4.980 | -63,92 | ||||
| 2026-02-09 | 13F | Legal & General Group Plc | 170.062 | -30,52 | 20.353 | -26,45 | ||||
| 2026-04-13 | 13F | Bank of New Hampshire | 0 | -100,00 | 0 | |||||
| 2026-04-17 | 13F | Brown, Lisle/cummings, Inc. | 8 | 1 | ||||||
| 2026-04-17 | 13F | AdvisorNet Financial, Inc | 307 | 0,00 | 41 | 13,89 | ||||
| 2026-04-29 | 13F | Klp Kapitalforvaltning As | 23.300 | 3,56 | 3.155 | 16,47 | ||||
| 2026-03-05 | 13F | Gunpowder Capital Management, LLC dba Oliver Wealth Management | 250 | 30 | ||||||
| 2026-02-17 | 13F | Polymer Capital Management (US) LLC | 2.963 | -49,19 | 355 | -46,28 | ||||
| 2025-11-12 | 13F | Picton Mahoney Asset Management | 0 | -100,00 | 0 | -100,00 | ||||
| 2026-02-05 | 13F | Atria Investments Llc | 15.014 | 2,34 | 1.797 | 8,32 | ||||
| 2026-04-27 | 13F | Turtle Creek Wealth Advisors, LLC | 9.479 | 1,58 | 1.277 | 14,34 | ||||
| 2026-02-13 | 13F | Essex Investment Management Co Llc | 364 | 0,00 | 44 | 4,88 | ||||
| 2026-02-14 | 13F | Rockefeller Capital Management L.P. | 7.473 | 41,24 | 894 | 49,50 | ||||
| 2026-02-17 | 13F | United Capital Financial Advisers, Llc | 0 | -100,00 | 0 | |||||
| 2026-04-23 | 13F | Oppenheimer & Co Inc | 3.466 | 9,65 | 467 | 23,28 | ||||
| 2026-02-17 | 13F | Equitable Holdings, Inc. | 2.966 | 41,37 | 355 | 49,37 | ||||
| 2026-02-17 | 13F | Susquehanna Fundamental Investments, Llc | 8.947 | -21,84 | 1.071 | -17,31 | ||||
| 2026-01-30 | 13F | Jennison Associates Llc | 247.640 | 8,93 | 29.638 | 15,31 | ||||
| 2026-04-06 | 13F | Versant Capital Management, Inc | 542 | 1,31 | 73 | 12,50 | ||||
| 2026-04-24 | 13F | Luminist Capital LLC | 0 | -100,00 | 0 | |||||
| 2026-02-05 | 13F | Bessemer Group Inc | 379 | -0,79 | 0 | |||||
| 2026-04-13 | 13F | Massmutual Trust Co Fsb/adv | 487 | -33,10 | 66 | -25,29 | ||||
| 2026-04-28 | 13F | Flagship Harbor Advisors, Llc | 0 | -100,00 | 0 | |||||
| 2026-02-06 | 13F | Vestmark Advisory Solutions, Inc. | 5.568 | 79,32 | 666 | 89,74 | ||||
| 2026-04-29 | 13F | Police & Firemen's Retirement System of New Jersey | 43.058 | 0,26 | 5.799 | 12,82 | ||||
| 2026-02-04 | 13F | Pacer Advisors, Inc. | 0 | -100,00 | 0 | -100,00 | ||||
| 2026-02-13 | 13F | Van Eck Associates Corp | 33.324 | 10,59 | 4 | 0,00 | ||||
| 2026-04-13 | 13F | Creative Financial Designs Inc /adv | 96 | 10,34 | 13 | 20,00 | ||||
| 2026-04-20 | 13F | Ronald Blue Trust, Inc. | 2.689 | -25,94 | 362 | -16,59 | ||||
| 2026-02-10 | 13F | Lido Advisors, LLC | 3.290 | 10,22 | 379 | 11,80 | ||||
| 2026-02-11 | 13F | Vestcor Inc | 9.431 | -48,99 | 1 | -50,00 | ||||
| 2026-01-29 | 13F | Teachers Retirement System Of The State Of Kentucky | 29.270 | 0,00 | 4 | 0,00 | ||||
| 2026-01-29 | 13F | Simon Quick Advisors, Llc | 5.602 | 670 | ||||||
| 2026-02-12 | 13F | MetLife Investment Management, LLC | 49.677 | -4,86 | 5.945 | 0,71 | ||||
| 2026-03-04 | 13F | SHP Wealth Management | 19 | 2 | ||||||
| 2026-02-13 | 13F | Bridgewater Associates, LP | 270.145 | -11,96 | 32.331 | -6,80 | ||||
| 2026-02-11 | 13F | Fox Run Management, L.l.c. | 7.892 | 945 | ||||||
| 2025-11-12 | 13F | Park Square Financial Group, LLC | 0 | -100,00 | 0 | |||||
| 2026-02-11 | 13F | Allianz Asset Management GmbH | 43.171 | -35,95 | 5.167 | -32,20 | ||||
| 2026-02-10 | 13F | Axq Capital, Lp | 3.348 | 31,91 | 401 | 39,86 | ||||
| 2026-04-15 | 13F | Cranbrook Wealth Management, LLC | 3.107 | 0,00 | 418 | 12,67 | ||||
| 2026-02-06 | 13F | Bare Financial Services, Inc | 51 | -5,56 | 6 | 0,00 | ||||
| 2026-02-17 | 13F | T. Rowe Price Investment Management, Inc. | 347.595 | -34,23 | 42 | -30,51 | ||||
| 2026-02-18 | 13F | GWM Advisors LLC | 13.891 | 5,69 | 1.662 | 11,92 | ||||
| 2026-02-11 | 13F | Zions Bancorporation, National Association /ut/ | 17 | 2 | ||||||
| 2026-04-10 | 13F | Impact Capital Partners LLC | 4.009 | 0,30 | 540 | 12,76 | ||||
| 2026-01-30 | 13F | State of New Jersey Common Pension Fund D | 30.044 | -4,49 | 3.596 | 1,10 | ||||
| 2026-04-30 | 13F | Torren Management, LLC | 11 | -42,11 | 1 | -50,00 | ||||
| 2026-04-24 | 13F | Capital Asset Advisory Services LLC | 1.747 | 231 | ||||||
| 2026-04-30 | 13F | Cookson Peirce & Co Inc | 16.273 | 3,93 | 2.191 | 16,98 | ||||
| 2026-04-23 | 13F | ELCO Management Co., LLC | 3.150 | 0,00 | 424 | 12,77 | ||||
| 2026-02-04 | 13F | Ameritas Advisory Services, LLC | 3.007 | 8.027,03 | 360 | 8.875,00 | ||||
| 2026-04-10 | 13F | Finward Bancorp | 2.185 | 0,00 | 294 | 12,64 | ||||
| 2025-11-14 | 13F | Qube Research & Technologies Ltd | 0 | -100,00 | 0 | |||||
| 2026-02-12 | 13F | Ci Investments Inc. | 0 | -100,00 | 0 | |||||
| 2026-05-01 | 13F | Arizona State Retirement System | 27.931 | -1,70 | 3.761 | 10,62 | ||||
| 2026-02-11 | 13F | Meeder Advisory Services, Inc. | 4.747 | -3,79 | 568 | 1,97 | ||||
| 2026-04-20 | 13F | Miller Howard Investments Inc /ny | 238.616 | 9,19 | 32.134 | 22,86 | ||||
| 2026-02-17 | 13F | Freestone Grove Partners LP | 244.914 | 115,78 | 29.311 | 128,42 | ||||
| 2026-02-17 | 13F | Burkehill Global Management, LP | 0 | -100,00 | 0 | |||||
| 2026-02-13 | 13F | Mml Investors Services, Llc | 25.545 | 32,77 | 3.057 | 40,55 | ||||
| 2026-01-15 | 13F | Allspring Global Investments Holdings, LLC | 12.036 | -1,51 | 1.442 | 3,52 | ||||
| 2026-02-02 | 13F | FSA Advisors, Inc. | 5.536 | 25,31 | 663 | 32,67 | ||||
| 2026-02-13 | 13F | Pinnacle Wealth Planning Services, Inc. | 20 | 2 | ||||||
| 2026-01-26 | 13F | Mirae Asset Global Investments Co., Ltd. | 610 | 73 | ||||||
| 2026-02-10 | 13F | Goldman Sachs Group Inc | 2.576.756 | -10,46 | 308.386 | -5,22 | ||||
| 2026-01-20 | 13F | SOA Wealth Advisors, LLC. | 274 | 0,74 | 33 | 6,67 | ||||
| 2026-02-12 | 13F | Bank Of Montreal /can/ | 208.392 | -32,82 | 24.940 | -28,89 | ||||
| 2026-04-13 | 13F | Mather Group, Llc. | 295 | 40 | ||||||
| 2026-02-18 | 13F | Hanlon Investment Management, Inc. | 7.698 | 1,24 | 921 | 7,22 | ||||
| 2026-01-12 | 13F | Rialto Wealth Management, LLC | 22 | 10,00 | 3 | 0,00 | ||||
| 2026-04-22 | 13F | Sterling Capital Management LLC | 3.426 | -43,04 | 461 | -35,88 | ||||
| 2026-04-24 | 13F | Yousif Capital Management, Llc | 29.965 | -5,11 | 4.035 | 6,46 | ||||
| 2026-02-06 | 13F | HighTower Advisors, LLC | 32.601 | 10,42 | 3.902 | 16,87 | ||||
| 2026-04-24 | 13F | Oakworth Capital, Inc. | 249 | 0,00 | 34 | 13,79 | ||||
| 2026-02-17 | 13F | Lakeshore Financial Planning, Inc. | 2.809 | -2,23 | 336 | 3,70 | ||||
| 2026-02-12 | 13F | JPL Wealth Management, LLC | 0 | -100,00 | 0 | |||||
| 2026-02-17 | 13F | Public Employees Retirement System Of Ohio | 44.688 | -11,33 | 5.348 | -6,13 | ||||
| 2026-04-24 | 13F | Essex Financial Services, Inc. | 1.558 | -20,83 | 210 | -11,06 | ||||
| 2026-04-13 | 13F | Elm3 Financial Group, LLC | 4.772 | 0,17 | 643 | 12,63 | ||||
| 2026-04-14 | 13F | Zrc Wealth Management, Llc | 0 | -100,00 | 0 | |||||
| 2026-04-06 | 13F | GAMMA Investing LLC | 5.657 | 7,90 | 762 | 21,37 | ||||
| 2026-02-17 | 13F | Moore Capital Management, Lp | 100.000 | 11.968 | ||||||
| 2026-01-23 | 13F | Rsm Us Wealth Management Llc | 1.866 | 225 | ||||||
| 2026-01-20 | 13F | SS&H Financial Advisors, Inc. | 5.900 | 0,00 | 1 | -100,00 | ||||
| 2026-04-16 | 13F | SG Americas Securities, LLC | 101.247 | 60,75 | 14 | 85,71 | ||||
| 2026-05-01 | 13F | Fifth Third Bancorp | 38.293 | 1.992,51 | 5.157 | 2.254,34 | ||||
| 2026-01-28 | 13F | Salomon & Ludwin, LLC | 159 | 0,00 | 19 | 5,56 | ||||
| 2026-02-13 | 13F | Umb Bank N A/mo | 1.142 | 5,45 | 137 | 11,48 | ||||
| 2026-02-02 | 13F | Cornerstone Planning Group LLC | 30 | -25,00 | 4 | -40,00 | ||||
| 2026-02-13 | 13F | First Trust Advisors Lp | 332.146 | 15,57 | 39.751 | 22,34 | ||||
| 2026-04-29 | 13F | Frank, Rimerman Advisors LLC | 10.749 | 0,00 | 1.448 | 12,52 | ||||
| 2026-02-17 | 13F | Ancora Advisors, LLC | 67.125 | 0,63 | 8.034 | 6,52 | ||||
| 2026-01-14 | 13F | Wedge Capital Management L L P/nc | 0 | -100,00 | 0 | |||||
| 2026-02-12 | 13F | RR Advisors, LLC | 61.733 | 8,30 | 7.388 | 123.033,33 | ||||
| 2026-02-11 | 13F | Erste Asset Management GmbH | 0 | 0 | ||||||
| 2026-02-10 | 13F | Natixis Advisors, L.p. | 27.056 | 0,48 | 3 | 0,00 | ||||
| 2026-04-30 | 13F | Teacher Retirement System Of Texas | 10.048 | 45,88 | 1.353 | 64,20 | ||||
| 2025-11-17 | 13F | Kestra Investment Management, LLC | 0 | -100,00 | 0 | -100,00 | ||||
| 2026-02-19 | 13F | CI Private Wealth, LLC | 17.566 | -9,92 | 2.106 | -4,49 | ||||
| 2025-11-14 | 13F | Axa S.a. | 0 | -100,00 | 0 | |||||
| 2026-04-27 | 13F | Td Private Client Wealth Llc | 65 | -8,45 | 9 | 0,00 | ||||
| 2026-04-30 | 13F | Kestra Advisory Services, LLC | 8.127 | 5,71 | 1.094 | 18,91 | ||||
| 2026-02-17 | 13F | Two Sigma Advisers, Lp | 390.100 | 317,67 | 46.687 | 342,15 | ||||
| 2026-02-10 | 13F | Reaves W H & Co Inc | 762.753 | 9,37 | 91.286 | 15,77 | ||||
| 2026-05-01 | 13F | Concord Wealth Partners | 0 | -100,00 | 0 | |||||
| 2026-02-11 | 13F | Rise Advisors, LLC | 0 | -100,00 | 0 | |||||
| 2026-02-02 | 13F | Hussman Strategic Advisors, Inc. | 500 | 0,00 | 60 | 5,36 | ||||
| 2026-04-07 | 13F | Retirement Wealth Solutions LLC | 122 | -27,38 | 16 | -20,00 | ||||
| 2026-02-09 | 13F | Geode Capital Management, Llc | 2.407.612 | 4,63 | 288.191 | 10,76 | ||||
| 2026-02-05 | 13F | Blue Water Asset Management | 3.406 | 408 | ||||||
| 2026-02-05 | 13F | Center for Financial Planning, Inc. | 2.360 | -0,51 | 282 | 5,22 | ||||
| 2026-04-13 | 13F | CGC Financial Services, LLC | 50 | 0,00 | 7 | 20,00 | ||||
| 2026-02-17 | 13F | Laird Norton Trust Company, Llc | 2.690 | 324 | ||||||
| 2026-02-17 | 13F | BTG Pactual Asset Management US LLC | 0 | -100,00 | 0 | |||||
| 2026-02-11 | 13F | First Command Advisory Services, Inc. | 439 | 0,00 | 53 | 6,12 | ||||
| 2026-02-13 | 13F | Barclays Plc | 243.921 | -16,07 | 29.192 | -11,16 | ||||
| 2025-11-12 | 13F | NewSquare Capital LLC | 0 | -100,00 | 0 | |||||
| 2026-04-17 | 13F | Webster Bank, N. A. | 725 | 0,00 | 98 | 12,79 | ||||
| 2026-02-17 | 13F | Blair William & Co/il | 6.952 | 2,15 | 832 | 8,19 | ||||
| 2026-02-17 | 13F | Blackstone Group Inc | 2.230.647 | 1,40 | 266.964 | 7,33 | ||||
| 2026-01-29 | 13F | Vanguard Group Inc | 11.078.802 | -1,75 | 1.325.911 | 4,01 | ||||
| 2026-02-05 | 13F | Amalgamated Bank | 44.847 | -3,83 | 5 | 0,00 | ||||
| 2026-02-17 | 13F | Janus Henderson Group Plc | 44.070 | 0,00 | 5.274 | 5,86 | ||||
| 2026-02-02 | 13F | Mutual Advisors, LLC | 2.428 | -5,08 | 291 | 7,01 | ||||
| 2026-02-17 | 13F | WFA of San Diego, LLC | 0 | -100,00 | 0 | |||||
| 2025-11-14 | 13F | AXA Investment Managers S.A. | 4.690 | 530 | ||||||
| 2026-04-30 | 13F | LRI Investments, LLC | 298 | 0,00 | 40 | 14,29 | ||||
| 2026-02-10 | 13F | Bank of New York Mellon Corp | 888.664 | -9,69 | 106.355 | -4,41 | ||||
| 2026-02-13 | 13F | Pathstone Holdings, LLC | 28.338 | 0,06 | 3.404 | 5,88 | ||||
| 2026-02-17 | 13F | Utah Retirement Systems | 5.401 | 0,00 | 646 | 5,90 | ||||
| 2026-02-17 | 13F | Bank Of America Corp /de/ | 663.065 | -10,29 | 79.356 | -5,04 | ||||
| 2026-01-28 | 13F | Legacy Capital Group California, Inc. | 4.631 | -7,25 | 554 | -1,77 | ||||
| 2026-04-23 | 13F | CWM Advisors, LLC | 9 | 0,00 | 1 | 0,00 | ||||
| 2026-02-17 | 13F | Tower Research Capital LLC (TRC) | 3.226 | -10,14 | 386 | -4,69 | ||||
| 2026-04-07 | 13F | CoreCap Advisors, LLC | 14.449 | 8,78 | 1.946 | 22,40 | ||||
| 2026-04-28 | 13F | Core Wealth Advisors, Llc | 0 | -100,00 | 0 | |||||
| 2026-02-17 | 13F | Westwood Holdings Group Inc | 1.127.338 | 1,61 | 134.920 | 7,56 | ||||
| 2026-04-30 | 13F | Cromwell Holdings LLC | 15 | 0,00 | 2 | 100,00 | ||||
| 2025-11-14 | 13F | Nomura Holdings Inc | 0 | -100,00 | 0 | |||||
| 2026-02-06 | 13F | Global Retirement Partners, LLC | 2.195 | 681,14 | 263 | 745,16 | ||||
| 2026-01-05 | 13F | Foguth Wealth Management, LLC. | 3.571 | 432 | ||||||
| 2026-02-13 | 13F | Rafferty Asset Management, LLC | 1.709 | 205 | ||||||
| 2026-04-07 | 13F | Estate Planners Group, LLC | 184 | 22 | ||||||
| 2026-02-17 | 13F | Dark Forest Capital Management Lp | 33.121 | 379,46 | 3.964 | 407,43 | ||||
| 2026-02-10 | 13F | Close Asset Management Ltd | 881.000 | 105 | ||||||
| 2026-02-13 | 13F | Alyeska Investment Group, L.P. | 205.567 | 24.602 | ||||||
| 2026-04-08 | 13F | Arlington Trust Co LLC | 19 | 3 | ||||||
| 2026-02-17 | 13F | State Of Wisconsin Investment Board | 37.249 | -15,25 | 4.458 | -10,30 | ||||
| 2026-02-02 | 13F | Core Alternative Capital | 0 | -100,00 | 0 | |||||
| 2026-02-09 | 13F | Rhl Group, Llc | 418 | 50 | ||||||
| 2025-11-14 | 13F | Strategic Wealth Partners, Ltd. | 80 | 0,00 | 9 | 12,50 | ||||
| 2026-02-17 | 13F | Alliancebernstein L.p. | 135.126 | 5,31 | 16.172 | 11,47 | ||||
| 2026-02-10 | 13F | Rothschild Investment Llc | 682 | -2,29 | 82 | 3,85 | ||||
| 2026-01-29 | 13F | Sanctuary Advisors, LLC | 32.729 | 1,82 | 3.917 | 7,76 | ||||
| 2026-02-17 | 13F | MIRAE ASSET GLOBAL ETFS HOLDINGS Ltd. | 1.023.361 | -3,74 | 122.476 | 1,89 | ||||
| 2026-01-30 | 13F | Rachor Investment Advisory Services, LLC | 11 | 1 | ||||||
| 2026-02-13 | 13F | Neo Ivy Capital Management | 0 | -100,00 | 0 | -100,00 | ||||
| 2026-02-17 | 13F | California State Teachers Retirement System | 95.452 | -0,09 | 11.424 | 5,76 | ||||
| 2025-11-13 | 13F | West Michigan Advisors, Llc | 0 | -100,00 | 0 | |||||
| 2026-02-11 | 13F | TruNorth Capital Management, LLC | 0 | -100,00 | 0 | |||||
| 2026-04-29 | 13F | Arbor Trust Wealth Advisors, Llc | 3.407 | 0,00 | 462 | 12,44 | ||||
| 2026-02-13 | 13F | Wells Fargo & Company/mn | 100.920 | 19,00 | 12.078 | 25,97 | ||||
| 2026-02-17 | 13F | Jain Global LLC | 218.047 | 26.096 | ||||||
| 2026-02-11 | 13F | Tiaa Trust, National Association | 3.052 | -4,09 | 365 | 1,67 | ||||
| 2026-02-17 | 13F | Zurich Insurance Group Ltd/FI | 12.300 | 0,00 | 1.472 | 5,90 | ||||
| 2026-02-17 | 13F | Quantinno Capital Management LP | 45.760 | 55,75 | 5.477 | 64,89 | ||||
| 2026-04-17 | 13F | HHM Wealth Advisors, LLC | 220 | 0,00 | 30 | 11,54 | ||||
| 2026-02-17 | 13F | Balyasny Asset Management Llc | 24.998 | 2.992 | ||||||
| 2026-02-13 | 13F | Baird Financial Group, Inc. | 75.783 | -6,43 | 9.070 | -0,95 | ||||
| 2026-04-21 | 13F | OneAscent Financial Services LLC | 1.758 | 237 | ||||||
| 2026-01-30 | 13F/A | M&t Bank Corp | 8.601 | 11,77 | 1.029 | 18,41 | ||||
| 2026-02-10 | 13F | Tidemark, LLC | 250 | 0,00 | 30 | 3,57 | ||||
| 2025-11-06 | 13F | Illinois Municipal Retirement Fund | 0 | -100,00 | 0 | |||||
| 2026-02-13 | 13F | Venture Visionary Partners LLC | 2.053 | 0,00 | 246 | 5,60 | ||||
| 2026-02-17 | 13F | Point72 Asset Management, L.P. | 694.476 | -19,09 | 83.115 | -14,35 | ||||
| 2026-02-10 | 13F | CIBC Asset Management Inc | 3.170 | 0,00 | 379 | 5,87 | ||||
| 2026-02-11 | 13F | Capital Research Global Investors | 1.249.418 | 0,03 | 149.530 | 5,88 | ||||
| 2026-02-26 | 13F/A | Alpine Global Management, LLC | 1.993 | 239 | ||||||
| 2026-04-17 | 13F | Signal Advisors Wealth, LLC | 2.377 | 12,92 | 320 | 27,49 | ||||
| 2026-02-11 | 13F | Parallel Advisors, LLC | 6.095 | 1,97 | 729 | 8,00 | ||||
| 2026-03-06 | 13F | Hsbc Holdings Plc | 7.000 | 839 | ||||||
| 2026-04-14 | 13F | Palisade Asset Management, LLC | 1.500 | 202 | ||||||
| 2026-02-12 | 13F | Sit Investment Associates Inc | 0 | -100,00 | 0 | |||||
| 2026-01-26 | 13F | KBC Group NV | 3.003 | 0,00 | 0 | |||||
| 2026-01-28 | 13F | Eagle Global Advisors Llc | 494.411 | -2,19 | 59.171 | 3,54 | ||||
| 2026-04-20 | 13F | Columbia Asset Management | 1.633 | 220 | ||||||
| 2026-01-27 | 13F | Evergreen Capital Management Llc | 4.410 | -7,95 | 531 | -2,39 | ||||
| 2026-02-11 | 13F | SOUTH STATE Corp | 1 | 0,00 | 0 | |||||
| 2026-04-22 | 13F | Parcion Private Wealth LLC | 2.864 | -0,49 | 386 | 11,92 | ||||
| 2026-02-10 | 13F | Ritter Daniher Financial Advisory LLC / DE | 34 | 0,00 | 4 | 33,33 | ||||
| 2026-02-13 | 13F | Cohen & Steers, Inc. | 163.103 | 3,95 | 20 | 11,76 | ||||
| 2025-11-06 | 13F | Versor Investments LP | 0 | -100,00 | 0 | |||||
| 2026-01-12 | 13F | AllSquare Wealth Management LLC | 273 | 0,00 | 31 | 0,00 | ||||
| 2026-04-09 | 13F | Secure Asset Management, LLC | 3.024 | -17,92 | 407 | -7,50 | ||||
| 2026-02-03 | 13F | Bokf, Na | 7.449 | -3,64 | 891 | 2,06 | ||||
| 2025-11-14 | 13F | Oxford Asset Management Llp | 3.264 | 369 | ||||||
| 2026-02-10 | 13F | Quantbot Technologies LP | 0 | -100,00 | 0 | |||||
| 2026-02-12 | 13F | Brinker Capital Investments, LLC | 17.112 | -38,48 | 2.048 | -34,89 | ||||
| 2026-04-20 | 13F | C2C Wealth Management, LLC | 1.632 | 220 | ||||||
| 2026-04-16 | 13F | Diversified Trust Co | 1.578 | -15,84 | 213 | -5,36 | ||||
| 2026-01-22 | 13F | Lee Financial Co | 0 | -100,00 | 0 | |||||
| 2026-01-27 | 13F | Asset Management One Co., Ltd. | 3.976 | -12,21 | 480 | -6,25 | ||||
| 2026-02-17 | 13F | Palo Duro Investment Partners, Lp | 6.701 | -4,16 | 802 | 1,39 | ||||
| 2026-04-28 | 13F | Antonelli Financial Advisors, LLC | 2.051 | 276 | ||||||
| 2026-01-23 | 13F | Optima Capital Llc | 7 | 1 | ||||||
| 2026-04-15 | 13F | Fortitude Family Office, LLC | 140 | 41,41 | 19 | 63,64 | ||||
| 2025-11-13 | 13F | Dynamic Technology Lab Private Ltd | 0 | -100,00 | 0 | |||||
| 2026-04-24 | 13F | Keybank National Association/oh | 3.494 | 36,01 | 471 | 53,09 | ||||
| 2026-02-05 | 13F | North Dakota State Investment Board | 3.585 | 429 | ||||||
| 2026-04-22 | 13F | Princeton Global Asset Management LLC | 2.529 | 0,16 | 341 | 12,58 | ||||
| 2026-04-28 | 13F | Quent Capital, LLC | 537 | 0,00 | 72 | 12,50 | ||||
| 2026-04-27 | 13F | Truist Financial Corp | 13.893 | -3,38 | 1.871 | 8,72 | ||||
| 2026-02-03 | 13F | Ballentine Partners, LLC | 2.560 | -3,18 | 306 | 2,68 | ||||
| 2025-11-12 | 13F | Clean Energy Transition LLP | 0 | -100,00 | 0 | -100,00 | ||||
| 2026-01-21 | 13F | Newbridge Financial Services Group, Inc. | 0 | 0 | ||||||
| 2026-02-17 | 13F | XTX Topco Ltd | 0 | -100,00 | 0 | |||||
| 2026-02-12 | 13F | Great Lakes Advisors, Llc | 3.751 | 3,99 | 449 | 10,07 | ||||
| 2026-04-24 | 13F | Redwood Wealth Management Group, LLC | 1.850 | 0,00 | 249 | 12,67 | ||||
| 2026-01-15 | 13F | Bernard Wealth Management Corp. | 17.253 | 0,06 | 2.065 | 5,90 | ||||
| 2026-02-09 | 13F | New Age Alpha Advisors, LLC | 19.822 | -19,15 | 2.372 | -14,40 | ||||
| 2026-02-17 | 13F | Centennial Bank/AR/ | 175 | 0,00 | 21 | 5,26 | ||||
| 2026-02-02 | 13F | Amplify Investments, Llc | 1.700 | 21,43 | 181 | 14,56 | ||||
| 2026-04-14 | 13F | William Mack & Associates, Inc. | 1.711 | -26,72 | 230 | -17,56 | ||||
| 2026-02-12 | 13F | Alps Advisors Inc | 201.441 | -7,31 | 24.108 | -1,88 | ||||
| 2026-02-13 | 13F | Resources Investment Advisors, LLC. | 2.558 | 4,75 | 306 | 10,87 | ||||
| 2026-04-14 | 13F | Hudson Value Partners, LLC | 2.651 | 0,00 | 357 | 11,91 | ||||
| 2026-04-29 | 13F | CVA Family Office, LLC | 121 | 16 | ||||||
| 2026-04-28 | 13F | Golden State Wealth Management, LLC | 0 | -100,00 | 0 | |||||
| 2026-02-17 | 13F | SageView Advisory Group, LLC | 884 | 106 | ||||||
| 2026-02-02 | 13F | Principal Financial Group Inc | 513.541 | 2,64 | 61.462 | 8,65 | ||||
| 2026-02-09 | 13F | Kingsview Wealth Management, LLC | 2.140 | 11,40 | 256 | 17,97 | ||||
| 2026-01-26 | 13F | Dakota Community Bank & Trust NA | 200 | 0,00 | 24 | 4,55 | ||||
| 2026-04-16 | 13F | Brookstone Capital Management | 1.526 | -12,30 | 205 | -1,44 | ||||
| 2026-04-07 | 13F | Eastern Bank | 50 | 0,00 | 7 | 20,00 | ||||
| 2026-02-13 | 13F | Ceredex Value Advisors LLC | 121.450 | -18,93 | 14.535 | -14,18 | ||||
| 2026-02-12 | 13F | Brown Brothers Harriman & Co | 6.262 | 0,71 | 749 | 6,54 | ||||
| 2026-02-17 | 13F | Aventail Capital Group, LP | 88.112 | -22,08 | 10.545 | -17,52 | ||||
| 2026-04-14 | 13F | Pinnacle Wealth Management Group, Inc. | 2.753 | 0,44 | 371 | 12,80 | ||||
| 2026-05-01 | 13F | Securian Asset Management, Inc | 7.494 | 1,54 | 1.009 | 14,27 | ||||
| 2026-04-15 | 13F | Bayforest Capital Ltd | 146 | 20 | ||||||
| 2026-04-23 | 13F | Harbor Investment Advisory, Llc | 10 | 0,00 | 1 | 0,00 | ||||
| 2026-04-27 | 13F | PFG Investments, LLC | 5.271 | 0,32 | 710 | 12,90 | ||||
| 2026-04-17 | 13F | Values First Advisors, Inc. | 2.038 | 19,88 | 275 | 34,98 | ||||
| 2026-04-22 | 13F | Caldwell Trust Co | 125 | 0,00 | 17 | 14,29 | ||||
| 2026-02-10 | 13F | Td Asset Management Inc | 38.400 | 0,00 | 4.596 | 5,85 | ||||
| 2026-02-23 | 13F | Beaird Harris Wealth Management, LLC | 50 | 0,00 | 6 | 0,00 | ||||
| 2026-02-05 | 13F | New York Life Investment Management Llc | 9.056 | -12,24 | 1.084 | -7,12 | ||||
| 2026-02-10 | 13F | Envestnet Asset Management Inc | 318.169 | 9,13 | 38.078 | 15,52 | ||||
| 2026-01-16 | 13F | Trust Co Of Vermont | 33 | 0,00 | 4 | 0,00 | ||||
| 2026-04-01 | 13F | Burkett Financial Services, Llc | 802 | 0,00 | 108 | 12,50 | ||||
| 2026-02-17 | 13F | Tortoise Capital Advisors, L.l.c. | 2.980.945 | 10,60 | 356.759 | 17,08 | ||||
| 2026-04-29 | 13F | Hughes Financial Services, LLC | 125 | 0,81 | 17 | 14,29 | ||||
| 2025-11-13 | 13F | Banco BTG Pactual S.A. | 0 | -100,00 | 0 | |||||
| 2026-04-28 | 13F | Duff & Phelps Investment Management Co | 420.186 | 13,86 | 56.586 | 28,12 | ||||
| 2026-02-09 | 13F | Hartland & Co., LLC | 1.012 | 27,46 | 121 | 35,96 | ||||
| 2026-04-28 | 13F | Golden State Equity Partners | 555 | 75 | ||||||
| 2026-02-12 | 13F | Quadrant Capital Group Llc | 9.993 | 1,03 | 1.196 | 6,89 | ||||
| 2026-04-09 | 13F | Sculati Wealth Management, LLC | 5.014 | -3,20 | 675 | 9,05 | ||||
| 2026-02-13 | 13F | American Century Companies Inc | 39.037 | -8,43 | 4.672 | -3,07 | ||||
| 2026-02-10 | 13F | Daiwa Securities Group Inc. | 503 | -20,03 | 0 | |||||
| 2026-04-24 | 13F | ProShare Advisors LLC | 224.434 | -28,80 | 30.225 | -19,88 | ||||
| 2026-04-21 | 13F | Dougherty & Associates, LLC | 3.140 | 0,71 | 423 | 13,14 | ||||
| 2026-02-17 | 13F | Jones Financial Companies Lllp | 2.850 | 11,98 | 341 | 18,40 | ||||
| 2026-01-23 | 13F | Bridgewater Advisors Inc. | 13.575 | -4,07 | 1.619 | 3,65 | ||||
| 2026-04-29 | 13F/A | True Link Financial Advisors, LLC | 1.361 | -27,64 | 183 | -18,67 | ||||
| 2026-04-24 | 13F | Midwest Capital Advisors, LLC | 1.576 | 0,00 | 212 | 12,77 | ||||
| 2026-04-27 | 13F | Y-Intercept (Hong Kong) Ltd | 6.493 | 874 | ||||||
| 2026-04-27 | 13F | Ethic Inc. | 7.392 | -5,73 | 996 | 6,08 | ||||
| 2026-02-10 | 13F | Connor, Clark & Lunn Investment Management Ltd. | 46.284 | 5.539 | ||||||
| 2026-02-12 | 13F | Jane Street Group, Llc | Put | 1.900 | -9,52 | 227 | -4,22 | |||
| 2026-02-12 | 13F | Jane Street Group, Llc | Call | 6.100 | -24,69 | 730 | -20,22 | |||
| 2026-04-28 | 13F | Harbor Capital Advisors, Inc. | 7.028 | 44,16 | 1 | |||||
| 2026-02-06 | 13F | GPS Wealth Strategies Group, LLC | 0 | -100,00 | 0 | |||||
| 2026-02-17 | 13F | LMR Partners LLP | 102.901 | 675,56 | 12.315 | 721,00 | ||||
| 2026-02-12 | 13F | Mason Investment Advisory Services, Inc. | 0 | -100,00 | 0 | |||||
| 2026-02-17 | 13F | 59 North Capital Management, LP | 3.050.320 | -0,77 | 365.062 | 5,04 | ||||
| 2026-01-30 | 13F | Caldwell Securities, Inc | 30 | 0,00 | 4 | 0,00 | ||||
| 2026-02-17 | 13F | Strategic Investment Advisors / MI | 3.683 | 0,52 | 441 | 6,28 | ||||
| 2025-11-14 | 13F | WNY Asset Management, LLC | 7.234 | 0,00 | 818 | 2,77 | ||||
| 2026-02-12 | 13F | Castleark Management Llc | 9.830 | -20,53 | 1.176 | -15,88 | ||||
| 2026-04-28 | 13F | SBI Okasan Asset Management Co.Ltd. | 3.300 | 0,00 | 445 | 11,56 | ||||
| 2026-02-17 | 13F | Hartree Partners, LP | 0 | -100,00 | 0 | |||||
| 2026-04-09 | 13F | Wedmont Private Capital | 3.435 | 2,23 | 462 | 15,25 | ||||
| 2026-04-02 | 13F | Hilltop National Bank | 60 | 0,00 | 8 | 14,29 | ||||
| 2026-04-14 | 13F | Bay Harbor Wealth Management, LLC | 15 | 66,67 | 2 | 100,00 | ||||
| 2026-01-30 | 13F | Wealthfront Advisers Llc | 2.042 | -1,40 | 244 | 4,27 | ||||
| 2026-01-29 | 13F | Comerica Bank | 38.256 | -8,36 | 4.578 | -3,01 | ||||
| 2026-02-11 | 13F | LPL Financial LLC | 161.318 | 13,32 | 19.307 | 19,96 | ||||
| 2025-11-04 | 13F | Raleigh Capital Management Inc. | 0 | -100,00 | 0 | |||||
| 2026-04-30 | 13F | Cambridge Investment Research Advisors, Inc. | 16.237 | 8,17 | 2 | 100,00 | ||||
| 2026-02-12 | 13F | Jane Street Group, Llc | 15.785 | -88,26 | 1.889 | -87,58 | ||||
| 2026-02-10 | 13F/A | Northwestern Mutual Wealth Management Co | 1.178 | -3,84 | 141 | 1,45 | ||||
| 2026-02-13 | 13F | Brasada Capital Management, Lp | 10.293 | 1,40 | 1.245 | 8,26 | ||||
| 2026-04-16 | 13F | Bright Rock Capital Management, Llc | 15.000 | 0,00 | 2.020 | 12,53 | ||||
| 2026-02-10 | 13F | Hazlett, Burt & Watson, Inc. | 22 | 0 | ||||||
| 2026-02-13 | 13F | Atlas Capital Advisors Llc | 2 | 0,00 | 0 | |||||
| 2026-02-02 | 13F | Horizon Investments, LLC | 25.618 | 3.066 | ||||||
| 2026-01-26 | 13F | Asset Dedication, LLC | 83 | 0,00 | 10 | 0,00 | ||||
| 2026-02-05 | 13F | Gabelli Funds Llc | 8.500 | 0,00 | 1.017 | 5,83 | ||||
| 2026-04-15 | 13F | City Holding Co | 29.410 | 4,50 | 3.961 | 17,58 | ||||
| 2026-04-22 | 13F | Horizon Bancorp Inc /in/ | 33 | -32,65 | 0 | |||||
| 2026-02-09 | 13F | Jefferies Financial Group Inc. | 4.665 | 558 | ||||||
| 2026-02-20 | 13F | Kovitz Investment Group Partners, LLC | 0 | -100,00 | 0 | |||||
| 2026-04-28 | 13F | Bfsg, Llc | 25 | 0,00 | 3 | 50,00 | ||||
| 2026-02-11 | 13F | Inceptionr Llc | 0 | -100,00 | 0 | |||||
| 2026-02-13 | 13F | Cornerstone Financial Management LLC | 24 | 3 | ||||||
| 2026-02-13 | 13F | Manufacturers Life Insurance Company, The | 0 | -100,00 | 0 | |||||
| 2026-04-29 | 13F | Cary Street Partner Investment Advisory Llc | 5.994 | 22,60 | 807 | 37,95 | ||||
| 2026-04-28 | 13F | Hardy Reed LLC | 4.700 | 35,45 | 633 | 52,29 | ||||
| 2026-02-17 | 13F | Russell Investments Group, Ltd. | 528.472 | 12,58 | 63.249 | 19,18 | ||||
| 2025-11-13 | 13F | Clear Street Markets Llc | 0 | -100,00 | 0 | |||||
| 2026-02-13 | 13F | Gen-Wealth Partners Inc | 417 | 0,00 | 50 | 4,26 | ||||
| 2026-02-09 | 13F | Harbour Investments, Inc. | 2.182 | 66,44 | 261 | 76,35 | ||||
| 2026-04-23 | 13F | SJS Investment Consulting Inc. | 1.846 | 0,16 | 249 | 12,73 | ||||
| 2026-04-08 | 13F | Hummer Financial Advisory Services Inc | 2.205 | 4,75 | 299 | 17,79 | ||||
| 2026-02-17 | 13F | Encompass Capital Advisors LLC | 0 | -100,00 | 0 | |||||
| 2026-02-12 | 13F | Azimuth Capital Investment Management LLC | 4.796 | -1,19 | 574 | 4,56 | ||||
| 2026-04-03 | 13F | Coastline Trust Co | 150 | 0,00 | 20 | 17,65 | ||||
| 2026-02-10 | 13F | Sittner & Nelson, Llc | 181 | 0,00 | 23 | 15,00 | ||||
| 2026-02-06 | 13F | Pnc Financial Services Group, Inc. | 14.846 | 47,96 | 1.777 | 56,61 | ||||
| 2026-02-13 | 13F | Recurrent Investment Advisors LLC | 353.786 | 0,50 | 42.341 | 6,39 | ||||
| 2026-02-10 | 13F | Acadian Asset Management Llc | 0 | -100,00 | 0 | |||||
| 2026-04-27 | 13F | Sound Income Strategies, LLC | 656 | 0,00 | 88 | 10,13 | ||||
| 2026-01-21 | 13F | Crews Bank & Trust | 533 | 0,00 | 64 | 5,00 | ||||
| 2026-02-09 | 13F | Annis Gardner Whiting Capital Advisors, LLC | 82 | 0,00 | 10 | 0,00 | ||||
| 2026-05-01 | 13F | Wealthspire Advisors, LLC | 1.605 | -26,71 | 216 | -17,56 | ||||
| 2025-11-17 | 13F | Morningstar Investment Management LLC | 0 | -100,00 | 0 | |||||
| 2026-04-17 | 13F | Vermillion Wealth Management, Inc. | 7 | 1 | ||||||
| 2026-05-01 | 13F | Global Assets Advisory, LLC | 500 | 67 | ||||||
| 2026-02-13 | 13F | Walleye Capital LLC | 0 | -100,00 | 0 | |||||
| 2025-11-14 | 13F | Gallo Partners, LP | 0 | -100,00 | 0 | |||||
| 2026-02-17 | 13F | Crawford Investment Counsel Inc | 82.347 | -28,29 | 9.855 | -24,09 | ||||
| 2026-05-01 | 13F | BKD Wealth Advisors, LLC | 1.513 | 204 | ||||||
| 2026-01-08 | 13F | Sound View Wealth Advisors Group, LLC | 2.191 | 0,00 | 262 | 6,07 | ||||
| 2026-02-13 | 13F | Centerpoint Advisors, LLC | 269 | 0,00 | 0 | |||||
| 2026-02-13 | 13F | Verition Fund Management LLC | 198.434 | -15,85 | 23.749 | -10,92 | ||||
| 2026-02-12 | 13F | Bahl & Gaynor Inc | 0 | -100,00 | 0 | |||||
| 2026-02-13 | 13F | Stifel Financial Corp | 55.825 | -6,33 | 6.681 | -0,85 | ||||
| 2026-04-29 | 13F | Sigma Investment Counselors Inc | 3.296 | -2,60 | 444 | 9,38 | ||||
| 2026-04-23 | 13F | North Star Investment Management Corp. | 1.104 | 0,09 | 149 | 12,98 | ||||
| 2026-04-30 | 13F | First Horizon Corp | 343 | 1,18 | 46 | 15,00 | ||||
| 2026-04-23 | 13F | Arbor Wealth Advisors LLC | 1.904 | 0,00 | 256 | 12,78 | ||||
| 2026-02-12 | 13F | New York State Common Retirement Fund | 61.750 | -1,91 | 7.390 | 3,84 | ||||
| 2026-02-13 | 13F | 1 North Wealth Services Llc | 50 | 0,00 | 6 | 0,00 | ||||
| 2026-02-17 | 13F | Merewether Investment Management, LP | 1.042.600 | 4,20 | 124.778 | 10,30 | ||||
| 2026-04-17 | 13F | Discipline Wealth Solutions, LLC | 1.777 | 239 | ||||||
| 2026-02-13 | 13F | Johnson Investment Counsel Inc | 31.238 | 0,00 | 3.739 | 5,86 | ||||
| 2026-02-12 | 13F | Callan Family Office, LLC | 5.103 | 92,86 | 611 | 104,01 | ||||
| 2026-02-11 | 13F | Financiere des Professionnels - Fonds d,investissement inc. | 0 | -100,00 | 0 | |||||
| 2026-02-17 | 13F | Amundi | 9.099 | 1.089 | ||||||
| 2026-04-23 | 13F | American National Bank | 1.110 | -5,53 | 149 | 6,43 | ||||
| 2026-02-12 | 13F | M1 Capital Management LLC | 4.095 | 0,17 | 490 | 6,06 | ||||
| 2026-04-28 | 13F | Whittier Trust Co Of Nevada Inc | 56 | -20,00 | 7 | -12,50 | ||||
| 2026-04-27 | 13F | Deroy & Devereaux Private Investment Counsel Inc | 323.922 | -1,80 | 44 | 10,26 | ||||
| 2026-04-23 | 13F | McMillan Office, Inc. | 2.009 | 0,00 | 271 | 12,50 | ||||
| 2026-02-13 | 13F | Icon Wealth Advisors, LLC | 2.619 | 1,08 | 313 | 7,19 | ||||
| 2026-02-13 | 13F | Morgan Stanley | 1.041.197 | 7,69 | 124.611 | 14,00 | ||||
| 2026-02-13 | 13F | Prudential Financial Inc | 6.681 | -48,23 | 807 | -44,65 | ||||
| 2026-04-14 | 13F | Clean Yield Group | 42 | -69,12 | 6 | -68,75 | ||||
| 2026-04-30 | 13F | Cedar Mountain Advisors, LLC | 75 | 10 | ||||||
| 2026-02-11 | 13F | Prestige Wealth Management Group LLC | 9 | 0,00 | 1 | 0,00 | ||||
| 2026-02-17 | 13F | Summit Trail Advisors, Llc | 5.376 | -22,26 | 647 | -17,37 | ||||
| 2026-05-01 | 13F | Sachetta, LLC | 10 | -56,52 | 1 | -50,00 | ||||
| 2026-02-17 | 13F | Holocene Advisors, LP | 369.738 | -33,27 | 44.250 | -29,36 | ||||
| 2026-02-13 | 13F | Citigroup Inc | 39.494 | -50,76 | 4.727 | -47,88 | ||||
| 2026-01-28 | 13F | Financial Perspectives, Inc | 639 | 0,47 | 76 | 7,04 | ||||
| 2026-01-28 | 13F | Geneos Wealth Management Inc. | 1.009 | 1,71 | 121 | 7,14 | ||||
| 2026-04-30 | 13F | Whipplewood Advisors, LLC | 40 | 5 | ||||||
| 2026-04-29 | 13F | OneAscent Investment Solutions LLC | 2.465 | 8,16 | 332 | 21,69 | ||||
| 2026-04-30 | 13F | Elevated Capital Advisors, LLC | 0 | -100,00 | 0 | |||||
| 2025-11-07 | 13F | Beacon Capital Management, LLC | 0 | -100,00 | 0 | |||||
| 2026-04-13 | 13F | True Wealth Design, LLC | 24 | 0,00 | 3 | 50,00 | ||||
| 2026-02-03 | 13F | We Are One Seven, LLC | 3.406 | -2,41 | 408 | 3,30 | ||||
| 2026-02-18 | 13F | Beacon Pointe Advisors, LLC | 2.660 | 318 | ||||||
| 2026-04-27 | 13F | Tsfg, Llc | 117 | 0,00 | 0 | |||||
| 2026-04-29 | 13F | Brighton Securities Corp. | 1.823 | -9,26 | 245 | 2,08 | ||||
| 2026-05-01 | 13F | Citizens Financial Group Inc/ri | 1.704 | -24,87 | 229 | -15,50 | ||||
| 2026-04-22 | 13F | Smallwood Wealth Investment Management, LLC | 71 | 0,00 | 10 | 12,50 | ||||
| 2026-02-17 | 13F | GeoWealth Management, LLC | 696 | -8,66 | 83 | -3,49 | ||||
| 2026-04-21 | 13F | Hennessy Advisors Inc | 148.080 | -1,11 | 19.942 | 11,28 | ||||
| 2026-02-13 | 13F | Commerce Bank | 20.023 | -0,92 | 2.396 | 4,90 | ||||
| 2025-11-13 | 13F | Riggs Asset Managment Co. Inc. | 0 | -100,00 | 0 | |||||
| 2026-02-13 | 13F | Ubs Asset Management Americas Inc | 230.486 | -5,85 | 27.585 | -0,34 | ||||
| 2026-04-24 | 13F | Retirement Systems of Alabama | 245.046 | 1,08 | 33.000 | 13,74 | ||||
| 2026-02-04 | 13F | Independent Advisor Alliance | 8.144 | 30,05 | 975 | 37,77 | ||||
| 2026-02-17 | 13F | Raymond James Financial Inc | 159.074 | 6,27 | 19.038 | 12,49 | ||||
| 2026-02-13 | 13F | Edgestream Partners, L.P. | 6.474 | 775 | ||||||
| 2026-02-09 | 13F | Delta Asset Management Llc/tn | 764 | 0,00 | 91 | 5,81 | ||||
| 2026-04-13 | 13F | Gateway Investment Advisers Llc | 2.645 | 1,61 | 356 | 14,47 | ||||
| 2026-04-17 | 13F | CENTRAL TRUST Co | 1.374 | 0,00 | 185 | 12,80 | ||||
| 2026-02-17 | 13F | North Capital, Inc. | 0 | -100,00 | 0 | |||||
| 2026-04-24 | 13F | UMA Financial Services, Inc. | 28 | 0,00 | 4 | 0,00 | ||||
| 2026-04-22 | 13F | Stone House Investment Management, LLC | 126 | 207,32 | 17 | 300,00 | ||||
| 2026-02-12 | 13F | Commonwealth Equity Services, Llc | 37.333 | -15,33 | 4.468 | 111.600,00 | ||||
| 2026-02-13 | 13F | Rhumbline Advisers | 280.068 | -1,21 | 33.518 | 4,58 | ||||
| 2026-02-17 | 13F | Sagefield Capital LP | 48.113 | -2,53 | 5.758 | 3,17 | ||||
| 2026-02-11 | 13F | Deutsche Bank Ag\ | 3.090.365 | 6,92 | 369.855 | 13,18 | ||||
| 2026-02-11 | 13F | Harvest Fund Management Co., Ltd | 952 | 0,00 | 0 | |||||
| 2026-04-27 | 13F | V-Square Quantitative Management LLC | 238 | 0,00 | 32 | 14,29 | ||||
| 2026-04-29 | 13F | Sunrise Financial Services, LLC | 7 | 0,00 | 1 | |||||
| 2026-04-07 | 13F | U.S. Capital Wealth Advisors, LLC | 0 | -100,00 | 0 | |||||
| 2026-02-13 | 13F | Smartleaf Asset Management LLC | 1.378 | 231,25 | 167 | 253,19 | ||||
| 2026-02-11 | 13F | Capital Analysts, Inc. | 54 | 0,00 | 0 | |||||
| 2026-04-27 | 13F | Albion Financial Group /ut | 51 | 13,33 | 7 | 20,00 | ||||
| 2026-04-21 | 13F | Mesirow Financial Investment Management, Inc. | 1.694 | 0,36 | 228 | 12,87 | ||||
| 2026-04-10 | 13F | GEM Asset Management, LLC | 1.810 | 0,00 | 244 | 13,02 | ||||
| 2026-04-17 | 13F | Fifth Third Wealth Advisors LLC | 3.435 | 11,89 | 463 | 25,89 | ||||
| 2026-02-13 | 13F | Brookfield Asset Management Inc. | 510.282 | -13,78 | 61.071 | -8,74 | ||||
| 2026-02-13 | 13F | Battery Global Advisors, LLC | 408 | 10 | ||||||
| 2026-04-08 | 13F | Legacy Wealth Asset Management, LLC | 4.557 | -0,76 | 614 | 11,66 | ||||
| 2026-02-13 | 13F | MAI Capital Management | 2.637 | -5,62 | 316 | 0,00 | ||||
| 2026-04-08 | 13F | Ausbil Investment Management Ltd | 20.152 | 0,00 | 2.698 | 11,86 | ||||
| 2026-01-29 | 13F | Dunhill Financial, LLC | 2 | 0 | ||||||
| 2025-11-12 | 13F | Headlands Technologies LLC | 0 | -100,00 | 0 | |||||
| 2026-02-17 | 13F | Wiley Bros.-aintree Capital, Llc | 15.126 | 36,23 | 1.815 | 44,62 | ||||
| 2026-04-23 | 13F | TFC Financial Management | 5 | 0,00 | 1 | |||||
| 2026-02-11 | 13F | Franklin Resources Inc | 769.721 | -11,32 | 92.120 | -6,12 | ||||
| 2026-01-27 | 13F | Zurcher Kantonalbank (Zurich Cantonalbank) | 30.005 | 2,90 | 3.591 | 8,92 | ||||
| 2026-04-20 | 13F | First American Bank | 18.311 | 1,32 | 2.466 | 14,01 | ||||
| 2026-02-18 | 13F | EP Wealth Advisors, Inc. | 0 | -100,00 | 0 | |||||
| 2026-01-28 | 13F | CAPROCK Group, Inc. | 10.399 | 38,80 | 1.253 | 60,64 | ||||
| 2026-02-03 | 13F | Strengthening Families & Communities, LLC | 15 | 1.400,00 | 2 | |||||
| 2026-04-22 | 13F | Atlantic Edge Private Wealth Management, LLC | 45 | 0,00 | 6 | 20,00 | ||||
| 2026-04-07 | 13F | Farther Finance Advisors, LLC | 3.646 | 28,93 | 488 | 44,38 | ||||
| 2026-02-17 | 13F | Advisory Services Network, LLC | 15.168 | -3,54 | 1.815 | 2,14 | ||||
| 2026-02-17 | 13F | Millennium Management Llc | 0 | -100,00 | 0 | |||||
| 2026-02-13 | 13F | Sei Investments Co | 48.978 | -20,31 | 5.863 | -15,63 | ||||
| 2025-11-13 | 13F | Tribune Investment Group LP | 0 | -100,00 | 0 | |||||
| 2026-02-17 | 13F | Captrust Financial Advisors | 5.947 | 4,59 | 712 | 10,75 | ||||
| 2026-04-15 | 13F | DAVENPORT & Co LLC | 6.000 | 242,86 | 808 | 286,60 | ||||
| 2026-02-17 | 13F | Fmr Llc | 80.701 | 26,83 | 9.658 | 34,27 | ||||
| 2026-04-20 | 13F | Ritholtz Wealth Management | 3.920 | 14,15 | 528 | 28,22 | ||||
| 2026-02-13 | 13F | Caitong International Asset Management Co., Ltd | 0 | -100,00 | 0 | |||||
| 2026-04-24 | 13F | Gilliland Jeter Wealth Management LLC | 11.212 | 0,00 | 1.510 | 12,53 | ||||
| 2026-04-10 | 13F | Perigon Wealth Management, LLC | 1.598 | 215 | ||||||
| 2026-04-22 | 13F | Pictet Asset Management Holding SA | 16.734 | 5,39 | 2.254 | 18,58 | ||||
| 2026-01-23 | 13F | Forefront Wealth Management Inc. | 2.169 | 1,93 | 260 | 7,92 | ||||
| 2026-02-09 | 13F | Huntington National Bank | 2.308 | 10,38 | 276 | 16,95 | ||||
| 2026-04-09 | 13F | Curated Wealth Partners LLC | 1.722 | 0,00 | 232 | 12,14 | ||||
| 2026-04-21 | 13F | Nemes Rush Group LLC | 1.412 | -3,81 | 190 | 8,57 | ||||
| 2026-02-04 | 13F | Atlantic Union Bankshares Corp | 75 | 0,00 | 9 | 0,00 | ||||
| 2026-04-08 | 13F | DiNuzzo Private Wealth, Inc. | 16 | 0,00 | 2 | 100,00 | ||||
| 2026-04-21 | 13F | Pinnacle Associates Ltd | 4.344 | 3,33 | 585 | 16,30 | ||||
| 2026-04-23 | 13F | Drucker Wealth 3.0, LLC | 10.624 | 7,09 | 1.431 | 20,47 | ||||
| 2026-02-09 | 13F | Keating Financial Advisory Services, Inc. | 467 | 56 | ||||||
| 2026-02-17 | 13F | Clark Capital Management Group, Inc. | 367.901 | 414,17 | 44.030 | 444,32 | ||||
| 2025-11-13 | 13F | Glenmede Investment Management, LP | 37.723 | 4,30 | 4.265 | 7,27 | ||||
| 2026-04-30 | 13F | Mv Capital Management, Inc. | 0 | -100,00 | 0 | |||||
| 2026-05-01 | 13F | Rakuten Securities, Inc. | 20 | 3 | ||||||
| 2026-04-20 | 13F | Contravisory Investment Management, Inc. | 240 | 0,00 | 32 | 14,29 | ||||
| 2026-04-20 | 13F | Apella Capital, LLC | 2.496 | 335 | ||||||
| 2026-04-17 | 13F | Bell Investment Advisors, Inc | 265 | 0,00 | 36 | 12,90 | ||||
| 2026-02-11 | 13F | Manchester Capital Management LLC | 45 | 5 | ||||||
| 2026-02-13 | 13F | Yost Capital Management, L.L.C. | 50.000 | 0,00 | 5.984 | 5,86 | ||||
| 2026-02-18 | 13F | Vident Advisory, LLC | 17.569 | -15,75 | 2.103 | -10,82 | ||||
| 2026-01-29 | 13F | DecisionPoint Financial, LLC | 5 | 0,00 | 1 | |||||
| 2026-02-19 | 13F | Invesco Ltd. | 1.045.754 | 4,71 | 125.156 | 10,84 | ||||
| 2026-02-10 | 13F | Capital Innovations LLC | 54.239 | 6.491 | ||||||
| 2026-01-22 | 13F | Richardson Financial Services Inc. | 244 | 62,67 | 29 | 81,25 | ||||
| 2026-02-13 | 13F | Victory Capital Management Inc | 60.477 | -42,17 | 7.238 | -38,79 | ||||
| 2026-02-10 | 13F | Nomura Asset Management Co Ltd | 570 | 0,00 | 68 | 6,25 | ||||
| 2026-04-16 | 13F | Capital Investment Advisors, LLC | 2.732 | -1,80 | 368 | 10,54 | ||||
| 2026-04-24 | 13F | Root Financial Partners, LLC | 432 | 30,91 | 58 | 48,72 | ||||
| 2026-02-13 | 13F | Marshall Wace, Llp | 3.215 | 385 | ||||||
| 2026-02-09 | 13F | Waratah Capital Advisors Ltd. | 0 | -100,00 | 0 | |||||
| 2025-11-14 | 13F | Candelo Capital Management LP | 0 | -100,00 | 0 | |||||
| 2026-02-17 | 13F | Nishkama Capital, LLC | 25.165 | 3.012 | ||||||
| 2025-11-12 | 13F | Bellwether Advisors, LLC | 0 | -100,00 | 0 | |||||
| 2026-01-14 | 13F | Hennion & Walsh Asset Management, Inc. | 8.378 | -30,00 | 1.003 | -25,94 | ||||
| 2026-02-13 | 13F | Ingalls & Snyder Llc | 2.038 | 0,00 | 0 | |||||
| 2026-02-17 | 13F | Voloridge Investment Management, Llc | 210.012 | 9,45 | 25.134 | 15,86 | ||||
| 2026-02-05 | 13F | 1620 Investment Advisors, Inc. | 47 | -22,95 | 6 | -16,67 | ||||
| 2025-11-14 | 13F | ExodusPoint Capital Management, LP | 0 | -100,00 | 0 | |||||
| 2026-02-12 | 13F | Federated Hermes, Inc. | 11.657 | -14,73 | 1.395 | -9,71 | ||||
| 2026-02-17 | 13F | Virtus Investment Advisers, Inc. | 1.360 | 163 | ||||||
| 2026-02-05 | 13F | Elyxium Wealth, LLC | 132 | 16 | ||||||
| 2026-02-09 | 13F | Glenview Trust Co | 2.065 | -21,93 | 247 | -5,73 | ||||
| 2026-01-28 | 13F | N.E.W. Advisory Services LLC | 72 | 0,00 | 9 | 0,00 | ||||
| 2026-04-23 | 13F | Chicago Capital, LLC | 1.608 | -13,46 | 217 | -2,70 | ||||
| 2026-01-08 | 13F | Nordea Investment Management Ab | 11.464 | 1.371 | ||||||
| 2025-11-14 | 13F | Texas Permanent School Fund | 0 | -100,00 | 0 | -100,00 | ||||
| 2026-04-16 | 13F | Capital Advisors, Ltd. LLC | 15 | 0,00 | 0 | |||||
| 2026-02-13 | 13F | Panagora Asset Management Inc | 3.623 | 0,00 | 434 | 5,87 | ||||
| 2026-04-29 | 13F | American Capital Advisory, LLC | 3 | 0,00 | 0 | |||||
| 2026-04-29 | 13F | WPG Advisers, LLC | 68 | 0,00 | 9 | 12,50 | ||||
| 2026-04-24 | 13F | Bayban | 15 | 2 | ||||||
| 2026-04-28 | 13F | Southern Michigan Bank & Trust | 44 | 6 | ||||||
| 2026-04-23 | 13F | MQS Management LLC | 4.313 | 581 | ||||||
| 2026-02-12 | 13F | Federation des caisses Desjardins du Quebec | 30.865 | 18,83 | 3.694 | 25,78 | ||||
| 2026-02-13 | 13F | SRS Capital Advisors, Inc. | 2.405 | 60,87 | 288 | 69,82 | ||||
| 2026-02-17 | 13F | PDT Partners, LLC | 7.746 | -80,84 | 927 | -79,71 | ||||
| 2026-04-15 | 13F | Norden Group Llc | 2.817 | 9,44 | 379 | 23,05 | ||||
| 2026-04-15 | 13F | Exchange Traded Concepts, Llc | 115.676 | 24,74 | 15.578 | 40,37 | ||||
| 2026-04-28 | 13F | Nbt Bank N A /ny | 1.509 | 0,47 | 203 | 13,41 | ||||
| 2026-02-10 | 13F | Bruce G. Allen Investments, LLC | 12 | 0,00 | 1 | 0,00 | ||||
| 2026-02-12 | 13F | BlackRock, Inc. | 10.840.692 | 1,91 | 1.297.414 | 7,88 | ||||
| 2026-02-06 | 13F | Meiji Yasuda Asset Management Co Ltd. | 2.333 | -1,19 | 279 | 4,89 | ||||
| 2026-02-10 | 13F | Bnp Paribas Arbitrage, Sa | 24.117 | 9,14 | 2.886 | 15,53 | ||||
| 2026-04-24 | 13F | Key FInancial Inc | 98 | 13 | ||||||
| 2026-04-23 | 13F | J.w. Cole Advisors, Inc. | 9.461 | -0,03 | 1.274 | 12,54 | ||||
| 2026-01-27 | 13F | TD Waterhouse Canada Inc. | 10.340 | -10,82 | 1.237 | -6,43 | ||||
| 2026-02-03 | 13F | Premier Fund Managers Ltd | 41.000 | 57,69 | 5 | 100,00 | ||||
| 2026-02-20 | 13F | Sunbelt Securities, Inc. | 500 | 0,00 | 60 | 5,36 | ||||
| 2026-02-17 | 13F | Wellington Management Group Llp | 146.733 | 24,01 | 17.561 | 31,28 | ||||
| 2026-04-03 | 13F | Global Wealth Strategies & Associates | 100 | 0,00 | 13 | 18,18 | ||||
| 2026-05-01 | 13F | Commonwealth Of Pennsylvania Public School Empls Retrmt Sys | 25.475 | 0,13 | 3.431 | 12,64 | ||||
| 2026-04-30 | 13F | Sequoia Financial Advisors, LLC | 10.954 | -18,46 | 1.475 | -8,21 | ||||
| 2026-02-13 | 13F | Natixis | 37.851 | 4.530 | ||||||
| 2026-02-13 | 13F | S&t Bank/pa | 78 | 2.500,00 | 9 | |||||
| 2026-02-12 | 13F | Campbell & CO Investment Adviser LLC | 32.763 | 120,31 | 3.921 | 133,25 | ||||
| 2026-02-13 | 13F | BNP Paribas Asset Management Holding S.A. | 1.774 | 14,45 | 0 | |||||
| 2026-05-01 | 13F | HFM Investment Advisors, LLC | 8 | 14,29 | 1 | |||||
| 2026-04-30 | 13F | Nuveen, LLC | 391.579 | 88,78 | 52.734 | 112,43 | ||||
| 2026-02-13 | 13F | Fieldview Capital Management, LLC | 2.789 | 334 | ||||||
| 2026-01-15 | 13F | Alpine Bank Wealth Management | 0 | -100,00 | 0 | |||||
| 2026-04-22 | 13F | MeadowBrook Investment Advisors LLC | 0 | -100,00 | 0 | |||||
| 2026-04-29 | 13F | Axxcess Wealth Management, Llc | 0 | -100,00 | 0 | |||||
| 2026-02-13 | 13F | Treasurer of the State of North Carolina | 42.505 | -6,82 | 5 | 0,00 | ||||
| 2026-02-17 | 13F | Gladstone Institutional Advisory LLC | 1.785 | -7,03 | 214 | -1,84 | ||||
| 2025-11-14 | 13F | Cubist Systematic Strategies, LLC | Put | 0 | -100,00 | 0 | -100,00 | |||
| 2026-02-11 | 13F | O'shaughnessy Asset Management, Llc | 6.546 | -3,86 | 783 | 1,82 | ||||
| 2026-05-01 | 13F | Hantz Financial Services, Inc. | 12.551 | 10,19 | 2 | 0,00 | ||||
| 2026-04-02 | 13F | Noble Wealth Management PBC | 0 | -100,00 | 0 | |||||
| 2026-04-22 | 13F | Pinnacle Bancorp, Inc. | 193 | 0,00 | 26 | 8,70 | ||||
| 2026-02-13 | 13F | Eventide Asset Management, Llc | 394.724 | 115,40 | 47.266 | 128,14 | ||||
| 2026-02-11 | 13F | Los Angeles Capital Management Llc | 440 | -84,24 | 48 | -84,76 | ||||
| 2026-02-13 | 13F | Heritage Wealth Advisors | 150 | 0,00 | 18 | 6,25 | ||||
| 2026-04-14 | 13F | Prospera Financial Services Inc | 2.707 | -0,48 | 365 | 12,00 | ||||
| 2026-04-08 | 13F | Grove Bank & Trust | 93 | 0,00 | 13 | 9,09 | ||||
| 2026-02-10 | 13F | New Mexico Educational Retirement Board | 19.748 | 0,00 | 2 | 0,00 | ||||
| 2026-04-15 | 13F | Trust Co Of Toledo Na /oh/ | 350 | 0,00 | 47 | 14,63 | ||||
| 2026-02-17 | 13F | Cdkv Holdings Llc | 119 | 14 | ||||||
| 2026-04-27 | 13F | New York State Teachers Retirement System | 90.621 | -16,17 | 12 | 0,00 | ||||
| 2026-01-07 | 13F | Procyon Private Wealth Partners, LLC | 3.563 | 426 | ||||||
| 2026-04-20 | 13F | Godsey & Gibb Associates | 250 | 0,00 | 34 | 13,79 | ||||
| 2026-02-13 | 13F | Parkside Financial Bank & Trust | 347 | 13,77 | 42 | 20,59 | ||||
| 2026-02-11 | 13F | Jpmorgan Chase & Co | 652.634 | -25,13 | 78.107 | -20,73 | ||||
| 2025-11-14 | 13F | Truvestments Capital Llc | 0 | -100,00 | 0 | |||||
| 2026-02-17 | 13F | Lombard Odier Asset Management (USA) Corp | 0 | -100,00 | 0 | |||||
| 2026-02-17 | 13F | Scarborough Advisors, LLC | 413 | 0,73 | 49 | 6,52 | ||||
| 2026-04-21 | 13F | GHP Investment Advisors, Inc. | 679 | 0,00 | 91 | 12,35 | ||||
| 2026-02-10 | 13F | Catalyst Capital Advisors LLC | 110.308 | -34,31 | 13.202 | -30,46 | ||||
| 2026-02-10 | 13F | Florida Financial Advisors, Llc | 0 | -100,00 | 0 | |||||
| 2026-02-17 | 13F | Citadel Advisors Llc | Put | 3.000 | -25,00 | 359 | -20,58 | |||
| 2026-02-13 | 13F | Centaurus Financial, Inc. | 3.191 | 0,50 | 0 | |||||
| 2026-02-13 | 13F | Pacific Center for Financial Services | 459 | 0,00 | 52 | 0,00 | ||||
| 2026-02-17 | 13F | Citadel Advisors Llc | Call | 58.700 | 66,29 | 7.025 | 76,02 | |||
| 2026-02-17 | 13F | Citadel Advisors Llc | 1.372.178 | 4,26 | 164.222 | 10,37 | ||||
| 2026-04-30 | 13F | BRYN MAWR TRUST Co | 39 | 0,00 | 5 | 25,00 | ||||
| 2026-02-12 | 13F | EntryPoint Capital, LLC | 1.871 | 0,00 | 224 | 5,69 | ||||
| 2026-04-24 | 13F | Private Advisor Group, LLC | 5.546 | 2,40 | 747 | 15,12 | ||||
| 2026-02-17 | 13F | Aqr Capital Management Llc | 139.335 | -31,60 | 16.676 | -27,60 | ||||
| 2026-01-30 | 13F | Us Bancorp \de\ | 9.256 | 2,67 | 1.108 | 8,64 | ||||
| 2026-02-06 | 13F | Tortoise Investment Management, LLC | 0 | -100,00 | 0 | |||||
| 2026-02-17 | 13F | Creative Planning | 71.109 | 37,12 | 8.510 | 45,15 | ||||
| 2025-11-07 | 13F | Atticus Wealth Management, Llc | 0 | -100,00 | 0 | |||||
| 2026-04-23 | 13F | Farmers & Merchants Investments Inc | 88 | 0,00 | 12 | 10,00 | ||||
| 2026-04-10 | 13F | Linden Thomas Advisory Services, LLC | 14.734 | 0,75 | 1.984 | 13,37 | ||||
| 2026-04-06 | 13F | Highline Wealth Partners Llc | 10 | 0,00 | 1 | 0,00 | ||||
| 2025-11-14 | 13F | Wetherby Asset Management Inc | 1.997 | 6,34 | 226 | 9,22 | ||||
| 2026-01-23 | 13F | Westside Investment Management, Inc. | 308 | 6,21 | 37 | 12,12 | ||||
| 2026-04-20 | 13F | State of Alaska, Department of Revenue | 41.011 | 0,44 | 6 | 25,00 | ||||
| 2026-01-28 | 13F | Universal- Beteiligungs- und Servicegesellschaft mbH | 17.604 | 7,95 | 2.107 | 14,27 | ||||
| 2026-04-24 | 13F | Strs Ohio | 2.427 | -0,12 | 327 | 12,41 | ||||
| 2026-02-11 | 13F | Vaughan David Investments Inc/il | 29.862 | 0,00 | 4 | 0,00 | ||||
| 2026-04-23 | 13F | Kohmann Bosshard Financial Services, LLC | 500 | 0,00 | 67 | 13,56 | ||||
| 2026-02-17 | 13F | Lazard Asset Management Llc | 2.039 | -21,79 | 244 | -17,01 | ||||
| 2026-04-30 | 13F | Money Concepts Capital Corp | 2.046 | 276 | ||||||
| 2026-04-28 | 13F | SBI Securities Co., Ltd. | 1.386 | 1,24 | 187 | 14,11 | ||||
| 2026-02-04 | 13F | Swiss Life Asset Management Ltd | 4.679 | 1,10 | 560 | 6,88 | ||||
| 2026-05-01 | 13F | Avion Wealth | 32 | -11,11 | 0 | |||||
| 2026-04-30 | 13F | Candriam Luxembourg S.C.A. | 1.599 | 215 | ||||||
| 2026-02-06 | 13F | Gsa Capital Partners Llp | 2.948 | 0 | ||||||
| 2026-02-11 | 13F | Strategy Asset Managers Llc | 1.932 | -7,07 | 231 | -1,70 | ||||
| 2026-02-17 | 13F | Brevan Howard Capital Management LP | 4.804 | 27,26 | 575 | 34,74 | ||||
| 2026-05-01 | 13F | Valmark Advisers, Inc. | 2.392 | -5,12 | 322 | 6,98 | ||||
| 2026-02-20 | 13F | Dorsey Wright & Associates | 62.810 | -1,30 | 7.517 | 4,48 | ||||
| 2026-04-20 | 13F | Inscription Capital, LLC | 1.715 | 0,76 | 231 | 13,30 | ||||
| 2026-02-12 | 13F | Cloud Capital Management, LLC | 0 | -100,00 | 0 | |||||
| 2026-02-17 | 13F | Yaupon Capital Management LP | 0 | -100,00 | 0 | |||||
| 2026-02-13 | 13F | Morton Community Bank | 2.300 | 0,00 | 290 | 15,14 | ||||
| 2026-04-29 | 13F | Advance Capital Management, Inc. | 2.672 | -21,20 | 360 | -11,36 | ||||
| 2026-01-29 | 13F | Quest 10 Wealth Builders, Inc. | 0 | -100,00 | 0 | |||||
| 2026-02-12 | 13F | Steward Partners Investment Advisory, Llc | 874 | -25,55 | 105 | -21,21 | ||||
| 2026-02-12 | 13F | Principal Securities, Inc. | 6.874 | 731,20 | 823 | 783,87 | ||||
| 2025-11-12 | 13F | Buckingham Strategic Partners | 0 | -100,00 | 0 | |||||
| 2026-04-27 | 13F | Qrg Capital Management, Inc. | 5.674 | -17,76 | 764 | -7,39 | ||||
| 2026-02-13 | 13F | JustInvest LLC | 25.908 | 2,99 | 3.101 | 8,66 | ||||
| 2026-04-21 | 13F | Vise Technologies, Inc. | 2.292 | 0,00 | 274 | 0,00 | ||||
| 2026-04-29 | 13F | Cary Street Partners Financial Llc | 1.675 | 0,00 | 226 | 12,50 | ||||
| 2026-03-04 | 13F | Rehmann Capital Advisory Group | 2.876 | 36,56 | 344 | 44,54 | ||||
| 2026-04-20 | 13F | Jfs Wealth Advisors, Llc | 98 | 6,52 | 13 | 18,18 | ||||
| 2026-02-17 | 13F | Covalis Capital Llp | 82.845 | -32,63 | 9.915 | -28,69 | ||||
| 2026-04-23 | 13F | Forum Financial Management, LP | 0 | -100,00 | 0 | |||||
| 2025-11-14 | 13F | Sourcerock Group LLC | 0 | -100,00 | 0 | |||||
| 2025-11-14 | 13F | Wolverine Trading, Llc | Call | 3.200 | 362 | |||||
| 2026-01-27 | 13F | BankPlus Trust Department | 60 | 0,00 | 7 | 16,67 | ||||
| 2026-02-11 | 13F | MCF Advisors LLC | 1.005 | 0,00 | 121 | 6,14 | ||||
| 2026-02-12 | 13F | Hrt Financial Lp | 0 | -100,00 | 0 | |||||
| 2026-02-17 | 13F | Two Sigma Investments, Lp | 667.367 | 135,45 | 79.870 | 149,24 | ||||
| 2026-04-27 | 13F | Mount Yale Investment Advisors, LLC | 3.213 | 10,53 | 436 | 24,29 | ||||
| 2026-02-17 | 13F | Modern Wealth Management, LLC | 7.561 | 13,41 | 905 | 20,05 | ||||
| 2026-02-11 | 13F | Meeder Asset Management Inc | 46 | -11,54 | 6 | 0,00 | ||||
| 2026-02-17 | 13F | Blue Chip Partners, Inc. | 17.721 | 0,18 | 2.121 | 6,05 | ||||
| 2026-02-17 | 13F | Jump Financial, LLC | 0 | -100,00 | 0 | |||||
| 2026-02-09 | 13F | Wellington Shields & Co., LLC | 1.750 | 209 | ||||||
| 2026-02-09 | 13F | Coldstream Capital Management Inc | 3.242 | 7,89 | 388 | 14,45 | ||||
| 2026-04-22 | 13F | Janney Montgomery Scott LLC | 24.062 | 8,02 | 3 | 50,00 | ||||
| 2026-02-11 | 13F | Prudential Plc | 7.269 | 870 | ||||||
| 2026-02-10 | 13F | Mutual Of America Capital Management Llc | 42.315 | -9,81 | 5.064 | -4,52 | ||||
| 2026-02-17 | 13F | Perbak Capital Partners LLP | 2.507 | -57,69 | 300 | -55,16 | ||||
| 2026-02-17 | 13F | Cetera Investment Advisers | 64.882 | 24,33 | 7.765 | 31,61 | ||||
| 2026-02-03 | 13F | Navellier & Associates Inc | 0 | -100,00 | 0 | -100,00 | ||||
| 2026-02-13 | 13F | Colony Group, LLC | 261.793 | 4,70 | 29.735 | 5,20 | ||||
| 2026-04-15 | 13F | Merit Financial Group, LLC | 12.518 | 24,09 | 1.686 | 39,60 | ||||
| 2026-04-20 | 13F | Kestra Private Wealth Services, Llc | 5.981 | 22,39 | 806 | 37,84 | ||||
| 2026-02-12 | 13F | State Board Of Administration Of Florida Retirement System | 84.449 | -7,30 | 10.107 | -1,87 | ||||
| 2026-02-17 | 13F | Northern Trust Corp | 881.267 | -3,64 | 105.470 | 2,00 | ||||
| 2026-04-06 | 13F | IFS Advisors, LLC | 48 | 6 | ||||||
| 2025-11-14 | 13F | Cubist Systematic Strategies, LLC | Call | 0 | -100,00 | 0 | -100,00 | |||
| 2026-02-12 | 13F | Logan Capital Management Inc | 0 | -100,00 | 0 | -100,00 | ||||
| 2025-11-14 | 13F | Algert Global Llc | 0 | -100,00 | 0 | |||||
| 2026-04-17 | 13F | Sovereign Financial Group, Inc. | 1.541 | 208 | ||||||
| 2026-02-05 | 13F | Plante Moran Financial Advisors, LLC | 4.358 | -6,06 | 522 | -0,57 | ||||
| 2026-01-29 | 13F | UBS Group AG | 528.575 | 9,13 | 63.260 | 15,52 | ||||
| 2026-02-11 | 13F | Cerity Partners LLC | 20.139 | 0,92 | 2.410 | 6,83 | ||||
| 2026-04-09 | 13F | Brown Wealth Management, Llc | 1.772 | 1,37 | 239 | 13,88 | ||||
| 2026-02-12 | 13F | California Public Employees Retirement System | 273.885 | -18,37 | 32.779 | -13,59 | ||||
| 2026-02-02 | 13F | Breakwater Investment Management | 64 | 0,00 | 8 | 0,00 | ||||
| 2026-02-10 | 13F | Eurizon Capital SGR S.p.A. | 2.871 | 346 | ||||||
| 2026-04-16 | 13F | XML Financial, LLC | 2.503 | 0,00 | 337 | 12,71 | ||||
| 2026-02-17 | 13F | Gotham Asset Management, LLC | 285.239 | 7,56 | 34.137 | 13,86 | ||||
| 2026-01-30 | 13F | Sigma Planning Corp | 16.813 | 8,24 | 2.012 | 14,58 | ||||
| 2026-02-03 | 13F | NewEdge Wealth, LLC | 3.613 | 2,41 | 432 | 11,05 | ||||
| 2026-02-11 | 13F | Clearbridge Investments, LLC | 233.398 | 50,98 | 27.933 | 59,82 | ||||
| 2026-02-17 | 13F | Mercer Global Advisors Inc /adv | 15.802 | 16,59 | 1.891 | 23,43 | ||||
| 2025-11-17 | 13F | Hancock Whitney Corp | 0 | -100,00 | 0 | -100,00 |