Grundlæggende statistik
| Institutionelle ejere | 277 total, 277 long only, 0 short only, 0 long/short - change of 11,69% MRQ |
| Gennemsnitlig porteføljeallokering | 0.8503 % - change of -4,97% MRQ |
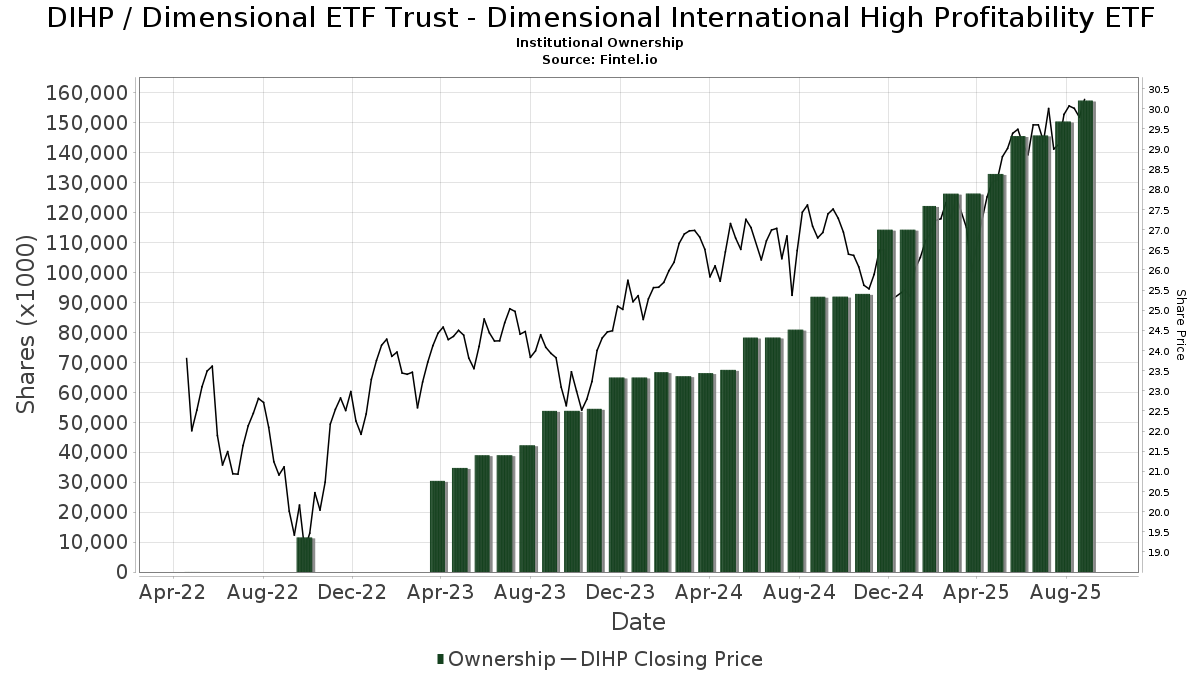
| Institutionelle aktier (lange) | 157.377.044 (ex 13D/G) - change of 11,65MM shares 8,00% MRQ |
| Institutionel værdi (lang) | $ 4.552.754 USD ($1000) |
Institutionelt ejerskab og aktionærer
Dimensional ETF Trust - Dimensional International High Profitability ETF (US:DIHP) har 277 institutionelle ejere og aktionærer, der har indsendt 13D/G- eller 13F-formularer til Securities Exchange Commission (SEC). Disse institutioner har i alt 157,377,044 aktier. Største aktionærer omfatter Mercer Global Advisors Inc /adv, Envestnet Asset Management Inc, Savant Capital, LLC, Colony Group, LLC, Vista Wealth Management Group, LLC, Forum Financial Management, LP, Sequoia Financial Advisors, LLC, Clarius Group, LLC, Bank Of Montreal /can/, and HighTower Advisors, LLC .
Dimensional ETF Trust - Dimensional International High Profitability ETF (BATS:DIHP) institutionel ejerskabsstruktur viser aktuelle positioner i virksomheden efter institutioner og fonde, samt seneste ændringer i positionsstørrelse. Større aktionærer kan omfatte individuelle investorer, investeringsforeninger, hedgefonde eller institutioner. Skema 13D angiver, at investoren besidder (eller besidder) mere end 5 % af virksomheden og har til hensigt (eller har til hensigt at) aktivt at forfølge en ændring i forretningsstrategi. Skema 13G indikerer en passiv investering på over 5%.
The share price as of September 12, 2025 is 30,41 / share. Previously, on September 16, 2024, the share price was 27,30 / share. This represents an increase of 11,39% over that period.
Fondens stemningsscore
Fund Sentiment Score (fka Ownership Accumulation Score) finder de aktier, der bliver mest købt af fonde. Det er resultatet af en sofistikeret, multi-faktor kvantitativ model, der identificerer virksomheder med de højeste niveauer af institutionel akkumulering. Scoringsmodellen bruger en kombination af den samlede stigning i oplyste ejere, ændringerne i porteføljeallokeringer i disse ejere og andre målinger. Tallet går fra 0 til 100, hvor højere tal indikerer et højere niveau af akkumulering for sine jævnaldrende, og 50 er gennemsnittet.
Opdateringsfrekvens: Dagligt
Se Ownership Explorer, som giver en liste over højest rangerende virksomheder.
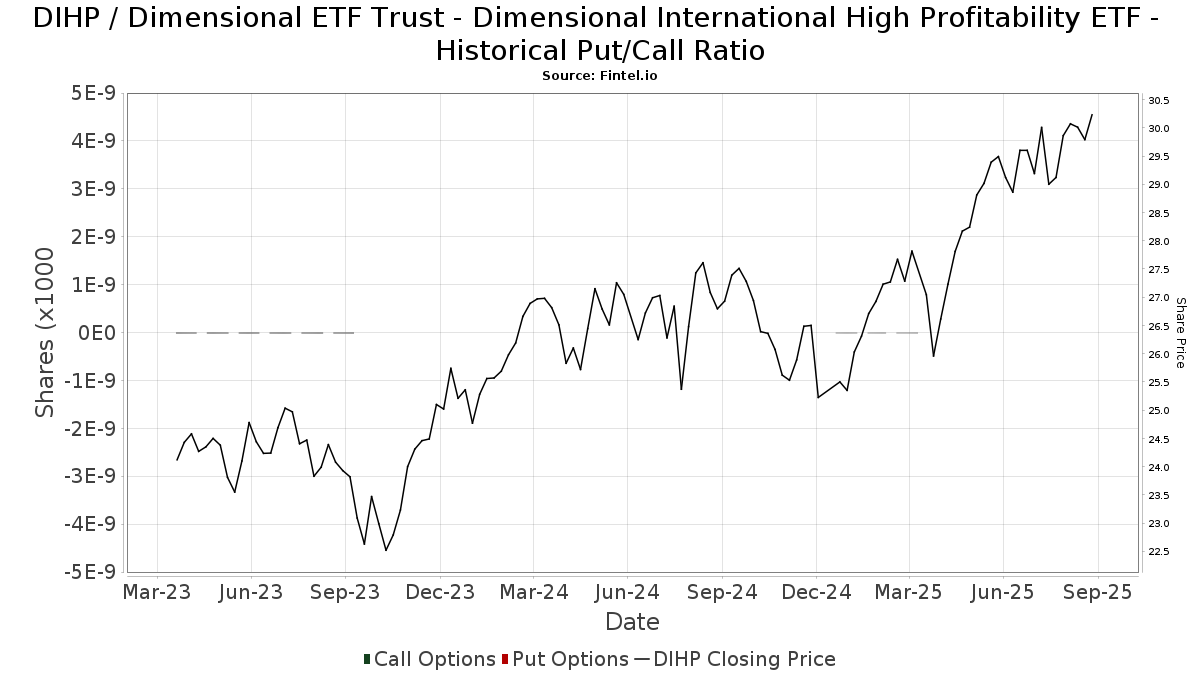
Institutionel Put/Call-forhold
Ud over at indberette standardaktie- og gældsudstedelser skal institutter med mere end 100 mill. aktiver under forvaltning også oplyse deres put- og call-optionsbeholdninger. Da salgsoptioner generelt indikerer negativ stemning, og købsoptioner indikerer positiv stemning, kan vi få en fornemmelse af den overordnede institutionelle stemning ved at plotte forholdet mellem put og kald. Diagrammet til højre viser det historiske put/call-forhold for dette instrument.
Brug af Put/Call Ratio som en indikator for investorernes stemning overvinder en af de vigtigste mangler ved at bruge totalt institutionelt ejerskab, som er, at en betydelig mængde af aktiver under forvaltning investeres passivt for at spore indekser. Passivt forvaltede fonde køber typisk ikke optioner, så indikatoren for put/call-forholdet følger mere nøje følelsen af aktivt forvaltede fonde.
13D/G-arkivering
Vi præsenterer 13D/G ansøgninger separat fra 13F ansøgninger på grund af den forskellige behandling af SEC. 13D/G-ansøgninger kan indgives af grupper af investorer (med én ledende), hvorimod 13F-ansøgninger ikke kan. Dette resulterer i situationer, hvor en investor kan indsende en 13D/G, der rapporterer én værdi for de samlede aktier (der repræsenterer alle de aktier, der ejes af investorgruppen), men derefter indsender en 13F, der rapporterer en anden værdi for de samlede aktier (der udelukkende repræsenterer deres egne) ejendomsret). Det betyder, at aktieejerskab af 13D/G-arkiver og 13F-arkiveringer ofte ikke er direkte sammenlignelige, så vi præsenterer dem separat.
Bemærk: Fra den 16. maj 2021 viser vi ikke længere ejere, der ikke har indsendt en 13D/G inden for det seneste år. Tidligere viste vi den fulde historie af 13D/G-arkiver. Generelt skal enheder, der er forpligtet til at indgive 13D/G-ansøgninger, indgive mindst årligt, før de indsender en afsluttende ansøgning. Dog forlader fonde nogle gange positioner uden at indsende en afsluttende ansøgning (dvs. de afvikler), så visning af den fulde historie resulterede nogle gange i forvirring om det nuværende ejerskab. For at undgå forvirring viser vi nu kun 'aktuelle' ejere - det vil sige - ejere, der har anmeldt inden for det seneste år.
Upgrade to unlock premium data.
| Fil dato | Form | Investor | Forrige Aktier |
Seneste Aktier |
Δ Aktier (Procent) |
Ejendomsret (Procent) |
Δ Ejerskab (Procent) |
|
|---|---|---|---|---|---|---|---|---|
| 2025-08-07 | Savant Capital, LLC | 23,936,337 | 18.02 |
13F og NPORT arkivering
Detaljer om 13F-arkivering er gratis. Detaljer om NP-ansøgninger kræver et premium-medlemskab. Grønne rækker angiver nye positioner. Røde rækker angiver lukkede positioner. Klik på linket ikon for at se den fulde transaktionshistorik.
Opgrader
for at låse premium-data op og eksportere til Excel ![]() .
.
| Fil dato | Kilde | Investor | Type | Gennemsnitlig pris (Øst) |
Aktier | Δ Aktier (%) |
Rapporteret Værdi ($1000) |
Δ Værdi (%) |
Port Alloc (%) |
|
|---|---|---|---|---|---|---|---|---|---|---|
| 2025-07-31 | 13F | Brighton Jones Llc | 13.453 | 8,54 | 397 | 18,92 | ||||
| 2025-08-05 | 13F | Centennial Bank/AR/ | 10.961 | -53,61 | 323 | -49,21 | ||||
| 2025-07-28 | 13F | RCS Financial Planning, LLC | 19.586 | -22,21 | 578 | -14,90 | ||||
| 2025-07-25 | 13F | Apollon Wealth Management, LLC | 21.862 | -10,40 | 645 | -1,98 | ||||
| 2025-07-11 | 13F | Farther Finance Advisors, LLC | 14.905 | 13,54 | 440 | 24,01 | ||||
| 2025-08-05 | 13F | Integrity Financial Corp /WA | 34 | 0,00 | 1 | |||||
| 2025-08-18 | 13F/A | Kestra Investment Management, LLC | 1.840.775 | 54.284 | ||||||
| 2025-07-22 | 13F | Awm Capital, Llc | 7.360 | 217 | ||||||
| 2025-07-17 | 13F | Applied Capital LLC | 145.384 | -0,40 | 4.287 | 9,03 | ||||
| 2025-08-12 | 13F | Intrepid Capital Management Inc | 60.631 | -8,50 | 1.788 | 0,17 | ||||
| 2025-08-15 | 13F | Kestra Advisory Services, LLC | 64.431 | 9,20 | 1.900 | 19,57 | ||||
| 2025-07-29 | 13F | Aspiriant, Llc | 39.901 | 0,00 | 1.177 | 9,50 | ||||
| 2025-08-14 | 13F | Old Mission Capital Llc | 0 | -100,00 | 0 | |||||
| 2025-08-13 | 13F | SageView Advisory Group, LLC | 24.448 | -2,38 | 716 | 6,08 | ||||
| 2025-08-13 | 13F | Jones Financial Companies Lllp | 65.478 | 9,32 | 1.925 | 18,53 | ||||
| 2025-08-12 | 13F | Tableaux Llc | 0 | -100,00 | 0 | |||||
| 2025-07-28 | 13F | Harbour Investments, Inc. | 403 | 1.200,00 | 12 | |||||
| 2025-08-19 | 13F | Advisory Services Network, LLC | 9.874 | -11,27 | 283 | -5,35 | ||||
| 2025-07-31 | 13F | Topsail Wealth Management, LLC | 1.135 | 1,07 | 33 | 10,00 | ||||
| 2025-08-14 | 13F | Mpwm Advisory Solutions, Llc | 1.450 | 0,00 | 43 | 7,69 | ||||
| 2025-04-15 | 13F | Paladin Advisory Group, LLC | 0 | -100,00 | 0 | |||||
| 2025-07-07 | 13F | Discipline Wealth Solutions, LLC | 6.859 | 202 | ||||||
| 2025-07-10 | 13F | Websterrogers Financial Advisors, Llc | 537.932 | 0,92 | 15.864 | 10,47 | ||||
| 2025-07-17 | 13F | Northwest Wealth Management, Llc | 165.485 | 2,88 | 4.880 | 12,62 | ||||
| 2025-08-15 | 13F | CI Private Wealth, LLC | 1.443.876 | -2,58 | 42.580 | 6,64 | ||||
| 2025-07-22 | 13F | Firethorn Wealth Partners, Llc | 23.759 | -5,41 | 701 | 3,55 | ||||
| 2025-08-12 | 13F | Landing Point Financial Group, LLC | 13.954 | 21,47 | 412 | 33,01 | ||||
| 2025-08-14 | 13F | Sentinel Wealth Management, Inc. | 36.041 | 1 | ||||||
| 2025-08-01 | 13F | Envestnet Asset Management Inc | 25.252.358 | 11,71 | 744.692 | 22,28 | ||||
| 2025-08-14 | 13F | Great Valley Advisor Group, Inc. | 12.006 | 354 | ||||||
| 2025-08-06 | 13F | AE Wealth Management LLC | 296.694 | 12,13 | 8.750 | 22,74 | ||||
| 2025-08-12 | 13F | CIBC Private Wealth Group, LLC | 6.055 | 0,00 | 179 | 21,09 | ||||
| 2025-07-11 | 13F | Andrews, Lucia Wealth Management Llc | 29.268 | 2,77 | 863 | 20,19 | ||||
| 2025-07-22 | 13F | Gemmer Asset Management LLC | 11.720 | 11,61 | 346 | 22,34 | ||||
| 2025-08-05 | 13F | Bridgewater Advisors Inc. | 771.597 | -6,88 | 22.554 | -2,02 | ||||
| 2025-05-02 | 13F | Capital A Wealth Management, LLC | 12 | 0 | ||||||
| 2025-07-14 | 13F | Shearwater Capital LLC | 6.978 | 206 | ||||||
| 2025-07-14 | 13F | Maryland Capital Advisors Inc. | 19.558 | 18,93 | 577 | 30,02 | ||||
| 2025-08-15 | 13F | Binnacle Investments Inc | 133.407 | 2,24 | 3.934 | 11,92 | ||||
| 2025-08-14 | 13F | Stifel Financial Corp | 48.891 | -20,10 | 1.442 | -12,56 | ||||
| 2025-07-29 | 13F | Two West Capital Advisors LLC | 34.992 | 0,62 | 1.041 | 14,02 | ||||
| 2025-07-23 | 13F | Sax Wealth Advisors, Llc | 378.587 | -12,80 | 11.165 | -4,55 | ||||
| 2025-07-30 | 13F | Brookstone Capital Management | 6.894 | 203 | ||||||
| 2025-08-07 | 13F | Nwam Llc | 31.763 | -4,47 | 937 | 4,58 | ||||
| 2025-08-11 | 13F | Summit Wealth Partners, LLC | 58.322 | 12,25 | 1.720 | 22,87 | ||||
| 2025-08-13 | 13F | Cresset Asset Management, LLC | 10.828 | -14,45 | 319 | -6,18 | ||||
| 2025-07-09 | 13F | Market Street Wealth Management Advisors Llc | 486.699 | 1,20 | 14.353 | 10,77 | ||||
| 2025-07-10 | 13F | Voisard Asset Management Group, Inc. | 222.066 | 11,76 | 6.549 | 22,35 | ||||
| 2025-08-12 | 13F | Jpmorgan Chase & Co | 126.046 | -4,14 | 3.717 | 4,94 | ||||
| 2025-08-14 | 13F | Envision Financial Planning, LLC | 390.041 | -2,30 | 11.502 | 6,96 | ||||
| 2025-08-08 | 13F | Gts Securities Llc | 7.351 | 217 | ||||||
| 2025-07-15 | 13F | Great Oak Capital Partners, Llc | 671.718 | 5,53 | 19.749 | 23,60 | ||||
| 2025-07-25 | 13F | Sequoia Financial Advisors, LLC | 4.384.277 | 1,51 | 129.292 | 11,11 | ||||
| 2025-08-12 | 13F | LPL Financial LLC | 94.606 | 14,04 | 2.790 | 24,84 | ||||
| 2025-08-11 | 13F | Citigroup Inc | 22.481 | 52,94 | 663 | 67,59 | ||||
| 2025-08-14 | 13F | Navigoe, LLC | 200.046 | 67,65 | 6 | 66,67 | ||||
| 2025-07-17 | 13F | Archford Capital Strategies, LLC | 98.344 | 25,99 | 2.900 | 37,96 | ||||
| 2025-07-15 | 13F | Family Wealth Partners, Llc | 315.038 | 2,18 | 9.290 | 11,85 | ||||
| 2025-07-25 | 13F | Tranquility Partners, LLC | 10.773 | 3,42 | 318 | 13,21 | ||||
| 2025-08-11 | 13F | HighTower Advisors, LLC | 2.226.611 | -1,67 | 65.663 | 7,64 | ||||
| 2025-08-14 | 13F | Jane Street Group, Llc | 431.564 | -64,94 | 12.727 | -61,62 | ||||
| 2025-07-21 | 13F | Matauro, Llc | 8.267 | 1,09 | 244 | 10,45 | ||||
| 2025-07-11 | 13F | Diversified Trust Co | 7.500 | 0,00 | 221 | 9,41 | ||||
| 2025-07-17 | 13F | Claris Advisors, Llc / Mo / | 239.294 | -1,42 | 7.057 | 7,91 | ||||
| 2025-08-12 | 13F | Bedel Financial Consulting, Inc. | 9.172 | 0,22 | 270 | 4,65 | ||||
| 2025-08-14 | 13F | Wetherby Asset Management Inc | 17.189 | -4,03 | 507 | 12,20 | ||||
| 2025-07-14 | 13F | Park Avenue Securities Llc | 1.027.563 | 9,52 | 30 | 20,00 | ||||
| 2025-07-31 | 13F | City State Bank | 16.500 | 9.066,67 | 487 | 12.050,00 | ||||
| 2025-04-17 | 13F | Vista Wealth Management Group, LLC | 6.458.111 | 1,92 | 173.982 | 8,83 | ||||
| 2025-07-16 | 13F | TCI Wealth Advisors, Inc. | 995.438 | 16,57 | 29.355 | 27,60 | ||||
| 2025-07-15 | 13F | Maseco Llp | 4.751 | 140 | ||||||
| 2025-07-16 | 13F | Midwest Heritage Bank, FSB | 67.856 | -0,07 | 2.001 | 9,40 | ||||
| 2025-07-24 | 13F | Callan Family Office, LLC | 32.750 | 0,00 | 966 | 9,41 | ||||
| 2025-08-05 | 13F | Cherry Tree Wealth Management, LLC | 5.221 | 0,00 | 154 | 9,29 | ||||
| 2025-08-14 | 13F | Wells Fargo & Company/mn | 1.618 | -57,64 | 48 | -53,92 | ||||
| 2025-08-11 | 13F | Aptus Capital Advisors, LLC | 4.146 | 0,24 | 122 | 9,91 | ||||
| 2025-07-29 | 13F | Schubert & Co | 47.240 | -14,88 | 1.393 | -6,82 | ||||
| 2025-08-14 | 13F | Bank Of America Corp /de/ | 345.714 | 4,21 | 10.195 | 14,09 | ||||
| 2025-04-17 | 13F | Retirement Solution Inc. | 0 | -100,00 | 0 | -100,00 | ||||
| 2025-07-21 | 13F | 25 Llc | 8.519 | 3,17 | 251 | 13,06 | ||||
| 2025-07-30 | 13F | Drive Wealth Management, Llc | 54.013 | 3,87 | 1.593 | 13,71 | ||||
| 2025-08-12 | 13F | AlphaCore Capital LLC | 3.023 | 142,62 | 89 | 169,70 | ||||
| 2025-08-14 | 13F | Bragg Financial Advisors, Inc | 17.799 | 525 | ||||||
| 2025-05-12 | 13F | Providence First Trust Co | 0 | -100,00 | 0 | |||||
| 2025-07-22 | 13F | Wealthcare Advisory Partners LLC | 49.323 | 21,58 | 1.455 | 33,15 | ||||
| 2025-08-07 | 13F | Allworth Financial LP | 0 | -100,00 | 0 | |||||
| 2025-08-13 | 13F | Northwestern Mutual Wealth Management Co | 14.497 | 4.042,00 | 428 | 4.644,44 | ||||
| 2025-08-14 | 13F | Royal Bank Of Canada | 172.169 | 10,66 | 5.077 | 21,14 | ||||
| 2025-07-10 | 13F | Oliver Lagore Vanvalin Investment Group | 0 | -100,00 | 0 | |||||
| 2025-07-18 | 13F | Truist Financial Corp | 25.456 | -0,31 | 751 | 9,17 | ||||
| 2025-08-14 | 13F | IHT Wealth Management, LLC | 11.893 | 0,00 | 351 | 9,38 | ||||
| 2025-07-22 | 13F | McElhenny Sheffield Capital Management, LLC | 103.000 | 103 | ||||||
| 2025-08-06 | 13F | Commonwealth Equity Services, Llc | 186.072 | -12,25 | 5 | 0,00 | ||||
| 2025-07-25 | 13F | Cwm, Llc | 9.332 | 3,07 | 0 | |||||
| 2025-08-14 | 13F | Mariner, LLC | 378.054 | 40,00 | 11.149 | 53,26 | ||||
| 2025-07-29 | 13F | Chicago Partners Investment Group LLC | 168.825 | 2,93 | 5.066 | 9,63 | ||||
| 2025-08-11 | 13F | Dorsey & Whitney Trust CO LLC | 16.404 | 484 | ||||||
| 2025-07-17 | 13F | Oceanside Advisors LLC | 272.613 | -0,08 | 8.039 | 9,39 | ||||
| 2025-08-13 | 13F | Summit Wealth Group Llc / Co | 25.605 | 755 | ||||||
| 2025-07-17 | 13F | Lauterbach Financial Advisors, LLC | 11.245 | 332 | ||||||
| 2025-07-29 | 13F | Ifrah Financial Services, Inc. | 13.555 | 1,67 | 400 | 11,14 | ||||
| 2025-07-14 | 13F | Foster Group, Inc. | 1.213.688 | -2,23 | 35.792 | 7,02 | ||||
| 2025-07-24 | 13F | Jfs Wealth Advisors, Llc | 4.585 | 0,00 | 135 | 9,76 | ||||
| 2025-08-06 | 13F | Spurstone Advisory Services, LLC | 67 | 0,00 | 2 | 0,00 | ||||
| 2025-07-30 | 13F | Rehmann Capital Advisory Group | 25.786 | 1,39 | 760 | 10,95 | ||||
| 2025-08-14 | 13F | Acorn Wealth Advisors, LLC | 18.577 | 4,98 | 548 | 14,92 | ||||
| 2025-08-13 | 13F | Beacon Pointe Advisors, LLC | 326.621 | 3,01 | 9.632 | 12,76 | ||||
| 2025-08-14 | 13F | Raymond James Financial Inc | 169.298 | 41,23 | 4.993 | 54,60 | ||||
| 2025-08-14 | 13F | Susquehanna International Group, Llp | 157.604 | 1.268,21 | 4.648 | 1.399,03 | ||||
| 2025-08-04 | 13F | Assetmark, Inc | 32 | -96,88 | 1 | -100,00 | ||||
| 2025-08-14 | 13F | Comerica Bank | 1.524 | -0,65 | 45 | 7,32 | ||||
| 2025-08-06 | 13F | Modera Wealth Management, LLC | 1.245.030 | 65,71 | 36.716 | 81,40 | ||||
| 2025-07-08 | 13F | Apella Capital, LLC | 930.719 | 31,48 | 27.224 | 48,14 | ||||
| 2025-08-13 | 13F | United Wealth Management, LLC | 320.686 | -0,21 | 9.457 | 9,24 | ||||
| 2025-08-14 | 13F | Financial Engines Advisors L.L.C. | 201.288 | 1,58 | 5.936 | 11,18 | ||||
| 2025-07-08 | 13F | Parallel Advisors, LLC | 2.250 | 0,00 | 66 | 10,00 | ||||
| 2025-07-14 | 13F | UMA Financial Services, Inc. | 5.144 | 0,00 | 152 | 9,42 | ||||
| 2025-08-13 | 13F | Millstone Evans Group, LLC | 1.159 | -64,66 | 34 | -61,36 | ||||
| 2025-08-14 | 13F | Colony Group, LLC | 12.915.929 | 102,50 | 380.891 | 121,66 | ||||
| 2025-08-04 | 13F | Integrity Alliance, Llc. | 199.066 | -0,69 | 5.870 | 8,70 | ||||
| 2025-08-11 | 13F | Foundation Wealth Management, LLC\PA | 124.502 | 16,72 | 3.672 | 27,78 | ||||
| 2025-08-14 | 13F | Aqr Capital Management Llc | 16.001 | -27,30 | 472 | -20,44 | ||||
| 2025-08-13 | 13F | GeoWealth Management, LLC | 4.945 | -68,70 | 146 | -65,88 | ||||
| 2025-07-22 | 13F | Simplicity Wealth,LLC | 56.264 | 84,65 | 1.659 | 102,32 | ||||
| 2025-07-08 | 13F | Dover Advisors, Llc | 9.729 | 2,64 | 287 | 12,16 | ||||
| 2025-07-30 | 13F | Mills Wealth Advisors LLC | 354.680 | 9,54 | 10.459 | 19,92 | ||||
| 2025-08-04 | 13F | Capital Performance Advisors Llp | 19.313 | -4,66 | 570 | 4,40 | ||||
| 2025-08-12 | 13F | BlackRock, Inc. | 194 | 0,00 | 6 | 0,00 | ||||
| 2025-07-23 | 13F | Abel Hall, LLC | 104.878 | -3,12 | 3.093 | 6,04 | ||||
| 2025-05-15 | 13F | CAPROCK Group, Inc. | 23.575 | -1,25 | 635 | 5,48 | ||||
| 2025-07-28 | 13F | Strategent Financial, LLC | 43.268 | 14,89 | 1.276 | 25,74 | ||||
| 2025-07-29 | 13F | Angeles Wealth Management, Llc | 4.565 | -46,68 | 135 | -41,74 | ||||
| 2025-05-15 | 13F/A | Orion Portfolio Solutions, LLC | 18.783 | 59,87 | 506 | 70,95 | ||||
| 2025-05-16 | 13F | Coppell Advisory Solutions LLC | 0 | -100,00 | 0 | |||||
| 2025-08-14 | 13F | Citadel Advisors Llc | 283.031 | -34,03 | 8.347 | -27,79 | ||||
| 2025-08-27 | 13F/A | Brinker Capital Investments, LLC | 105.561 | 462,00 | 3.113 | 515,02 | ||||
| 2025-07-16 | 13F | Strategic Investment Solutions, Inc. /IL | 48.639 | 509,51 | 1.434 | 570,09 | ||||
| 2025-08-14 | 13F | Mml Investors Services, Llc | 85.143 | -14,69 | 3 | 0,00 | ||||
| 2025-07-16 | 13F | Signaturefd, Llc | 12.196 | 0,00 | 360 | 9,45 | ||||
| 2025-07-24 | 13F | Ronald Blue Trust, Inc. | 97.295 | 13,28 | 2.869 | 24,04 | ||||
| 2025-08-07 | 13F | Efficient Advisors, LLC | 559.512 | -0,57 | 16.500 | 8,83 | ||||
| 2025-08-13 | 13F | Northern Trust Corp | 16.998 | 0,00 | 501 | 9,63 | ||||
| 2025-08-01 | 13F | Heritage Wealth Management, Inc./Texas | 0 | -100,00 | 0 | |||||
| 2025-08-07 | 13F | Resources Investment Advisors, LLC. | 63.053 | 3,62 | 1.859 | 13,42 | ||||
| 2025-07-22 | 13F | Sutton Place Investors Llc | 36.049 | 13,00 | 1.063 | 23,75 | ||||
| 2025-07-09 | 13F | High Probability Advisors, LLC | 1.144.646 | -6,89 | 33.756 | 1,92 | ||||
| 2025-08-07 | 13F | Sollinda Capital Management LLC | 25.036 | 20,01 | 738 | 31,55 | ||||
| 2025-07-29 | 13F | Unison Advisors LLC | 10.448 | 0,91 | 308 | 10,79 | ||||
| 2025-08-08 | 13F | Pinney & Scofield, Inc. | 82.337 | 8,23 | 2.428 | 18,50 | ||||
| 2025-07-22 | 13F | Clarius Group, LLC | 2.888.479 | 0,79 | 85.181 | 10,34 | ||||
| 2025-07-22 | 13F | Iron Horse Wealth Management, LLC | 32 | 0,00 | 1 | |||||
| 2025-08-14 | 13F | Smartleaf Asset Management LLC | 166 | 5 | ||||||
| 2025-08-14 | 13F | DecisionPoint Financial, LLC | 1.036 | 1,07 | 31 | 11,11 | ||||
| 2025-07-23 | 13F | Austin Asset Management Co Inc | 80.809 | 9,53 | 2.383 | 19,93 | ||||
| 2025-08-05 | 13F | Bank Of Montreal /can/ | 2.352.865 | 4,54 | 69.386 | 14,44 | ||||
| 2025-08-11 | 13F | von Borstel & Associates, Inc. | 462.206 | 0,04 | 13 | 8,33 | ||||
| 2025-07-14 | 13F | Friday Financial | 60.606 | -16,83 | 1.787 | -9,29 | ||||
| 2025-07-30 | 13F | Exencial Wealth Advisors, Llc | 410.683 | 18,60 | 12.111 | 29,83 | ||||
| 2025-07-07 | 13F | Kings Path Partners LLC | 130 | -24,86 | 4 | -25,00 | ||||
| 2025-08-08 | 13F | RAM Investment Partners, LLC | 9.300 | 274 | ||||||
| 2025-08-14 | 13F | GWM Advisors LLC | 318.748 | -3,73 | 9.400 | 5,38 | ||||
| 2025-07-28 | 13F | Wealthspan Partners, Llc | 35.685 | 16,56 | 1.052 | 27,67 | ||||
| 2025-08-13 | 13F | Virtue Capital Management, LLC | 0 | -100,00 | 0 | |||||
| 2025-07-16 | 13F | Tru Independence Asset Management 2, Llc | 30.580 | -5,14 | 902 | 3,80 | ||||
| 2025-08-04 | 13F | Spire Wealth Management | 5.930 | 0,00 | 175 | 9,43 | ||||
| 2025-08-05 | 13F | Hutchens & Kramer Investment Management Group, LLC | 0 | -100,00 | 0 | |||||
| 2025-07-18 | 13F | PBMares Wealth Management LLC | 296.255 | 4,40 | 8.737 | 14,29 | ||||
| 2025-07-28 | 13F | Axxcess Wealth Management, Llc | 24.378 | -0,83 | 719 | 8,46 | ||||
| 2025-07-31 | 13F | Buckingham Strategic Partners | 2.224.139 | 9,30 | 65.590 | 19,64 | ||||
| 2025-07-17 | 13F | SC&H Financial Advisors, Inc. | 59.296 | 0,19 | 1.749 | 9,66 | ||||
| 2025-07-23 | 13F | First Financial Group Corp | 8.612 | 254 | ||||||
| 2025-08-06 | 13F | Vestmark Advisory Solutions, Inc. | 855.214 | 112,11 | 25.220 | 132,19 | ||||
| 2025-08-15 | 13F | Morgan Stanley | 29.065 | -7,93 | 857 | 0,82 | ||||
| 2025-07-30 | 13F | Phillips Financial Management, Llc | 1.216 | 0,00 | 36 | 9,38 | ||||
| 2025-07-15 | 13F | Vestment Financial LLC | 119.328 | 7,27 | 3.525 | 17,11 | ||||
| 2025-08-13 | 13F | Satovsky Asset Management Llc | 1.697.956 | 0,87 | 50.073 | 10,42 | ||||
| 2025-08-14 | 13F | Aprio Wealth Management, LLC | 2.180.301 | 2,14 | 64.297 | 11,81 | ||||
| 2025-08-13 | 13F | EverSource Wealth Advisors, LLC | 161.725 | 56,07 | 4.769 | 70,87 | ||||
| 2025-07-23 | 13F | HMV Wealth Advisors, LLC | 96.595 | -4,74 | 2.849 | 4,28 | ||||
| 2025-07-16 | 13F | Blue Oak Capital, LLC | 138.645 | -23,52 | 4.089 | -16,28 | ||||
| 2025-07-17 | 13F | CogentBlue Wealth Advisors, LLC | 217.593 | -0,59 | 6.417 | 8,82 | ||||
| 2025-07-17 | 13F | Mattern Wealth Management LLC | 9.218 | -5,15 | 272 | 3,83 | ||||
| 2025-04-28 | 13F | Milestone Investment Advisors LLC | 0 | -100,00 | 0 | |||||
| 2025-08-18 | 13F | Geneos Wealth Management Inc. | 3.291 | -1,17 | 97 | 8,99 | ||||
| 2025-07-10 | 13F | Wealth Enhancement Advisory Services, Llc | 9.702 | -8,04 | 287 | 0,70 | ||||
| 2025-08-11 | 13F | Cascade Wealth Advisors, Inc | 20.948 | 616 | ||||||
| 2025-07-14 | 13F | Brady Martz Wealth Solutions, LLC | 257.652 | 67,32 | 7.598 | 83,17 | ||||
| 2025-07-18 | 13F | Benchmark Wealth Management, LLC | 20.652 | 45,05 | 609 | 59,01 | ||||
| 2025-08-14 | 13F | Warren Averett Asset Management, LLC | 309.918 | -1,30 | 9.139 | 8,04 | ||||
| 2025-07-15 | 13F | Garrett Investment Advisors LLC | 12.078 | -7,14 | 356 | 1,71 | ||||
| 2025-08-14 | 13F | Citadel Advisors Llc | Put | 0 | -100,00 | 0 | ||||
| 2025-04-15 | 13F | Corrigan Financial, Inc. | 585.894 | 15.784 | ||||||
| 2025-07-03 | 13F | Fiduciary Financial Group, Llc | 241.724 | 5,89 | 7.126 | 22,10 | ||||
| 2025-08-14 | 13F | UBS Group AG | 22.951 | -66,49 | 677 | -63,36 | ||||
| 2025-08-13 | 13F | Flow Traders U.s. Llc | 110.156 | 3 | ||||||
| 2025-08-04 | 13F | Hutchinson Capital Management/ca | 86.952 | 7,85 | 2.564 | 18,05 | ||||
| 2025-07-03 | 13F | CPA Asset Management LLC | 302.448 | -1,61 | 8.919 | 7,70 | ||||
| 2025-08-13 | 13F | M Holdings Securities, Inc. | 42.019 | 1 | ||||||
| 2025-08-07 | 13F | Kestra Private Wealth Services, Llc | 23.514 | 693 | ||||||
| 2025-07-28 | 13F | Delap Wealth Advisory, Llc | 11.020 | -63,69 | 325 | -60,34 | ||||
| 2025-07-09 | 13F | GEM Asset Management, LLC | 11.168 | -0,97 | 327 | 7,24 | ||||
| 2025-08-06 | 13F | Savant Capital, LLC | 23.936.337 | 14,20 | 705.883 | 25,01 | ||||
| 2025-08-14 | 13F | Cardiff Park Advisors, Llc | 21.135 | 0,13 | 623 | 9,68 | ||||
| 2025-07-25 | 13F | Index Fund Advisors, Inc. | 13.957 | 8,16 | 412 | 18,44 | ||||
| 2025-07-22 | 13F | Noble Family Wealth, LLC | 8.181 | 241 | ||||||
| 2025-08-04 | 13F | Hantz Financial Services, Inc. | 595 | 0 | ||||||
| 2025-08-01 | 13F | Brookwood Investment Group LLC | 8.600 | 254 | ||||||
| 2025-08-14 | 13F | Fmr Llc | 8.275 | -7,66 | 244 | 1,24 | ||||
| 2025-07-23 | 13F | Tcfg Wealth Management, Llc | 11.042 | 4,28 | 326 | 14,04 | ||||
| 2025-08-13 | 13F | Townsquare Capital Llc | 23.882 | -69,85 | 704 | -67,01 | ||||
| 2025-08-14 | 13F/A | Skopos Labs, Inc. | 1.103 | 33 | ||||||
| 2025-07-24 | 13F | Wealth Advisors Northwest LLC | 160.009 | 0,12 | 4.719 | 9,59 | ||||
| 2025-05-02 | 13F | MB Generational Wealth, LLC | 204.511 | 0,88 | 5.510 | 7,72 | ||||
| 2025-07-30 | 13F | Eqis Capital Management, Inc. | 119.800 | -6,44 | 3.533 | 2,41 | ||||
| 2025-07-10 | 13F | Fortress Wealth Management, Inc. | 364.486 | 2,43 | 10.749 | 12,13 | ||||
| 2025-07-21 | 13F | Triad Wealth Partners, LLC | 7.675 | 226 | ||||||
| 2025-08-14 | 13F | Integrated Wealth Concepts LLC | 59.581 | 4,60 | 1.757 | 14,54 | ||||
| 2025-05-13 | 13F | Quadrature Capital Ltd | 0 | -100,00 | 0 | |||||
| 2025-08-12 | 13F | Steward Partners Investment Advisory, Llc | 10.695 | 32,99 | 315 | 45,83 | ||||
| 2025-07-22 | 13F | Team Financial Group, LLC | 330 | 10 | ||||||
| 2025-07-30 | 13F | Jackson Thornton Asset Management, Llc | 67.582 | 3,40 | 1.990 | 13,01 | ||||
| 2025-08-01 | 13F | Austin Private Wealth, LLC | 29.664 | 31,41 | 875 | 43,75 | ||||
| 2025-08-13 | 13F | Daner Wealth Management, LLC | 20.672 | -6,91 | 613 | 3,73 | ||||
| 2025-08-13 | 13F | Parkworth Wealth Management, Inc. | 1.849 | 55 | ||||||
| 2025-08-13 | 13F | Congress Wealth Management LLC / DE / | 19.046 | 6,04 | 562 | 15,43 | ||||
| 2025-08-08 | 13F | Pnc Financial Services Group, Inc. | 4.537 | 0,00 | 134 | 9,02 | ||||
| 2025-07-11 | 13F | Quad-Cities Investment Group, LLC | 7.218 | 213 | ||||||
| 2025-08-04 | 13F | Waterfront Wealth Inc. | 141.280 | 8,79 | 4.166 | 19,10 | ||||
| 2025-07-21 | 13F | Yeomans Consulting Group, Inc. | 110.951 | 4,50 | 3.271 | 14,34 | ||||
| 2025-08-08 | 13F | Tortoise Investment Management, LLC | 97.370 | 3,48 | 2.871 | 13,25 | ||||
| 2025-08-13 | 13F | Brown Advisory Inc | 7.265 | 214 | ||||||
| 2025-07-31 | 13F | Glass Jacobson Investment Advisors llc | 54.252 | -14,68 | 1.600 | -0,31 | ||||
| 2025-07-22 | 13F | Beacon Financial Advisory LLC | 8.687 | 256 | ||||||
| 2025-04-25 | 13F | Ameritas Advisory Services, LLC | 0 | -100,00 | 0 | |||||
| 2025-07-31 | 13F | CNB Bank | 1.854 | 0,00 | 55 | 10,20 | ||||
| 2025-08-08 | 13F | Emerald Investment Partners, Llc | 1.087 | 1,12 | 32 | 14,29 | ||||
| 2025-07-15 | 13F | Evanson Asset Management, LLC | 95.327 | 15,66 | 2.811 | 26,62 | ||||
| 2025-08-07 | 13F | PFG Advisors | 86.550 | 7,44 | 2.552 | 17,60 | ||||
| 2025-08-13 | 13F | Rsm Us Wealth Management Llc | 13.708 | 404 | ||||||
| 2025-08-14 | 13F | Betterment LLC | 47.597 | 23,61 | 1 | 0,00 | ||||
| 2025-07-11 | 13F | Kaufman Rossin Wealth, LLC | 190.974 | 12,38 | 5.632 | 23,00 | ||||
| 2025-07-09 | 13F | Dynamic Advisor Solutions LLC | 271.247 | 0,48 | 7.999 | 10,00 | ||||
| 2025-07-25 | 13F | Astoria Portfolio Advisors LLC. | 9.960 | 0,00 | 297 | 9,59 | ||||
| 2025-08-07 | 13F | Timonier Family Office, LTD. | 265.197 | 12,41 | 7.821 | 23,05 | ||||
| 2025-07-15 | 13F | Fortitude Family Office, LLC | 510 | 15 | ||||||
| 2025-07-16 | 13F | Meredith Wealth Planning | 435.299 | 2,55 | 12.837 | 12,25 | ||||
| 2025-07-17 | 13F | DiNuzzo Private Wealth, Inc. | 666.785 | -0,23 | 19.663 | 9,21 | ||||
| 2025-07-29 | 13F | Grunden Financial Advisory, Inc. | 376.040 | 0,39 | 11.089 | 9,89 | ||||
| 2025-08-12 | 13F | SRS Capital Advisors, Inc. | 1.926 | 18,74 | 57 | 30,23 | ||||
| 2025-07-17 | 13F | Poinciana Advisors Group, Llc | 12.745 | 376 | ||||||
| 2025-07-23 | 13F | Mraz, Amerine & Associates, Inc. | 44.386 | -0,29 | 1.309 | 8,37 | ||||
| 2025-08-12 | 13F | Quadcap Wealth Management, LLC | 315.333 | 12,53 | 9.299 | 23,18 | ||||
| 2025-08-07 | 13F | Parkside Financial Bank & Trust | 4.136 | 0,00 | 122 | 9,01 | ||||
| 2025-07-30 | 13F | Forum Financial Management, LP | 5.996.961 | -0,22 | 176.850 | 9,22 | ||||
| 2025-08-06 | 13F | True Wealth Design, LLC | 451.729 | -4,67 | 13.321 | 4,36 | ||||
| 2025-07-29 | 13F | BKD Wealth Advisors, LLC | 476.162 | -8,57 | 14.042 | 0,09 | ||||
| 2025-07-28 | 13F | RFG Advisory, LLC | 527.283 | -1,88 | 15.550 | 7,40 | ||||
| 2025-08-12 | 13F | Martin Worley Group | 149.782 | 14,16 | 4.417 | 24,99 | ||||
| 2025-07-29 | 13F | Master's Wealth Management Inc. | 151.974 | 1,50 | 4.482 | 11,11 | ||||
| 2025-07-31 | 13F | Curio Wealth, Llc | 10.038 | 50.090,00 | 296 | -5,13 | ||||
| 2025-07-30 | 13F | EnRich Financial Partners LLC | 7.124 | -10,74 | 210 | -2,33 | ||||
| 2025-07-18 | 13F | Meritas Wealth Management, LLC | 170.625 | 5,87 | 5.032 | 15,89 | ||||
| 2025-08-12 | 13F | O'shaughnessy Asset Management, Llc | 4.227 | 1.507,22 | 125 | 1.671,43 | ||||
| 2025-07-17 | 13F | Global Trust Asset Management, LLC | 31.390 | -27,14 | 926 | -20,26 | ||||
| 2025-08-08 | 13F | Capital Investment Advisory Services, LLC | 13.643 | 20,91 | 402 | 32,67 | ||||
| 2025-05-15 | 13F | Hrt Financial Lp | 0 | -100,00 | 0 | |||||
| 2025-07-18 | 13F | Financial Consulate, Inc | 832.618 | 24.554 | ||||||
| 2025-07-21 | 13F | Keb Asset Management, Llc | 25.788 | 16,29 | 760 | 27,30 | ||||
| 2025-07-18 | 13F | Bridge Generations Wealth Management Llc | 214.950 | -0,16 | 6.339 | 9,29 | ||||
| 2025-08-12 | 13F | Proequities, Inc. | 0 | 0 | ||||||
| 2025-07-09 | 13F | Breakwater Capital Group | 46.835 | -4,87 | 1.381 | 4,15 | ||||
| 2025-07-24 | 13F | IFP Advisors, Inc | 182 | -25,10 | 5 | -16,67 | ||||
| 2025-08-01 | 13F | Liberty Wealth Management Llc | 258.409 | -5,06 | 7.620 | 3,93 | ||||
| 2025-08-14 | 13F | Mercer Global Advisors Inc /adv | 25.780.617 | 5,86 | 760.270 | 15,88 | ||||
| 2025-08-05 | 13F | American Capital Advisory, LLC | 1.274 | 0,00 | 38 | 8,82 | ||||
| 2025-08-14 | 13F | Premier Financial Group | 662.876 | 19.648 | ||||||
| 2025-04-09 | 13F | Archer Investment Management, LLC | 0 | -100,00 | 0 | |||||
| 2025-04-15 | 13F | Fifth Third Bancorp | 0 | -100,00 | 0 | -100,00 | ||||
| 2025-07-24 | 13F | Edge Financial Advisors LLC | 70.209 | 33,98 | 2.070 | 46,70 | ||||
| 2025-07-24 | 13F | Riverchase Wealth Management, Llc | 27.396 | -3,42 | 808 | 5,63 | ||||
| 2025-07-10 | 13F | Stewardship Advisors, LLC | 7.727 | -0,14 | 228 | 9,13 | ||||
| 2025-07-17 | 13F | Dopkins Wealth Management, Llc | 66.953 | 39,45 | 1.974 | 52,67 | ||||
| 2025-08-05 | 13F | Everest Management Corp. | 22.730 | 670 | ||||||
| 2025-07-29 | 13F | Disciplined Investments, LLC | 112.834 | 29,23 | 3.327 | 41,45 | ||||
| 2025-07-14 | 13F | BetterWealth, LLC | 172.663 | -2,35 | 5.092 | 6,89 | ||||
| 2025-07-31 | 13F | Cambridge Investment Research Advisors, Inc. | 44.444 | -3,42 | 1 | 0,00 | ||||
| 2025-04-16 | 13F | Lam Group, Inc. | 0 | -100,00 | 0 | -100,00 | ||||
| 2025-07-07 | 13F | Versant Capital Management, Inc | 3.546 | 0,00 | 105 | 9,47 | ||||
| 2025-08-08 | 13F | Altiora Financial Group, LLC | 58.979 | 10,01 | 1.739 | 20,43 | ||||
| 2025-07-31 | 13F | Planning Center, Inc. | 1.951.156 | -0,76 | 57.540 | 8,64 | ||||
| 2025-07-23 | 13F | Elevate Wealth Advisory, Inc | 7.286 | 30,18 | 215 | 42,67 | ||||
| 2025-08-11 | 13F | Wealthspire Advisors, LLC | 332.754 | -11,36 | 9.813 | -2,97 | ||||
| 2025-08-08 | 13F | Creative Planning | 22.643 | -3,68 | 668 | 5,37 | ||||
| 2025-07-09 | 13F | Reyes Financial Architecture, Inc. | 3.053 | 0,00 | 90 | 9,76 | ||||
| 2025-07-24 | 13F | Vantage Point Financial LLC | 8.154 | 240 | ||||||
| 2025-08-14 | 13F | Investmark Advisory Group LLC | 27.133 | -11,91 | 800 | -3,50 | ||||
| 2025-09-04 | 13F/A | Advisor Group Holdings, Inc. | 115.802 | -29,02 | 3.415 | -22,34 |