Grundlæggende statistik
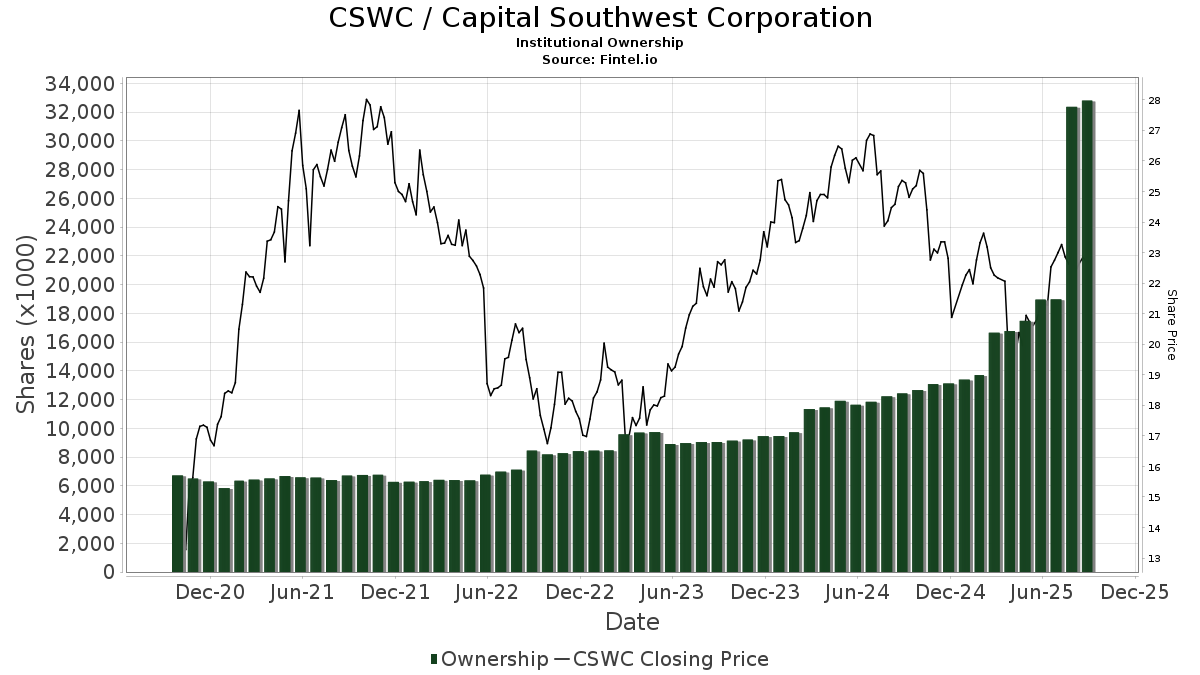
| Institutionelle aktier (lange) | 32.770.410 - 58,91% (ex 13D/G) - change of 13,82MM shares 72,91% MRQ |
| Institutionel værdi (lang) | $ 437.686 USD ($1000) |
Institutionelt ejerskab og aktionærer
Capital Southwest Corporation (US:CSWC) har 192 institutionelle ejere og aktionærer, der har indsendt 13D/G- eller 13F-formularer til Securities Exchange Commission (SEC). Disse institutioner har i alt 32,772,785 aktier. Største aktionærer omfatter Kingstone Capital Partners Texas, LLC, Sanders Morris Harris Llc, Van Eck Associates Corp, BIZD - VanEck Vectors BDC Income ETF, Two Sigma Advisers, Lp, UBS Group AG, Two Sigma Investments, Lp, Sound Income Strategies, LLC, Balyasny Asset Management Llc, and Millennium Management Llc .
Capital Southwest Corporation (NasdaqGS:CSWC) institutionel ejerskabsstruktur viser aktuelle positioner i virksomheden efter institutioner og fonde, samt seneste ændringer i positionsstørrelse. Større aktionærer kan omfatte individuelle investorer, investeringsforeninger, hedgefonde eller institutioner. Skema 13D angiver, at investoren besidder (eller besidder) mere end 5 % af virksomheden og har til hensigt (eller har til hensigt at) aktivt at forfølge en ændring i forretningsstrategi. Skema 13G indikerer en passiv investering på over 5%.
The share price as of September 9, 2025 is 22,91 / share. Previously, on September 10, 2024, the share price was 25,06 / share. This represents a decline of 8,58% over that period.
Fondens stemningsscore
Fund Sentiment Score (fka Ownership Accumulation Score) finder de aktier, der bliver mest købt af fonde. Det er resultatet af en sofistikeret, multi-faktor kvantitativ model, der identificerer virksomheder med de højeste niveauer af institutionel akkumulering. Scoringsmodellen bruger en kombination af den samlede stigning i oplyste ejere, ændringerne i porteføljeallokeringer i disse ejere og andre målinger. Tallet går fra 0 til 100, hvor højere tal indikerer et højere niveau af akkumulering for sine jævnaldrende, og 50 er gennemsnittet.
Opdateringsfrekvens: Dagligt
Se Ownership Explorer, som giver en liste over højest rangerende virksomheder.
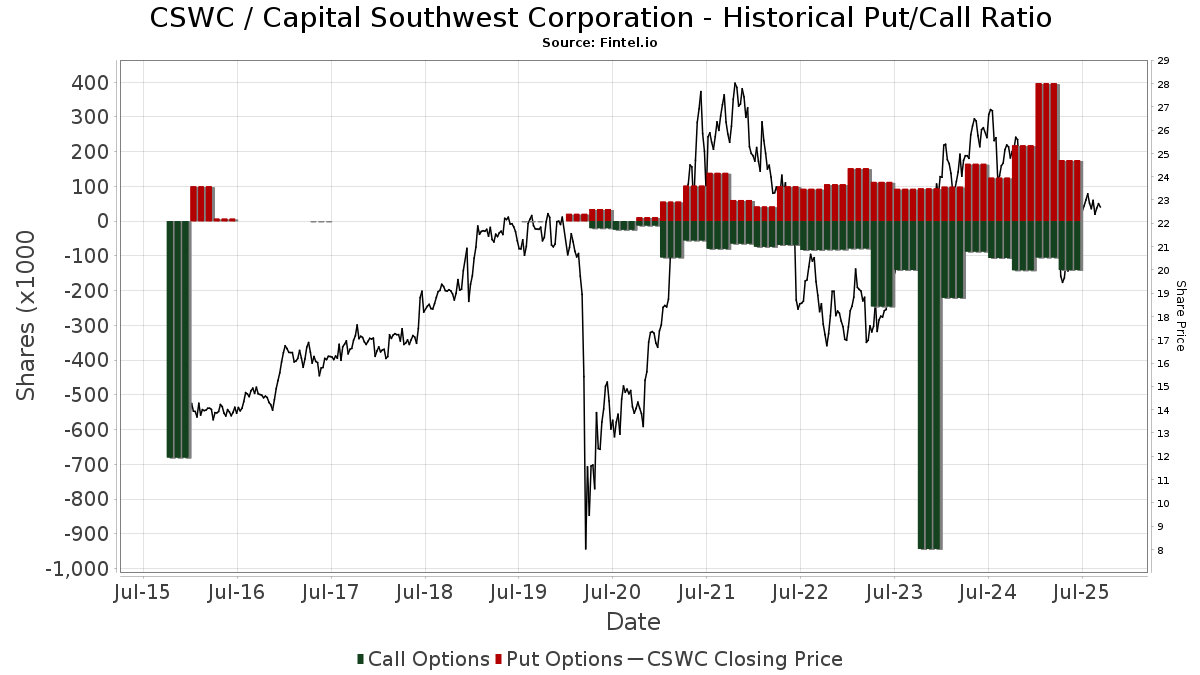
Institutionel Put/Call-forhold
Ud over at indberette standardaktie- og gældsudstedelser skal institutter med mere end 100 mill. aktiver under forvaltning også oplyse deres put- og call-optionsbeholdninger. Da salgsoptioner generelt indikerer negativ stemning, og købsoptioner indikerer positiv stemning, kan vi få en fornemmelse af den overordnede institutionelle stemning ved at plotte forholdet mellem put og kald. Diagrammet til højre viser det historiske put/call-forhold for dette instrument.
Brug af Put/Call Ratio som en indikator for investorernes stemning overvinder en af de vigtigste mangler ved at bruge totalt institutionelt ejerskab, som er, at en betydelig mængde af aktiver under forvaltning investeres passivt for at spore indekser. Passivt forvaltede fonde køber typisk ikke optioner, så indikatoren for put/call-forholdet følger mere nøje følelsen af aktivt forvaltede fonde.
13F og NPORT arkivering
Detaljer om 13F-arkivering er gratis. Detaljer om NP-ansøgninger kræver et premium-medlemskab. Grønne rækker angiver nye positioner. Røde rækker angiver lukkede positioner. Klik på linket ikon for at se den fulde transaktionshistorik.
Opgrader
for at låse premium-data op og eksportere til Excel ![]() .
.
| Fil dato | Kilde | Investor | Type | Gennemsnitlig pris (Øst) |
Aktier | Δ Aktier (%) |
Rapporteret Værdi ($1000) |
Δ Værdi (%) |
Port Alloc (%) |
|
|---|---|---|---|---|---|---|---|---|---|---|
| 2025-08-27 | NP | JNL SERIES TRUST - JNL Multi-Manager Alternative Fund (A) | Short | -1.763 | -19,20 | -39 | -20,83 | |||
| 2025-08-18 | 13F | Wolverine Trading, Llc | Put | 0 | -100,00 | 0 | ||||
| 2025-08-14 | 13F | Tudor Investment Corp Et Al | 35.219 | 776 | ||||||
| 2025-08-06 | 13F | Smh Capital Advisors Inc | 45.215 | -1,67 | 997 | -2,92 | ||||
| 2025-08-14 | 13F | FJ Capital Management LLC | 35.067 | -12,51 | 773 | -13,65 | ||||
| 2025-08-06 | 13F | Rialto Wealth Management, LLC | 4.809 | 0,00 | 106 | -1,87 | ||||
| 2025-08-14 | 13F | Voloridge Investment Management, Llc | 80.641 | 22,70 | 1.777 | 21,21 | ||||
| 2025-08-12 | 13F | Advisors Asset Management, Inc. | 112.511 | -24,27 | 2.480 | -25,22 | ||||
| 2025-08-14 | 13F | Brevan Howard Capital Management LP | 54.503 | 1.201 | ||||||
| 2025-08-19 | 13F | National Asset Management, Inc. | 92.163 | 82,05 | 2.031 | 83,97 | ||||
| 2025-08-12 | 13F | Archer Investment Corp | 0 | -100,00 | 0 | |||||
| 2025-08-14 | 13F | UBS Group AG | 783.060 | 163,77 | 17.259 | 160,46 | ||||
| 2025-08-15 | 13F | Morgan Stanley | 227.396 | 42,30 | 5.012 | 40,52 | ||||
| 2025-07-14 | 13F | Ridgewood Investments LLC | 500 | 0,00 | 11 | 0,00 | ||||
| 2025-08-18 | 13F | Wolverine Trading, Llc | 0 | -100,00 | 0 | |||||
| 2025-07-24 | 13F | Grace & White Inc /ny | 174.597 | -1,13 | 3.848 | -2,36 | ||||
| 2025-08-04 | 13F | Muzinich & Co., Inc. | 225.790 | 64,37 | 4.976 | 62,30 | ||||
| 2025-08-07 | 13F | Samalin Investment Counsel, LLC | 25.864 | 7,97 | 570 | 6,74 | ||||
| 2025-08-14 | 13F | Verition Fund Management LLC | 31.500 | -6,73 | 694 | -7,84 | ||||
| 2025-06-18 | NP | Putnam ETF Trust - Putnam BDC ETF - | 267.259 | 5,63 | 5.447 | -4,37 | ||||
| 2025-07-17 | 13F | Janney Montgomery Scott LLC | 0 | -100,00 | 0 | |||||
| 2025-07-30 | 13F | Denali Advisors Llc | 113.850 | -2,19 | 2.509 | -3,43 | ||||
| 2025-08-11 | 13F | Moerus Capital Management LLC | 73.983 | 0,00 | 1.631 | -1,27 | ||||
| 2025-08-11 | 13F | Citigroup Inc | 0 | -100,00 | 0 | |||||
| 2025-08-12 | 13F | Jpmorgan Chase & Co | 8.423 | -74,44 | 186 | -74,83 | ||||
| 2025-08-08 | 13F | Pnc Financial Services Group, Inc. | 1.566 | 0,00 | 35 | 0,00 | ||||
| 2025-07-30 | 13F | Sanders Morris Harris Llc | 1.390.339 | -2,98 | 30.643 | -4,20 | ||||
| 2025-08-14 | 13F | Sunbelt Securities, Inc. | 37.229 | -5,10 | 812 | -7,20 | ||||
| 2025-07-25 | 13F | Total Clarity Wealth Management, Inc. | 0 | -100,00 | 0 | |||||
| 2025-08-14 | 13F | Harwood Advisory Group, LLC | 0 | -100,00 | 0 | |||||
| 2025-07-18 | 13F | SOA Wealth Advisors, LLC. | 0 | -100,00 | 0 | |||||
| 2025-08-13 | 13F | Beacon Pointe Advisors, LLC | 226.212 | -45,42 | 4.986 | -46,11 | ||||
| 2025-08-15 | 13F | Prevail Innovative Wealth Advisors, Llc | 56.395 | 1.243 | ||||||
| 2025-08-12 | 13F | TCTC Holdings, LLC | 2.136 | 0,00 | 47 | 0,00 | ||||
| 2025-08-14 | 13F | Sovereign's Capital Management, LLC | 77.048 | 9,49 | 1.698 | 8,15 | ||||
| 2025-04-28 | 13F | Mainstream Capital Management LLC | 0 | -100,00 | 0 | |||||
| 2025-07-28 | 13F | Melia Wealth LLC | 464.973 | 10,10 | 10.248 | 8,73 | ||||
| 2025-08-14 | 13F | GWM Advisors LLC | 639 | -96,48 | 14 | -96,54 | ||||
| 2025-07-21 | 13F | Catalina Capital Group, LLC | 0 | -100,00 | 0 | |||||
| 2025-08-14 | 13F | Punch & Associates Investment Management, Inc. | 0 | -100,00 | 0 | |||||
| 2025-04-29 | 13F | Raleigh Capital Management Inc. | 0 | -100,00 | 0 | |||||
| 2025-07-28 | 13F | Naviter Wealth, LLC | 100.105 | 22,45 | 2.206 | 17,28 | ||||
| 2025-08-13 | 13F | PharVision Advisers, LLC | 11.249 | 248 | ||||||
| 2025-08-19 | 13F | Newbridge Financial Services Group, Inc. | 3.176 | 70 | ||||||
| 2025-07-31 | 13F | Caitong International Asset Management Co., Ltd | 19 | 0 | ||||||
| 2025-07-25 | 13F | Atria Wealth Solutions, Inc. | 9.738 | 215 | ||||||
| 2025-08-08 | 13F | Creative Planning | 9.114 | 201 | ||||||
| 2025-08-14 | 13F | Goldman Sachs Group Inc | 212.781 | -17,42 | 4.690 | -18,47 | ||||
| 2025-08-13 | 13F | Virtus Investment Advisers, Inc. | 41.064 | -7,02 | 905 | -8,12 | ||||
| 2025-08-15 | 13F | Tower Research Capital LLC (TRC) | 1.877 | 13.307,14 | 41 | |||||
| 2025-07-21 | 13F | Monticello Wealth Management, Llc | 18.272 | 0,00 | 403 | -1,23 | ||||
| 2025-05-12 | 13F | Fmr Llc | 0 | -100,00 | 0 | |||||
| 2025-08-13 | 13F | Quantbot Technologies LP | 75.546 | 22,73 | 1.665 | 21,27 | ||||
| 2025-08-14 | 13F | Cubist Systematic Strategies, LLC | 107.201 | 98,47 | 2.363 | 96,02 | ||||
| 2025-08-13 | 13F | Jump Financial, LLC | 40.579 | 894 | ||||||
| 2025-08-05 | 13F | Simplex Trading, Llc | Call | 11.000 | 83,33 | 0 | ||||
| 2025-07-31 | 13F | Nisa Investment Advisors, Llc | 3.500 | 600,00 | 77 | 600,00 | ||||
| 2025-07-24 | 13F | IFP Advisors, Inc | 475 | 10 | ||||||
| 2025-08-14 | 13F | Royal Bank Of Canada | 149.055 | 115,59 | 3.285 | 112,76 | ||||
| 2025-08-05 | 13F | Simplex Trading, Llc | Put | 8.500 | -42,95 | 0 | ||||
| 2025-08-05 | 13F | Simplex Trading, Llc | 14.793 | 24,33 | 0 | |||||
| 2025-07-24 | NP | FNCMX - Fidelity Nasdaq Composite Index Fund This fund is a listed as child fund of Fmr Llc and if that institution has disclosed ownership in this security, then these positions will not be double counted when calculating total shares and total value | 11.251 | 0,00 | 234 | -10,69 | ||||
| 2025-05-15 | 13F | Wolverine Trading, Llc | Call | 0 | -100,00 | 0 | -100,00 | |||
| 2025-08-14 | 13F | Nebula Research & Development LLC | 25.907 | 571 | ||||||
| 2025-07-11 | 13F | Caldwell Securities, Inc | 41.052 | -1,62 | 905 | -2,90 | ||||
| 2025-08-08 | 13F | Geode Capital Management, Llc | 11.251 | 0,00 | 248 | -1,59 | ||||
| 2025-08-14 | 13F | Benjamin Edwards Inc | 87.765 | 3,52 | 1.934 | 2,22 | ||||
| 2025-08-13 | 13F | EverSource Wealth Advisors, LLC | 2.787 | 18,14 | 61 | 17,31 | ||||
| 2025-08-14 | 13F | Engineers Gate Manager LP | 41.379 | 111,26 | 912 | 108,47 | ||||
| 2025-05-14 | 13F | Brown Brothers Harriman & Co | 0 | -100,00 | 0 | |||||
| 2025-08-12 | 13F | Franklin Resources Inc | 290.762 | -2,63 | 6.408 | -3,86 | ||||
| 2025-04-28 | 13F | Redmont Wealth Advisors Llc | 53.623 | -19,89 | 1.197 | -18,08 | ||||
| 2025-08-25 | 13F/A | Promus Capital, LLC | 1.384 | 0,00 | 31 | 0,00 | ||||
| 2025-08-12 | 13F | Change Path, LLC | 98.874 | 7,45 | 2.179 | 6,14 | ||||
| 2025-07-25 | 13F | Cwm, Llc | 2.930 | 26,57 | 0 | |||||
| 2025-08-14 | 13F | Susquehanna International Group, Llp | 21.139 | -43,76 | 466 | -44,51 | ||||
| 2025-08-08 | 13F | Cetera Investment Advisers | 361.722 | 402,78 | 7.972 | 396,70 | ||||
| 2025-08-14 | 13F | Quantinno Capital Management LP | 10.893 | 240 | ||||||
| 2025-07-14 | 13F | AdvisorNet Financial, Inc | 300 | -50,66 | 7 | -53,85 | ||||
| 2025-08-14 | 13F | Susquehanna International Group, Llp | Call | 87.800 | 55,95 | 1.935 | 54,06 | |||
| 2025-07-23 | 13F | Columbus Macro, LLC | 290.704 | 6.407 | ||||||
| 2025-08-14 | 13F | Susquehanna International Group, Llp | Put | 63.100 | 50,96 | 1.391 | 49,14 | |||
| 2025-08-07 | 13F | Hodges Capital Management Inc. | 106.045 | 15,57 | 2.337 | 14,11 | ||||
| 2025-08-14 | 13F | Mariner, LLC | 28.314 | 43,75 | 624 | 42,14 | ||||
| 2025-07-21 | 13F | Ameriflex Group, Inc. | 0 | -100,00 | 0 | |||||
| 2025-07-15 | 13F | North Star Investment Management Corp. | 1.025 | 94,13 | 23 | 100,00 | ||||
| 2025-07-23 | 13F | Nbt Bank N A /ny | 30 | 0,00 | 1 | |||||
| 2025-07-28 | NP | PEX - ProShares Global Listed Private Equity ETF | 10.594 | 7,46 | 221 | -3,93 | ||||
| 2025-08-07 | 13F | Allworth Financial LP | 4.600 | 101 | ||||||
| 2025-08-14 | 13F | Raymond James Financial Inc | 286.597 | -4,66 | 6.317 | -5,86 | ||||
| 2025-08-14 | 13F | Jane Street Group, Llc | Call | 26.600 | 586 | |||||
| 2025-07-23 | 13F | Tectonic Advisors Llc | 521.686 | 18,44 | 11.498 | 16,95 | ||||
| 2025-08-14 | 13F | Jane Street Group, Llc | 20.497 | 102,28 | 452 | 99,56 | ||||
| 2025-07-24 | 13F | Ronald Blue Trust, Inc. | 3.148 | 6,24 | 69 | 4,55 | ||||
| 2025-08-14 | 13F | State Street Corp | 49.224 | 243,38 | 1.085 | 239,81 | ||||
| 2025-09-04 | 13F/A | Advisor Group Holdings, Inc. | 25.645 | -2,32 | 565 | -3,58 | ||||
| 2025-07-25 | NP | First Trust Specialty Finance & Financial Opportunities Fund This fund is a listed as child fund of First Trust Advisors Lp and if that institution has disclosed ownership in this security, then these positions will not be double counted when calculating total shares and total value | 71.000 | 0,00 | 1.478 | -10,59 | ||||
| 2025-07-11 | 13F | Farther Finance Advisors, LLC | 3.698 | 786,81 | 82 | 800,00 | ||||
| 2025-08-14 | 13F/A | Barclays Plc | 24.717 | -83,89 | 1 | -100,00 | ||||
| 2025-08-15 | 13F | Caxton Associates Llp | 14.257 | 0,00 | 314 | -1,26 | ||||
| 2025-07-31 | 13F | Sumitomo Mitsui Trust Holdings, Inc. | 172.597 | 28,63 | 3.804 | 27,05 | ||||
| 2025-08-11 | 13F | Nomura Asset Management Co Ltd | 2.135 | 58,50 | 47 | 56,67 | ||||
| 2025-08-14 | 13F | Point72 Hong Kong Ltd | 2.189 | 48 | ||||||
| 2025-03-28 | NP | ESCQX - Embark Small Cap Equity Fund Retirement Class | 398.887 | 0,00 | 8.979 | -6,92 | ||||
| 2025-07-17 | 13F | Sound Income Strategies, LLC | 702.201 | 13,99 | 15.477 | 12,56 | ||||
| 2025-08-14 | 13F | Wells Fargo & Company/mn | 12.200 | 54,82 | 269 | 53,14 | ||||
| 2025-07-22 | 13F | Grimes & Company, Inc. | 13.303 | -28,47 | 293 | -29,40 | ||||
| 2025-08-06 | 13F | First Horizon Advisors, Inc. | 2.628 | 1.214,00 | 58 | 1.325,00 | ||||
| 2025-08-11 | 13F | HHM Wealth Advisors, LLC | 500 | 0,00 | 11 | 0,00 | ||||
| 2025-08-14 | 13F | Vident Advisory, LLC | 19.087 | 6,06 | 421 | 4,74 | ||||
| 2025-08-13 | 13F | Townsquare Capital Llc | 0 | -100,00 | 0 | |||||
| 2025-08-14 | 13F | Point72 Asset Management, L.P. | 78.808 | 1.737 | ||||||
| 2025-08-12 | 13F | Argent Trust Co | 123.348 | 52,63 | 2.719 | 50,75 | ||||
| 2025-08-14 | 13F | Dearborn Partners Llc | 15.787 | -14,31 | 348 | -15,57 | ||||
| 2025-07-09 | 13F | Harbor Capital Advisors, Inc. | 0 | -100,00 | 0 | |||||
| 2025-07-31 | 13F | Cambridge Investment Research Advisors, Inc. | 28.528 | -12,17 | 1 | |||||
| 2025-05-13 | 13F | Quadrant Capital Group Llc | 0 | -100,00 | 0 | |||||
| 2025-08-12 | 13F | LPL Financial LLC | 205.640 | 4,03 | 4.532 | 2,72 | ||||
| 2025-08-12 | 13F | Aigen Investment Management, Lp | 11.822 | 261 | ||||||
| 2025-04-24 | 13F | Wingate Wealth Advisors, Inc. | 0 | -100,00 | 0 | |||||
| 2025-08-14 | 13F | Balyasny Asset Management Llc | 546.280 | -31,98 | 12.040 | -32,83 | ||||
| 2025-08-14 | 13F | Van Eck Associates Corp | 1.347.300 | 15,46 | 30 | 11,54 | ||||
| 2025-08-12 | 13F | Trexquant Investment LP | 46.630 | 1.028 | ||||||
| 2025-08-12 | 13F | Proequities, Inc. | Put | 0 | 0 | |||||
| 2025-08-12 | 13F | Proequities, Inc. | Call | 0 | 0 | |||||
| 2025-08-12 | 13F | Proequities, Inc. | 0 | 0 | ||||||
| 2025-07-31 | 13F | Oppenheimer & Co Inc | 0 | -100,00 | 0 | |||||
| 2025-08-12 | 13F | Legal & General Group Plc | 332.746 | 4,58 | 7.334 | 3,27 | ||||
| 2025-07-14 | 13F | U.S. Capital Wealth Advisors, LLC | 0 | -100,00 | 0 | |||||
| 2025-08-14 | 13F | Group One Trading, L.p. | 0 | -100,00 | 0 | -100,00 | ||||
| 2025-08-07 | 13F | Runnymede Capital Advisors, Inc. | 0 | -100,00 | 0 | |||||
| 2025-08-15 | 13F | Northeast Financial Consultants Inc | 0 | -100,00 | 0 | |||||
| 2025-07-18 | 13F | PFG Investments, LLC | 0 | -100,00 | 0 | |||||
| 2025-08-11 | 13F | Hexagon Capital Partners LLC | 0 | -100,00 | 0 | |||||
| 2025-07-22 | 13F | IMC-Chicago, LLC | Put | 10.100 | -15,83 | 223 | -16,85 | |||
| 2025-07-23 | 13F | Hager Investment Management Services, Llc | 500 | 0,00 | 11 | 0,00 | ||||
| 2025-08-14 | 13F | Quarry LP | 3.715 | 174,98 | 82 | 170,00 | ||||
| 2025-07-21 | 13F | DHJJ Financial Advisors, Ltd. | 5 | 0,00 | 0 | |||||
| 2025-08-14 | 13F | Bnp Paribas Arbitrage, Sa | 0 | -100,00 | 0 | |||||
| 2025-08-13 | 13F | Legacy Capital Wealth Partners, LLC | 59.024 | -2,02 | 1.301 | -3,27 | ||||
| 2025-08-11 | 13F | Core Wealth Partners LLC | 11.520 | 0,00 | 254 | -1,56 | ||||
| 2025-05-14 | 13F | Mml Investors Services, Llc | 0 | -100,00 | 0 | |||||
| 2025-07-24 | 13F | Us Bancorp \de\ | 13.756 | 0,00 | 303 | -1,30 | ||||
| 2025-07-21 | 13F | Mirae Asset Global Investments Co., Ltd. | 0 | -100,00 | 0 | |||||
| 2025-08-12 | 13F | AlphaCore Capital LLC | 0 | -100,00 | 0 | |||||
| 2025-05-15 | 13F | Oxford Asset Management Llp | 11.392 | 254 | ||||||
| 2025-08-13 | 13F | Guggenheim Capital Llc | 24.606 | 6,50 | 542 | 5,24 | ||||
| 2025-05-15 | 13F | Lido Advisors, LLC | 0 | -100,00 | 0 | -100,00 | ||||
| 2025-08-12 | 13F | MAI Capital Management | 3.524 | 32,53 | 78 | 30,51 | ||||
| 2025-08-05 | 13F | Dunhill Financial, LLC | 400 | 9 | ||||||
| 2025-08-14 | 13F | Colony Group, LLC | 9.272 | -1,80 | 204 | -2,86 | ||||
| 2025-08-13 | 13F/A | DLD Asset Management, LP | Put | 0 | -100,00 | 0 | ||||
| 2025-04-29 | 13F | Concurrent Investment Advisors, LLC | 0 | -100,00 | 0 | |||||
| 2025-07-11 | 13F | Kingstone Capital Partners Texas, LLC | 13.089.875 | 311 | ||||||
| 2025-08-14 | 13F | Schonfeld Strategic Advisors LLC | 66.243 | -43,64 | 1.460 | -44,38 | ||||
| 2025-08-15 | 13F | Kestra Advisory Services, LLC | 45.856 | -2,20 | 1.011 | -3,44 | ||||
| 2025-08-15 | 13F | CI Private Wealth, LLC | 0 | -100,00 | 0 | |||||
| 2025-06-25 | NP | VPC - Virtus Private Credit Strategy ETF | 40.343 | 1,45 | 822 | -8,16 | ||||
| 2025-08-05 | 13F | Huntington National Bank | 2 | 0,00 | 0 | |||||
| 2025-08-27 | 13F/A | Squarepoint Ops LLC | 11.613 | -1,76 | 256 | -3,04 | ||||
| 2025-08-14 | 13F | Point72 Asia (Singapore) Pte. Ltd. | 1.894 | 42 | ||||||
| 2025-08-14 | 13F | Evergreen Capital Management Llc | 0 | -100,00 | 0 | |||||
| 2025-08-14 | 13F | DRW Securities, LLC | 24.985 | 148,11 | 551 | 145,54 | ||||
| 2025-08-12 | 13F | BlackRock, Inc. | 320.720 | 22,49 | 7.069 | 20,94 | ||||
| 2025-08-12 | 13F | CIBC Private Wealth Group, LLC | 1.551 | -0,06 | 34 | 25,93 | ||||
| 2025-07-30 | 13F | Atlantic Edge Private Wealth Management, LLC | 200 | 0,00 | 4 | 0,00 | ||||
| 2025-08-13 | 13F | Invesco Ltd. | 34.003 | 21,84 | 749 | 20,42 | ||||
| 2025-06-30 | NP | PSP - Invesco Global Listed Private Equity ETF This fund is a listed as child fund of Invesco Ltd. and if that institution has disclosed ownership in this security, then these positions will not be double counted when calculating total shares and total value | 26.473 | -18,88 | 540 | -26,57 | ||||
| 2025-08-14 | 13F | Aquatic Capital Management LLC | 13.329 | -42,49 | 294 | -43,33 | ||||
| 2025-08-13 | 13F | Capital Analysts, Inc. | 2.685 | 2,64 | 0 | |||||
| 2025-08-14 | 13F | VPR Management LLC | 2.500 | 55 | ||||||
| 2025-07-23 | NP | FAAAX - Franklin K2 Alternative Strategies Fund Class A | Short | -612 | -37,30 | -13 | -45,45 | |||
| 2025-08-12 | 13F/A | Cozad Asset Management Inc | 49.161 | 4,26 | 1.084 | 2,95 | ||||
| 2025-06-27 | NP | LBO - WHITEWOLF Publicly Listed Private Equity ETF | 7.035 | 14,28 | 143 | 3,62 | ||||
| 2025-08-18 | 13F | Geneos Wealth Management Inc. | 1.930 | 0,00 | 43 | -2,33 | ||||
| 2025-08-13 | 13F | Northern Trust Corp | 45.690 | 286,16 | 1.007 | 281,44 | ||||
| 2025-08-15 | 13F | Zuckerman Investment Group, LLC | 460.375 | 7,81 | 10.147 | 6,45 | ||||
| 2025-08-14 | 13F | Hrt Financial Lp | 242.080 | 176,04 | 5 | 400,00 | ||||
| 2025-08-14 | 13F | Summit Trail Advisors, Llc | 10.630 | 234 | ||||||
| 2025-07-25 | 13F | Apollon Wealth Management, LLC | 23.797 | 10,69 | 524 | 9,39 | ||||
| 2025-08-14 | 13F | Qube Research & Technologies Ltd | 63.474 | -73,19 | 1.399 | -73,54 | ||||
| 2025-08-14 | 13F | Two Sigma Investments, Lp | 761.221 | -4,67 | 16.777 | -5,86 | ||||
| 2025-07-01 | 13F | Confluence Investment Management Llc | 102.107 | 0,58 | 2.250 | -0,66 | ||||
| 2025-07-23 | 13F | Mraz, Amerine & Associates, Inc. | 42.958 | -1,77 | 947 | -3,27 | ||||
| 2025-08-21 | NP | BIZD - VanEck Vectors BDC Income ETF | 1.241.902 | 11,47 | 27.372 | 10,07 | ||||
| 2025-05-05 | 13F | Lindbrook Capital, Llc | 0 | -100,00 | 0 | |||||
| 2025-08-14 | 13F | Millennium Management Llc | 526.734 | 7,72 | 11.609 | 6,37 | ||||
| 2025-08-18 | 13F | Hollencrest Capital Management | 7.055 | 2,62 | 155 | 1,31 | ||||
| 2025-08-11 | 13F | HighTower Advisors, LLC | 10.190 | 8,54 | 225 | 7,18 | ||||
| 2025-07-08 | 13F | Parallel Advisors, LLC | 4.185 | -4,93 | 92 | -6,12 | ||||
| 2025-08-07 | 13F | Campbell & CO Investment Adviser LLC | 20.873 | -2,29 | 460 | -3,36 | ||||
| 2025-05-14 | 13F | Comerica Bank | 0 | -100,00 | 0 | |||||
| 2025-05-07 | 13F | Spectrum Wealth Counsel, LLC | 230 | 0,00 | 5 | 0,00 | ||||
| 2025-08-14 | 13F | Two Sigma Advisers, Lp | 983.500 | -3,09 | 21.676 | -4,31 | ||||
| 2025-08-07 | 13F | First Dallas Securities Inc. | 77.102 | 7,20 | 1.699 | 5,86 | ||||
| 2025-05-16 | 13F | Jones Financial Companies Lllp | 0 | -100,00 | 0 | |||||
| 2025-07-18 | 13F | Generali Investments CEE, investicni spolecnost, a.s. | 12.628 | 0,00 | 278 | -1,07 | ||||
| 2025-08-28 | NP | TRIFX - Catalyst/SMH Total Return Income Fund Class A | 20.000 | 0,00 | 441 | -1,35 | ||||
| 2025-07-18 | 13F | Union Bancaire Privee, UBP SA | 14.349 | 5,08 | 45.130 | 14.745,07 | ||||
| 2025-07-22 | 13F | Autumn Glory Partners, LLC | 26.000 | 0,00 | 573 | -1,21 | ||||
| 2025-08-01 | 13F | Y-Intercept (Hong Kong) Ltd | 48.215 | 1.063 | ||||||
| 2025-08-12 | 13F | Global Retirement Partners, LLC | 12.695 | -50,37 | 280 | -50,00 | ||||
| 2025-08-14 | 13F | Bank Of America Corp /de/ | 28.036 | -54,51 | 618 | -55,13 | ||||
| 2025-08-05 | 13F | Bard Associates Inc | 17.256 | 0,00 | 380 | -1,30 | ||||
| 2025-08-13 | 13F | Lansforsakringar Fondforvaltning AB (publ) | 0 | -100,00 | 0 | |||||
| 2025-07-15 | 13F | Fortitude Family Office, LLC | 1.400 | 31 | ||||||
| 2025-08-06 | 13F | Commonwealth Equity Services, Llc | 79.788 | 2,90 | 2 | 0,00 | ||||
| 2025-08-14 | 13F | Group One Trading, L.p. | Put | 4.000 | -75,46 | 88 | -75,76 | |||
| 2025-07-03 | 13F | Garde Capital, Inc. | 2.401 | 0,00 | 53 | -1,89 | ||||
| 2025-07-09 | 13F | Epiq Partners, Llc | 266.800 | 4,46 | 5.880 | 3,16 | ||||
| 2025-07-09 | 13F | Lbmc Investment Advisors, Llc | 18.250 | 0,00 | 402 | -1,23 | ||||
| 2025-08-14 | 13F | Group One Trading, L.p. | Call | 15.300 | -19,47 | 337 | -20,52 | |||
| 2025-07-16 | 13F | Signaturefd, Llc | 2.483 | 51,96 | 55 | 50,00 | ||||
| 2025-08-13 | 13F | ExodusPoint Capital Management, LP | 24.975 | -36,13 | 1 | |||||
| 2025-07-25 | 13F | LRI Investments, LLC | 250 | 0,00 | 6 | 0,00 | ||||
| 2025-08-06 | 13F | Wedbush Securities Inc | 11.723 | 0 | ||||||
| 2025-07-31 | 13F | Washington Trust Advisors, Inc. | 5.000 | 0,00 | 110 | -0,90 | ||||
| 2025-08-14 | 13F | Sciencast Management LP | 0 | -100,00 | 0 | |||||
| 2025-08-14 | 13F | Citadel Advisors Llc | Put | 65.600 | -8,64 | 1.446 | -9,80 | |||
| 2025-07-22 | 13F | Gsa Capital Partners Llp | 17.874 | 0 | ||||||
| 2025-08-14 | 13F | Atom Investors LP | 19.751 | 435 | ||||||
| 2025-08-04 | 13F | Wolverine Asset Management Llc | Put | 25.600 | 564 | |||||
| 2025-08-13 | 13F | OMERS ADMINISTRATION Corp | 34.900 | 769 | ||||||
| 2025-08-14 | 13F | Citadel Advisors Llc | 409.241 | 22,74 | 9.020 | 21,21 | ||||
| 2025-07-28 | 13F | Mutual Advisors, LLC | 9.244 | -46,81 | 216 | -38,75 | ||||
| 2025-08-11 | 13F | Delta Asset Management Llc/tn | 70 | 0,00 | 2 | 0,00 | ||||
| 2025-07-14 | 13F | Toth Financial Advisory Corp | 600 | -10,45 | 13 | -7,14 | ||||
| 2025-08-13 | 13F | Marshall Wace, Llp | 147.162 | -40,84 | 3.243 | -41,59 | ||||
| 2025-08-15 | 13F | Great West Life Assurance Co /can/ | 51.018 | 5,74 | 1 | 0,00 | ||||
| 2025-08-01 | 13F | Envestnet Asset Management Inc | 335.718 | 639,74 | 7.399 | 631,13 | ||||
| 2025-08-08 | 13F | Larson Financial Group LLC | 1.000 | 0,00 | 22 | 0,00 | ||||
| 2025-08-14 | 13F | First Manhattan Co | 258.986 | -9,80 | 5.708 | -10,92 | ||||
| 2025-07-23 | 13F | Tcfg Wealth Management, Llc | 0 | -100,00 | 0 | |||||
| 2025-08-07 | 13F | ProShare Advisors LLC | 9.909 | 0,51 | 218 | -0,91 | ||||
| 2025-08-08 | 13F | Avantax Advisory Services, Inc. | 10.830 | -2,93 | 239 | -4,42 | ||||
| 2025-08-14 | 13F | D. E. Shaw & Co., Inc. | 26.960 | 5,42 | 594 | 4,21 | ||||
| 2025-05-14 | 13F | Virtus ETF Advisers LLC | 0 | -100,00 | 0 | |||||
| 2025-08-14 | 13F | Ameriprise Financial Inc | 69.501 | -23,33 | 1.532 | -24,36 | ||||
| 2025-08-07 | 13F | Hennion & Walsh Asset Management, Inc. | 79.511 | -38,49 | 1.752 | -39,27 | ||||
| 2025-08-14 | 13F | Palisade Capital Management Llc/nj | 10.747 | 0,00 | 237 | -1,26 | ||||
| 2025-08-08 | 13F | Foundations Investment Advisors, LLC | 118.196 | 10,80 | 2.605 | 9,45 | ||||
| 2025-08-12 | 13F | Cornerstone Wealth Management, LLC | 43.005 | 1,62 | 948 | 0,32 | ||||
| 2025-07-31 | 13F | Catalyst Capital Advisors LLC | 20.000 | 0,00 | 441 | -1,35 | ||||
| 2025-08-14 | 13F | Citadel Advisors Llc | Call | 0 | -100,00 | 0 | ||||
| 2025-08-13 | 13F | Northwestern Mutual Wealth Management Co | 4.000 | 0,00 | 88 | -1,12 | ||||
| 2025-08-04 | 13F | Spire Wealth Management | 600 | 0,00 | 13 | 0,00 |
Other Listings
| DE:SFW | 19,66 € |