Grundlæggende statistik
| Institutionelle ejere | 291 total, 291 long only, 0 short only, 0 long/short - change of 8,61% MRQ |
| Gennemsnitlig porteføljeallokering | 0.1827 % - change of 11,45% MRQ |
| Institutionelle aktier (lange) | 13.854.379 (ex 13D/G) - change of 2,11MM shares 17,94% MRQ |
| Institutionel værdi (lang) | $ 653.018 USD ($1000) |
Institutionelt ejerskab og aktionærer
iShares Trust - iShares Core 40/60 Moderate Allocation ETF (US:AOM) har 291 institutionelle ejere og aktionærer, der har indsendt 13D/G- eller 13F-formularer til Securities Exchange Commission (SEC). Disse institutioner har i alt 13,854,379 aktier. Største aktionærer omfatter BlackRock, Inc., LPL Financial LLC, Morgan Stanley, Wells Fargo & Company/mn, Foundations Investment Advisors, LLC, Raymond James Financial Inc, Ameriprise Financial Inc, Royal Bank Of Canada, Weitzel Financial Services, Inc., and Bank Of America Corp /de/ .
iShares Trust - iShares Core 40/60 Moderate Allocation ETF (ARCA:AOM) institutionel ejerskabsstruktur viser aktuelle positioner i virksomheden efter institutioner og fonde, samt seneste ændringer i positionsstørrelse. Større aktionærer kan omfatte individuelle investorer, investeringsforeninger, hedgefonde eller institutioner. Skema 13D angiver, at investoren besidder (eller besidder) mere end 5 % af virksomheden og har til hensigt (eller har til hensigt at) aktivt at forfølge en ændring i forretningsstrategi. Skema 13G indikerer en passiv investering på over 5%.
The share price as of April 24, 2026 is 48,90 / share. Previously, on April 28, 2025, the share price was 43,73 / share. This represents an increase of 11,82% over that period.

Fondens stemningsscore
Fund Sentiment Score (fka Ownership Accumulation Score) finder de aktier, der bliver mest købt af fonde. Det er resultatet af en sofistikeret, multi-faktor kvantitativ model, der identificerer virksomheder med de højeste niveauer af institutionel akkumulering. Scoringsmodellen bruger en kombination af den samlede stigning i oplyste ejere, ændringerne i porteføljeallokeringer i disse ejere og andre målinger. Tallet går fra 0 til 100, hvor højere tal indikerer et højere niveau af akkumulering for sine jævnaldrende, og 50 er gennemsnittet.
Opdateringsfrekvens: Dagligt
Se Ownership Explorer, som giver en liste over højest rangerende virksomheder.
AI+ Ask Fintel’s AI assistant about iShares Trust - iShares Core 40/60 Moderate Allocation ETF.
Select a question to share a public post with an AI-crafted answer.
Thinking of good questions…
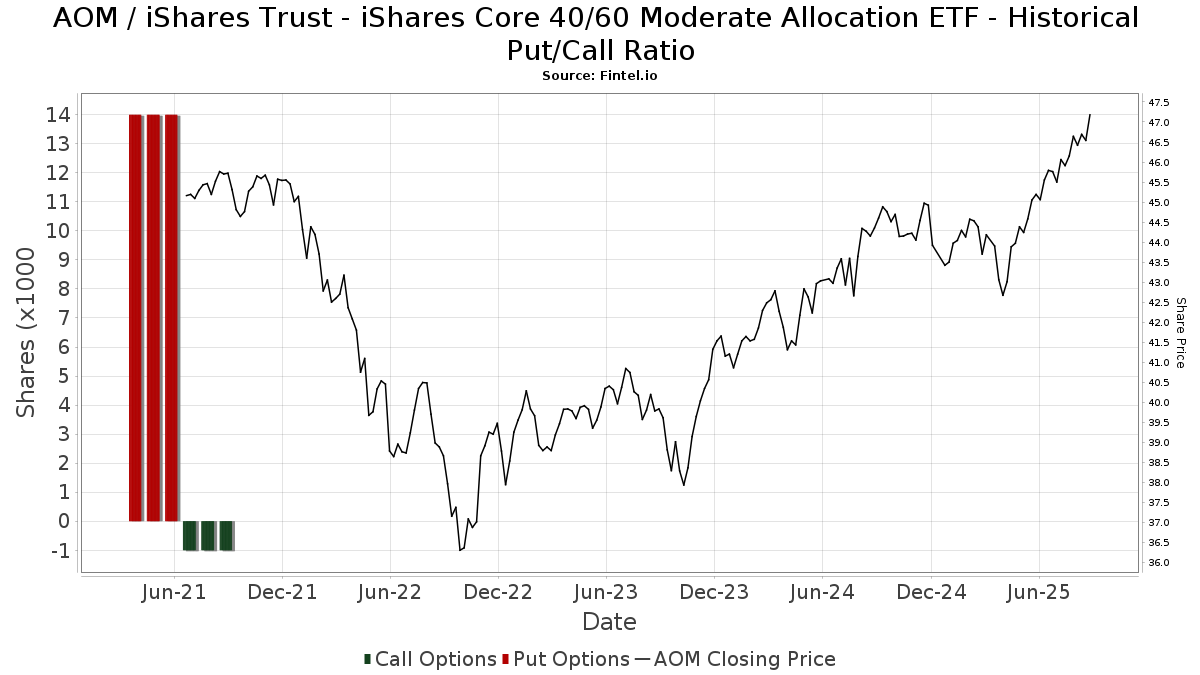
Institutionel Put/Call-forhold
Ud over at indberette standardaktie- og gældsudstedelser skal institutter med mere end 100 mill. aktiver under forvaltning også oplyse deres put- og call-optionsbeholdninger. Da salgsoptioner generelt indikerer negativ stemning, og købsoptioner indikerer positiv stemning, kan vi få en fornemmelse af den overordnede institutionelle stemning ved at plotte forholdet mellem put og kald. Diagrammet til højre viser det historiske put/call-forhold for dette instrument.
Brug af Put/Call Ratio som en indikator for investorernes stemning overvinder en af de vigtigste mangler ved at bruge totalt institutionelt ejerskab, som er, at en betydelig mængde af aktiver under forvaltning investeres passivt for at spore indekser. Passivt forvaltede fonde køber typisk ikke optioner, så indikatoren for put/call-forholdet følger mere nøje følelsen af aktivt forvaltede fonde.
13D/G-arkivering
Vi præsenterer 13D/G ansøgninger separat fra 13F ansøgninger på grund af den forskellige behandling af SEC. 13D/G-ansøgninger kan indgives af grupper af investorer (med én ledende), hvorimod 13F-ansøgninger ikke kan. Dette resulterer i situationer, hvor en investor kan indsende en 13D/G, der rapporterer én værdi for de samlede aktier (der repræsenterer alle de aktier, der ejes af investorgruppen), men derefter indsender en 13F, der rapporterer en anden værdi for de samlede aktier (der udelukkende repræsenterer deres egne) ejendomsret). Det betyder, at aktieejerskab af 13D/G-arkiver og 13F-arkiveringer ofte ikke er direkte sammenlignelige, så vi præsenterer dem separat.
Bemærk: Fra den 16. maj 2021 viser vi ikke længere ejere, der ikke har indsendt en 13D/G inden for det seneste år. Tidligere viste vi den fulde historie af 13D/G-arkiver. Generelt skal enheder, der er forpligtet til at indgive 13D/G-ansøgninger, indgive mindst årligt, før de indsender en afsluttende ansøgning. Dog forlader fonde nogle gange positioner uden at indsende en afsluttende ansøgning (dvs. de afvikler), så visning af den fulde historie resulterede nogle gange i forvirring om det nuværende ejerskab. For at undgå forvirring viser vi nu kun 'aktuelle' ejere - det vil sige - ejere, der har anmeldt inden for det seneste år.
Upgrade to unlock premium data.
| Fil dato | Form | Investor | Forrige Aktier |
Seneste Aktier |
Δ Aktier (Procent) |
Ejendomsret (Procent) |
Δ Ejerskab (Procent) |
|
|---|---|---|---|---|---|---|---|---|
| 2025-04-22 | BlackRock, Inc. | 2,729,495 | 0 | -100.00 | 0.00 | -100.00 | ||
| 2025-04-15 | BlackRock Portfolio Management LLC | 2,910,257 | 8.80 |
13F og NPORT arkivering
Detaljer om 13F-arkivering er gratis. Detaljer om NP-ansøgninger kræver et premium-medlemskab. Grønne rækker angiver nye positioner. Røde rækker angiver lukkede positioner. Klik på linket ikon for at se den fulde transaktionshistorik.
Opgrader
for at låse premium-data op og eksportere til Excel ![]() .
.
| Fil dato | Kilde | Investor | Type | Gennemsnitlig pris (Øst) |
Aktier | Δ Aktier (%) |
Rapporteret Værdi ($1000) |
Δ Værdi (%) |
Port Alloc (%) |
|
|---|---|---|---|---|---|---|---|---|---|---|
| 2026-02-02 | 13F | Integrity Wealth Solutions LLC | 5.341 | 1,25 | 255 | 1,60 | ||||
| 2026-02-14 | 13F | American Trust | 25.565 | -74,10 | 1.220 | -74,02 | ||||
| 2026-04-07 | 13F | Farther Finance Advisors, LLC | 5.190 | 44,41 | 247 | 43,86 | ||||
| 2026-02-11 | 13F | Capital Analysts, Inc. | 383 | 1,86 | 0 | |||||
| 2026-04-13 | 13F | Mkd Wealth Coaches, Llc | 5.683 | -5,49 | 269 | -5,94 | ||||
| 2026-02-13 | 13F | Gts Securities Llc | 20.538 | 334,30 | 980 | 335,56 | ||||
| 2026-04-13 | 13F | Sherman Wealth Management LLC | 5.383 | -0,24 | 255 | -1,17 | ||||
| 2026-02-10 | 13F | Bnp Paribas Arbitrage, Sa | 25 | 0,00 | 1 | 0,00 | ||||
| 2026-04-22 | 13F | AJ Advisors, LLC | 274.866 | 2,14 | 13.020 | 1,38 | ||||
| 2026-02-06 | 13F | Lloyd Advisory Services, LLC. | 238 | 11 | ||||||
| 2026-04-20 | 13F | Jfs Wealth Advisors, Llc | 3.965 | -6,92 | 188 | -7,88 | ||||
| 2026-02-13 | 13F | Fort Point Capital Partners LLC | 8.515 | -8,30 | 412 | -6,80 | ||||
| 2026-01-14 | 13F | Northwest Wealth Management, Llc | 0 | -100,00 | 0 | |||||
| 2026-02-04 | 13F | Money Concepts Capital Corp | 14.247 | 11,15 | 680 | 11,66 | ||||
| 2026-02-06 | 13F | Empirical Asset Management, LLC | 5.677 | 1,67 | 271 | 1,89 | ||||
| 2026-04-24 | 13F | Medallion Wealth Advisors, LLC | 324 | 0,00 | 15 | 0,00 | ||||
| 2026-01-27 | 13F | Elevated Capital Advisors, LLC | 368 | 18 | ||||||
| 2026-02-11 | 13F | Parallel Advisors, LLC | 3.554 | 128,70 | 170 | 131,51 | ||||
| 2026-02-12 | 13F | Scotia Capital Inc. | 5.484 | -18,37 | 262 | -18,18 | ||||
| 2026-02-12 | 13F | Bank Of Montreal /can/ | 6.470 | 3,82 | 309 | 4,05 | ||||
| 2026-01-29 | 13F | Concurrent Investment Advisors, LLC | 13.836 | 5,43 | 660 | 5,77 | ||||
| 2026-02-17 | 13F | Gladstone Institutional Advisory LLC | 7.772 | -2,32 | 371 | -2,12 | ||||
| 2026-03-04 | 13F | SHP Wealth Management | 100 | 5 | ||||||
| 2026-01-26 | 13F | Cwm, Llc | 7.808 | 65,88 | 0 | |||||
| 2026-04-17 | 13F | CENTRAL TRUST Co | 14.330 | 40,09 | 679 | 38,93 | ||||
| 2026-01-29 | 13F | UBS Group AG | 33.399 | -7,18 | 1.594 | -6,84 | ||||
| 2026-02-05 | 13F | HFM Investment Advisors, LLC | 2.624 | -0,46 | 125 | 0,00 | ||||
| 2026-01-23 | 13F | Nbt Bank N A /ny | 48 | 0,00 | 4 | 0,00 | ||||
| 2026-02-13 | 13F | AlTi Global, Inc. | 15.195 | -11,15 | 725 | -10,82 | ||||
| 2026-02-17 | 13F | TCG Advisory Services, LLC | 281.500 | 0,91 | 13.436 | 1,22 | ||||
| 2026-02-12 | 13F | Steward Partners Investment Advisory, Llc | 16.017 | 8,43 | 764 | 8,83 | ||||
| 2026-02-13 | 13F | Barclays Plc | 0 | -100,00 | 0 | |||||
| 2025-11-13 | 13F | Oxford Financial Group Ltd | 0 | -100,00 | 0 | -100,00 | ||||
| 2025-11-14 | 13F | Wood Tarver Financial Group, LLC | 0 | -100,00 | 0 | |||||
| 2026-02-13 | 13F | Visionary Wealth Advisors | 11.704 | 13,38 | 559 | 13,65 | ||||
| 2026-04-16 | 13F | VVR Holdings LLC | 61.321 | -5,57 | 2.905 | -6,29 | ||||
| 2026-02-17 | 13F | Aqr Capital Management Llc | 7.028 | 0,00 | 335 | 0,30 | ||||
| 2026-02-02 | 13F | Mutual Advisors, LLC | 67.597 | -0,96 | 3.226 | -1,10 | ||||
| 2026-04-13 | 13F | Plan Group Financial, LLC | 8.390 | -12,59 | 397 | -13,32 | ||||
| 2026-04-13 | 13F | Garrett Investment Advisors LLC | 19.072 | 226,18 | 903 | 223,66 | ||||
| 2026-01-28 | 13F | Dentgroup LLC | 10.310 | 0,00 | 492 | 0,41 | ||||
| 2026-04-13 | 13F | Mather Group, Llc. | 132 | 6 | ||||||
| 2026-04-22 | 13F | Janney Montgomery Scott LLC | 4.497 | -75,37 | 0 | |||||
| 2026-02-12 | 13F | JPL Wealth Management, LLC | 0 | -100,00 | 0 | |||||
| 2026-01-21 | 13F | Mason & Associates, LLC | 0 | -100,00 | 0 | |||||
| 2026-04-14 | 13F | Thurston, Springer, Miller, Herd & Titak, Inc. | 17.047 | 19,79 | 808 | 18,85 | ||||
| 2026-02-10 | 13F | Weaver Consulting Group | 174.178 | 8,01 | 8.314 | 8,34 | ||||
| 2026-02-11 | 13F | Gwn Securities Inc. | 9.568 | 4,80 | 457 | 5,07 | ||||
| 2026-02-13 | 13F | Centaurus Financial, Inc. | 9.552 | 7,97 | 0 | |||||
| 2026-04-10 | 13F | Aquire Wealth Advisors, LLC | 0 | -100,00 | 0 | |||||
| 2026-02-13 | 13F | Morgan Stanley | 856.486 | 134,40 | 40.880 | 135,15 | ||||
| 2026-02-17 | 13F | Risk Paradigm Group, LLC | 0 | -100,00 | 0 | |||||
| 2026-02-17 | 13F | First Commonwealth Financial Corp /pa/ | 5.000 | 0,00 | 239 | 0,42 | ||||
| 2025-11-10 | 13F | Siligmueller & Norvid Wealth Advisors LLC | 10.255 | 488 | ||||||
| 2026-01-06 | 13F | Tucker Asset Management Llc | 0 | -100,00 | 0 | |||||
| 2026-02-10 | 13F | Waterloo Capital, L.P. | 10.800 | -2,58 | 515 | -2,28 | ||||
| 2026-02-26 | 13F | Ssa Swiss Advisors Ag | 4.003 | -9,70 | 191 | -9,05 | ||||
| 2026-04-14 | 13F | Heirloom Wealth Management | 10.106 | 11,13 | 479 | 10,14 | ||||
| 2026-04-20 | 13F | Cardinal Point Capital Management, ULC | 4.584 | 0,00 | 217 | -0,46 | ||||
| 2026-02-17 | 13F | Hanover Advisors Inc | 78.751 | -37,37 | 3.759 | -37,18 | ||||
| 2026-01-21 | 13F | Leading Edge Financial Planning LLC | 6.597 | -3,55 | 315 | -3,38 | ||||
| 2026-02-09 | 13F | Kingsview Wealth Management, LLC | 4.384 | 1,43 | 209 | 1,95 | ||||
| 2026-02-13 | 13F | Potentia Wealth | 6.037 | 288 | ||||||
| 2026-02-12 | 13F | Commonwealth Equity Services, Llc | 145.030 | -0,06 | 6.922 | 115.266,67 | ||||
| 2026-02-17 | 13F | Cetera Investment Advisers | 218.395 | 11,15 | 10.424 | 11,51 | ||||
| 2025-11-17 | 13F | Gould Capital, LLC | 0 | -100,00 | 0 | |||||
| 2026-02-13 | 13F | Kestra Advisory Services, LLC | 0 | -100,00 | 0 | |||||
| 2026-02-09 | 13F | Syverson Strege & Co | 8.928 | 32,29 | 426 | 32,71 | ||||
| 2026-02-12 | 13F | Insigneo Advisory Services, Llc | 27.895 | 0,05 | 1.331 | 0,38 | ||||
| 2026-02-17 | 13F | Boreal Capital Management LLC | 0 | -100,00 | 0 | |||||
| 2026-04-21 | 13F | Mendel Capital Management LLC | 9.280 | 0,00 | 440 | -0,45 | ||||
| 2026-02-05 | 13F | Western Wealth Management, LLC | 93.451 | 4.460 | ||||||
| 2026-02-17 | 13F | Private Advisor Group, LLC | 56.576 | 7,32 | 2.700 | 7,66 | ||||
| 2026-04-22 | 13F | SimpliFi, Inc. | 9.085 | 9,47 | 430 | 8,59 | ||||
| 2026-04-17 | 13F | AdvisorNet Financial, Inc | 2.250 | -20,16 | 107 | -20,90 | ||||
| 2026-02-12 | 13F | Federation des caisses Desjardins du Quebec | 9.751 | 12,65 | 465 | 13,14 | ||||
| 2026-02-13 | 13F | Mml Investors Services, Llc | 18.939 | -5,72 | 904 | -5,45 | ||||
| 2026-04-14 | 13F | Zrc Wealth Management, Llc | 443 | 52,23 | 21 | 53,85 | ||||
| 2026-04-23 | 13F | Ellenbecker Investment Group | 81.189 | 3,30 | 3.846 | 2,51 | ||||
| 2026-02-09 | 13F | Coordinated Financial Services, Inc. | 4.608 | 220 | ||||||
| 2026-01-20 | 13F | Steel Peak Wealth Management LLC | 14.391 | -4,74 | 687 | -4,46 | ||||
| 2026-04-13 | 13F | Creative Financial Designs Inc /adv | 52 | -28,77 | 2 | -33,33 | ||||
| 2026-02-17 | 13F | United Capital Financial Advisers, Llc | 9.755 | 8,79 | 466 | 9,15 | ||||
| 2026-02-12 | 13F | Mosley Wealth Management | 10.708 | -6,54 | 510 | 1,19 | ||||
| 2026-02-10 | 13F | Envestnet Asset Management Inc | 75.304 | 2,95 | 3.594 | 3,28 | ||||
| 2026-01-20 | 13F | Stratos Wealth Partners, LTD. | 11.060 | 0,01 | 528 | 0,19 | ||||
| 2026-01-21 | 13F/A | Efficient Advisors, LLC | 7.321 | -3,81 | 349 | -3,59 | ||||
| 2026-04-22 | 13F | JNBA Financial Advisors | 1.376 | 1,10 | 65 | 1,56 | ||||
| 2026-02-10 | 13F | Godfrey Financial Associates, Inc. | 320 | 15 | ||||||
| 2026-02-13 | 13F | TRUE Private Wealth Advisors | 50.405 | -3,59 | 2.406 | -3,30 | ||||
| 2026-02-17 | 13F | Warren Averett Asset Management, LLC | 83.485 | 6,39 | 3.985 | 6,72 | ||||
| 2026-01-20 | 13F | Ascent Group, LLC | 9.533 | 0,00 | 455 | 0,44 | ||||
| 2026-01-15 | 13F | Lodestone Wealth Management LLC | 513 | 24 | ||||||
| 2026-04-22 | 13F | Richard Bernstein Advisors LLC | 56 | 7,69 | 3 | 0,00 | ||||
| 2026-01-30 | 13F | Wealth Forward, LLC | 11.223 | 25,19 | 536 | 25,59 | ||||
| 2026-04-08 | 13F | Dynamic Advisor Solutions LLC | 4.786 | -1,60 | 227 | -2,59 | ||||
| 2026-04-20 | 13F | Fort Henry Capital, LLC | 22.680 | 0,55 | 1.074 | -0,19 | ||||
| 2026-01-21 | 13F | Flagship Harbor Advisors, Llc | 587 | 28 | ||||||
| 2026-02-17 | 13F | Adams Wealth Management | 4.968 | 15,78 | 237 | 16,18 | ||||
| 2026-02-17 | 13F | GeoWealth Management, LLC | 8.231 | -0,76 | 393 | -0,51 | ||||
| 2026-02-13 | 13F | KilterHowling LLC | 62.237 | 2.971 | ||||||
| 2026-02-13 | 13F | Ausdal Financial Partners, Inc. | 11.337 | 13,40 | 541 | 13,89 | ||||
| 2026-04-14 | 13F | Beacon Investment Advisory Services, Inc. | 19.080 | 6,85 | 904 | 5,99 | ||||
| 2026-01-21 | 13F | Sound Income Strategies, LLC | 649 | 2,69 | 31 | 3,33 | ||||
| 2026-02-11 | 13F | Premier Private Wealth Management LLC | 8.241 | 399 | ||||||
| 2026-02-13 | 13F | Stifel Financial Corp | 39.868 | 23,66 | 1.903 | 23,99 | ||||
| 2025-11-06 | 13F | Financial Advocates Investment Management | 93.348 | 4,35 | 4.442 | 7,84 | ||||
| 2026-04-14 | 13F | LifePlan Financial, LLC | 37.301 | 16,57 | 1.767 | 15,65 | ||||
| 2026-02-06 | 13F | Axxcess Wealth Management, Llc | 41.212 | 127,53 | 1.967 | 128,46 | ||||
| 2026-01-16 | 13F | Marino, Stram & Associates Llc | 17.674 | 0,87 | 844 | 1,20 | ||||
| 2026-04-15 | 13F | Bright Futures Wealth Management, LLC. | 6.697 | -12,59 | 317 | -13,15 | ||||
| 2026-01-29 | 13F | Comerica Bank | 53 | 3 | ||||||
| 2026-02-18 | 13F | CacheTech Inc. | 4.968 | 15,78 | 237 | 16,18 | ||||
| 2026-01-27 | 13F | Lodestar Private Asset Management Llc | 142.244 | 5,22 | 6.789 | 5,55 | ||||
| 2026-04-08 | 13F | Wealth Enhancement Advisory Services, Llc | 68.471 | -24,54 | 3.236 | -25,90 | ||||
| 2026-02-12 | 13F | Adviser Investments LLC | 4.629 | -15,70 | 221 | -15,71 | ||||
| 2026-01-28 | 13F | Salomon & Ludwin, LLC | 1.744 | 0,00 | 84 | 0,00 | ||||
| 2026-04-15 | 13F | Milestone Asset Management, Llc | 31.952 | -0,57 | 1.514 | -1,30 | ||||
| 2026-01-30 | 13F | Strategic Blueprint, LLC | 8.751 | 418 | ||||||
| 2026-04-08 | 13F | First Heartland Consultants, Inc. | 8.341 | -2,88 | 395 | -3,42 | ||||
| 2026-04-21 | 13F | Wedbush Securities Inc | 9.490 | -58,74 | 0 | -100,00 | ||||
| 2026-04-16 | 13F | Kavar Capital Partners Group, Llc | 259.957 | 12.314 | ||||||
| 2026-02-02 | 13F | Truist Financial Corp | 90.678 | 0,81 | 4.328 | 1,15 | ||||
| 2026-02-13 | 13F | SRS Capital Advisors, Inc. | 6.643 | 317 | ||||||
| 2026-04-13 | 13F | Enclave Advisors LLC | 46.253 | -2,31 | 2.191 | -3,01 | ||||
| 2026-02-03 | 13F | MPS Loria Financial Planners, LLC | 10.550 | 5,99 | 504 | 6,34 | ||||
| 2026-02-02 | 13F | CX Institutional | 0 | -100,00 | 0 | |||||
| 2026-02-13 | 13F | Integrity Financial Corp /WA | 11.394 | -0,27 | 544 | 0,00 | ||||
| 2026-04-20 | 13F | Kastel Capital Advisors, LLC | 8.440 | 0,00 | 403 | 0,00 | ||||
| 2026-04-20 | 13F | McKinley Carter Wealth Services, Inc. | 5.013 | -4,04 | 237 | -4,82 | ||||
| 2026-02-03 | 13F | Manske Wealth Management | 42.511 | -0,35 | 2.029 | 0,00 | ||||
| 2026-04-14 | 13F | Wealthcare Advisory Partners LLC | 8.834 | 0,00 | 418 | -0,71 | ||||
| 2026-04-21 | 13F | Patton Albertson Miller Group, Llc | 30.560 | -27,65 | 1.448 | -28,22 | ||||
| 2026-02-13 | 13F | 1 North Wealth Services Llc | 1.346 | -18,42 | 64 | -17,95 | ||||
| 2026-01-21 | 13F | Capital Investment Advisory Services, LLC | 1.728 | 0,00 | 82 | 0,00 | ||||
| 2026-02-12 | 13F | Founders Financial Alliance, LLC | 1.903 | -2,81 | 91 | -3,23 | ||||
| 2026-04-17 | 13F | Halbert Hargrove Global Advisors, Llc | 61 | -6,15 | 3 | -33,33 | ||||
| 2026-02-02 | 13F | Estate Counselors, LLC | 0 | -100,00 | 0 | |||||
| 2026-01-27 | 13F | Seeds Investor Llc | 79.861 | -12,91 | 3.812 | -12,65 | ||||
| 2026-04-14 | 13F | Xena Financial Planning, LLC | 6.960 | 0,00 | 330 | -0,90 | ||||
| 2026-02-13 | 13F | Integrated Wealth Concepts LLC | 16.949 | 0,71 | 809 | 1,00 | ||||
| 2026-01-15 | 13F | PFG Private Wealth Management, LLC | 0 | -100,00 | 0 | |||||
| 2026-04-15 | 13F | Sightline Wealth Advisors, LLC | 5.113 | -6,56 | 242 | -7,28 | ||||
| 2026-04-20 | 13F | Ritholtz Wealth Management | 19.370 | -5,57 | 918 | -6,33 | ||||
| 2026-02-06 | 13F | TPG Financial Advisors, LLC | 4.633 | -8,89 | 221 | -8,30 | ||||
| 2026-02-13 | 13F | Pacific Center for Financial Services | 1.567 | 0,00 | 75 | 0,00 | ||||
| 2026-02-18 | 13F | GWM Advisors LLC | 24.243 | 11,02 | 1.157 | 11,46 | ||||
| 2026-02-06 | 13F | Global Retirement Partners, LLC | 2.563 | 1,14 | 122 | 1,67 | ||||
| 2026-02-03 | 13F | Gallacher Capital Management LLC | 26.734 | 5,54 | 1.276 | 5,89 | ||||
| 2026-04-15 | 13F | Retireful, LLC | 13.737 | 651 | ||||||
| 2026-01-29 | 13F | DecisionPoint Financial, LLC | 265 | 13 | ||||||
| 2026-04-07 | 13F | Comprehensive Financial Planning, Inc./PA | 1.206 | 0,00 | 57 | 0,00 | ||||
| 2026-04-22 | 13F | Investment Advisory Group, LLC | 149.318 | 2,83 | 7.073 | 2,06 | ||||
| 2026-01-16 | 13F | Tempus Wealth Planning, LLC | 8.640 | 6,98 | 412 | 7,29 | ||||
| 2026-01-20 | 13F | Aspiriant, Llc | 45.218 | 0,00 | 2.158 | 0,33 | ||||
| 2026-02-10 | 13F | Nomura Asset Management Co Ltd | 5.500 | 0,00 | 263 | 0,38 | ||||
| 2026-02-05 | 13F | Thrivent Financial For Lutherans | 4.874 | 0 | ||||||
| 2026-02-17 | 13F | Bank Of America Corp /de/ | 293.025 | 25,70 | 13.986 | 26,10 | ||||
| 2026-02-12 | 13F | Rossby Financial, LCC | 1.236 | 0,00 | 59 | -1,69 | ||||
| 2026-01-05 | 13F | Noble Wealth Management PBC | 0 | -100,00 | 0 | |||||
| 2026-02-02 | 13F | Cornerstone Planning Group LLC | 3.866 | 5,20 | 188 | 6,86 | ||||
| 2026-02-10 | 13F | One Capital Management, LLC | 26.986 | 11,43 | 1.288 | 11,81 | ||||
| 2026-02-20 | 13F | Sunbelt Securities, Inc. | 2.117 | 0,09 | 101 | 1,00 | ||||
| 2026-02-11 | 13F | SOUTH STATE Corp | 663 | -19,15 | 32 | -20,51 | ||||
| 2026-04-15 | 13F | Redhawk Wealth Advisors, Inc. | 15.356 | 41,61 | 727 | 40,62 | ||||
| 2026-04-24 | 13F | Root Financial Partners, LLC | 2.925 | 0,00 | 139 | -0,72 | ||||
| 2026-04-21 | 13F | Claro Advisors LLC | 6.450 | 0,00 | 306 | -0,65 | ||||
| 2026-04-22 | 13F | Spire Wealth Management | 405 | 0,00 | 19 | 0,00 | ||||
| 2026-02-17 | 13F | Advisor Group Holdings, Inc. | 143.133 | -31,94 | 6.833 | -31,10 | ||||
| 2026-04-10 | 13F | RTD Financial Advisors, Inc. | 8.172 | -6,64 | 387 | -7,19 | ||||
| 2025-11-12 | 13F | Buckingham Strategic Partners | 0 | -100,00 | 0 | |||||
| 2025-11-05 | 13F | Concord Wealth Partners | 0 | -100,00 | 0 | |||||
| 2026-04-13 | 13F | Kmg Fiduciary Partners, Llc | 22.695 | -1,74 | 1.075 | -2,45 | ||||
| 2025-11-04 | 13F | Pineridge Advisors LLC | 959 | 0,42 | 46 | 4,65 | ||||
| 2026-02-13 | 13F | RFP Financial Group LLC | 0 | -100,00 | 0 | |||||
| 2026-02-03 | 13F | Weitzel Financial Services, Inc. | 301.264 | 4,32 | 14.415 | 5,62 | ||||
| 2026-02-05 | 13F | Maxele Advisors, LLC | 7.416 | 7,54 | 354 | 7,62 | ||||
| 2026-04-06 | 13F | Private Client Services, Llc | 0 | -100,00 | 0 | |||||
| 2026-04-02 | 13F | MJT & Associates Financial Advisory Group, Inc. | 0 | -100,00 | 0 | |||||
| 2026-04-13 | 13F | IFP Advisors, Inc | 411 | 0,00 | 19 | 0,00 | ||||
| 2026-02-09 | 13F | Hartland & Co., LLC | 31 | 3,33 | 1 | 0,00 | ||||
| 2026-02-17 | 13F | Royal Bank Of Canada | 322.490 | 12,68 | 15.392 | 13,04 | ||||
| 2026-04-21 | 13F | Mesirow Financial Investment Management, Inc. | 15.106 | 2,97 | 716 | 2,14 | ||||
| 2026-02-17 | 13F | Equitable Holdings, Inc. | 6.339 | -10,17 | 303 | -9,85 | ||||
| 2026-04-20 | 13F | Financial Enhancement Group LLC | 0 | -100,00 | 0 | -100,00 | ||||
| 2026-01-20 | 13F | SOA Wealth Advisors, LLC. | 2.718 | 1,49 | 130 | 1,57 | ||||
| 2026-01-27 | 13F | Elevate Wealth Advisory, Inc | 0 | -100,00 | 0 | |||||
| 2026-01-28 | 13F | Geneos Wealth Management Inc. | 2.369 | -0,67 | 113 | 0,00 | ||||
| 2025-11-17 | 13F | FSA Wealth Management LLC | 30 | 0,00 | 3 | 0,00 | ||||
| 2026-02-05 | 13F | Navalign, LLC | 272 | 13 | ||||||
| 2026-01-07 | 13F | Sagespring Wealth Partners, Llc | 6.850 | 3,51 | 327 | 3,82 | ||||
| 2026-01-13 | 13F/A | Sanctuary Advisors, LLC | 4.932 | 3,66 | 235 | 6,85 | ||||
| 2026-02-13 | 13F | Colony Group, LLC | 77.739 | -0,57 | 3.711 | -0,24 | ||||
| 2026-04-14 | 13F | Nbc Securities, Inc. | 2.380 | 0,00 | 113 | -0,88 | ||||
| 2026-04-17 | 13F | Phil A. Younker & Associates, Ltd. | 7.609 | 360 | ||||||
| 2026-04-23 | 13F | Moss Adams Wealth Advisors LLC | 9.376 | 0,82 | 444 | 0,23 | ||||
| 2026-02-05 | 13F | Atria Investments Llc | 4.865 | 2,81 | 232 | 3,11 | ||||
| 2026-02-05 | 13F | Cambridge Investment Research Advisors, Inc. | 118.502 | -30,52 | 6 | -37,50 | ||||
| 2026-04-14 | 13F | American State Bank (Iowa) | 0 | -100,00 | 0 | |||||
| 2026-01-20 | 13F | Austin Private Wealth, LLC | 6.955 | 0,00 | 332 | 0,30 | ||||
| 2026-02-12 | 13F | Eight 31 Financial Llc | 20.886 | -1,99 | 997 | -1,68 | ||||
| 2026-04-17 | 13F | Summit Wealth Partners, LLC | 12.078 | -6,82 | 572 | -7,44 | ||||
| 2026-01-26 | 13F | Private Trust Co Na | 85 | 4 | ||||||
| 2026-02-12 | 13F | Brinker Capital Investments, LLC | 4.505 | 215 | ||||||
| 2026-02-17 | 13F | SageView Advisory Group, LLC | 439 | 21 | ||||||
| 2026-04-20 | 13F | Consilium Wealth Advisory, LLC | 76.627 | -16,90 | 3.630 | -17,54 | ||||
| 2026-02-17 | 13F | Captrust Financial Advisors | 8.477 | -12,03 | 405 | -11,79 | ||||
| 2026-04-14 | 13F | Bay Harbor Wealth Management, LLC | 8.152 | 0,74 | 386 | 0,00 | ||||
| 2026-04-23 | 13F | Harbor Investment Advisory, Llc | 1.490 | 2,55 | 71 | 1,45 | ||||
| 2026-02-05 | 13F | Legacy Financial Group LLC | 16.692 | 2,96 | 808 | 4,67 | ||||
| 2026-01-30 | 13F | Bogart Wealth, LLC | 595 | 0,00 | 28 | 0,00 | ||||
| 2026-02-17 | 13F | Wiley Bros.-aintree Capital, Llc | 5.290 | -11,32 | 252 | -10,95 | ||||
| 2026-02-17 | 13F | Jones Financial Companies Lllp | 22.136 | 11,48 | 1.057 | 12,46 | ||||
| 2025-11-12 | 13F | Transce3nd, LLC | 0 | -100,00 | 0 | |||||
| 2026-04-22 | 13F | WestEnd Advisors, LLC | 16 | 1 | ||||||
| 2026-01-29 | 13F | Dunhill Financial, LLC | 365 | 0,00 | 17 | 0,00 | ||||
| 2026-02-10 | 13F | Evolution Wealth Management Inc. | 119 | 6 | ||||||
| 2026-02-17 | 13F | Qube Research & Technologies Ltd | 1.503 | 210,54 | 72 | 208,70 | ||||
| 2026-04-23 | 13F | J.w. Cole Advisors, Inc. | 0 | -100,00 | 0 | |||||
| 2026-01-23 | 13F | Octavia Wealth Advisors, LLC | 0 | -100,00 | 0 | |||||
| 2026-02-12 | 13F | StoneX Group Inc. | 9.135 | -2,14 | 436 | -1,80 | ||||
| 2026-02-09 | 13F | Delta Asset Management Llc/tn | 430 | 0,00 | 21 | 0,00 | ||||
| 2026-02-13 | 13F | Umb Bank N A/mo | 0 | -100,00 | 0 | |||||
| 2026-02-04 | 13F | Ameritas Advisory Services, LLC | 77.730 | 1.723,79 | 3.710 | 1.736,63 | ||||
| 2026-01-28 | 13F | Proathlete Wealth Management Llc | 3.719 | 1,70 | 178 | 1,72 | ||||
| 2026-01-30 | 13F | Archer Investment Corp | 635 | 0,95 | 30 | 3,45 | ||||
| 2026-02-12 | 13F | BlackRock, Inc. | 2.920.823 | 1,14 | 139.411 | 1,45 | ||||
| 2026-04-13 | 13F | Fiduciary Financial Group, Llc | 5.156 | -0,08 | 244 | -0,81 | ||||
| 2026-02-10 | 13F | Foundations Investment Advisors, LLC | 531.618 | 4,72 | 25.374 | 5,05 | ||||
| 2026-02-11 | 13F | Strategic Advocates LLC | 2.823 | -0,18 | 135 | 0,75 | ||||
| 2026-02-05 | 13F | Allworth Financial LP | 3.728 | 24,85 | 178 | 24,65 | ||||
| 2026-01-16 | 13F | Worth Financial Advisory Group, LLC | 7.310 | 349 | ||||||
| 2026-02-23 | 13F | Beaird Harris Wealth Management, LLC | 300 | 0 | ||||||
| 2026-02-17 | 13F | Ameriprise Financial Inc | 368.686 | 30,70 | 17.604 | 31,16 | ||||
| 2026-04-21 | 13F | Laurel Oak Wealth Management, Llc | 12.833 | -13,75 | 608 | -14,51 | ||||
| 2026-04-13 | 13F | Armstrong, Fleming & Moore, Inc | 12.042 | 0,00 | 570 | -0,70 | ||||
| 2026-04-24 | 13F | United Community Bank | 500 | 24 | ||||||
| 2026-02-11 | 13F | Wealthgarden F.s. Llc | 4.231 | 0,00 | 205 | 0,99 | ||||
| 2026-02-06 | 13F | CFO4Life Group, LLC | 7.935 | 0,00 | 379 | 0,27 | ||||
| 2026-02-13 | 13F | Wells Fargo & Company/mn | 545.000 | 110,92 | 26.013 | 111,58 | ||||
| 2025-11-13 | 13F | Franklin Resources Inc | 0 | -100,00 | 0 | |||||
| 2026-01-22 | 13F | Harwood Advisory Group, LLC | 2.391 | -4,01 | 114 | -3,39 | ||||
| 2026-04-16 | 13F | Westmount Partners, LLC | 7.941 | 12,16 | 376 | 11,57 | ||||
| 2026-02-05 | 13F | Mission Wealth Management, Lp | 6.084 | -15,16 | 290 | -14,96 | ||||
| 2026-02-17 | 13F | Cape Investment Advisory, Inc. | 404 | 19 | ||||||
| 2026-02-17 | 13F | Ancora Advisors, LLC | 0 | -100,00 | 0 | |||||
| 2026-02-14 | 13F | Rockefeller Capital Management L.P. | 6.029 | 0,17 | 288 | 0,35 | ||||
| 2025-11-05 | 13F | Signature Estate & Investment Advisors Llc | 0 | -100,00 | 0 | -100,00 | ||||
| 2026-02-09 | 13F | Harbour Investments, Inc. | 25.510 | 11,79 | 1.218 | 12,17 | ||||
| 2026-03-19 | 13F | Painted Porch Advisors LLC | 0 | -100,00 | 0 | |||||
| 2026-02-11 | 13F | Jpmorgan Chase & Co | 18.808 | -57,11 | 898 | -57,00 | ||||
| 2026-04-23 | 13F | Oppenheimer Asset Management Inc. | 0 | -100,00 | 0 | |||||
| 2026-02-09 | 13F | Keating Financial Advisory Services, Inc. | 13 | 1 | ||||||
| 2026-02-13 | 13F | Beacon Financial Advisory LLC | 43.727 | 0,32 | 2.087 | 0,68 | ||||
| 2026-02-17 | 13F | Prosperity Consulting Group, LLC | 27.986 | -0,75 | 1.336 | -0,45 | ||||
| 2026-02-13 | 13F | MAI Capital Management | 14.701 | -0,55 | 702 | -0,28 | ||||
| 2026-04-15 | 13F | Archford Capital Strategies, LLC | 6.283 | -7,66 | 298 | -8,33 | ||||
| 2026-02-13 | 13F | Nicolet Advisory Services, Llc | 4.690 | -36,09 | 227 | -35,06 | ||||
| 2026-04-20 | 13F | L.K. Benson & Company, P.C. | 10.365 | 491 | ||||||
| 2026-02-12 | 13F | Godshalk Welsh Capital Management, Inc. | 21.799 | 22,28 | 1.040 | 22,64 | ||||
| 2026-04-22 | 13F | Onyx Bridge Wealth Group LLC | 77.729 | -0,47 | 3.682 | -1,21 | ||||
| 2026-02-17 | 13F | IHT Wealth Management, LLC | 7.944 | 0,05 | 379 | 0,53 | ||||
| 2026-02-11 | 13F | IMA Wealth, Inc. | 3.192 | -19,54 | 152 | -8,98 | ||||
| 2026-02-12 | 13F | Brown Brothers Harriman & Co | 1.645 | 0,00 | 79 | 0,00 | ||||
| 2026-02-04 | 13F | Pensionmark Financial Group, Llc | 19.025 | 3,49 | 908 | 3,89 | ||||
| 2026-02-13 | 13F | Resources Investment Advisors, LLC. | 8.651 | -1,01 | 413 | -0,72 | ||||
| 2026-02-11 | 13F | Cerity Partners LLC | 5.415 | 259 | ||||||
| 2026-04-17 | 13F | RFG Advisory, LLC | 7.391 | 0,00 | 350 | -0,57 | ||||
| 2026-01-23 | 13F | Assetmark, Inc | 724 | 0,00 | 35 | 0,00 | ||||
| 2025-11-12 | 13F | Creekmur Asset Management LLC | 0 | -100,00 | 0 | |||||
| 2026-04-16 | 13F | BridgePort Financial Solutions, LLC | 11.920 | 9,21 | 565 | 8,46 | ||||
| 2026-04-07 | 13F | CoreCap Advisors, LLC | 4.790 | 11,03 | 227 | 10,24 | ||||
| 2026-02-05 | 13F | Evensky & Katz LLC | 0 | -100,00 | 0 | |||||
| 2026-01-21 | 13F | Stonebridge Financial Group, LLC | 0 | -100,00 | 0 | |||||
| 2026-01-30 | 13F | American Capital Advisory, LLC | 135 | 0,00 | 6 | 0,00 | ||||
| 2026-04-22 | 13F | TBH Global Asset Management, LLC | 0 | -100,00 | 0 | |||||
| 2026-04-09 | 13F | Nelson, Van Denburg & Campbell Wealth Management Group, LLC | 21.603 | 1,79 | 1.023 | 0,99 | ||||
| 2026-04-21 | 13F | Gilpin Wealth Management, Llc | 14.131 | 6,22 | 669 | 5,52 | ||||
| 2025-10-29 | 13F | Archvest Wealth Advisors, Inc. | 0 | -100,00 | 0 | -100,00 | ||||
| 2026-04-17 | 13F | High Net Worth Advisory Group LLC | 31.600 | 49,06 | 1.497 | 47,97 | ||||
| 2026-02-13 | 13F | National Bank Of Canada /fi/ | 21.621 | 6,73 | 1.031 | 7,17 | ||||
| 2026-04-21 | 13F | Venturi Wealth Management, LLC | 5.039 | 5,24 | 239 | 4,39 | ||||
| 2026-02-17 | 13F | Citadel Advisors Llc | 7.824 | 373 | ||||||
| 2026-01-29 | 13F | Aprio Wealth Management, LLC | 5.700 | 0,00 | 272 | 0,37 | ||||
| 2026-04-17 | 13F | Sovereign Financial Group, Inc. | 21.907 | -1,09 | 1.038 | -1,89 | ||||
| 2026-04-20 | 13F | Global Financial Private Client, LLC | 21.291 | 1,52 | 1.009 | 0,70 | ||||
| 2026-02-05 | 13F | High Note Wealth, LLC | 1 | 0,00 | 0 | |||||
| 2026-02-06 | 13F | HighTower Advisors, LLC | 19.610 | 3,58 | 936 | 3,89 | ||||
| 2026-02-12 | 13F | Wealthspire Advisors, LLC | 0 | -100,00 | 0 | |||||
| 2025-11-14 | 13F | Susquehanna International Group, Llp | 0 | -100,00 | 0 | |||||
| 2026-04-21 | 13F | GHP Investment Advisors, Inc. | 6.429 | 305 | ||||||
| 2026-01-26 | 13F | AE Wealth Management LLC | 13.191 | -50,13 | 630 | -50,00 | ||||
| 2026-02-13 | 13F | Aptus Capital Advisors, LLC | 113 | -39,25 | 5 | -37,50 | ||||
| 2026-04-16 | 13F | Brookstone Capital Management | 73.165 | 1,28 | 3.466 | 0,49 | ||||
| 2026-04-15 | 13F | Aventus Investment Advisors, Inc. | 1 | 0 | ||||||
| 2026-04-21 | 13F | Unique Wealth, Llc | 10.501 | -28,71 | 497 | -29,30 | ||||
| 2026-02-17 | 13F | Fmr Llc | 4.231 | 11,28 | 202 | 11,67 | ||||
| 2026-02-13 | 13F | Smith Partners Wealth Management, LLC | 6.661 | 318 | ||||||
| 2026-02-17 | 13F | Raymond James Financial Inc | 440.592 | 449,32 | 21.029 | 451,07 | ||||
| 2026-01-12 | 13F | National Wealth Management Group, LLC | 6.805 | -1,58 | 325 | -1,22 | ||||
| 2026-02-13 | 13F | Mariner, LLC | 14.193 | -2,42 | 677 | -2,17 | ||||
| 2026-01-30 | 13F | Sigma Planning Corp | 14.441 | 8,38 | 689 | 8,68 | ||||
| 2026-02-06 | 13F | BlueStem Wealth Partners, LLC | 26.127 | -4,28 | 1.247 | -3,93 | ||||
| 2026-02-03 | 13F | McIlrath & Eck, LLC | 1.800 | 0,84 | 86 | 1,19 | ||||
| 2026-02-10 | 13F | Sentinus, LLC | 22.010 | 6,37 | 1.051 | 6,71 | ||||
| 2026-02-04 | 13F | Mascoma Wealth Management LLC | 128 | 0,00 | 6 | 0,00 | ||||
| 2026-02-10 | 13F | Investment Partners, Ltd. | 10.541 | 1,56 | 503 | 2,03 | ||||
| 2026-04-22 | 13F | Clear Creek Financial Management, LLC | 10.453 | -5,08 | 495 | -5,71 | ||||
| 2026-02-10 | 13F/A | Northwestern Mutual Wealth Management Co | 732 | -9,52 | 35 | -10,53 | ||||
| 2026-04-13 | 13F | Wolff Wiese Magana Llc | 632 | 0,00 | 30 | -3,33 | ||||
| 2026-04-14 | 13F | Capital Asset Managemnet, LLC | 9.073 | 3,40 | 430 | 2,63 | ||||
| 2025-11-04 | 13F | UMA Financial Services, Inc. | 0 | -100,00 | 0 | -100,00 | ||||
| 2026-04-17 | 13F | Legacy Wealth Partners, LLC | 31.035 | -6,86 | 1.470 | -7,55 | ||||
| 2025-11-12 | 13F | Bellwether Advisors, LLC | 0 | -100,00 | 0 | |||||
| 2026-01-12 | 13F | Paragon Advisors, LLC | 8.751 | 418 | ||||||
| 2026-02-09 | 13F | Thrive Capital Management, LLC | 20.390 | -19,23 | 973 | -18,98 | ||||
| 2026-02-11 | 13F | O'shaughnessy Asset Management, Llc | 1.257 | 60 | ||||||
| 2026-04-20 | 13F | Ronald Blue Trust, Inc. | 3.379 | -24,07 | 160 | -24,53 | ||||
| 2025-11-04 | 13F | Atlas Private Wealth Advisors | 0 | -100,00 | 0 | |||||
| 2026-02-13 | 13F | Northstar Group, Inc. | 16.650 | -1,77 | 795 | -1,49 | ||||
| 2026-02-03 | 13F | International Assets Investment Management, Llc | 1.500 | 72 | ||||||
| 2026-04-22 | 13F | Jim Saulnier & Associates, Llc | 56.738 | 18,78 | 2.688 | 17,90 | ||||
| 2026-01-15 | 13F | Royal Fund Management, LLC | 113.987 | 163,30 | 5.441 | 164,21 | ||||
| 2026-04-14 | 13F | Focus Financial Network, Inc. | 115.867 | 17,03 | 5.489 | 16,15 | ||||
| 2026-04-08 | 13F | RDA Financial Network | 24.270 | -1,62 | 1.150 | -2,38 | ||||
| 2026-02-06 | 13F | Taylor Financial Group, Inc. | 74.512 | -1,07 | 3.556 | -0,75 | ||||
| 2026-02-11 | 13F | LPL Financial LLC | 1.272.723 | 17,12 | 60.747 | 17,49 | ||||
| 2026-02-10 | 13F | Lido Advisors, LLC | 8.005 | 0,00 | 381 | 0,00 | ||||
| 2026-02-13 | 13F | Smartleaf Asset Management LLC | 270 | 12,97 | 13 | 9,09 | ||||
| 2026-02-13 | 13F | Denver Wealth Management, Inc. | 19.848 | 28,65 | 947 | 29,02 | ||||
| 2026-02-17 | 13F | Advisory Services Network, LLC | 13.690 | 76,17 | 653 | 76,96 | ||||
| 2026-02-17 | 13F | Creative Planning | 7.584 | -0,82 | 362 | -0,55 | ||||
| 2026-02-18 | 13F | Vermillion & White Wealth Management Group, LLC | 1.427 | 4.656,67 | 68 | 6.700,00 |