Grundlæggende statistik
| Institutionelle aktier (lange) | 57.532.978 - 69,24% (ex 13D/G) - change of -13,22MM shares -18,68% MRQ |
| Institutionel værdi (lang) | $ 7.648.858 USD ($1000) |
Institutionelt ejerskab og aktionærer
American Financial Group, Inc. (US:AFG) har 504 institutionelle ejere og aktionærer, der har indsendt 13D/G- eller 13F-formularer til Securities Exchange Commission (SEC). Disse institutioner har i alt 57,532,978 aktier. Største aktionærer omfatter Vanguard Group Inc, BlackRock, Inc., Fmr Llc, Victory Capital Management Inc, State Street Corp, Charles Schwab Investment Management Inc, American Financial Group Inc 401(k) Retirement & Savings Plan, Geode Capital Management, Llc, Dimensional Fund Advisors Lp, and Alliancebernstein L.p. .
American Financial Group, Inc. (NYSE:AFG) institutionel ejerskabsstruktur viser aktuelle positioner i virksomheden efter institutioner og fonde, samt seneste ændringer i positionsstørrelse. Større aktionærer kan omfatte individuelle investorer, investeringsforeninger, hedgefonde eller institutioner. Skema 13D angiver, at investoren besidder (eller besidder) mere end 5 % af virksomheden og har til hensigt (eller har til hensigt at) aktivt at forfølge en ændring i forretningsstrategi. Skema 13G indikerer en passiv investering på over 5%.
The share price as of April 10, 2026 is 130,69 / share. Previously, on April 14, 2025, the share price was 128,51 / share. This represents an increase of 1,70% over that period.

Fondens stemningsscore
Fund Sentiment Score (fka Ownership Accumulation Score) finder de aktier, der bliver mest købt af fonde. Det er resultatet af en sofistikeret, multi-faktor kvantitativ model, der identificerer virksomheder med de højeste niveauer af institutionel akkumulering. Scoringsmodellen bruger en kombination af den samlede stigning i oplyste ejere, ændringerne i porteføljeallokeringer i disse ejere og andre målinger. Tallet går fra 0 til 100, hvor højere tal indikerer et højere niveau af akkumulering for sine jævnaldrende, og 50 er gennemsnittet.
Opdateringsfrekvens: Dagligt
Se Ownership Explorer, som giver en liste over højest rangerende virksomheder.
AI+ Ask Fintel’s AI assistant about American Financial Group, Inc..
Select a question to share a public post with an AI-crafted answer.
Thinking of good questions…
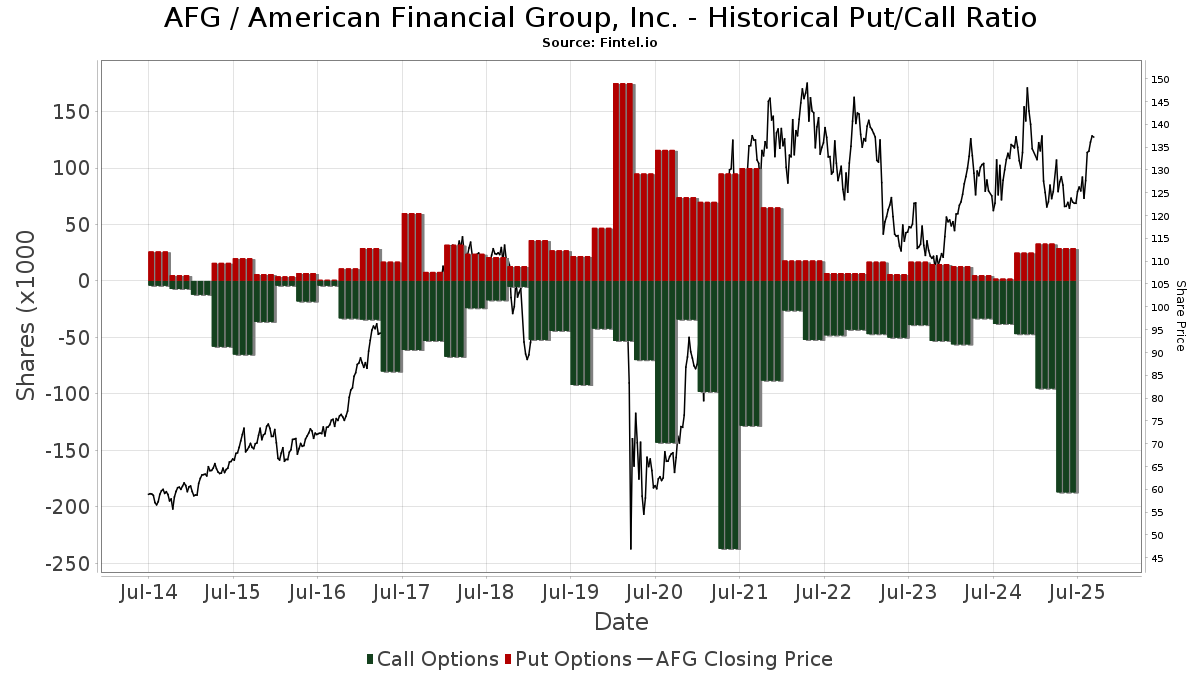
Institutionel Put/Call-forhold
Ud over at indberette standardaktie- og gældsudstedelser skal institutter med mere end 100 mill. aktiver under forvaltning også oplyse deres put- og call-optionsbeholdninger. Da salgsoptioner generelt indikerer negativ stemning, og købsoptioner indikerer positiv stemning, kan vi få en fornemmelse af den overordnede institutionelle stemning ved at plotte forholdet mellem put og kald. Diagrammet til højre viser det historiske put/call-forhold for dette instrument.
Brug af Put/Call Ratio som en indikator for investorernes stemning overvinder en af de vigtigste mangler ved at bruge totalt institutionelt ejerskab, som er, at en betydelig mængde af aktiver under forvaltning investeres passivt for at spore indekser. Passivt forvaltede fonde køber typisk ikke optioner, så indikatoren for put/call-forholdet følger mere nøje følelsen af aktivt forvaltede fonde.
13D/G-arkivering
Vi præsenterer 13D/G ansøgninger separat fra 13F ansøgninger på grund af den forskellige behandling af SEC. 13D/G-ansøgninger kan indgives af grupper af investorer (med én ledende), hvorimod 13F-ansøgninger ikke kan. Dette resulterer i situationer, hvor en investor kan indsende en 13D/G, der rapporterer én værdi for de samlede aktier (der repræsenterer alle de aktier, der ejes af investorgruppen), men derefter indsender en 13F, der rapporterer en anden værdi for de samlede aktier (der udelukkende repræsenterer deres egne) ejendomsret). Det betyder, at aktieejerskab af 13D/G-arkiver og 13F-arkiveringer ofte ikke er direkte sammenlignelige, så vi præsenterer dem separat.
Bemærk: Fra den 16. maj 2021 viser vi ikke længere ejere, der ikke har indsendt en 13D/G inden for det seneste år. Tidligere viste vi den fulde historie af 13D/G-arkiver. Generelt skal enheder, der er forpligtet til at indgive 13D/G-ansøgninger, indgive mindst årligt, før de indsender en afsluttende ansøgning. Dog forlader fonde nogle gange positioner uden at indsende en afsluttende ansøgning (dvs. de afvikler), så visning af den fulde historie resulterede nogle gange i forvirring om det nuværende ejerskab. For at undgå forvirring viser vi nu kun 'aktuelle' ejere - det vil sige - ejere, der har anmeldt inden for det seneste år.
Upgrade to unlock premium data.
| Fil dato | Form | Investor | Forrige Aktier |
Seneste Aktier |
Δ Aktier (Procent) |
Ejendomsret (Procent) |
Δ Ejerskab (Procent) |
|
|---|---|---|---|---|---|---|---|---|
| 2026-01-30 | VANGUARD GROUP INC | 8,187,402 | 7,297,408 | -10.87 | 8.74 | -10.54 | ||
| 2025-10-17 | BlackRock, Inc. | 7,995,504 | 7,071,034 | -11.56 | 8.50 | -10.53 | ||
| 2025-08-06 | FMR LLC | 5,121,287 | 6,586,231 | 28.60 | 7.90 | 29.25 |
13F og NPORT arkivering
Detaljer om 13F-arkivering er gratis. Detaljer om NP-ansøgninger kræver et premium-medlemskab. Grønne rækker angiver nye positioner. Røde rækker angiver lukkede positioner. Klik på linket ikon for at se den fulde transaktionshistorik.
Opgrader
for at låse premium-data op og eksportere til Excel ![]() .
.
| Fil dato | Kilde | Investor | Type | Gennemsnitlig pris (Øst) |
Aktier | Δ Aktier (%) |
Rapporteret Værdi ($1000) |
Δ Værdi (%) |
Port Alloc (%) |
|
|---|---|---|---|---|---|---|---|---|---|---|
| 2026-02-13 | 13F | Edgestream Partners, L.P. | 26.202 | 3.581 | ||||||
| 2026-03-13 | 13F/A | Pensionmark Financial Group, Llc | 1.576 | 215 | ||||||
| 2026-02-10 | 13F | Rothschild Investment Llc | 178 | 1.680,00 | 24 | 2.300,00 | ||||
| 2026-02-09 | 13F | Hartland & Co., LLC | 259 | 87,68 | 35 | 75,00 | ||||
| 2026-02-06 | 13F | Global Retirement Partners, LLC | 211 | 904,76 | 29 | 833,33 | ||||
| 2026-02-06 | 13F | Profund Advisors Llc | 0 | -100,00 | 0 | |||||
| 2026-02-09 | 13F | Wealthquest Corp | 343.372 | 0,00 | 46.932 | -6,20 | ||||
| 2026-02-17 | 13F | Signature Equity Partners, LLC | 9 | 1 | ||||||
| 2026-02-17 | 13F | Aqr Capital Management Llc | 263.440 | 20,80 | 36.007 | 13,40 | ||||
| 2026-01-21 | 13F | Yousif Capital Management, Llc | 22.721 | -2,33 | 2.991 | -11,74 | ||||
| 2026-02-03 | 13F | Costello Asset Management, INC | 532 | 2,11 | 73 | -4,00 | ||||
| 2026-02-09 | 13F | HBK Sorce Advisory LLC | 0 | -100,00 | 0 | -100,00 | ||||
| 2026-02-17 | 13F | Wellington Management Group Llp | 84.123 | -35,11 | 11.498 | -39,14 | ||||
| 2026-02-13 | 13F | Sterling Capital Management LLC | 10.963 | -6,58 | 1.498 | -12,40 | ||||
| 2026-04-07 | 13F | Farther Finance Advisors, LLC | 3.833 | 61,59 | 490 | 50,93 | ||||
| 2026-02-03 | 13F | Mitsubishi UFJ Kokusai Asset Management Co., Ltd. | 64.449 | -0,22 | 8.687 | -7,70 | ||||
| 2026-02-12 | 13F | Elo Mutual Pension Insurance Co | 16.981 | 2.321 | ||||||
| 2026-02-17 | 13F | Equitable Holdings, Inc. | 2.903 | -5,62 | 397 | -11,61 | ||||
| 2026-02-12 | 13F | Principal Securities, Inc. | 0 | -100,00 | 0 | |||||
| 2026-02-05 | 13F | Cambridge Investment Research Advisors, Inc. | 1.605 | -13,62 | 0 | |||||
| 2026-02-05 | 13F | HFM Investment Advisors, LLC | 7 | 0,00 | 1 | -100,00 | ||||
| 2026-02-05 | 13F | Elyxium Wealth, LLC | 41 | 6 | ||||||
| 2026-02-13 | 13F | Verition Fund Management LLC | 2.130 | -61,05 | 291 | -63,44 | ||||
| 2026-02-05 | 13F | High Note Wealth, LLC | 16 | 2 | ||||||
| 2026-01-29 | 13F | Teachers Retirement System Of The State Of Kentucky | 21.034 | 0,00 | 3 | -33,33 | ||||
| 2026-01-30 | 13F | Mitsubishi UFJ Trust & Banking Corp | 30.636 | -12,64 | 4.187 | -18,06 | ||||
| 2026-02-17 | 13F | Worldquant Millennium Advisors Llc | 12.796 | 6,56 | 1.749 | -0,06 | ||||
| 2025-11-12 | 13F | Neo Ivy Capital Management | 0 | -100,00 | 0 | -100,00 | ||||
| 2026-02-10 | 13F | Reinhart Partners, Inc. | 25.504 | -50,60 | 3.486 | -53,68 | ||||
| 2026-02-17 | 13F | Summit Trail Advisors, Llc | 7.761 | 40,45 | 1.061 | 31,68 | ||||
| 2026-02-12 | 13F | Federated Hermes, Inc. | 6.503 | 5,18 | 889 | -1,33 | ||||
| 2026-01-29 | 13F | Dunhill Financial, LLC | 2 | 0 | ||||||
| 2026-02-11 | 13F | Parallel Advisors, LLC | 2.465 | -1,87 | 337 | -8,20 | ||||
| 2026-02-13 | 13F | First Trust Advisors Lp | 59.452 | -57,92 | 8.126 | -60,53 | ||||
| 2026-02-17 | 13F | Brevan Howard Capital Management LP | 0 | -100,00 | 0 | -100,00 | ||||
| 2026-02-11 | 13F | Janney Montgomery Scott LLC | 51.156 | -0,99 | 7 | -14,29 | ||||
| 2026-02-13 | 13F | Commerce Bank | 6.460 | 0,00 | 883 | -6,27 | ||||
| 2026-02-10 | 13F | Gulf International Bank (UK) Ltd | 3.889 | 0,00 | 1 | |||||
| 2026-02-19 | 13F | CI Private Wealth, LLC | 25.151 | 0,12 | 3.420 | -6,58 | ||||
| 2026-02-06 | 13F | Intrust Bank Na | 2.935 | 0,00 | 401 | -6,09 | ||||
| 2025-11-13 | 13F | Glenmede Investment Management, LP | 0 | -100,00 | 0 | |||||
| 2026-01-09 | 13F | SG Americas Securities, LLC | 18.806 | 59,83 | 3 | 100,00 | ||||
| 2026-01-28 | 13F | Klp Kapitalforvaltning As | 26.200 | 0,00 | 3.581 | -6,18 | ||||
| 2026-02-11 | 13F | Zions Bancorporation, National Association /ut/ | 78 | 11 | ||||||
| 2026-02-06 | 13F | Vestmark Advisory Solutions, Inc. | 11.194 | 1.530 | ||||||
| 2026-02-12 | 13F | DRW Securities, LLC | 1.900 | 260 | ||||||
| 2026-02-17 | 13F | Bank Of America Corp /de/ | 237.373 | -18,97 | 32.444 | -23,99 | ||||
| 2026-02-06 | 13F | Resona Asset Management Co.,Ltd. | 19.617 | -4,27 | 2.685 | -9,99 | ||||
| 2026-02-11 | 13F | Hughes Financial Services, LLC | 4 | 0,00 | 1 | |||||
| 2026-02-13 | 13F | Y-Intercept (Hong Kong) Ltd | 7.411 | 1.013 | ||||||
| 2026-01-16 | 13F | Marquette Asset Management, LLC | 16 | 2 | ||||||
| 2026-02-10 | 13F | Axq Capital, Lp | 3.493 | 477 | ||||||
| 2026-02-12 | 13F | Wealthspire Advisors, LLC | 0 | -100,00 | 0 | |||||
| 2026-01-26 | 13F | AE Wealth Management LLC | 6.000 | 77,30 | 820 | 66,33 | ||||
| 2026-02-02 | 13F | Caisse Des Depots Et Consignations | 2.876 | 0,00 | 393 | -6,21 | ||||
| 2026-02-05 | 13F | DnB Asset Management AS | 14.914 | -5,23 | 2.038 | -11,12 | ||||
| 2026-01-20 | 13F | Cromwell Holdings LLC | 11 | 0,00 | 2 | 0,00 | ||||
| 2026-01-22 | 13F | Financial Consulate, Inc | 4 | 0,00 | 1 | |||||
| 2026-02-17 | 13F | Credit Agricole S A | 3.466 | -3,35 | 474 | -9,39 | ||||
| 2026-01-16 | 13F | Applied Capital LLC/FL | 7.034 | 50,20 | 961 | 40,91 | ||||
| 2026-02-11 | 13F | Fox Run Management, L.l.c. | 6.311 | 863 | ||||||
| 2026-02-17 | 13F | Ancora Advisors, LLC | 214 | 29 | ||||||
| 2026-01-21 | 13F | Raleigh Capital Management Inc. | 1 | 0,00 | 0 | |||||
| 2025-11-21 | 13F/A | CIBC Bancorp USA Inc. | 2.852 | 416 | ||||||
| 2026-02-12 | 13F | Triumph Capital Management | 150 | 21 | ||||||
| 2026-02-11 | 13F | Vise Technologies, Inc. | 2.760 | 6,60 | 377 | 0,00 | ||||
| 2026-02-03 | 13F | Sumitomo Mitsui DS Asset Management Company, Ltd | 7.756 | 0,00 | 1.060 | -6,19 | ||||
| 2026-01-15 | 13F | Fifth Third Wealth Advisors LLC | 1.892 | -1,10 | 259 | -7,19 | ||||
| 2025-11-21 | 13F | Forefront Analytics, LLC | 0 | -100,00 | 0 | -100,00 | ||||
| 2026-02-04 | 13F | Shoker Investment Counsel, Inc. | 2.797 | 2,12 | 382 | -4,26 | ||||
| 2026-02-12 | 13F | Scotia Capital Inc. | 0 | -100,00 | 0 | |||||
| 2026-02-11 | 13F | Cerity Partners LLC | 3.442 | 470 | ||||||
| 2026-01-26 | 13F | Heritage Wealth Management, Inc. | 3.456 | -4,16 | 472 | -10,10 | ||||
| 2026-04-01 | 13F | Pensionfund Sabic | 0 | -100,00 | 0 | |||||
| 2026-02-10 | 13F | Goldman Sachs Group Inc | Call | 0 | -100,00 | 0 | -100,00 | |||
| 2026-02-13 | 13F | Bridgefront Capital, LLC | 1.905 | 260 | ||||||
| 2026-01-23 | 13F | Ogorek Anthony Joseph /ny/ /adv | 15 | 0,00 | 0 | |||||
| 2026-02-12 | 13F | Hrt Financial Lp | 22.759 | -37,96 | 3 | -40,00 | ||||
| 2026-02-11 | 13F | LPL Financial LLC | 8.723 | -13,28 | 1.192 | -18,63 | ||||
| 2026-02-13 | 13F | Osmosis Investment Management UK Ltd | 10.238 | 1.399 | ||||||
| 2026-02-17 | 13F | Integrated Advisors Network LLC | 0 | -100,00 | 0 | |||||
| 2026-02-06 | 13F | Larson Financial Group LLC | 4.546 | 2,20 | 621 | -4,17 | ||||
| 2026-02-11 | 13F | SOUTH STATE Corp | 8 | -38,46 | 1 | 0,00 | ||||
| 2026-01-28 | 13F | B. Metzler seel. Sohn & Co. AG | 1.557 | 0,00 | 213 | -6,19 | ||||
| 2026-02-17 | 13F | Freestone Grove Partners LP | 0 | -100,00 | 0 | |||||
| 2026-02-17 | 13F | Jones Financial Companies Lllp | 876 | 1,51 | 120 | -4,80 | ||||
| 2026-02-04 | 13F | Asahi Life Asset Management Co., Ltd. | 2.622 | 358 | ||||||
| 2026-02-10 | 13F | Commonwealth Of Pennsylvania Public School Empls Retrmt Sys | 17.323 | -2,48 | 2.368 | -8,54 | ||||
| 2026-01-29 | 13F | Verdence Capital Advisors LLC | 3.934 | 0,51 | 538 | 3,27 | ||||
| 2026-02-12 | 13F | Xponance, Inc. | 10.018 | -11,36 | 1.369 | -16,83 | ||||
| 2026-02-17 | 13F | State Of Wisconsin Investment Board | 36.037 | 1,15 | 4.926 | -5,12 | ||||
| 2026-02-13 | 13F | American Century Companies Inc | 208.114 | 2,06 | 28.445 | -4,27 | ||||
| 2026-01-27 | 13F | Belpointe Asset Management LLC | 3.856 | -35,01 | 527 | -39,00 | ||||
| 2026-02-13 | 13F | Wells Fargo & Company/mn | 70.661 | 49,20 | 9.658 | 39,94 | ||||
| 2026-02-17 | 13F | SummitTX Capital, L.P. | 0 | -100,00 | 0 | |||||
| 2026-02-13 | 13F | Schroder Investment Management Group | 29.997 | 56,88 | 4.100 | 47,13 | ||||
| 2026-02-13 | 13F | Pathstone Holdings, LLC | 30.002 | -3,77 | 4.101 | -9,75 | ||||
| 2026-02-20 | 13F | Ruggaard & Associates LLC | 0 | -100,00 | 0 | |||||
| 2026-02-06 | 13F | Ironwood Investment Counsel, LLC | 0 | -100,00 | 0 | |||||
| 2026-02-17 | 13F | Schonfeld Strategic Advisors LLC | 1.648 | -93,48 | 225 | -93,89 | ||||
| 2026-01-23 | 13F | Financial Enhancement Group LLC | 12.443 | -1,73 | 1.635 | -12,34 | ||||
| 2026-01-26 | 13F | Provenance Wealth Advisors, LLC | 600 | 0,00 | 82 | -5,75 | ||||
| 2026-01-27 | 13F | Checchi Capital Advisers, LLC | 1.554 | 212 | ||||||
| 2026-02-13 | 13F | Aviso Financial Inc. | 0 | -100,00 | 0 | |||||
| 2026-01-28 | 13F | HB Wealth Management, LLC | 1.833 | 15,79 | 251 | 8,70 | ||||
| 2025-11-12 | 13F | Simplex Trading, Llc | 0 | -100,00 | 0 | |||||
| 2026-02-14 | 13F | Rockefeller Capital Management L.P. | 916 | 28,65 | 125 | 21,36 | ||||
| 2026-01-06 | 13F | Tucker Asset Management Llc | 0 | -100,00 | 0 | -100,00 | ||||
| 2026-02-17 | 13F | Quest Investment Management Llc | 3.436 | -38,65 | 470 | -42,52 | ||||
| 2026-02-13 | 13F | State Street Corp | 2.625.921 | -0,95 | 358.911 | -7,09 | ||||
| 2026-02-13 | 13F | OMERS ADMINISTRATION Corp | 2.973 | -82,82 | 406 | -83,90 | ||||
| 2026-02-09 | 13F | William Blair Investment Management, Llc | 1.642 | -25,19 | 224 | -29,78 | ||||
| 2026-02-17 | 13F | Cambria Investment Management, L.P. | 63.246 | -12,47 | 8.644 | -17,90 | ||||
| 2026-02-17 | 13F | Advisory Services Network, LLC | 0 | -100,00 | 0 | |||||
| 2026-02-13 | 13F | Ostrum Asset Management | 5.317 | -24,90 | 727 | -29,58 | ||||
| 2026-01-16 | 13F | Formidable Asset Management, LLC | 2.560 | 0,00 | 373 | 15,48 | ||||
| 2026-02-12 | 13F | Skopos Labs, Inc. | 2.589 | 29,97 | 357 | 23,10 | ||||
| 2025-11-07 | 13F | Tobam | 0 | -100,00 | 0 | |||||
| 2026-02-10 | 13F | Bridges Investment Management Inc | 106.662 | -0,27 | 14.579 | -6,46 | ||||
| 2026-01-27 | 13F | Tokio Marine Asset Management Co Ltd | 3.398 | 26,98 | 464 | 19,28 | ||||
| 2026-04-07 | 13F | CoreCap Advisors, LLC | 1 | 0 | ||||||
| 2026-02-17 | 13F | Aquatic Capital Management LLC | 23.087 | 437,66 | 3.156 | 404,80 | ||||
| 2026-02-13 | 13F | Dockside LLC | 3.687 | 504 | ||||||
| 2026-01-12 | 13F | Daymark Wealth Partners, Llc | 3.540 | 1,49 | 484 | -4,92 | ||||
| 2026-02-11 | 13F | Jpmorgan Chase & Co | 237.922 | -41,65 | 32.519 | -45,27 | ||||
| 2026-02-17 | 13F | California State Teachers Retirement System | 95.216 | 4,14 | 13.014 | -2,32 | ||||
| 2026-01-14 | 13F | Jfs Wealth Advisors, Llc | 56 | 86,67 | 8 | 75,00 | ||||
| 2026-02-17 | 13F | Adage Capital Partners Gp, L.l.c. | 320.694 | 43.832 | ||||||
| 2026-02-17 | 13F | Janus Henderson Group Plc | 5.190 | 30,08 | 709 | 22,03 | ||||
| 2026-02-06 | 13F | Kingdom Financial Group LLC. | 49 | 7 | ||||||
| 2026-01-21 | 13F | Sound Income Strategies, LLC | 1.465 | 0,00 | 192 | -8,57 | ||||
| 2026-02-17 | 13F | Northern Trust Corp | 958.579 | -6,64 | 131.019 | -12,43 | ||||
| 2026-02-11 | 13F | Manchester Capital Management LLC | 65 | 9 | ||||||
| 2026-02-17 | 13F | Shelton Capital Management | 2.342 | -8,77 | 320 | -14,44 | ||||
| 2026-02-17 | 13F | Private Advisor Group, LLC | 1.481 | 0,07 | 202 | -6,05 | ||||
| 2026-01-16 | 13F | FNY Investment Advisers, LLC | 0 | -100,00 | 0 | |||||
| 2026-02-11 | 13F | Fjarde Ap-fonden /fourth Swedish National Pension Fund | 22.258 | 3.042 | ||||||
| 2026-01-20 | 13F | AdvisorNet Financial, Inc | 150 | 0,00 | 21 | -4,76 | ||||
| 2026-02-17 | 13F | Creative Planning | 39.833 | 8,27 | 5.444 | 1,55 | ||||
| 2026-02-13 | 13F | Marshall Wace, Llp | 3.136 | 429 | ||||||
| 2026-02-02 | 13F | Advisors Preferred, LLC | 1.974 | 266 | ||||||
| 2026-02-13 | 13F | Squarepoint Ops LLC | 21.012 | 2.872 | ||||||
| 2026-02-10 | 13F | Envestnet Asset Management Inc | 30.186 | -13,87 | 4.126 | -19,23 | ||||
| 2026-02-17 | 13F | Philadelphia Financial Management of San Francisco, LLC | 91.610 | 48,38 | 12.521 | 39,18 | ||||
| 2026-04-02 | 13F | Hilltop National Bank | 37 | 0,00 | 5 | -20,00 | ||||
| 2026-02-05 | 13F | Northwestern Mutual Investment Management Company, Llc | 15.488 | 0,39 | 2.117 | -5,87 | ||||
| 2026-01-30 | 13F | State of New Jersey Common Pension Fund D | 18.906 | 0,99 | 2.584 | -5,28 | ||||
| 2026-02-13 | 13F | Prudential Financial Inc | 4.454 | -40,17 | 614 | -43,36 | ||||
| 2026-02-17 | 13F | Cetera Investment Advisers | 9.030 | 1,12 | 1.234 | -5,15 | ||||
| 2026-02-17 | 13F | Investment Management Corp of Ontario | 4.520 | 43,95 | 618 | 35,01 | ||||
| 2026-02-19 | 13F | Invesco Ltd. | 803.509 | -12,87 | 109.824 | -18,28 | ||||
| 2026-02-17 | 13F | Rakuten Investment Management, Inc. | 2.826 | -95,63 | 390 | -98,24 | ||||
| 2026-02-03 | 13F | Everence Capital Management Inc | 2.080 | 0,00 | 0 | |||||
| 2026-02-11 | 13F | O'shaughnessy Asset Management, Llc | 5.141 | 3,50 | 703 | -2,90 | ||||
| 2025-11-14 | 13F | Voloridge Investment Management, Llc | 0 | -100,00 | 0 | |||||
| 2026-02-12 | 13F | Bahl & Gaynor Inc | 0 | -100,00 | 0 | |||||
| 2026-02-02 | 13F | Oppenheimer & Co Inc | 0 | -100,00 | 0 | |||||
| 2025-11-14 | 13F | Ossiam | 0 | -100,00 | 0 | |||||
| 2026-02-09 | 13F | Severin Investments, LLC | 2.214 | -8,47 | 303 | -14,20 | ||||
| 2026-02-17 | 13F | Clear Street Markets Llc | 0 | -100,00 | 0 | |||||
| 2026-02-05 | 13F | Allworth Financial LP | 48.584 | -2,15 | 6.640 | -8,22 | ||||
| 2026-02-12 | 13F | Paradigm Capital Management Inc/ny | 6.450 | 0,00 | 882 | -6,18 | ||||
| 2026-01-23 | 13F | Avion Wealth | 0 | -100,00 | 0 | |||||
| 2026-02-04 | 13F | Independent Advisor Alliance | 2.094 | -6,85 | 286 | -12,54 | ||||
| 2026-02-10 | 13F | Td Asset Management Inc | 38.063 | 7,52 | 5.202 | 0,85 | ||||
| 2026-02-12 | 13F | Rossby Financial, LCC | 30 | 4 | ||||||
| 2026-02-17 | 13F | Aster Capital Management (DIFC) Ltd | 0 | -100,00 | 0 | |||||
| 2026-02-17 | 13F | Raymond James Financial Inc | 16.249 | -0,75 | 2.221 | -6,92 | ||||
| 2026-02-11 | 13F | Lowe Brockenbrough & Co Inc | 0 | -100,00 | 0 | |||||
| 2026-01-20 | 13F/A | Miller Wealth Advisors, Llc | 75 | 0,00 | 10 | 0,00 | ||||
| 2026-02-13 | 13F | Citigroup Inc | 53.700 | 36,63 | 7.340 | 28,15 | ||||
| 2025-11-10 | 13F | Legacy Financial Advisors, Inc. | 0 | -100,00 | 0 | |||||
| 2026-02-13 | 13F | Barclays Plc | 99.904 | -17,75 | 13.655 | -22,85 | ||||
| 2026-04-07 | 13F | Retirement Wealth Solutions LLC | 11 | -65,62 | 1 | -75,00 | ||||
| 2026-01-16 | 13F | Standard Life Aberdeen plc | 12.618 | 17,13 | 1.725 | 10,23 | ||||
| 2026-02-13 | 13F | Seneschal Advisors, LLC | 2 | 0,00 | 0 | |||||
| 2026-02-13 | 13F | Wealth Dimensions Group, Ltd. | 2.049 | -8,20 | 280 | -13,85 | ||||
| 2026-02-17 | 13F | New Vernon Investment Management Llc | 26.240 | 0,00 | 3.586 | -6,20 | ||||
| 2026-04-09 | 13F | FCG Investment Co | 1.568 | -82,78 | 200 | -84,93 | ||||
| 2025-11-17 | 13F | Caxton Associates Llp | 0 | -100,00 | 0 | |||||
| 2026-02-11 | 13F | Rise Advisors, LLC | 0 | -100,00 | 0 | |||||
| 2026-02-02 | 13F | Bay Harbor Wealth Management, LLC | 8 | 33,33 | 1 | |||||
| 2026-02-12 | 13F | BlackRock, Inc. | 7.250.482 | -0,58 | 990.996 | -6,75 | ||||
| 2026-02-17 | 13F | Engineers Gate Manager LP | 2.369 | 324 | ||||||
| 2026-02-05 | 13F | Center for Financial Planning, Inc. | 363 | 0,00 | 50 | -5,77 | ||||
| 2026-02-17 | 13F | Ameriprise Financial Inc | 437.141 | -0,66 | 59.750 | -6,82 | ||||
| 2026-03-06 | 13F | Hsbc Holdings Plc | 97.590 | 72,11 | 13.346 | 61,63 | ||||
| 2026-01-29 | 13F | Quent Capital, LLC | 317 | -0,31 | 43 | -6,52 | ||||
| 2026-01-23 | 13F | State of Alaska, Department of Revenue | 7.725 | -5,85 | 1 | 0,00 | ||||
| 2026-02-06 | 13F | New Millennium Group LLC | 0 | -100,00 | 0 | |||||
| 2026-01-28 | 13F | Universal- Beteiligungs- und Servicegesellschaft mbH | 150.354 | 4,29 | 20.037 | -4,62 | ||||
| 2026-02-10 | 13F | DT Investment Partners, LLC | 260 | 0,00 | 36 | -5,41 | ||||
| 2026-02-11 | 13F | EULAV Asset Management | 498.692 | 0,00 | 68.161 | -6,20 | ||||
| 2026-02-13 | 13F | MAI Capital Management | 982 | 62,85 | 134 | 54,02 | ||||
| 2026-02-13 | 13F/A | Ontario Teachers Pension Plan Board | 0 | -100,00 | 0 | -100,00 | ||||
| 2026-02-13 | 13F | Hudson Bay Capital Management LP | 76.121 | 10.404 | ||||||
| 2026-02-13 | 13F | Mariner, LLC | 15.171 | 63,43 | 2.076 | 53,48 | ||||
| 2026-02-12 | 13F | Voya Investment Management Llc | 6.802 | 1,08 | 930 | -5,20 | ||||
| 2026-01-21 | 13F | Stone House Investment Management, LLC | 77 | 11 | ||||||
| 2026-02-17 | 13F | Laird Norton Trust Company, Llc | 1.623 | 222 | ||||||
| 2025-11-13 | 13F | Jump Financial, LLC | 0 | -100,00 | 0 | |||||
| 2026-01-26 | 13F | Private Trust Co Na | 171 | -16,59 | 23 | -20,69 | ||||
| 2026-02-12 | 13F | Federation des caisses Desjardins du Quebec | 38.921 | 1,07 | 5.319 | -5,20 | ||||
| 2026-04-10 | 13F | Viking Fund Management Llc | 101.000 | 0,00 | 12.899 | -6,56 | ||||
| 2026-02-17 | 13F | Gotham Asset Management, LLC | 142.667 | 15,51 | 19.500 | 8,35 | ||||
| 2026-02-06 | 13F | Abn Amro Investment Solutions | 19.890 | -21,94 | 2.719 | -26,78 | ||||
| 2026-02-12 | 13F | State Board Of Administration Of Florida Retirement System | 59.974 | 0,00 | 8.197 | -6,20 | ||||
| 2026-02-17 | 13F | Price T Rowe Associates Inc /md/ | 57.260 | 4,47 | 8 | 0,00 | ||||
| 2026-02-10 | 13F/A | Northwestern Mutual Wealth Management Co | 10.907 | 4,85 | 1.491 | -1,65 | ||||
| 2026-02-13 | 13F | JustInvest LLC | 12.183 | -3,38 | 1.665 | -9,36 | ||||
| 2026-02-11 | 13F | Erste Asset Management GmbH | 0 | 0 | ||||||
| 2026-02-17 | 13F | Public Employees Retirement System Of Ohio | 21.447 | -3,40 | 2.931 | -9,40 | ||||
| 2026-02-03 | 13F | Generali Asset Management SPA SGR | 0 | -100,00 | 0 | |||||
| 2026-02-17 | 13F | London Co Of Virginia | 0 | -100,00 | 0 | |||||
| 2026-02-10 | 13F | Daiwa Securities Group Inc. | 5.674 | 0,00 | 1 | |||||
| 2026-02-13 | 13F | Van Eck Associates Corp | 11.474 | 3,03 | 2 | 0,00 | ||||
| 2026-01-30 | 13F | Arlington Trust Co LLC | 0 | -100,00 | 0 | |||||
| 2026-02-06 | 13F | Tortoise Investment Management, LLC | 0 | -100,00 | 0 | |||||
| 2026-02-12 | 13F | APG Asset Management N.V. | 39.389 | -5,09 | 4.584 | -10,92 | ||||
| 2026-01-29 | 13F | Concord Wealth Partners | 28 | 0,00 | 4 | -25,00 | ||||
| 2026-02-03 | 13F | SBI Securities Co., Ltd. | 55 | -11,29 | 8 | -22,22 | ||||
| 2026-02-09 | 13F | Coldstream Capital Management Inc | 3.823 | 0,87 | 523 | -5,43 | ||||
| 2026-02-17 | 13F | Utah Retirement Systems | 10.911 | 0,00 | 1.491 | -6,17 | ||||
| 2026-02-13 | 13F | Treasurer of the State of North Carolina | 27.703 | -6,81 | 4 | -25,00 | ||||
| 2026-01-27 | 13F | Forum Financial Management, LP | 2.283 | 0,04 | 312 | -6,02 | ||||
| 2026-01-21 | 13F | Capital Advisors, Ltd. LLC | 1 | 0,00 | 0 | |||||
| 2026-01-23 | 13F | Assetmark, Inc | 156 | 57,58 | 21 | 50,00 | ||||
| 2026-01-08 | 13F | Nordea Investment Management Ab | 6.193 | 0,00 | 850 | -5,97 | ||||
| 2026-02-17 | 13F | Mercer Global Advisors Inc /adv | 6.127 | -0,37 | 837 | -6,58 | ||||
| 2026-02-11 | 13F | Tiaa Trust, National Association | 2.399 | 3,27 | 328 | -3,25 | ||||
| 2026-02-13 | 13F | Victory Capital Management Inc | 2.803.850 | -5,40 | 383.230 | -11,27 | ||||
| 2026-01-28 | 13F | WPG Advisers, LLC | 20 | -58,33 | 3 | -66,67 | ||||
| 2026-01-13 | 13F | Fort Washington Investment Advisors Inc /oh/ | 614.129 | 1,08 | 83.939 | -5,19 | ||||
| 2026-02-12 | 13F | Brown Brothers Harriman & Co | 677 | 0,00 | 93 | -6,12 | ||||
| 2026-02-02 | 13F | Highland Capital Management, Llc | 2.065 | -3,64 | 282 | -9,62 | ||||
| 2026-02-05 | 13F | Eubel Brady & Suttman Asset Management Inc | 3.876 | 1 | ||||||
| 2026-02-13 | 13F | Natixis | 1.672 | -86,20 | 229 | -87,08 | ||||
| 2026-02-13 | 13F | Rhumbline Advisers | 206.961 | -3,13 | 28.287 | -9,14 | ||||
| 2026-02-13 | 13F | Macquarie Group Ltd | 39.067 | -8,24 | 5.340 | -13,94 | ||||
| 2026-02-10 | 13F | SBI Okasan Asset Management Co.Ltd. | 4.900 | 676 | ||||||
| 2026-02-12 | 13F | Mount Yale Investment Advisors, LLC | 11.284 | 2,36 | 1.542 | -3,99 | ||||
| 2026-02-12 | 13F | Great Valley Advisor Group, Inc. | 1.724 | 0,00 | 236 | -6,37 | ||||
| 2026-02-04 | 13F | HORAN Wealth, LLC | 2.792 | 2,05 | 382 | -4,27 | ||||
| 2026-04-06 | 13F | Versant Capital Management, Inc | 62 | 5,08 | 8 | -12,50 | ||||
| 2026-02-03 | 13F | Farmers & Merchants Investments Inc | 61 | 0,00 | 8 | 0,00 | ||||
| 2025-11-14 | 13F | Texas Permanent School Fund | 0 | -100,00 | 0 | -100,00 | ||||
| 2026-01-28 | 13F | DekaBank Deutsche Girozentrale | 6.913 | 0,00 | 1 | |||||
| 2026-04-06 | 13F | GAMMA Investing LLC | 2.423 | -16,16 | 309 | -21,77 | ||||
| 2026-02-02 | 13F | Principal Financial Group Inc | 153.440 | -3,02 | 20.972 | -9,04 | ||||
| 2026-02-03 | 13F | ASR Vermogensbeheer N.V. | 2.537 | -1,17 | 347 | -7,49 | ||||
| 2026-02-06 | 13F | Pnc Financial Services Group, Inc. | 6.764 | -0,69 | 925 | -6,85 | ||||
| 2026-02-09 | 13F | Atlantic Trust, LLC | 129 | 0,00 | 18 | -5,56 | ||||
| 2026-02-09 | 13F | Employees Retirement System of Texas | 0 | -100,00 | 0 | |||||
| 2025-10-15 | 13F | Stephens Consulting, LLC | 0 | -100,00 | 0 | |||||
| 2026-02-17 | 13F | D. E. Shaw & Co., Inc. | 41.716 | 5.702 | ||||||
| 2026-02-13 | 13F | Cornerstone Financial Management LLC | 25 | 3 | ||||||
| 2026-02-17 | 13F | Holocene Advisors, LP | 28.983 | -32,91 | 3.961 | -37,07 | ||||
| 2026-02-24 | 13F | Bell Investment Advisors, Inc | 4 | 0,00 | 1 | |||||
| 2026-01-15 | 13F | Mn Services Vermogensbeheer B.V. | 25.290 | 1,16 | 3 | 0,00 | ||||
| 2026-02-02 | 13F | Cornerstone Planning Group LLC | 90 | 1,12 | 12 | 0,00 | ||||
| 2026-02-17 | 13F | FIL Ltd | 125.000 | 0,00 | 17.085 | -6,20 | ||||
| 2026-02-09 | 13F | Hantz Financial Services, Inc. | 1.161 | 36,27 | 0 | |||||
| 2026-02-17 | 13F | SageView Advisory Group, LLC | 196 | 27 | ||||||
| 2026-02-02 | 13F | PFA Pension, Forsikringsaktieselskab | 88.356 | 12.182 | ||||||
| 2026-02-13 | 13F | Colony Group, LLC | 13.777 | 11,30 | 1.883 | 8,09 | ||||
| 2026-01-14 | 13F | AA Financial Advisors, LLC | 0 | -100,00 | 0 | |||||
| 2025-10-30 | 13F | Twin Peaks Wealth Advisors, LLC | 0 | -100,00 | 0 | |||||
| 2026-02-12 | 13F | Campbell & CO Investment Adviser LLC | 29.857 | 4.081 | ||||||
| 2026-02-13 | 13F | National Bank Of Canada /fi/ | 997 | 26,52 | 136 | 19,30 | ||||
| 2025-11-14 | 13F | AXA Investment Managers S.A. | 19.265 | 2.807 | ||||||
| 2026-01-27 | 13F | TD Waterhouse Canada Inc. | 823 | 10,03 | 112 | 2,75 | ||||
| 2026-02-11 | 13F | M Holdings Securities, Inc. | 14.598 | 4,91 | 2 | -50,00 | ||||
| 2026-02-09 | 13F | Smithfield Trust Co | 260 | 0,00 | 0 | |||||
| 2026-01-23 | 13F | Kellett Schaffner Wealth Advisors LLC | 2.721 | 2,10 | 372 | -4,38 | ||||
| 2026-02-03 | 13F | Ethic Inc. | 12.154 | 10,49 | 1.661 | 3,68 | ||||
| 2026-01-30 | 13F | Us Bancorp \de\ | 8.683 | -0,21 | 1.187 | -6,39 | ||||
| 2026-02-12 | 13F | New York State Common Retirement Fund | 34.309 | 0,00 | 4.689 | -6,20 | ||||
| 2026-01-29 | 13F | James Investment Research Inc | 2.992 | 0,00 | 409 | -6,21 | ||||
| 2026-01-20 | 13F | JB Capital LLC | 4.268 | 2,13 | 583 | -4,27 | ||||
| 2026-02-17 | 13F | Fmr Llc | 6.677.603 | -3,41 | 912.695 | -9,40 | ||||
| 2026-01-15 | 13F | Frank, Rimerman Advisors LLC | 15.416 | 0,00 | 2.107 | -6,19 | ||||
| 2026-01-23 | 13F | Sumitomo Mitsui Trust Holdings, Inc. | 146.731 | -2,75 | 20.055 | -8,78 | ||||
| 2026-02-10 | 13F | Nomura Asset Management Co Ltd | 27.279 | 0,00 | 3.728 | -6,21 | ||||
| 2026-02-12 | 13F | Cibc World Markets Corp | 5.925 | 112,59 | 810 | 130,48 | ||||
| 2026-02-17 | 13F | Citadel Advisors Llc | 87.014 | 435,70 | 11.893 | 402,66 | ||||
| 2026-01-15 | 13F | Fortitude Family Office, LLC | 30 | -3,23 | 4 | 0,00 | ||||
| 2026-02-17 | 13F | Citadel Advisors Llc | Put | 8.700 | -59,15 | 1.189 | -61,68 | |||
| 2026-02-17 | 13F | Citadel Advisors Llc | Call | 5.800 | -41,41 | 793 | -45,08 | |||
| 2026-02-17 | 13F | Nissay Asset Management Corp /japan/ /adv | 8.612 | 0,29 | 1.177 | -5,92 | ||||
| 2026-02-17 | 13F | Glenmede Trust Co Na | 0 | -100,00 | 0 | |||||
| 2026-02-10 | 13F | New Mexico Educational Retirement Board | 14.300 | 0,00 | 2 | -50,00 | ||||
| 2026-02-13 | 13F | Umb Bank N A/mo | 943 | 15,99 | 129 | 8,47 | ||||
| 2026-02-17 | 13F | Jain Global LLC | 131.619 | 17.990 | ||||||
| 2025-11-14 | 13F | Two Sigma Advisers, Lp | 0 | -100,00 | 0 | |||||
| 2026-02-12 | 13F | Steward Partners Investment Advisory, Llc | 86 | 1,18 | 12 | -8,33 | ||||
| 2026-04-08 | 13F | Legacy Wealth Asset Management, LLC | 3.535 | 51,46 | 451 | 41,38 | ||||
| 2026-02-13 | 13F | BRITISH COLUMBIA INVESTMENT MANAGEMENT Corp | 11.842 | 23,26 | 1.619 | 15,65 | ||||
| 2026-02-02 | 13F | Strs Ohio | 1.584 | 0,19 | 217 | -6,09 | ||||
| 2026-02-17 | 13F | Russell Investments Group, Ltd. | 89.991 | 92,44 | 12.353 | 81,55 | ||||
| 2025-11-14 | 13F | Stenahm Asset Managment Ltd | 0 | -100,00 | 0 | |||||
| 2026-02-12 | 13F | Advisors Asset Management, Inc. | 1.736 | -22,12 | 237 | -26,85 | ||||
| 2026-02-13 | 13F | Alyeska Investment Group, L.P. | 207.122 | 107,12 | 28.309 | 94,27 | ||||
| 2026-01-28 | 13F | Arizona State Retirement System | 18.306 | -7,62 | 2.502 | -13,34 | ||||
| 2026-02-10 | 13F | MUFG Securities EMEA plc | 25.000 | 3.417 | ||||||
| 2026-02-03 | 13F | Sequoia Financial Advisors, LLC | 7.587 | 33,69 | 1.037 | 25,42 | ||||
| 2026-02-10 | 13F | Bruce G. Allen Investments, LLC | 56 | 27,27 | 8 | 16,67 | ||||
| 2026-02-17 | 13F | Beacon Investment Advisors Llc | 2.000 | 0,00 | 273 | -6,19 | ||||
| 2026-02-10 | 13F | Intech Investment Management Llc | 16.052 | 42,48 | 2.194 | 33,64 | ||||
| 2026-04-10 | 13F | Oak Thistle LLC | 0 | -100,00 | 0 | |||||
| 2026-02-12 | 13F | Commonwealth Equity Services, Llc | 17.641 | 0,69 | 2.411 | 120.450,00 | ||||
| 2026-02-12 | 13F | BRYN MAWR TRUST Co | 3.151 | -6,80 | 431 | -12,60 | ||||
| 2026-01-27 | 13F | Asset Management One Co., Ltd. | 31.948 | -17,55 | 4.406 | -21,96 | ||||
| 2026-02-03 | 13F | Stevens Capital Management Lp | 0 | -100,00 | 0 | |||||
| 2026-04-06 | 13F | Acima Private Wealth, Llc | 1.371 | 0,00 | 175 | -6,42 | ||||
| 2026-02-10 | 13F | State of Wyoming | 0 | -100,00 | 0 | |||||
| 2026-01-28 | 13F | Boston Trust Walden Corp | 469.645 | -13,55 | 64.191 | -18,92 | ||||
| 2026-02-03 | 13F | Ballentine Partners, LLC | 1.520 | -27,96 | 208 | -32,57 | ||||
| 2026-02-13 | 13F | Manufacturers Life Insurance Company, The | 0 | -100,00 | 0 | |||||
| 2026-04-07 | 13F | Signaturefd, Llc | 1.177 | -1,75 | 150 | -7,98 | ||||
| 2026-02-17 | 13F | Point72 Asset Management, L.P. | 0 | -100,00 | 0 | |||||
| 2025-11-13 | 13F | Baird Financial Group, Inc. | 0 | -100,00 | 0 | |||||
| 2026-02-13 | 13F | Neuberger Berman Group LLC | 3.906 | 10,87 | 534 | 3,90 | ||||
| 2026-02-11 | 13F | Brandywine Global Investment Management, LLC | 102.223 | 14,38 | 13.972 | 7,28 | ||||
| 2026-01-29 | 13F | UBS Group AG | 581.805 | 10,11 | 79.521 | 3,28 | ||||
| 2026-02-13 | 13F | Wbi Investments, Inc. | 0 | -100,00 | 0 | |||||
| 2026-01-23 | 13F | Burney Co/ | 30.878 | 2,08 | 4.220 | -4,26 | ||||
| 2026-02-13 | 13F | Mml Investors Services, Llc | 3.326 | 17,48 | 455 | 10,19 | ||||
| 2026-01-20 | 13F | Family Legacy Financial Solutions, LLC | 0 | -100,00 | 0 | |||||
| 2026-02-17 | 13F | Optiver Holding B.V. | 180 | 25 | ||||||
| 2026-01-29 | 13F | UMA Financial Services, Inc. | 31 | -3,12 | 4 | 0,00 | ||||
| 2025-10-27 | 13F | Bogart Wealth, LLC | 0 | -100,00 | 0 | |||||
| 2026-01-12 | 13F | CVA Family Office, LLC | 14 | 40,00 | 2 | 0,00 | ||||
| 2026-02-13 | 13F | Charles Schwab Investment Management Inc | 2.567.721 | 2,28 | 350.956 | -4,06 | ||||
| 2026-01-23 | 13F | Optima Capital Llc | 16 | 2 | ||||||
| 2026-01-21 | 13F | Leo Wealth, LLC | 2.066 | 7,60 | 282 | 1,08 | ||||
| 2026-02-03 | 13F | Crossmark Global Holdings, Inc. | 4.589 | 1,62 | 627 | -4,71 | ||||
| 2026-02-12 | 13F | Nuveen, LLC | 92.246 | 3,58 | 12.608 | -2,84 | ||||
| 2026-01-27 | 13F | Zurcher Kantonalbank (Zurich Cantonalbank) | 16.422 | -0,30 | 2.245 | -6,50 | ||||
| 2025-11-14 | 13F | Lazard Asset Management Llc | 0 | -100,00 | 0 | |||||
| 2026-02-17 | 13F | Royal Bank Of Canada | 81.270 | -52,32 | 11.108 | -55,28 | ||||
| 2026-02-12 | 13F | MetLife Investment Management, LLC | 33.774 | -4,93 | 4.616 | -10,82 | ||||
| 2026-01-14 | 13F | Spire Wealth Management | 7 | 16,67 | 1 | |||||
| 2026-02-06 | 13F | Bare Financial Services, Inc | 5 | 0,00 | 1 | |||||
| 2026-01-23 | 13F | Stephenson National Bank & Trust | 706 | 96 | ||||||
| 2026-02-13 | 13F | Bank Of Nova Scotia | 4.726 | 31,97 | 646 | 23,80 | ||||
| 2025-11-06 | 13F | Whipplewood Advisors, LLC | 0 | -100,00 | 0 | |||||
| 2026-01-27 | 13F | Journey Advisory Group, LLC | 4.845 | -3,66 | 662 | -9,56 | ||||
| 2026-02-17 | 13F | Lighthouse Investment Partners, LLC | 137.193 | 239,03 | 18.752 | 218,03 | ||||
| 2026-02-13 | 13F | Ubs Asset Management Americas Inc | 393.544 | -3,35 | 53.790 | -9,34 | ||||
| 2026-02-02 | 13F | Souders Financial Advisors | 1.480 | 1,37 | 202 | -4,72 | ||||
| 2026-02-09 | 13F | Catalyst Funds Management Pty Ltd | 0 | -100,00 | 0 | |||||
| 2026-02-17 | 13F | Advisor Group Holdings, Inc. | 11.998 | -21,72 | 1.640 | -24,11 | ||||
| 2026-01-30 | 13F | New York State Teachers Retirement System | 69.324 | 0,00 | 9 | -10,00 | ||||
| 2026-02-02 | 13F | Fifth Third Bancorp | 5.916 | 20,34 | 809 | 12,85 | ||||
| 2026-02-17 | 13F | Ameriflex Group, Inc. | 1 | -50,00 | 0 | |||||
| 2026-01-14 | 13F | Exchange Traded Concepts, Llc | 5.660 | -2,78 | 774 | -8,84 | ||||
| 2026-02-03 | 13F | Koshinski Asset Management, Inc. | 1.716 | 0,59 | 235 | -5,65 | ||||
| 2026-01-15 | 13F | Retirement Systems of Alabama | 162.582 | -0,37 | 22.222 | -6,55 | ||||
| 2026-02-13 | 13F | Pin Oak Investment Advisors Inc | 1.125 | 0,00 | 0 | -100,00 | ||||
| 2026-01-07 | 13F | Massmutual Trust Co Fsb/adv | 85 | 0,00 | 12 | -8,33 | ||||
| 2026-01-08 | 13F | Dagco, Inc. | 651 | 2,20 | 89 | -4,35 | ||||
| 2026-02-09 | 13F | New Age Alpha Advisors, LLC | 36.999 | 7,26 | 5.057 | 0,62 | ||||
| 2026-02-11 | 13F | Vestcor Inc | 1.411 | 92,23 | 0 | |||||
| 2026-01-30 | 13F/A | M&t Bank Corp | 3.801 | 20,70 | 519 | 13,32 | ||||
| 2026-02-12 | 13F | Bank Of Nova Scotia Trust Co | 2.818 | 385 | ||||||
| 2026-02-13 | 13F | Lord, Abbett & Co. Llc | 380.367 | -9,21 | 52 | -16,39 | ||||
| 2026-02-10 | 13F | Principia Wealth Advisory, LLC | 1 | 0 | ||||||
| 2026-02-12 | 13F | Ensign Peak Advisors, Inc | 3.396 | -66,03 | 464 | -68,13 | ||||
| 2026-01-23 | 13F | Halbert Hargrove Global Advisors, Llc | 65 | 0,00 | 9 | -11,11 | ||||
| 2026-02-10 | 13F | CIBC Asset Management Inc | 7.575 | 45,70 | 1.035 | 36,72 | ||||
| 2025-10-24 | 13F | Hemington Wealth Management | 147 | 10,53 | 0 | |||||
| 2026-01-26 | 13F | Valmark Advisers, Inc. | 8.222 | 0,00 | 1.124 | -6,26 | ||||
| 2026-02-13 | 13F | Pinnacle Wealth Planning Services, Inc. | 66 | 9 | ||||||
| 2026-02-18 | 13F | GWM Advisors LLC | 27 | 22,73 | 4 | 0,00 | ||||
| 2026-02-13 | 13F | 1832 Asset Management L.P. | 369.818 | 5.655,03 | 50.547 | 5.300,21 | ||||
| 2025-10-28 | 13F | Leavell Investment Management, Inc. | 0 | -100,00 | 0 | -100,00 | ||||
| 2026-02-11 | 13F | Westerkirk Capital Inc. | 1.300 | 0,00 | 178 | -6,35 | ||||
| 2026-02-11 | 13F | Franklin Resources Inc | 21.444 | -7,15 | 2.931 | -16,50 | ||||
| 2026-01-27 | 13F | WealthCollab, LLC | 40 | 0,00 | 5 | 0,00 | ||||
| 2026-02-04 | 13F | Securian Asset Management, Inc | 4.984 | -3,86 | 681 | -9,80 | ||||
| 2026-02-12 | 13F | Cloud Capital Management, LLC | 0 | -100,00 | 0 | |||||
| 2026-02-17 | 13F | Toronto Dominion Bank | 10.681 | -1,65 | 1.460 | -7,77 | ||||
| 2025-11-06 | 13F | Stratos Wealth Partners, LTD. | 0 | -100,00 | 0 | |||||
| 2026-02-12 | 13F | IFM Investors Pty Ltd | 12.256 | 0,12 | 2 | -99,94 | ||||
| 2026-01-23 | 13F | Westside Investment Management, Inc. | 32 | 4 | ||||||
| 2026-02-06 | 13F | HighTower Advisors, LLC | 13.729 | 10,37 | 1.876 | 3,53 | ||||
| 2026-01-26 | 13F | KBC Group NV | 15.509 | 0,31 | 2 | 0,00 | ||||
| 2026-02-10 | 13F | Norges Bank | 838.902 | 114.661 | ||||||
| 2026-01-29 | 13F | Pictet Asset Management Holding SA | 26.046 | -26,50 | 3.560 | -31,07 | ||||
| 2026-02-10 | 13F | Sarver Vrooman Wealth Advisors | 289 | -37,58 | 40 | -41,79 | ||||
| 2026-02-13 | 13F | Johnson Investment Counsel Inc | 0 | -100,00 | 0 | |||||
| 2026-02-05 | 13F | North Dakota State Investment Board | 2.339 | 320 | ||||||
| 2026-02-10 | 13F | Bank of New York Mellon Corp | 819.034 | -5,99 | 111.946 | -11,83 | ||||
| 2026-02-09 | 13F | Jefferies Financial Group Inc. | 0 | -100,00 | 0 | |||||
| 2026-01-27 | 13F | Evergreen Capital Management Llc | 4.127 | 72,53 | 564 | 62,07 | ||||
| 2026-02-06 | 13F | Addison Advisors LLC | 11 | 57,14 | 2 | 0,00 | ||||
| 2025-11-14 | 13F | Point72 Asia (Singapore) Pte. Ltd. | 394 | 57 | ||||||
| 2026-01-21 | 13F | Greenleaf Trust | 1.554 | -0,26 | 212 | -6,61 | ||||
| 2026-02-12 | 13F | American Financial Group Inc 401(k) Retirement & Savings Plan | 2.391.286 | -0,68 | 326.841 | -6,84 | ||||
| 2026-02-03 | 13F | Nordwand Advisors, LLC | 13.875 | 0,47 | 1.896 | -5,77 | ||||
| 2026-02-12 | 13F | Custom Index Systems, Llc | 2.793 | -48,02 | 382 | -51,28 | ||||
| 2026-02-11 | 13F | Los Angeles Capital Management Llc | 343 | 45 | ||||||
| 2026-02-13 | 13F | Korea Investment CORP | 15.088 | 0,00 | 2.062 | -6,19 | ||||
| 2026-02-10 | 13F | Bnp Paribas Arbitrage, Sa | 52.215 | -54,55 | 7.137 | -57,37 | ||||
| 2026-02-12 | 13F | Bank Of Montreal /can/ | 30.723 | -58,79 | 4.199 | -61,35 | ||||
| 2026-01-28 | 13F | Teacher Retirement System Of Texas | 2.211 | -74,73 | 302 | -76,31 | ||||
| 2026-02-11 | 13F | Vestor Capital, Llc | 600.641 | 100.006,83 | 0 | |||||
| 2026-02-17 | 13F | Amundi | 146.801 | -2,82 | 20.065 | -10,09 | ||||
| 2026-01-22 | 13F | Bartlett & Co. Wealth Management Llc | 751 | 40,11 | 103 | 30,77 | ||||
| 2026-02-10 | 13F | Fideuram Asset Management (Ireland) dac | 61 | 8 | ||||||
| 2026-02-13 | 13F | Royal London Asset Management Ltd | 9.513 | -1,97 | 1.300 | -8,06 | ||||
| 2026-02-17 | 13F | Atom Investors LP | 0 | -100,00 | 0 | |||||
| 2025-11-06 | 13F | Ameritas Advisory Services, LLC | 0 | -100,00 | 0 | |||||
| 2026-02-17 | 13F | Lombard Odier Asset Management (USA) Corp | 0 | -100,00 | 0 | |||||
| 2026-02-13 | 13F | Public Employees Retirement Association Of Colorado | 7.137 | 0,00 | 1 | -100,00 | ||||
| 2026-02-13 | 13F | Capula Management Ltd | 17.717 | 23,69 | 2.422 | 16,00 | ||||
| 2026-02-02 | 13F | Sachetta, LLC | 14 | 0,00 | 2 | -50,00 | ||||
| 2026-01-09 | 13F | Diversified Trust Co | 2.213 | -3,11 | 302 | -9,04 | ||||
| 2026-02-09 | 13F | Geode Capital Management, Llc | 1.732.557 | 1,75 | 236.645 | -4,56 | ||||
| 2025-10-21 | 13F | Jarislowsky, Fraser Ltd | 369.784 | -0,96 | 53.885 | 14,35 | ||||
| 2026-02-18 | 13F | State of Tennessee, Treasury Department | 28.143 | -4,11 | 3.666 | -14,27 | ||||
| 2026-01-22 | 13F | Networth Advisors, LLC | 8 | 1 | ||||||
| 2026-02-17 | 13F | Man Group plc | 199.354 | 0,42 | 27.248 | -5,81 | ||||
| 2026-01-26 | 13F | Merit Financial Group, LLC | 2.563 | 5,26 | 350 | -1,13 | ||||
| 2025-11-14 | 13F | WealthTrak Capital Management LLC | 0 | -100,00 | 0 | |||||
| 2026-01-16 | 13F | Ronald Blue Trust, Inc. | 1.003 | 4,05 | 137 | -2,14 | ||||
| 2026-02-06 | 13F | Lloyd Advisory Services, LLC. | 91 | 12 | ||||||
| 2026-02-11 | 13F | MCF Advisors LLC | 4.768 | 7,92 | 652 | 1,24 | ||||
| 2025-10-15 | 13F | Net Worth Advisory Group | 0 | -100,00 | 0 | |||||
| 2026-02-06 | 13F | Lsv Asset Management | 0 | -100,00 | 0 | |||||
| 2025-11-04 | 13F | Pineridge Advisors LLC | 0 | -100,00 | 0 | |||||
| 2026-02-06 | 13F | Covestor Ltd | 87 | -3,33 | 0 | |||||
| 2026-02-12 | 13F | Compass Capital Corp /ma/ /adv | 0 | -100,00 | 0 | |||||
| 2026-01-14 | 13F | Enterprise Financial Services Corp | 1.687 | 0,00 | 231 | -6,12 | ||||
| 2026-02-09 | 13F | Legal & General Group Plc | 237.514 | -6,77 | 32.463 | -12,55 | ||||
| 2026-02-10 | 13F | Verity & Verity, LLC | 12.646 | 0,00 | 1.728 | -6,19 | ||||
| 2026-02-11 | 13F | Deutsche Bank Ag\ | 131.637 | 38,75 | 17.992 | 30,14 | ||||
| 2026-01-23 | 13F | Private Wealth Management Group, LLC | 21 | 0,00 | 3 | -33,33 | ||||
| 2026-02-09 | 13F | Huntington National Bank | 24 | 242,86 | 3 | 200,00 | ||||
| 2026-02-17 | 13F | Numerai GP LLC | 0 | -100,00 | 0 | |||||
| 2026-02-11 | 13F | Prudential Plc | 1.499 | 0,00 | 205 | -6,42 | ||||
| 2026-01-29 | 13F | Comerica Bank | 17.614 | -7,01 | 2.408 | -12,79 | ||||
| 2026-02-03 | 13F | S-Bank Fund Management Ltd | 2.959 | -34,88 | 404 | -38,97 | ||||
| 2026-01-30 | 13F | Kohmann Bosshard Financial Services, LLC | 50 | 7 | ||||||
| 2026-02-12 | 13F | Ci Investments Inc. | 0 | -100,00 | 0 | |||||
| 2026-02-05 | 13F | New York Life Investment Management Llc | 6.644 | 908 | ||||||
| 2026-01-26 | 13F | Taylor Frigon Capital Management LLC | 12.008 | 8,65 | 1.641 | 1,93 | ||||
| 2026-02-06 | 13F | EverSource Wealth Advisors, LLC | 918 | 3,85 | 125 | -2,34 | ||||
| 2026-02-04 | 13F | Oregon Public Employees Retirement Fund | 13.806 | -0,72 | 1.887 | -6,86 | ||||
| 2026-02-12 | 13F | Brinker Capital Investments, LLC | 2.236 | 17,50 | 306 | 10,11 | ||||
| 2026-02-05 | 13F | Amalgamated Bank | 30.514 | -2,96 | 4 | 0,00 | ||||
| 2026-02-17 | 13F | RMB Capital Management, LLC | 127.884 | -2,43 | 17.479 | -8,48 | ||||
| 2026-02-03 | 13F | F/M Investments LLC | 2.626 | 0,00 | 359 | -6,28 | ||||
| 2026-01-30 | 13F | Values First Advisors, Inc. | 13.473 | -2,25 | 1.842 | -8,32 | ||||
| 2026-02-13 | 13F | Sei Investments Co | 19.826 | -15,96 | 2.710 | -21,18 | ||||
| 2026-02-17 | 13F | NorthRock Partners, LLC | 2.512 | -38,10 | 343 | -41,96 | ||||
| 2026-02-10 | 13F | Eurizon Capital SGR S.p.A. | 7.644 | 1.046 | ||||||
| 2025-12-16 | 13F | Garde Capital, Inc. | 0 | -100,00 | 0 | |||||
| 2026-02-11 | 13F | Deseret Mutual Benefit Administrators | 204 | 0,00 | 28 | -6,90 | ||||
| 2026-02-12 | 13F | California Public Employees Retirement System | 145.768 | 0,76 | 19.924 | -5,49 | ||||
| 2026-01-15 | 13F | Lodestone Wealth Management LLC | 65 | 9 | ||||||
| 2026-01-26 | 13F | Slagle Financial, LLC | 14.604 | -0,35 | 1.996 | -6,51 | ||||
| 2026-01-30 | 13F | Turning Point Benefit Group, Inc. | 9 | 1 | ||||||
| 2026-02-13 | 13F | Great West Life Assurance Co /can/ | 66.774 | -1,49 | 9 | 0,00 | ||||
| 2026-02-17 | 13F | Gillson Capital LP | 0 | -100,00 | 0 | |||||
| 2026-02-13 | 13F | Quarry LP | 380 | 52 | ||||||
| 2026-02-09 | 13F | Harbour Investments, Inc. | 2 | 0 | ||||||
| 2026-02-17 | 13F | Delaware Management Holdings, Inc. | 31.935 | 4.365 | ||||||
| 2026-04-08 | 13F | Wealth Enhancement Advisory Services, Llc | 7.910 | -15,24 | 1.026 | -16,92 | ||||
| 2026-02-13 | 13F | Kestra Advisory Services, LLC | 2.781 | 380 | ||||||
| 2026-02-13 | 13F | Police & Firemen's Retirement System of New Jersey | 27.991 | -4,68 | 3.826 | -10,61 | ||||
| 2026-02-02 | 13F | Qrg Capital Management, Inc. | 6.337 | 6,72 | 866 | 0,12 | ||||
| 2026-02-06 | 13F | Meiji Yasuda Asset Management Co Ltd. | 3.390 | 0,00 | 463 | -6,09 | ||||
| 2026-01-22 | 13F | Ifrah Financial Services, Inc. | 5.659 | -1,34 | 773 | -7,43 | ||||
| 2026-04-06 | 13F | Highline Wealth Partners Llc | 57 | 7 | ||||||
| 2026-02-04 | 13F | Swiss Life Asset Management Ltd | 10.070 | -0,19 | 1.376 | -6,39 | ||||
| 2026-02-02 | 13F | Danske Bank A/s | 51.803 | 5,50 | 7.080 | -1,05 | ||||
| 2026-02-13 | 13F | Bridgewater Associates, LP | 63.073 | -13,37 | 8.621 | -18,75 | ||||
| 2026-02-17 | 13F | Prana Capital Management, LP | 4.462 | -77,64 | 610 | -79,05 | ||||
| 2026-02-12 | 13F | Johnson Financial Group, Inc. | 2.395 | -15,94 | 327 | -21,20 | ||||
| 2026-01-29 | 13F | Ashton Thomas Private Wealth, LLC | 2.135 | -6,24 | 292 | -12,08 | ||||
| 2026-02-11 | 13F | Group One Trading, L.p. | 0 | -100,00 | 0 | |||||
| 2026-02-17 | 13F | Magnetar Financial LLC | 3.255 | 445 | ||||||
| 2025-11-14 | 13F | XTX Topco Ltd | 0 | -100,00 | 0 | -100,00 | ||||
| 2026-01-13 | 13F | Mather Group, Llc. | 0 | -100,00 | 0 | |||||
| 2025-11-12 | 13F | Buckingham Strategic Partners | 0 | -100,00 | 0 | |||||
| 2026-02-04 | 13F | LRI Investments, LLC | 23 | 0,00 | 3 | 0,00 | ||||
| 2026-02-10 | 13F | Impact Partnership Wealth, LLC | 6.262 | 22,23 | 856 | 14,61 | ||||
| 2026-02-05 | 13F | AlphaCore Capital LLC | 1.479 | 202 | ||||||
| 2026-02-13 | 13F | Morgan Stanley | 894.998 | 4,31 | 122.329 | -2,16 | ||||
| 2026-02-04 | 13F | Virginia Retirement Systems Et Al | 15.000 | 0,00 | 2.050 | -6,18 | ||||
| 2026-02-02 | 13F | Oppenheimer Asset Management Inc. | 0 | -100,00 | 0 | |||||
| 2026-01-14 | 13F | Hennion & Walsh Asset Management, Inc. | 4.960 | -1,53 | 678 | -7,64 | ||||
| 2026-02-17 | 13F | Wiley Bros.-aintree Capital, Llc | 2.437 | -0,93 | 333 | -6,98 | ||||
| 2026-02-12 | 13F | Index Technologies Group LLC | 1.714 | 234 | ||||||
| 2026-01-23 | 13F | Steigerwald, Gordon & Koch Inc. | 414 | 0,00 | 57 | -6,67 | ||||
| 2025-11-14 | 13F | Toroso Investments, LLC | 0 | -100,00 | 0 | |||||
| 2026-04-08 | 13F | DiNuzzo Private Wealth, Inc. | 19 | 0,00 | 2 | 0,00 | ||||
| 2026-02-13 | 13F | Caitong International Asset Management Co., Ltd | 0 | -100,00 | 0 | |||||
| 2026-02-11 | 13F | Metis Global Partners, LLC | 5.455 | -0,71 | 746 | -6,87 | ||||
| 2026-01-15 | 13F | Hengehold Capital Management Llc | 32.364 | 0,00 | 4.423 | -6,21 | ||||
| 2026-02-13 | 13F | Atlas Capital Advisors Llc | 50 | 7 | ||||||
| 2026-02-05 | 13F | Thrivent Financial For Lutherans | 25.910 | 44,05 | 4 | 50,00 | ||||
| 2026-02-10 | 13F | Lido Advisors, LLC | 3.039 | 75,46 | 430 | 70,63 | ||||
| 2025-11-03 | 13F | Ritter Daniher Financial Advisory LLC / DE | 0 | -100,00 | 0 | |||||
| 2025-11-06 | 13F | Abich Financial Wealth Management LLC | 1.901 | 672,76 | 277 | 739,39 | ||||
| 2026-02-13 | 13F | Golden State Wealth Management, LLC | 7.500 | 0,00 | 1.025 | -6,14 | ||||
| 2026-01-16 | 13F | Sims Investment Management, Llc | 3.654 | 0,00 | 499 | -6,20 | ||||
| 2026-02-17 | 13F | Alliancebernstein L.p. | 993.378 | -0,54 | 135.775 | -6,71 | ||||
| 2026-01-30 | 13F | Valued Wealth Advisors LLC | 9 | 80,00 | 1 | |||||
| 2025-10-22 | 13F | Geneos Wealth Management Inc. | 0 | -100,00 | 0 | -100,00 | ||||
| 2026-04-10 | 13F | Matrix Trust Co | 0 | -100,00 | 0 | |||||
| 2026-02-17 | 13F | Woodline Partners LP | 438.439 | -29,47 | 59.926 | -33,84 | ||||
| 2026-02-12 | 13F | Swiss National Bank | 168.500 | -12,47 | 23.031 | -17,90 | ||||
| 2026-02-06 | 13F | Gsa Capital Partners Llp | 0 | -100,00 | 0 | |||||
| 2026-02-17 | 13F | Two Sigma Investments, Lp | 56.464 | -31,18 | 7.718 | -35,46 | ||||
| 2026-02-04 | 13F | Atlantic Union Bankshares Corp | 210 | 0,00 | 29 | -6,67 | ||||
| 2026-02-18 | 13F | Vident Advisory, LLC | 2.679 | -20,93 | 366 | -25,76 | ||||
| 2026-01-08 | 13F | True Wealth Design, LLC | 10 | 11,11 | 1 | 0,00 | ||||
| 2025-11-13 | 13F | Empowered Funds, LLC | 0 | -100,00 | 0 | |||||
| 2026-01-12 | 13F | Rialto Wealth Management, LLC | 17 | 13,33 | 2 | 0,00 | ||||
| 2026-02-11 | 13F | Capital Analysts, Inc. | 0 | -100,00 | 0 | |||||
| 2026-01-28 | 13F | Ai Financial Services Llc | 5.029 | 7,71 | 687 | 0,44 | ||||
| 2026-02-04 | 13F | Pacer Advisors, Inc. | 0 | -100,00 | 0 | |||||
| 2026-02-11 | 13F | BI Asset Management Fondsmaeglerselskab A/S | 3.501 | 0 | ||||||
| 2026-02-04 | 13F | Summit Wealth Group Llc / Co | 0 | -100,00 | 0 | -100,00 | ||||
| 2025-10-16 | 13F | Carnegie Capital Asset Management, LLC | 0 | -100,00 | 0 | |||||
| 2026-01-09 | 13F | Assenagon Asset Management S.A. | 93.270 | 3.295,34 | 12.748 | 3.087,00 | ||||
| 2026-02-10 | 13F | Acadian Asset Management Llc | 4.079 | 1 | ||||||
| 2026-02-17 | 13F | Susquehanna International Group, Llp | Put | 7.300 | -42,52 | 998 | -46,11 | |||
| 2026-02-17 | 13F | Susquehanna International Group, Llp | Call | 13.400 | -77,55 | 1.832 | -78,95 | |||
| 2026-01-29 | 13F | Vanguard Group Inc | 7.297.408 | -1,28 | 997.410 | -7,40 | ||||
| 2026-02-17 | 13F | Millennium Management Llc | 253.932 | 194,93 | 34.707 | 176,64 | ||||
| 2026-02-10 | 13F | Goldman Sachs Group Inc | 770.864 | -8,05 | 105.362 | -13,75 | ||||
| 2026-02-11 | 13F | Allianz Asset Management GmbH | 309.471 | -7,81 | 42.298 | -13,53 | ||||
| 2026-02-13 | 13F | Croban | 1.946 | -4,47 | 266 | -10,47 | ||||
| 2026-01-26 | 13F | Mirae Asset Global Investments Co., Ltd. | 63.062 | -3,00 | 8.619 | -9,02 | ||||
| 2026-02-13 | 13F | Transamerica Financial Advisors, Inc. | 1 | 0 | ||||||
| 2026-02-13 | 13F | Parkside Financial Bank & Trust | 140 | 10,24 | 19 | 5,56 | ||||
| 2026-02-11 | 13F | Jessup Wealth Management, Inc | 26 | 4 | ||||||
| 2025-11-14 | 13F | Wolverine Trading, Llc | 6.787 | 981 | ||||||
| 2025-11-14 | 13F | Wolverine Trading, Llc | Call | 9.900 | 1.431 | |||||
| 2025-11-14 | 13F | Wolverine Trading, Llc | Put | 6.200 | 896 | |||||
| 2026-02-20 | 13F/A | Prestige Wealth Management Group LLC | 0 | -100,00 | 0 | |||||
| 2026-01-21 | 13F | Sowell Financial Services LLC | 1.662 | 8,27 | 227 | 1,79 | ||||
| 2026-02-17 | 13F | Quantinno Capital Management LP | 44.794 | 38,67 | 6.122 | 30,06 | ||||
| 2026-02-12 | 13F | Aviva Plc | 21.843 | 9,77 | 2.986 | 2,97 | ||||
| 2026-02-17 | 13F | Siemens Fonds Invest GmbH | 3.981 | 325,78 | 549 | 302,94 | ||||
| 2026-02-06 | 13F | IFP Advisors, Inc | 479 | 5,04 | 65 | -1,52 | ||||
| 2026-02-13 | 13F | BNP Paribas Asset Management Holding S.A. | 29.880 | 64.856,52 | 4 | |||||
| 2026-02-02 | 13F | Truist Financial Corp | 5.201 | -6,41 | 711 | -12,24 | ||||
| 2026-02-12 | 13F | Jane Street Group, Llc | Put | 6.200 | 847 | |||||
| 2026-02-17 | 13F | Trexquant Investment LP | 35.469 | 4.848 | ||||||
| 2026-02-12 | 13F | Jane Street Group, Llc | Call | 1.800 | -64,71 | 246 | -66,89 | |||
| 2026-02-17 | 13F | Sovereign's Capital Management, LLC | 30.738 | -16,68 | 4.201 | -21,84 | ||||
| 2026-02-12 | 13F | Dimensional Fund Advisors Lp | 1.266.001 | 12,28 | 173.045 | 5,33 | ||||
| 2026-02-17 | 13F | Balyasny Asset Management Llc | Call | 0 | -100,00 | 0 | ||||
| 2026-01-29 | 13F | Resonant Capital Advisors, LLC | 6.493 | 0,43 | 887 | -5,84 | ||||
| 2026-02-03 | 13F | Gateway Investment Advisers Llc | 62.770 | 0,00 | 8.579 | -6,20 | ||||
| 2026-02-12 | 13F | Jane Street Group, Llc | 3.176 | 16,04 | 434 | 9,05 | ||||
| 2026-02-17 | 13F | ISAM Funds (UK) Ltd | 0 | -100,00 | 0 | |||||
| 2026-01-29 | 13F | State Of Michigan Retirement System | 17.010 | -2,30 | 2.325 | -8,36 | ||||
| 2026-02-10 | 13F | Quantbot Technologies LP | 1.335 | 182 | ||||||
| 2025-11-12 | 13F | Transce3nd, LLC | 0 | -100,00 | 0 | -100,00 | ||||
| 2026-02-17 | 13F | Susquehanna International Group, Llp | 94.523 | 565,23 | 12.919 | 524,11 | ||||
| 2026-02-17 | 13F | DV Trading LLC | 200 | 27 | ||||||
| 2026-02-12 | 13F | Skandinaviska Enskilda Banken AB (publ) | 19.125 | -1,24 | 2.614 | -7,34 | ||||
| 2025-11-14 | 13F | Binnacle Investments Inc | 5 | 0,00 | 1 | |||||
| 2026-04-10 | 13F | Linden Thomas Advisory Services, LLC | 11.935 | 4,78 | 1.524 | -2,06 | ||||
| 2026-02-10 | 13F | National Pension Service | 1.183 | 87,78 | 162 | 76,92 | ||||
| 2026-02-10 | 13F | Root Financial Partners, LLC | 274 | 17,60 | 37 | 12,12 | ||||
| 2026-02-12 | 13F | CIBC Private Wealth Group, LLC | 376 | 86,14 | 51 | 75,86 | ||||
| 2026-02-18 | 13F | EP Wealth Advisors, Inc. | 2.730 | -0,69 | 373 | 7,80 | ||||
| 2026-01-29 | 13F | D.a. Davidson & Co. | 4.572 | 9,96 | 625 | 3,14 | ||||
| 2026-01-30 | 13F | Torren Management, LLC | 32 | 4 | ||||||
| 2026-02-13 | 13F | Smartleaf Asset Management LLC | 284 | 4,03 | 39 | 0,00 | ||||
| 2026-01-29 | 13F | Concurrent Investment Advisors, LLC | 2.512 | 343 | ||||||
| 2026-02-13 | 13F | SRS Capital Advisors, Inc. | 1.494 | -76,00 | 204 | -77,51 | ||||
| 2026-01-30 | 13F | Activest Wealth Management | 23 | 3 | ||||||
| 2026-02-04 | 13F | Clark Wealth Partners | 0 | -100,00 | 0 | -100,00 | ||||
| 2026-02-17 | 13F | Captrust Financial Advisors | 4.866 | 8,98 | 665 | 2,31 | ||||
| 2026-02-05 | 13F | Commerzbank Aktiengesellschaft /fi | 6.214 | 1 | ||||||
| 2026-02-13 | 13F/A | Archvest Wealth Advisors, Inc. | 6.750 | 6,57 | 923 | 0,00 | ||||
| 2026-01-30 | 13F | Trifecta Capital Advisors, LLC | 1.400 | 0,00 | 191 | -6,37 | ||||
| 2026-02-17 | 13F/A | Northwest & Ethical Investments L.P. | 41.633 | 0,00 | 5.690 | -6,20 | ||||
| 2025-11-05 | 13F | Savant Capital, LLC | 0 | -100,00 | 0 | -100,00 | ||||
| 2026-02-05 | 13F | Bessemer Group Inc | 368 | 0,00 | 0 | |||||
| 2026-02-09 | 13F | Quest Partners LLC | 8.858 | 59,37 | 1.211 | 49,57 | ||||
| 2026-02-06 | 13F | ProShare Advisors LLC | 249.631 | -10,29 | 34.120 | -15,86 | ||||
| 2026-01-16 | 13F | Louisiana State Employees Retirement System | 19.200 | -0,52 | 2.624 | -6,69 | ||||
| 2026-02-09 | 13F | Allstate Corp | 5.256 | 135,06 | 718 | 120,92 | ||||
| 2026-02-11 | 13F | Ameritas Investment Partners, Inc. | 12.687 | 1.734 | ||||||
| 2026-02-06 | 13F | Handelsbanken Fonder AB | 18.500 | 0,00 | 3 | 0,00 | ||||
| 2026-02-10 | 13F | Natixis Advisors, L.p. | 0 | -100,00 | 0 | -100,00 | ||||
| 2026-02-17 | 13F | Voleon Capital Management Lp | 0 | -100,00 | 0 | |||||
| 2026-02-05 | 13F | Applied Finance Capital Management, LLC | 0 | -100,00 | 0 | |||||
| 2025-11-14 | 13F | Axa S.a. | 0 | -100,00 | 0 | |||||
| 2025-11-13 | 13F | Grantham, Mayo, Van Otterloo & Co. LLC | 0 | -100,00 | 0 | -100,00 | ||||
| 2026-02-04 | 13F/A | Nwam Llc | 0 | -100,00 | 0 | -100,00 | ||||
| 2026-02-17 | 13F | Maryland State Retirement & Pension System | 3.354 | 0,00 | 458 | -6,15 | ||||
| 2026-01-15 | 13F | Nisa Investment Advisors, Llc | 36.955 | -3,48 | 5.051 | -9,46 | ||||
| 2026-02-17 | 13F | Stansberry Asset Management, Llc | 9.437 | 1,83 | 1.290 | -4,52 | ||||
| 2026-04-06 | 13F | CX Institutional | 1.199 | -64,06 | 0 | |||||
| 2026-02-17 | 13F | Balyasny Asset Management Llc | 751.273 | 14,82 | 102.684 | 7,69 | ||||
| 2026-01-13 | 13F | Trust Point Inc. | 0 | -100,00 | 0 | |||||
| 2026-02-12 | 13F | Callan Family Office, LLC | 4.635 | 31,68 | 634 | 23,63 | ||||
| 2026-02-17 | 13F | Stenham Asset Management (UK) Plc | 34.700 | -15,98 | 4.743 | -21,20 | ||||
| 2025-11-13 | 13F | Entropy Technologies, LP | 0 | -100,00 | 0 | |||||
| 2026-02-10 | 13F | Mutual Of America Capital Management Llc | 45.301 | -20,84 | 6.192 | -25,75 | ||||
| 2026-02-17 | 13F | Tower Research Capital LLC (TRC) | 6.475 | 162,36 | 885 | 146,52 | ||||
| 2026-02-12 | 13F | Quadrant Capital Group Llc | 10.017 | -0,99 | 1.369 | -7,12 | ||||
| 2026-02-17 | 13F | Weiss Asset Management LP | 0 | -100,00 | 0 | -100,00 | ||||
| 2026-01-29 | 13F | Quest 10 Wealth Builders, Inc. | 13 | 2 | ||||||
| 2026-02-13 | 13F | Arrowstreet Capital, Limited Partnership | 98.627 | 23,73 | 13.480 | 16,06 | ||||
| 2026-01-26 | 13F | Cwm, Llc | 3.158 | 48,05 | 0 | |||||
| 2026-02-13 | 13F | Stifel Financial Corp | 10.547 | -6,42 | 1.442 | -12,24 | ||||
| 2026-02-17 | 13F | Perbak Capital Partners LLP | 3.117 | -67,45 | 426 | -69,46 | ||||
| 2026-01-21 | 13F | SJS Investment Consulting Inc. | 10 | 11,11 | 1 | 0,00 | ||||
| 2026-02-11 | 13F | Illinois Municipal Retirement Fund | 36.360 | 21,87 | 4.970 | 14,31 | ||||
| 2026-02-09 | 13F | Keating Financial Advisory Services, Inc. | 580 | 79 | ||||||
| 2026-01-28 | 13F | Confluence Wealth Services, Inc. | 10.367 | 2,93 | 1.417 | -3,48 | ||||
| 2026-01-15 | 13F | Alpine Bank Wealth Management | 0 | -100,00 | 0 | |||||
| 2026-01-30 | 13F | Archer Investment Corp | 0 | -100,00 | 0 |
Other Listings
| DE:QFI | 112,10 € |