Grundlæggende statistik
| Institutionelle ejere | 338 total, 337 long only, 0 short only, 1 long/short - change of 5,28% MRQ |
| Gennemsnitlig porteføljeallokering | 0.6463 % - change of -5,16% MRQ |
| Institutionelle aktier (lange) | 12.569.951 (ex 13D/G) - change of 1,04MM shares 9,05% MRQ |
| Institutionel værdi (lang) | $ 3.437.942 USD ($1000) |
Institutionelt ejerskab og aktionærer
Vanguard Scottsdale Funds - Vanguard Russell 1000 ETF (US:VONE) har 338 institutionelle ejere og aktionærer, der har indsendt 13D/G- eller 13F-formularer til Securities Exchange Commission (SEC). Disse institutioner har i alt 12,569,951 aktier. Største aktionærer omfatter Morgan Stanley, Fmr Llc, Ameriprise Financial Inc, UBS Group AG, Red Cedar Investment Management, Llc, Bank of New York Mellon Corp, Stifel Financial Corp, Bank Of America Corp /de/, Warren Averett Asset Management, LLC, and Raymond James Financial Inc .
Vanguard Scottsdale Funds - Vanguard Russell 1000 ETF (NasdaqGM:VONE) institutionel ejerskabsstruktur viser aktuelle positioner i virksomheden efter institutioner og fonde, samt seneste ændringer i positionsstørrelse. Større aktionærer kan omfatte individuelle investorer, investeringsforeninger, hedgefonde eller institutioner. Skema 13D angiver, at investoren besidder (eller besidder) mere end 5 % af virksomheden og har til hensigt (eller har til hensigt at) aktivt at forfølge en ændring i forretningsstrategi. Skema 13G indikerer en passiv investering på over 5%.
The share price as of September 18, 2025 is 301,44 / share. Previously, on September 19, 2024, the share price was 258,96 / share. This represents an increase of 16,40% over that period.

Fondens stemningsscore
Fund Sentiment Score (fka Ownership Accumulation Score) finder de aktier, der bliver mest købt af fonde. Det er resultatet af en sofistikeret, multi-faktor kvantitativ model, der identificerer virksomheder med de højeste niveauer af institutionel akkumulering. Scoringsmodellen bruger en kombination af den samlede stigning i oplyste ejere, ændringerne i porteføljeallokeringer i disse ejere og andre målinger. Tallet går fra 0 til 100, hvor højere tal indikerer et højere niveau af akkumulering for sine jævnaldrende, og 50 er gennemsnittet.
Opdateringsfrekvens: Dagligt
Se Ownership Explorer, som giver en liste over højest rangerende virksomheder.
AI+ Ask Fintel’s AI assistant about Vanguard Scottsdale Funds - Vanguard Russell 1000 ETF.
Thinking of good questions…
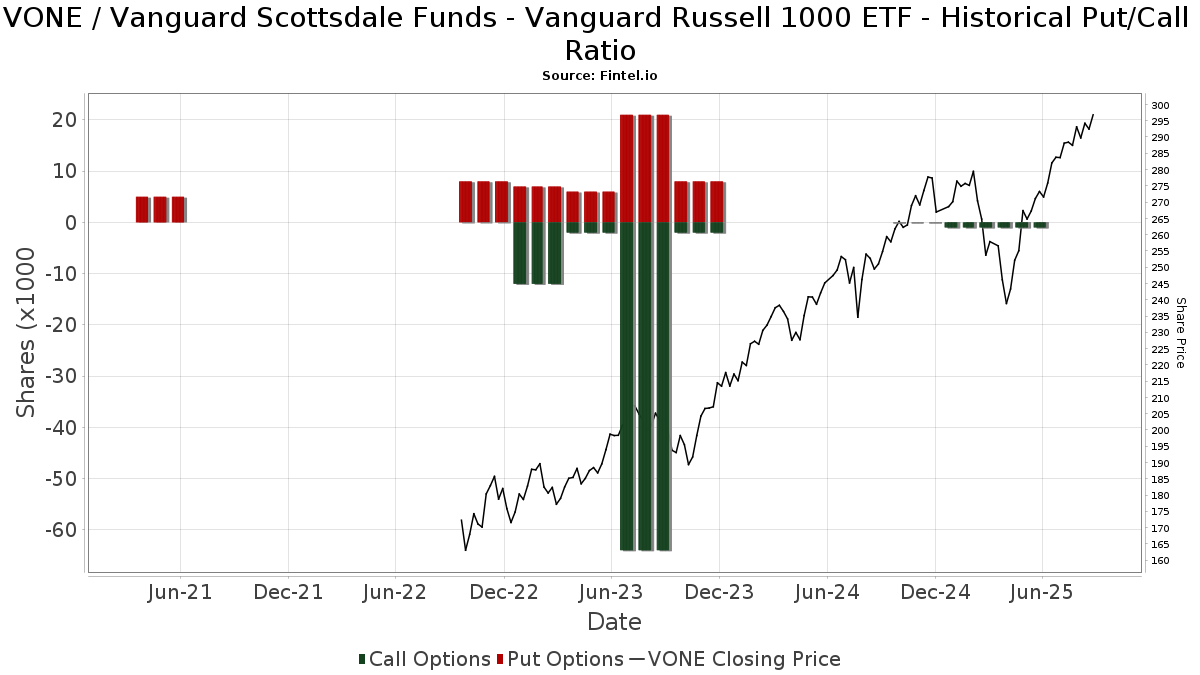
Institutionel Put/Call-forhold
Ud over at indberette standardaktie- og gældsudstedelser skal institutter med mere end 100 mill. aktiver under forvaltning også oplyse deres put- og call-optionsbeholdninger. Da salgsoptioner generelt indikerer negativ stemning, og købsoptioner indikerer positiv stemning, kan vi få en fornemmelse af den overordnede institutionelle stemning ved at plotte forholdet mellem put og kald. Diagrammet til højre viser det historiske put/call-forhold for dette instrument.
Brug af Put/Call Ratio som en indikator for investorernes stemning overvinder en af de vigtigste mangler ved at bruge totalt institutionelt ejerskab, som er, at en betydelig mængde af aktiver under forvaltning investeres passivt for at spore indekser. Passivt forvaltede fonde køber typisk ikke optioner, så indikatoren for put/call-forholdet følger mere nøje følelsen af aktivt forvaltede fonde.
13D/G-arkivering
Vi præsenterer 13D/G ansøgninger separat fra 13F ansøgninger på grund af den forskellige behandling af SEC. 13D/G-ansøgninger kan indgives af grupper af investorer (med én ledende), hvorimod 13F-ansøgninger ikke kan. Dette resulterer i situationer, hvor en investor kan indsende en 13D/G, der rapporterer én værdi for de samlede aktier (der repræsenterer alle de aktier, der ejes af investorgruppen), men derefter indsender en 13F, der rapporterer en anden værdi for de samlede aktier (der udelukkende repræsenterer deres egne) ejendomsret). Det betyder, at aktieejerskab af 13D/G-arkiver og 13F-arkiveringer ofte ikke er direkte sammenlignelige, så vi præsenterer dem separat.
Bemærk: Fra den 16. maj 2021 viser vi ikke længere ejere, der ikke har indsendt en 13D/G inden for det seneste år. Tidligere viste vi den fulde historie af 13D/G-arkiver. Generelt skal enheder, der er forpligtet til at indgive 13D/G-ansøgninger, indgive mindst årligt, før de indsender en afsluttende ansøgning. Dog forlader fonde nogle gange positioner uden at indsende en afsluttende ansøgning (dvs. de afvikler), så visning af den fulde historie resulterede nogle gange i forvirring om det nuværende ejerskab. For at undgå forvirring viser vi nu kun 'aktuelle' ejere - det vil sige - ejere, der har anmeldt inden for det seneste år.
Upgrade to unlock premium data.
13F og NPORT arkivering
Detaljer om 13F-arkivering er gratis. Detaljer om NP-ansøgninger kræver et premium-medlemskab. Grønne rækker angiver nye positioner. Røde rækker angiver lukkede positioner. Klik på linket ikon for at se den fulde transaktionshistorik.
Opgrader
for at låse premium-data op og eksportere til Excel ![]() .
.
| Fil dato | Kilde | Investor | Type | Gennemsnitlig pris (Øst) |
Aktier | Δ Aktier (%) |
Rapporteret Værdi ($1000) |
Δ Værdi (%) |
Port Alloc (%) |
|
|---|---|---|---|---|---|---|---|---|---|---|
| 2025-08-07 | 13F | Kestra Private Wealth Services, Llc | 2.105 | 0,10 | 591 | 10,88 | ||||
| 2025-08-07 | 13F | Midwest Trust Co | 2.760 | 775 | ||||||
| 2025-08-01 | 13F | Zhang Financial LLC | 15.490 | -3,87 | 4.351 | 6,36 | ||||
| 2025-08-07 | 13F | W Advisors, Llc | 1.377 | 387 | ||||||
| 2025-08-14 | 13F | Wick Capital Partners, LLC | 2.857 | -8,66 | 859 | 8,06 | ||||
| 2025-08-15 | 13F | Kestra Advisory Services, LLC | 9.131 | -0,58 | 2.565 | 10,00 | ||||
| 2025-05-08 | 13F | Us Financial Advisors, Llc | 18.181 | -1,28 | 4.616 | -6,03 | ||||
| 2025-07-14 | 13F | Park Avenue Securities Llc | 2.155 | 0,94 | 1 | |||||
| 2025-07-22 | 13F | Grimes & Company, Inc. | 834 | 234 | ||||||
| 2025-07-31 | 13F | Buckingham Strategic Partners | 1.280 | 0,31 | 360 | 10,80 | ||||
| 2025-08-11 | 13F | Wealthspire Advisors, LLC | 5.446 | 0,29 | 1.530 | 10,96 | ||||
| 2025-08-14 | 13F | Glenmede Investment Management, LP | 6.880 | 1.932 | ||||||
| 2025-08-14 | 13F | Citadel Advisors Llc | 10.479 | 2.943 | ||||||
| 2025-08-05 | 13F | American Capital Advisory, LLC | 1.105 | -0,81 | 310 | 9,93 | ||||
| 2025-08-14 | 13F | Mariner, LLC | 26.421 | -0,09 | 7.418 | 10,49 | ||||
| 2025-07-25 | 13F | NorthRock Partners, LLC | 265 | 0,00 | 74 | 10,45 | ||||
| 2025-07-18 | 13F | Bartlett & Co. Wealth Management Llc | 0 | -100,00 | 0 | |||||
| 2025-08-13 | 13F | Northern Trust Corp | 44.273 | -0,83 | 12.435 | 9,71 | ||||
| 2025-07-23 | 13F | Indiana Trust & Investment Management CO | 4.571 | -14,64 | 1.284 | -5,59 | ||||
| 2025-08-14 | 13F | Raymond James Financial Inc | 289.764 | 7,76 | 81.383 | 19,22 | ||||
| 2025-08-14 | 13F | Integrated Wealth Concepts LLC | 3.383 | -0,94 | 950 | 9,57 | ||||
| 2025-08-08 | 13F | Pnc Financial Services Group, Inc. | 1.055 | 0,00 | 296 | 10,86 | ||||
| 2025-07-28 | 13F | Tlwm | 1.309 | -16,89 | 368 | -8,02 | ||||
| 2025-08-13 | 13F | Solidarilty Wealth, LLC | 824 | 0,00 | 231 | 10,53 | ||||
| 2025-08-08 | 13F | Kingsview Wealth Management, LLC | 1.413 | -0,35 | 397 | 10,31 | ||||
| 2025-07-08 | 13F | Heartwood Wealth Advisors LLC | 140.494 | 0,22 | 39.459 | 10,87 | ||||
| 2025-04-02 | 13F | Clark Asset Management, LLC | 0 | -100,00 | 0 | -100,00 | ||||
| 2025-08-07 | 13F | Evoke Wealth, Llc | 94.005 | -2,94 | 26.402 | 7,38 | ||||
| 2025-07-31 | 13F | Schoolcraft Capital LLC | 8.985 | 23,34 | 2.523 | 36,45 | ||||
| 2025-05-06 | 13F | MCF Advisors LLC | 0 | -100,00 | 0 | |||||
| 2025-07-28 | 13F | Brown Financial Advisory | 11.985 | -0,10 | 3.366 | 10,54 | ||||
| 2025-07-24 | 13F | IFP Advisors, Inc | 0 | -100,00 | 0 | -100,00 | ||||
| 2025-08-11 | 13F | FSC Wealth Advisors, LLC | 125 | 0,81 | 35 | 12,90 | ||||
| 2025-08-14 | 13F | CoreCap Advisors, LLC | 632 | 0,00 | 178 | 10,63 | ||||
| 2025-08-11 | 13F | Vanguard Group Inc | 92.406 | 80,04 | 25.953 | 99,19 | ||||
| 2025-08-14 | 13F | Quantum Capital Management, LLC / NJ | 9.354 | 2.627 | ||||||
| 2025-07-22 | 13F | Berkshire Money Management, Inc. | 5.516 | 1.549 | ||||||
| 2025-08-13 | 13F | Congress Wealth Management LLC / DE / | 919 | 258 | ||||||
| 2025-08-11 | 13F | CBIZ Investment Advisory Services, LLC | 19.041 | 0,74 | 5.348 | 11,44 | ||||
| 2025-08-05 | 13F | Huntington National Bank | 0 | |||||||
| 2025-08-13 | 13F | Beacon Pointe Advisors, LLC | 114.232 | -1,53 | 32.083 | 8,94 | ||||
| 2025-07-15 | 13F | Fifth Third Bancorp | 1.740 | 0,00 | 489 | 10,66 | ||||
| 2025-08-12 | 13F | Howe & Rusling Inc | 80 | 0,00 | 23 | 10,00 | ||||
| 2025-08-13 | 13F | Jones Financial Companies Lllp | 67.038 | 137,59 | 18.736 | 162,91 | ||||
| 2025-08-14 | 13F | Wells Fargo & Company/mn | 221.773 | 0,01 | 62.287 | 10,65 | ||||
| 2025-08-14 | 13F | Monograph Wealth Advisors, Llc | 1.855 | 521 | ||||||
| 2025-07-18 | 13F | Centricity Wealth Management, LLC | 2.722 | 0,00 | 765 | 10,72 | ||||
| 2025-07-23 | 13F | ETF Portfolio Partners, Inc. | 6.540 | 0,00 | 1.837 | 10,60 | ||||
| 2025-08-14 | 13F | Betterment LLC | 2.464 | 1 | ||||||
| 2025-07-31 | 13F | Jordan Park Group LLC | 86.323 | 24.245 | ||||||
| 2025-08-14 | 13F | GWM Advisors LLC | 8.983 | 4,58 | 2.523 | 15,69 | ||||
| 2025-07-15 | 13F | Mather Group, Llc. | 1.168 | 0,00 | 328 | 10,47 | ||||
| 2025-07-24 | 13F | Ronald Blue Trust, Inc. | 2.778 | 7,13 | 780 | 18,54 | ||||
| 2025-07-15 | 13F | Financial Management Professionals, Inc. | 743 | 0,00 | 209 | 10,64 | ||||
| 2025-07-08 | 13F | Parallel Advisors, LLC | 9.635 | 0,00 | 2.706 | 10,67 | ||||
| 2025-07-25 | 13F | Astoria Portfolio Advisors LLC. | 1.717 | -8,28 | 495 | 8,79 | ||||
| 2025-08-06 | 13F | Savant Capital, LLC | 23.089 | -2,12 | 6.485 | 8,28 | ||||
| 2025-08-19 | 13F | National Asset Management, Inc. | 1.534 | 0,26 | 431 | 5,39 | ||||
| 2025-07-15 | 13F | Highland Financial Advisors, LLC | 0 | -100,00 | 0 | |||||
| 2025-08-14 | 13F/A | Skopos Labs, Inc. | 1.460 | 410 | ||||||
| 2025-07-21 | 13F | Precedent Wealth Partners, Llc | 6.278 | -3,96 | 1.763 | 6,27 | ||||
| 2025-07-22 | 13F | Kickstand Ventures, Llc. | 0 | -100,00 | 0 | |||||
| 2025-08-08 | 13F | Brogan Financial, Inc. | 1.260 | -1,95 | 354 | 8,28 | ||||
| 2025-08-07 | 13F | Allworth Financial LP | 22.553 | 1,28 | 6.334 | 14,66 | ||||
| 2025-08-08 | 13F | Comprehensive Financial Planning, Inc./PA | 51 | 0,00 | 14 | 16,67 | ||||
| 2025-08-05 | 13F | Bank Of Montreal /can/ | 216.413 | 3.660,43 | 60.782 | 4.063,08 | ||||
| 2025-08-13 | 13F | Lido Advisors, LLC | 935 | 0,11 | 263 | 10,55 | ||||
| 2025-08-18 | 13F/A | National Bank Of Canada /fi/ | 100 | -28,57 | 28 | -20,00 | ||||
| 2025-08-13 | 13F | SageView Advisory Group, LLC | 1.658 | 0,00 | 480 | 14,29 | ||||
| 2025-07-25 | 13F | Retirement Planning Group, Llc / Ny | 8.250 | -1,81 | 2.317 | 8,68 | ||||
| 2025-08-11 | 13F | TD Waterhouse Canada Inc. | 628 | -61,16 | 176 | -57,18 | ||||
| 2025-08-01 | 13F | Belvedere Trading LLC | Call | 1.600 | 0,00 | 449 | 10,59 | |||
| 2025-08-01 | 13F | Belvedere Trading LLC | Put | 200 | -66,67 | 56 | -63,16 | |||
| 2025-08-19 | 13F | Newbridge Financial Services Group, Inc. | 20 | 0,00 | 6 | 0,00 | ||||
| 2025-07-18 | 13F | Parsons Capital Management Inc/ri | 3.596 | -10,68 | 1.010 | -1,27 | ||||
| 2025-08-11 | 13F | Mill Creek Capital Advisors, LLC | 1.533 | 0,00 | 431 | 10,54 | ||||
| 2025-07-28 | 13F | Nadler Financial Group, Inc. | 15.860 | -8,72 | 4.455 | 1,00 | ||||
| 2025-07-30 | 13F | Arbor Investment Advisors, LLC | 67.202 | 8,20 | 18.874 | 19,71 | ||||
| 2025-04-09 | 13F | McLean Asset Management Corp | 0 | -100,00 | 0 | |||||
| 2025-08-11 | 13F | Berkeley, Inc | 845 | 0,00 | 237 | 10,75 | ||||
| 2025-07-02 | 13F | Central Pacific Bank - Trust Division | 31 | 0,00 | 9 | 14,29 | ||||
| 2025-07-28 | 13F | Stegner Investment Associates Inc. | 64.771 | 2,97 | 18.192 | 13,92 | ||||
| 2025-07-25 | 13F | Johnson Investment Counsel Inc | 1.955 | 0,00 | 549 | 10,69 | ||||
| 2025-08-13 | 13F | IAG Wealth Partners, LLC | 158 | 0,00 | 44 | 10,00 | ||||
| 2025-08-19 | 13F/A | Pitcairn Co | 43.749 | 0,00 | 12.287 | 10,63 | ||||
| 2025-07-17 | 13F | Tritonpoint Wealth, Llc | 0 | -100,00 | 0 | |||||
| 2025-08-13 | 13F | Colonial Trust Advisors | 1 | 0 | ||||||
| 2025-08-05 | 13F | Carolinas Wealth Consulting Llc | 0 | -100,00 | 0 | -100,00 | ||||
| 2025-07-09 | 13F | Aaron Wealth Advisors LLC | 28.101 | 0,09 | 7.893 | 10,73 | ||||
| 2025-08-06 | 13F | Modera Wealth Management, LLC | 2.319 | 0,00 | 651 | 10,71 | ||||
| 2025-08-14 | 13F | Wiley Bros.-aintree Capital, Llc | 1.574 | 1,68 | 458 | 13,68 | ||||
| 2025-08-12 | 13F | Charles Schwab Investment Management Inc | 823 | 231 | ||||||
| 2025-07-28 | 13F | Harbour Investments, Inc. | 1.526 | 3.079,17 | 429 | 3.466,67 | ||||
| 2025-08-07 | 13F | Resources Investment Advisors, LLC. | 805 | 0,12 | 226 | 10,78 | ||||
| 2025-08-13 | 13F | Continuum Advisory, LLC | 3.788 | -11,04 | 1.064 | -1,57 | ||||
| 2025-07-29 | 13F | Stratos Wealth Advisors, LLC | 22.781 | -0,68 | 6.398 | 9,87 | ||||
| 2025-08-01 | 13F | Austin Private Wealth, LLC | 138.928 | -25,23 | 39.019 | -17,28 | ||||
| 2025-08-13 | 13F | Green Harvest Asset Management LLC | 7.361 | 0,00 | 2.067 | 10,65 | ||||
| 2025-07-17 | 13F | Crane Advisory, LLC | 3.471 | -0,57 | 984 | 16,33 | ||||
| 2025-07-23 | 13F | Spectrum Asset Management, Inc. (NB/CA) | 2.163 | 1,17 | 608 | 11,99 | ||||
| 2025-07-30 | 13F | Studio Investment Management Llc | 5.133 | -6,16 | 1.442 | 3,82 | ||||
| 2025-08-12 | 13F | TCTC Holdings, LLC | 93 | 0,00 | 26 | 13,04 | ||||
| 2025-08-13 | 13F | Transce3nd, LLC | 31 | 3,33 | 9 | 14,29 | ||||
| 2025-07-11 | 13F | Farther Finance Advisors, LLC | 160 | 0,00 | 45 | 10,00 | ||||
| 2025-08-04 | 13F | Flagship Harbor Advisors, Llc | 8.109 | 1,49 | 2.277 | 12,28 | ||||
| 2025-07-16 | 13F | Flower City Capital | 218.984 | -2,72 | 61.504 | 7,63 | ||||
| 2025-08-08 | 13F | Financial Gravity Companies, Inc. | 0 | -100,00 | 0 | |||||
| 2025-08-14 | 13F | Mml Investors Services, Llc | 92.004 | 17,94 | 26 | 31,58 | ||||
| 2025-04-29 | 13F | Jackson Wealth Management, LLC | 0 | -100,00 | 0 | |||||
| 2025-07-07 | 13F | Kings Path Partners LLC | 52 | 0,00 | 15 | 7,69 | ||||
| 2025-08-07 | 13F | Wilkins Investment Counsel Inc | 1.340 | 0,00 | 376 | 10,59 | ||||
| 2025-08-14 | 13F | EP Wealth Advisors, Inc. | 1.450 | 0,00 | 407 | 10,60 | ||||
| 2025-08-21 | 13F | Aveo Capital Partners, LLC | 0 | -100,00 | 0 | |||||
| 2025-05-15 | 13F | Cambridge Associates Llc /ma/ /adv | 0 | -100,00 | 0 | |||||
| 2025-07-15 | 13F | Td Private Client Wealth Llc | 5.392 | 1,72 | 1.514 | 12,57 | ||||
| 2025-08-05 | 13F | Simplex Trading, Llc | 100 | -19,35 | 0 | |||||
| 2025-08-01 | 13F | Strategic Financial Services, Inc, | 1.425 | 23,91 | 400 | 37,46 | ||||
| 2025-08-15 | 13F | Morgan Stanley | 1.128.271 | 26,95 | 316.886 | 40,46 | ||||
| 2025-08-14 | 13F | Royal Bank Of Canada | 27.741 | -1,56 | 7.791 | 8,92 | ||||
| 2025-08-08 | 13F | Francis Financial, Inc. | 16.051 | 4.508 | ||||||
| 2025-08-15 | 13F | Captrust Financial Advisors | 11.323 | 9,04 | 3.180 | 20,64 | ||||
| 2025-05-15 | 13F | Two Sigma Investments, Lp | 0 | -100,00 | 0 | |||||
| 2025-08-07 | 13F | Brio Consultants, LLC | 7.708 | 2.165 | ||||||
| 2025-08-12 | 13F | SRS Capital Advisors, Inc. | 115 | 32 | ||||||
| 2025-08-13 | 13F | Russell Investments Group, Ltd. | 26 | -42,22 | 7 | -36,36 | ||||
| 2025-08-14 | 13F | Principia Wealth Advisory, LLC | 0 | -100,00 | 0 | |||||
| 2025-08-01 | 13F | Pasadena Private Wealth, LLC | 979 | -98,53 | 275 | -98,37 | ||||
| 2025-08-06 | 13F | AE Wealth Management LLC | 5.591 | -8,25 | 1.570 | 1,49 | ||||
| 2025-04-22 | 13F | Synergy Financial Management, LLC | 0 | -100,00 | 0 | |||||
| 2025-08-25 | 13F/A | Neuberger Berman Group LLC | 7.143 | 0,00 | 2.006 | 10,65 | ||||
| 2025-07-18 | 13F | Vigilare Wealth Management | 7.742 | -20,35 | 2.174 | -11,88 | ||||
| 2025-08-12 | 13F | O'shaughnessy Asset Management, Llc | 230 | 7.566,67 | 65 | |||||
| 2025-07-31 | 13F | CVA Family Office, LLC | 1.136 | 0,00 | 319 | 10,76 | ||||
| 2025-08-11 | 13F | Citigroup Inc | 1.642 | 1,80 | 461 | 12,71 | ||||
| 2025-05-15 | 13F | Human Investing LLC | 0 | -100,00 | 0 | |||||
| 2025-08-08 | 13F | Capstone Financial Advisors, Inc. | 23.279 | 14,72 | 6.538 | 26,93 | ||||
| 2025-08-12 | 13F | Real Talk Capital, LLC | 784 | 220 | 5,26 | |||||
| 2025-07-09 | 13F | Sapient Capital Llc | 13.166 | 0,00 | 3.698 | 10,62 | ||||
| 2025-08-13 | 13F | Northwestern Mutual Wealth Management Co | 47.003 | 5,06 | 13.201 | 16,24 | ||||
| 2025-07-17 | 13F | HB Wealth Management, LLC | 1.191 | 0,00 | 335 | 10,60 | ||||
| 2025-07-23 | 13F | Beaumont Asset Management, L.L.C. | 748 | 210 | ||||||
| 2025-07-23 | 13F | Next Level Wealth Planning, LLC | 1.904 | 19,52 | 535 | 32,18 | ||||
| 2025-07-29 | 13F | Salomon & Ludwin, LLC | 100 | 28 | ||||||
| 2025-07-31 | 13F | Oppenheimer & Co Inc | 1.086 | -40,03 | 305 | -33,55 | ||||
| 2025-08-08 | 13F | Glassman Wealth Services | 1.655 | 0,00 | 465 | 10,48 | ||||
| 2025-08-12 | 13F/A | Cozad Asset Management Inc | 36.523 | 1,03 | 10.258 | 11,77 | ||||
| 2025-08-12 | 13F | Steward Partners Investment Advisory, Llc | 2.045 | 0,59 | 574 | 11,24 | ||||
| 2025-08-07 | 13F | Blackston Financial Advisory Group, LLC | 8.154 | -6,09 | 2.290 | 3,86 | ||||
| 2025-04-30 | 13F | Sofos Investments, Inc. | 80 | 0,00 | 20 | 5,26 | ||||
| 2025-07-24 | 13F | 3Chopt Investment Partners, LLC | 0 | -100,00 | 0 | |||||
| 2025-08-11 | 13F | HighTower Advisors, LLC | 117.588 | 5,41 | 33.026 | 16,62 | ||||
| 2025-08-11 | 13F | Retirement Capital Strategies | 0 | -100,00 | 0 | |||||
| 2025-08-14 | 13F | SWAN Capital LLC | 2 | 0,00 | 1 | |||||
| 2025-07-22 | 13F | Global Strategic Investment Solutions, LLC | 1.020 | -0,78 | 286 | 10,00 | ||||
| 2025-08-14 | 13F | Mercer Global Advisors Inc /adv | 69.130 | -19,20 | 19.416 | -10,60 | ||||
| 2025-07-14 | 13F | Farmers & Merchants Investments Inc | 100 | 0,00 | 28 | 12,00 | ||||
| 2025-07-24 | 13F | Callan Family Office, LLC | 1.840 | 517 | ||||||
| 2025-08-14 | 13F | Mairs & Power Inc | 1.031 | 0,00 | 289 | 10,34 | ||||
| 2025-08-13 | 13F | Renaissance Technologies Llc | 6.100 | -20,78 | 1.713 | -12,33 | ||||
| 2025-07-22 | 13F | Verus Wealth Management, Llc | 5.828 | 143,04 | 1.637 | 169,08 | ||||
| 2025-08-04 | 13F | Assetmark, Inc | 693 | -16,81 | 195 | -8,06 | ||||
| 2025-08-14 | 13F | Goldman Sachs Group Inc | 264.550 | 34,28 | 74.302 | 48,56 | ||||
| 2025-08-13 | 13F | Royal Fund Management, LLC | 5.832 | -3,95 | 1.640 | 5,61 | ||||
| 2025-08-13 | 13F | Amundi | 0 | -100,00 | 0 | |||||
| 2025-07-10 | 13F | Wealth Enhancement Advisory Services, Llc | 101.207 | -0,71 | 28.757 | 11,13 | ||||
| 2025-07-11 | 13F | Sherrill & Hutchins Financial Advisory, Inc | 164.904 | 1,56 | 46.315 | 12,36 | ||||
| 2025-07-25 | 13F | Hazlett, Burt & Watson, Inc. | 901 | 0,00 | 0 | |||||
| 2025-07-25 | 13F | Envestnet Portfolio Solutions, Inc. | 11.771 | -15,29 | 3.306 | -6,29 | ||||
| 2025-08-12 | 13F | Coldstream Capital Management Inc | 34.346 | 0,03 | 9.646 | 10,67 | ||||
| 2025-08-14 | 13F | IHT Wealth Management, LLC | 877 | 246 | ||||||
| 2025-08-07 | 13F | Parkside Financial Bank & Trust | 58.129 | 11,57 | 16.326 | 23,43 | ||||
| 2025-08-15 | 13F | Tower Research Capital LLC (TRC) | 4 | 1 | ||||||
| 2025-08-01 | 13F | Envestnet Asset Management Inc | 279.250 | 14,86 | 78.430 | 27,08 | ||||
| 2025-08-08 | 13F | Hartland & Co., LLC | 10.831 | -6,51 | 3.042 | 3,47 | ||||
| 2025-08-11 | 13F | VSM Wealth Advisory, LLC | 10 | 0,00 | 3 | 0,00 | ||||
| 2025-08-12 | 13F | Private Management Group Inc | 844 | 237 | ||||||
| 2025-07-21 | 13F | Matauro, Llc | 736 | 207 | ||||||
| 2025-08-06 | 13F | Prospera Financial Services Inc | 2.103 | -49,40 | 593 | -43,99 | ||||
| 2025-05-15 | 13F | Vident Advisory, LLC | 0 | -100,00 | 0 | -100,00 | ||||
| 2025-08-12 | 13F | Pathstone Holdings, LLC | 66.576 | 0,00 | 18.699 | 10,64 | ||||
| 2025-07-25 | 13F | Sequoia Financial Advisors, LLC | 3.245 | -13,40 | 911 | -4,21 | ||||
| 2025-08-08 | 13F | Creative Planning | 26.101 | -0,23 | 7.331 | 10,37 | ||||
| 2025-08-14 | 13F | RMB Capital Management, LLC | 8.820 | 97,62 | 2.477 | 118,82 | ||||
| 2025-08-05 | 13F | GPS Wealth Strategies Group, LLC | 52 | -5,45 | 15 | 7,69 | ||||
| 2025-08-04 | 13F | Keybank National Association/oh | 65.199 | -4,26 | 18.312 | 5,92 | ||||
| 2025-08-06 | 13F | Commonwealth Equity Services, Llc | 28.914 | 18,48 | 8 | 33,33 | ||||
| 2025-07-29 | 13F | Oxbow Advisors, LLC | 1.306 | 0,00 | 367 | 10,57 | ||||
| 2025-07-17 | 13F | XY Planning Network, Inc. | 1.025 | 288 | ||||||
| 2025-04-02 | 13F | Marcum Wealth, LLC | 1.049 | 0,00 | 266 | -4,66 | ||||
| 2025-07-31 | 13F | Moser Wealth Advisors, LLC | 1.663 | 1,53 | 467 | 12,53 | ||||
| 2025-08-19 | 13F | Advisory Services Network, LLC | 2.302 | -6,76 | 662 | 5,59 | ||||
| 2025-08-04 | 13F | Roble, Belko & Company, Inc | 0 | -100,00 | 0 | |||||
| 2025-07-15 | 13F | Retirement Income Solutions, Inc | 2.870 | -15,01 | 806 | -5,95 | ||||
| 2025-07-22 | 13F | Compass Financial Group, INC/SD | 4.069 | 0,00 | 1.143 | 10,66 | ||||
| 2025-07-25 | 13F | Welch Group, LLC | 4.237 | 0,00 | 1.190 | 11,21 | ||||
| 2025-07-31 | 13F | SoundView Advisors Inc. | 25.031 | 0,02 | 7 | 16,67 | ||||
| 2025-07-25 | 13F | Landmark Wealth Management, LLC | 5.394 | -1,48 | 2 | 0,00 | ||||
| 2025-08-15 | 13F | Cooksen Wealth, LLC | 278 | 78 | ||||||
| 2025-07-21 | 13F | Monticello Wealth Management, Llc | 68.468 | 6.113,07 | 19.230 | 6.792,11 | ||||
| 2025-07-10 | 13F | Redhawk Wealth Advisors, Inc. | 905 | 0,22 | 254 | 10,92 | ||||
| 2025-07-10 | 13F | Brooklyn FI, LLC | 8.377 | 2.353 | 604,19 | |||||
| 2025-04-28 | 13F | Pinnacle Financial Partners Inc | 3.901 | 0,00 | 990 | -4,81 | ||||
| 2025-08-01 | 13F | Fort Vancouver Investment Management, LLC | 234 | -1,68 | 66 | 8,33 | ||||
| 2025-08-14 | 13F | Aqr Capital Management Llc | 35.325 | 159,53 | 9.921 | 187,15 | ||||
| 2025-08-05 | 13F | Tiaa Trust, National Association | 872 | 0,00 | 245 | 10,41 | ||||
| 2025-08-14 | 13F | Warren Averett Asset Management, LLC | 297.817 | 0,01 | 83.645 | 10,65 | ||||
| 2025-07-10 | 13F | Fulton Bank, N.a. | 1.646 | 462 | ||||||
| 2025-07-14 | 13F | Founders Capital Management, Llc | 30.204 | 0,00 | 8.483 | 10,64 | ||||
| 2025-08-14 | 13F | Hirtle Callaghan & Co LLC | 103.008 | 29,75 | 28.931 | 43,54 | ||||
| 2025-05-15 | 13F | Glenmede Trust Co Na | 6.880 | 0,00 | 1.747 | -4,85 | ||||
| 2025-05-14 | 13F | Ieq Capital, Llc | 0 | -100,00 | 0 | |||||
| 2025-08-13 | 13F | Vermillion & White Wealth Management Group, LLC | 1.544 | 434 | ||||||
| 2025-08-05 | 13F | Snider Financial Group | 4.208 | -3,55 | 1.182 | 6,68 | ||||
| 2025-08-06 | 13F | Ethos Financial Group, LLC | 2.781 | -33,08 | 781 | -29,51 | ||||
| 2025-08-14 | 13F | Gotham Asset Management, LLC | 20.049 | 5.631 | ||||||
| 2025-07-08 | 13F | Zrc Wealth Management, Llc | 60 | 0,00 | 17 | 6,67 | ||||
| 2025-08-08 | 13F | SBI Securities Co., Ltd. | 182 | 30,00 | 51 | 45,71 | ||||
| 2025-08-12 | 13F | Proequities, Inc. | 0 | 0 | ||||||
| 2025-08-14 | 13F | Main Street Financial Solutions, LLC | 6.011 | 1.688 | ||||||
| 2025-08-05 | 13F | Bank of New York Mellon Corp | 520.090 | 106,01 | 146.072 | 127,92 | ||||
| 2025-08-05 | 13F | Retirement Financial Solutions, Llc | 2.466 | 0,28 | 693 | 10,90 | ||||
| 2025-07-25 | 13F | Atria Wealth Solutions, Inc. | 19.962 | -72,68 | 5.651 | -69,54 | ||||
| 2025-07-28 | NP | VCGAX - Growth & Income Fund | 53.023 | 2.842,45 | 14.211 | 2.818,07 | ||||
| 2025-07-22 | 13F | DT Investment Partners, LLC | 621 | 0,00 | 174 | 10,83 | ||||
| 2025-08-14 | 13F | Ancora Advisors, LLC | 845 | 0,00 | 237 | 10,75 | ||||
| 2025-07-16 | 13F | ORG Partners LLC | 171 | 10,32 | 48 | 20,51 | ||||
| 2025-08-13 | 13F | Brown Advisory Inc | 800 | 0,00 | 225 | 10,34 | ||||
| 2025-07-30 | 13F | Strategic Blueprint, LLC | 0 | -100,00 | 0 | |||||
| 2025-08-14 | 13F | Bank Of America Corp /de/ | 414.066 | -27,68 | 116.294 | -19,98 | ||||
| 2025-09-04 | 13F/A | Advisor Group Holdings, Inc. | 11.625 | -52,76 | 3.276 | -47,66 | ||||
| 2025-07-17 | 13F | Nova R Wealth, Inc. | 16.722 | -0,43 | 4.697 | 10,16 | ||||
| 2025-04-21 | 13F | PUREfi Wealth, LLC | 0 | -100,00 | 0 | |||||
| 2025-07-17 | 13F | Enclave Advisors LLC | 9.976 | 0,00 | 2.802 | 10,62 | ||||
| 2025-07-22 | 13F | Wealthcare Advisory Partners LLC | 8.105 | 5,88 | 2.276 | 17,14 | ||||
| 2025-07-25 | 13F | Lodestar Private Asset Management Llc | 909 | 12,78 | 255 | 25,00 | ||||
| 2025-08-14 | 13F | Modern Wealth Management, LLC | 97.062 | 0,67 | 27.261 | 11,37 | ||||
| 2025-08-26 | 13F/A | Thrivent Financial For Lutherans | 9.377 | 583,45 | 3 | |||||
| 2025-05-02 | 13F | Signaturefd, Llc | 0 | -100,00 | 0 | |||||
| 2025-07-30 | 13F | Brookstone Capital Management | 820 | -98,00 | 230 | -97,79 | ||||
| 2025-08-08 | 13F | Emerald Investment Partners, Llc | 2.369 | 6,71 | 665 | 18,12 | ||||
| 2025-07-17 | 13F | Michels Family Financial, LLC | 2.605 | -0,15 | 732 | 10,42 | ||||
| 2025-07-22 | 13F | Warwick Investment Management, Inc. | 0 | -100,00 | 0 | |||||
| 2025-07-22 | 13F | Red Tortoise LLC | 1.290 | 0,00 | 362 | 10,70 | ||||
| 2025-07-25 | 13F | Tranquility Partners, LLC | 1.202 | 8,78 | 338 | 20,36 | ||||
| 2025-07-17 | 13F | Halbert Hargrove Global Advisors, Llc | 36.927 | 7,82 | 10.371 | 19,29 | ||||
| 2025-08-08 | 13F | Citizens Financial Group Inc/ri | 2.406 | 0,04 | 676 | 10,66 | ||||
| 2025-08-14 | 13F | Jane Street Group, Llc | 9.574 | 2.689 | ||||||
| 2025-08-11 | 13F | Aptus Capital Advisors, LLC | 1.401 | 5,66 | 394 | 16,96 | ||||
| 2025-08-12 | 13F | Ameritas Investment Partners, Inc. | 2.953 | -1,20 | 829 | 9,37 | ||||
| 2025-07-16 | 13F | West Branch Capital LLC | 179 | 0,00 | 50 | 11,11 | ||||
| 2025-08-14 | 13F | Susquehanna International Group, Llp | 5.146 | -26,60 | 1.445 | -18,77 | ||||
| 2025-07-09 | 13F | Goelzer Investment Management, Inc. | 1.892 | 3,16 | 531 | 14,19 | ||||
| 2025-08-04 | 13F | HBK Sorce Advisory LLC | 1.885 | -0,21 | 529 | 10,44 | ||||
| 2025-07-14 | 13F | Opal Wealth Advisors, LLC | 215 | 60 | ||||||
| 2025-08-06 | 13F | Rialto Wealth Management, LLC | 35.535 | -0,97 | 9.980 | 9,56 | ||||
| 2025-08-12 | 13F | Argent Trust Co | 1.250 | 0,00 | 351 | 10,73 | ||||
| 2025-08-05 | 13F | Mma Asset Management Llc | 900 | 0,00 | 253 | 10,53 | ||||
| 2025-08-08 | 13F | Cetera Investment Advisers | 65.437 | 20,20 | 18.379 | 32,99 | ||||
| 2025-08-11 | 13F | Outlook Wealth Advisors, LLC | 741 | 208 | ||||||
| 2025-08-12 | 13F | MAI Capital Management | 151.668 | 7,79 | 42.597 | 19,26 | ||||
| 2025-08-12 | 13F | Gladstone Institutional Advisory LLC | 735 | 206 | ||||||
| 2025-07-09 | 13F | PFW Advisors LLC | 4.596 | -15,87 | 1.291 | -6,93 | ||||
| 2025-07-22 | 13F | Old National Bancorp /in/ | 88.151 | 6,70 | 24.758 | 18,05 | ||||
| 2025-08-08 | 13F | Compass Wealth Management LLC | 3.125 | 0,00 | 878 | 10,59 | ||||
| 2025-08-08 | 13F | Capital Investment Advisory Services, LLC | 1.027 | 0,00 | 289 | 10,77 | ||||
| 2025-08-13 | 13F | Cerity Partners LLC | 186.028 | -11,03 | 52.248 | -1,57 | ||||
| 2025-08-14 | 13F | Ameriprise Financial Inc | 786.779 | 1,95 | 220.974 | 12,78 | ||||
| 2025-07-28 | 13F | Mitchell Mcleod Pugh & Williams Inc | 6.296 | -1,10 | 1.768 | 9,47 | ||||
| 2025-04-18 | 13F | Cornerstone Wealth Management, LLC | 0 | -100,00 | 0 | -100,00 | ||||
| 2025-08-12 | 13F | J.w. Cole Advisors, Inc. | 1.073 | 2,68 | 301 | 13,58 | ||||
| 2025-08-01 | 13F | Financial Counselors Inc | 0 | -100,00 | 0 | |||||
| 2025-07-09 | 13F | Alesco Advisors Llc | 17.827 | -1,57 | 5.007 | 8,90 | ||||
| 2025-08-18 | 13F | Geneos Wealth Management Inc. | 145 | 0,00 | 41 | 11,11 | ||||
| 2025-08-14 | 13F | Guardian Wealth Advisors, Llc / Nc | 1.325 | 6,00 | 372 | 17,35 | ||||
| 2025-07-09 | 13F | Inspirion Wealth Advisors, Llc | 887 | 0,00 | 249 | 10,67 | ||||
| 2025-07-10 | 13F | Peoples Bank/KS | 0 | -100,00 | 0 | |||||
| 2025-07-22 | 13F | Clarius Group, LLC | 3.741 | 0,00 | 1.051 | 10,64 | ||||
| 2025-08-04 | 13F | Golden Road Advisors Llc | 3.520 | 0,00 | 989 | 10,64 | ||||
| 2025-08-08 | 13F | Sawgrass Asset Management Llc | 49.012 | -0,86 | 13.766 | 9,68 | ||||
| 2025-07-29 | 13F | BXM Wealth LLC | 2.600 | -1,89 | 730 | 8,63 | ||||
| 2025-07-09 | 13F | Heritage Family Offices, LLP | 1.002 | 0,00 | 253 | -0,39 | ||||
| 2025-08-08 | 13F | Avantax Advisory Services, Inc. | 27.426 | -20,00 | 7.703 | -11,49 | ||||
| 2025-08-18 | 13F | Hershey Financial Advisers, LLC | 4.279 | -10,98 | 1.202 | -6,32 | ||||
| 2025-08-04 | 13F | Pensionmark Financial Group, Llc | 865 | -0,12 | 243 | 10,50 | ||||
| 2025-07-08 | 13F | Lpwm Llc | 15.564 | -1,41 | 4.371 | 9,08 | ||||
| 2025-07-21 | 13F/A | Abacus Planning Group, Inc. | 4.535 | 0,00 | 1.274 | 10,60 | ||||
| 2025-07-23 | 13F | Madden Advisory Services, Inc. | 2.599 | -3,13 | 730 | 7,05 | ||||
| 2025-08-08 | 13F | Red Cedar Investment Management, Llc | 561.002 | -4,60 | 157.563 | 5,55 | ||||
| 2025-08-14 | 13F | Colony Group, LLC | 41.589 | 0,74 | 11.681 | 11,45 | ||||
| 2025-05-06 | 13F | Venturi Wealth Management, LLC | 0 | -100,00 | 0 | |||||
| 2025-07-23 | 13F | Litman Gregory Asset Management LLC | 67.658 | 6,63 | 19.002 | 17,97 | ||||
| 2025-08-14 | 13F | Federation des caisses Desjardins du Quebec | 10 | 0,00 | 3 | 0,00 | ||||
| 2025-07-28 | 13F | Mutual Advisors, LLC | 5.362 | 0,04 | 1.553 | 15,82 | ||||
| 2025-07-23 | 13F | Valmark Advisers, Inc. | 957 | 0,00 | 269 | 10,74 | ||||
| 2025-08-14 | 13F | First Manhattan Co | 18.176 | -0,44 | 5.105 | 10,14 | ||||
| 2025-07-14 | 13F | Cherrydale Wealth Management, Llc | 57.909 | -10,77 | 16.264 | -1,28 | ||||
| 2025-08-04 | 13F | AMG National Trust Bank | 4.952 | 3,38 | 1.391 | 14,40 | ||||
| 2025-07-17 | 13F | Nicholson Meyer Capital Management, Inc. | 820 | 0,00 | 230 | 10,58 | ||||
| 2025-08-08 | 13F | Intrua Financial, LLC | 1.028 | 0,00 | 289 | 10,77 | ||||
| 2025-08-14 | 13F | Fmr Llc | 789.235 | 0,86 | 221.665 | 11,58 | ||||
| 2025-07-17 | 13F | Beacon Capital Management, LLC | 222 | 0,45 | 62 | 10,71 | ||||
| 2025-08-14 | 13F | Smartleaf Asset Management LLC | 12 | -92,41 | 3 | -92,31 | ||||
| 2025-08-14 | 13F | Qube Research & Technologies Ltd | 392 | 24,05 | 110 | 37,50 | ||||
| 2025-08-14 | 13F | Becker Capital Management Inc | 3.480 | 1,16 | 977 | 11,91 | ||||
| 2025-08-04 | 13F | Daymark Wealth Partners, Llc | 3.358 | 0,00 | 943 | 10,68 | ||||
| 2025-07-16 | 13F | Vestia Personal Wealth Advisors | 973 | 0,21 | 273 | 10,98 | ||||
| 2025-04-21 | 13F | O'Dell Group, LLC | 0 | -100,00 | 0 | |||||
| 2025-07-21 | 13F | Ameritas Advisory Services, LLC | 486 | 136 | ||||||
| 2025-07-25 | 13F | Endowment Wealth Management, Inc. | 9.710 | 2,65 | 2.727 | 13,58 | ||||
| 2025-07-29 | 13F | Foster & Motley Inc | 8.626 | -18,01 | 2 | 0,00 | ||||
| 2025-08-12 | 13F | AlphaCore Capital LLC | 254 | 122,81 | 71 | 153,57 | ||||
| 2025-07-09 | 13F | Thrive Wealth Management, LLC | 31.743 | 2,07 | 8.915 | 12,93 | ||||
| 2025-04-21 | 13F | Nelson, Van Denburg & Campbell Wealth Management Group, LLC | 0 | -100,00 | 0 | |||||
| 2025-07-29 | 13F | Regions Financial Corp | 15.571 | -0,41 | 4.373 | 10,18 | ||||
| 2025-08-13 | 13F | M&t Bank Corp | 34.268 | 7,04 | 9.625 | 18,42 | ||||
| 2025-08-25 | 13F | Hilltop Partners LLC | 246.576 | 34,91 | 69.253 | 49,26 | ||||
| 2025-08-14 | 13F | Comerica Bank | 27.343 | -2,46 | 7.680 | 7,91 | ||||
| 2025-08-14 | 13F | Headinvest, Llc | 990 | 0,00 | 278 | 10,76 | ||||
| 2025-07-31 | 13F | Opus Capital Group, LLC | 62.725 | 8,64 | 18 | 21,43 | ||||
| 2025-08-12 | 13F | Global Retirement Partners, LLC | 2.342 | -22,17 | 658 | -18,08 | ||||
| 2025-07-14 | 13F | U.S. Capital Wealth Advisors, LLC | 1.574 | 30,08 | 442 | 43,97 | ||||
| 2025-08-14 | 13F | Arete Wealth Advisors, LLC | 18.882 | -4,39 | 5 | 0,00 | ||||
| 2025-07-18 | 13F | Truist Financial Corp | 11.689 | 7,53 | 3.283 | 18,99 | ||||
| 2025-07-30 | 13F | Rehmann Capital Advisory Group | 7.146 | 786,60 | 2.007 | 883,82 | ||||
| 2025-07-28 | 13F | Delap Wealth Advisory, Llc | 1.130 | 0,00 | 317 | 10,84 | ||||
| 2025-08-13 | 13F | M Holdings Securities, Inc. | 17.627 | 1,11 | 5 | 0,00 | ||||
| 2025-07-24 | 13F | Us Bancorp \de\ | 876 | 0,81 | 246 | 11,82 | ||||
| 2025-08-04 | 13F | Atria Investments Llc | 3.997 | 1,22 | 1.123 | 11,98 | ||||
| 2025-07-11 | 13F | AA Financial Advisors, LLC | 1.387 | 0,00 | 390 | 10,51 | ||||
| 2025-07-24 | 13F | Williams & Novak, LLC | 4.586 | 1.288 | ||||||
| 2025-08-12 | 13F | Nemes Rush Group LLC | 1.118 | 0,36 | 314 | 10,99 | ||||
| 2025-08-12 | 13F | BlackRock, Inc. | 1.358 | 0,00 | 381 | 10,76 | ||||
| 2025-07-14 | 13F | AdvisorNet Financial, Inc | 8.813 | 17,60 | 2.475 | 30,13 | ||||
| 2025-08-12 | 13F | Jpmorgan Chase & Co | 44.213 | 4,26 | 12.418 | 15,35 | ||||
| 2025-07-08 | 13F | Apella Capital, LLC | 209.360 | 66,16 | 59.113 | 90,60 | ||||
| 2025-07-28 | 13F | Private Wealth Asset Management, LLC | 348 | 0,00 | 98 | 10,23 | ||||
| 2025-08-11 | 13F | Wbi Investments, Inc. | 794 | 223 | ||||||
| 2025-07-29 | 13F | Chicago Partners Investment Group LLC | 2.269 | 0,22 | 654 | 13,17 | ||||
| 2025-08-12 | 13F | LPL Financial LLC | 104.724 | 0,83 | 29.413 | 11,55 | ||||
| 2025-08-13 | 13F | Baird Financial Group, Inc. | 111.335 | -13,70 | 31.270 | -4,52 | ||||
| 2025-07-23 | 13F | Hardy Reed LLC | 1.342 | -3,45 | 377 | 6,82 | ||||
| 2025-08-12 | 13F | FourThought Financial Partners, LLC | 33.134 | 12,39 | 9.306 | 24,35 | ||||
| 2025-07-25 | 13F | Fifth Third Wealth Advisors LLC | 7.735 | 54,92 | 2.172 | 71,43 | ||||
| 2025-08-13 | 13F | American Investment Services, Inc. | 4.576 | 0,99 | 1.285 | 11,74 | ||||
| 2025-08-05 | 13F | Hapanowicz & Associates Financial Services, Inc | 20.360 | 18,31 | 5.719 | 30,91 | ||||
| 2025-08-05 | 13F | Sigma Planning Corp | 10.010 | 91,80 | 2.812 | 112,31 | ||||
| 2025-08-11 | 13F | Independent Advisor Alliance | 1.119 | 0,00 | 314 | 10,56 | ||||
| 2025-08-13 | 13F | Keystone Financial Group | 8.965 | 12,55 | 2.518 | 24,48 | ||||
| 2025-06-24 | 13F | Rainier Family Wealth Inc | 0 | -100,00 | 0 | -100,00 | ||||
| 2025-08-14 | 13F | Matrix Private Capital Group Llc | 17 | 5 | ||||||
| 2025-08-01 | 13F | Anson Capital, Inc. | 4.489 | -1,69 | 1.261 | 8,71 | ||||
| 2025-08-06 | 13F | SOUTH STATE Corp | 61.304 | -18,59 | 17.218 | -9,93 | ||||
| 2025-05-12 | 13F | JFG Wealth Management, LLC | 0 | -100,00 | 0 | |||||
| 2025-08-15 | 13F | CI Private Wealth, LLC | 13.596 | 112,50 | 3.818 | 135,10 | ||||
| 2025-07-23 | 13F | Friedenthal Financial | 2 | 100,00 | 1 | |||||
| 2025-07-31 | 13F | Cambridge Investment Research Advisors, Inc. | 52.246 | 6,13 | 15 | 16,67 | ||||
| 2025-07-21 | 13F | Pflug Koory, LLC | 25 | 7 | ||||||
| 2025-08-07 | 13F | Commerce Bank | 15.601 | -6,72 | 4.382 | 3,20 | ||||
| 2025-08-07 | 13F | Topel & Distasi Wealth Management, LLC | 9.367 | 0,00 | 2.631 | 10,64 | ||||
| 2025-08-12 | 13F | Franklin Resources Inc | 350 | 98 | ||||||
| 2025-08-13 | 13F | Twin Peaks Wealth Advisors, LLC | 2.708 | -1,81 | 791 | 17,56 | ||||
| 2025-08-05 | 13F | Strategic Financial Concepts, LLC | 0 | -100,00 | 0 | |||||
| 2025-08-14 | 13F | Stifel Financial Corp | 416.572 | 5,59 | 116.998 | 16,82 | ||||
| 2025-08-11 | 13F | Private Advisor Group, LLC | 3.726 | 71,78 | 1.047 | 90,18 | ||||
| 2025-07-24 | 13F | Cyndeo Wealth Partners, LLC | 1.087 | 0,00 | 305 | 10,91 | ||||
| 2025-08-14 | 13F | Bragg Financial Advisors, Inc | 5.238 | 412,02 | 1.471 | 467,95 | ||||
| 2025-07-23 | 13F | Narwhal Capital Management | 1.568 | 0,00 | 440 | 10,55 | ||||
| 2025-07-24 | 13F | Jfs Wealth Advisors, Llc | 8.595 | 0,00 | 2.414 | 10,64 | ||||
| 2025-07-24 | 13F | Blair William & Co/il | 752 | 7,43 | 211 | 19,21 | ||||
| 2025-08-13 | 13F | Rsm Us Wealth Management Llc | 59.646 | 18,65 | 16.752 | 31,27 | ||||
| 2025-08-14 | 13F | Camden Capital, LLC | 3.076 | 0,59 | 864 | 11,79 | ||||
| 2025-05-01 | 13F | Fort Sheridan Advisors Llc | 0 | -100,00 | 0 | |||||
| 2025-07-30 | 13F | Retirement Planning Group | 1.910 | 0,00 | 536 | 10,74 | ||||
| 2025-07-11 | 13F | CMH Wealth Management LLC | 14.940 | -3,11 | 4.196 | 7,20 | ||||
| 2025-08-14 | 13F | Note Advisors, LLC | 23.771 | -1,98 | 6.676 | 8,45 | ||||
| 2025-05-07 | 13F | Mitchell Sinkler & Starr/pa | 0 | -100,00 | 0 | |||||
| 2025-08-14 | 13F | UBS Group AG | 785.817 | 16,65 | 220.705 | 29,06 | ||||
| 2025-07-25 | 13F | Cwm, Llc | 0 | -100,00 | 0 | |||||
| 2025-08-11 | 13F | Teachers Insurance & Annuity Association Of America | 1.295 | -0,99 | 364 | 9,34 | ||||
| 2025-08-14 | 13F | Kovitz Investment Group Partners, LLC | 6.565 | -4,92 | 1.844 | 5,19 |
Other Listings
| GB:0LNF |