Grundlæggende statistik
| Institutionelle aktier (lange) | 153.231.835 - 88,01% (ex 13D/G) - change of -33,57MM shares -17,97% MRQ |
| Institutionel værdi (lang) | $ 12.187.281 USD ($1000) |
Institutionelt ejerskab og aktionærer
Textron Inc. (US:TXT) har 762 institutionelle ejere og aktionærer, der har indsendt 13D/G- eller 13F-formularer til Securities Exchange Commission (SEC). Disse institutioner har i alt 153,231,835 aktier. Største aktionærer omfatter Vanguard Group Inc, BlackRock, Inc., State Street Corp, Fmr Llc, Invesco Ltd., Boston Partners, Aqr Capital Management Llc, T. Rowe Price Investment Management, Inc., Geode Capital Management, Llc, and Lsv Asset Management .
Textron Inc. (NYSE:TXT) institutionel ejerskabsstruktur viser aktuelle positioner i virksomheden efter institutioner og fonde, samt seneste ændringer i positionsstørrelse. Større aktionærer kan omfatte individuelle investorer, investeringsforeninger, hedgefonde eller institutioner. Skema 13D angiver, at investoren besidder (eller besidder) mere end 5 % af virksomheden og har til hensigt (eller har til hensigt at) aktivt at forfølge en ændring i forretningsstrategi. Skema 13G indikerer en passiv investering på over 5%.
The share price as of April 10, 2026 is 91,39 / share. Previously, on April 14, 2025, the share price was 65,99 / share. This represents an increase of 38,49% over that period.

Fondens stemningsscore
Fund Sentiment Score (fka Ownership Accumulation Score) finder de aktier, der bliver mest købt af fonde. Det er resultatet af en sofistikeret, multi-faktor kvantitativ model, der identificerer virksomheder med de højeste niveauer af institutionel akkumulering. Scoringsmodellen bruger en kombination af den samlede stigning i oplyste ejere, ændringerne i porteføljeallokeringer i disse ejere og andre målinger. Tallet går fra 0 til 100, hvor højere tal indikerer et højere niveau af akkumulering for sine jævnaldrende, og 50 er gennemsnittet.
Opdateringsfrekvens: Dagligt
Se Ownership Explorer, som giver en liste over højest rangerende virksomheder.
AI+ Ask Fintel’s AI assistant about Textron Inc..
Select a question to share a public post with an AI-crafted answer.
Thinking of good questions…
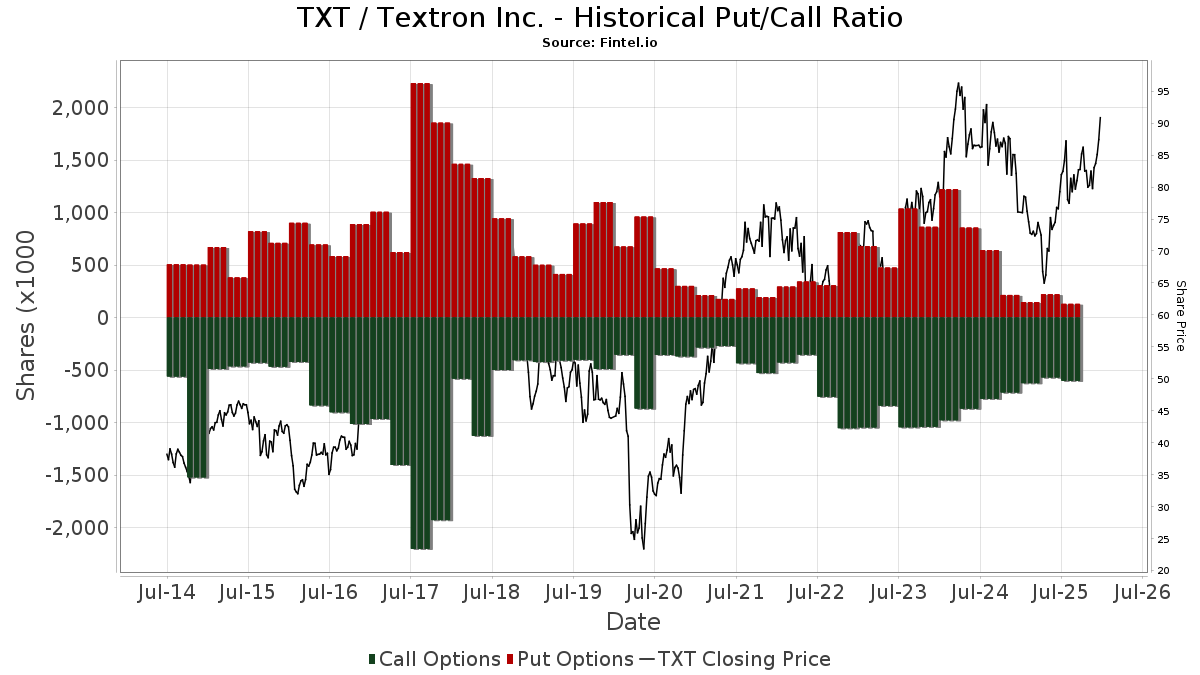
Institutionel Put/Call-forhold
Ud over at indberette standardaktie- og gældsudstedelser skal institutter med mere end 100 mill. aktiver under forvaltning også oplyse deres put- og call-optionsbeholdninger. Da salgsoptioner generelt indikerer negativ stemning, og købsoptioner indikerer positiv stemning, kan vi få en fornemmelse af den overordnede institutionelle stemning ved at plotte forholdet mellem put og kald. Diagrammet til højre viser det historiske put/call-forhold for dette instrument.
Brug af Put/Call Ratio som en indikator for investorernes stemning overvinder en af de vigtigste mangler ved at bruge totalt institutionelt ejerskab, som er, at en betydelig mængde af aktiver under forvaltning investeres passivt for at spore indekser. Passivt forvaltede fonde køber typisk ikke optioner, så indikatoren for put/call-forholdet følger mere nøje følelsen af aktivt forvaltede fonde.
13D/G-arkivering
Vi præsenterer 13D/G ansøgninger separat fra 13F ansøgninger på grund af den forskellige behandling af SEC. 13D/G-ansøgninger kan indgives af grupper af investorer (med én ledende), hvorimod 13F-ansøgninger ikke kan. Dette resulterer i situationer, hvor en investor kan indsende en 13D/G, der rapporterer én værdi for de samlede aktier (der repræsenterer alle de aktier, der ejes af investorgruppen), men derefter indsender en 13F, der rapporterer en anden værdi for de samlede aktier (der udelukkende repræsenterer deres egne) ejendomsret). Det betyder, at aktieejerskab af 13D/G-arkiver og 13F-arkiveringer ofte ikke er direkte sammenlignelige, så vi præsenterer dem separat.
Bemærk: Fra den 16. maj 2021 viser vi ikke længere ejere, der ikke har indsendt en 13D/G inden for det seneste år. Tidligere viste vi den fulde historie af 13D/G-arkiver. Generelt skal enheder, der er forpligtet til at indgive 13D/G-ansøgninger, indgive mindst årligt, før de indsender en afsluttende ansøgning. Dog forlader fonde nogle gange positioner uden at indsende en afsluttende ansøgning (dvs. de afvikler), så visning af den fulde historie resulterede nogle gange i forvirring om det nuværende ejerskab. For at undgå forvirring viser vi nu kun 'aktuelle' ejere - det vil sige - ejere, der har anmeldt inden for det seneste år.
Upgrade to unlock premium data.
| Fil dato | Form | Investor | Forrige Aktier |
Seneste Aktier |
Δ Aktier (Procent) |
Ejendomsret (Procent) |
Δ Ejerskab (Procent) |
|
|---|---|---|---|---|---|---|---|---|
| 2025-11-14 | T. Rowe Price Investment Management, Inc. | 12,854,499 | 8,210,360 | -36.13 | 4.60 | -33.33 | ||
| 2025-11-10 | STATE STREET CORP | 9,220,909 | 5.20 |
13F og NPORT arkivering
Detaljer om 13F-arkivering er gratis. Detaljer om NP-ansøgninger kræver et premium-medlemskab. Grønne rækker angiver nye positioner. Røde rækker angiver lukkede positioner. Klik på linket ikon for at se den fulde transaktionshistorik.
Opgrader
for at låse premium-data op og eksportere til Excel ![]() .
.
Important Note
In an effort to reduce load times for our mobile users, we are testing some ways to deliver lighter pages.
In this first test, we will deliver only the most recent 750 transactions (out of 906 for this stock). If you are interested in loading *all* the transactions for this company, click the "load all" button below. This is just a test and if you don't like it, please let us know by submitting some gentle feedback via the link at the bottom of this page.
Load All| Fil dato | Kilde | Investor | Type | Gennemsnitlig pris (Øst) |
Aktier | Δ Aktier (%) |
Rapporteret Værdi ($1000) |
Δ Værdi (%) |
Port Alloc (%) |
|
|---|---|---|---|---|---|---|---|---|---|---|
| 2026-01-28 | 13F | HB Wealth Management, LLC | 8.815 | 41,97 | 768 | 46,56 | ||||
| 2026-01-09 | 13F | Diversified Trust Co | 0 | -100,00 | 0 | -100,00 | ||||
| 2026-02-17 | 13F | Summit Trail Advisors, Llc | 15.035 | -26,75 | 1.311 | -24,45 | ||||
| 2026-02-17 | 13F | Sagewood Asset Management LP | 2.816 | 245 | ||||||
| 2026-02-17 | 13F | Farringdon Capital, Ltd. | 9.882 | 861 | ||||||
| 2026-02-13 | 13F | Arrowstreet Capital, Limited Partnership | 524.139 | -50,00 | 45.689 | -48,41 | ||||
| 2026-02-18 | 13F | Vident Advisory, LLC | 5.059 | -98,76 | 441 | -98,72 | ||||
| 2026-02-13 | 13F | First Trust Advisors Lp | 557.255 | 43,98 | 48.576 | 48,56 | ||||
| 2026-01-09 | 13F | Zrc Wealth Management, Llc | 28 | 2 | ||||||
| 2026-02-17 | 13F | XTX Topco Ltd | 8.576 | 67,99 | 748 | 73,32 | ||||
| 2026-02-17 | 13F | Balyasny Asset Management Llc | 19.886 | -97,01 | 1.733 | -96,92 | ||||
| 2025-11-06 | 13F | Financial Advocates Investment Management | 0 | -100,00 | 0 | -100,00 | ||||
| 2026-02-02 | 13F | GenTrust, LLC | 2.652 | 231 | ||||||
| 2026-01-14 | 13F | Moisand Fitzgerald Tamayo, LLC | 78 | 0,00 | 7 | 0,00 | ||||
| 2026-01-15 | 13F | Nisa Investment Advisors, Llc | 71.581 | -28,67 | 6.241 | -26,41 | ||||
| 2026-02-10 | 13F | Sivia Capital Partners, LLC | 10.173 | 78,69 | 887 | 84,20 | ||||
| 2026-02-13 | 13F | Natixis | 4.714 | -87,61 | 411 | -87,24 | ||||
| 2026-02-13 | 13F | Vontobel Holding Ltd. | 2.633 | 0,00 | 230 | 3,15 | ||||
| 2026-02-06 | 13F | Twin Capital Management Inc | 12.533 | 0,25 | 1.093 | 3,41 | ||||
| 2026-01-23 | 13F | Optima Capital Llc | 15 | 1 | ||||||
| 2026-02-17 | 13F | United Capital Financial Advisers, Llc | 10.638 | 37,16 | 927 | 41,53 | ||||
| 2026-01-08 | 13F | Brave Asset Management Inc | 7.800 | -2,50 | 680 | 0,59 | ||||
| 2026-02-17 | 13F | Ancora Advisors, LLC | 2.791 | 32,65 | 243 | 37,29 | ||||
| 2026-01-29 | 13F | Vanguard Group Inc | 20.542.748 | -1,64 | 1.790.711 | 1,48 | ||||
| 2026-02-13 | 13F | SYM FINANCIAL Corp | 3.357 | 19,98 | 293 | 23,73 | ||||
| 2026-02-09 | 13F | Jefferies Financial Group Inc. | 212.469 | 18.521 | ||||||
| 2026-02-02 | 13F | Montag A & Associates Inc | 9.205 | -31,00 | 803 | -28,84 | ||||
| 2026-02-13 | 13F | Mml Investors Services, Llc | 23.788 | 9,80 | 2.074 | 13,28 | ||||
| 2026-02-13 | 13F | Commerce Bank | 53.734 | 0,11 | 4.684 | 3,29 | ||||
| 2026-01-23 | 13F | Assetmark, Inc | 498 | 1,01 | 43 | 4,88 | ||||
| 2026-02-12 | 13F | Wealthspire Advisors, LLC | 2.482 | 1.166,33 | 216 | 1.250,00 | ||||
| 2026-02-10 | 13F | Root Financial Partners, LLC | 630 | 24,51 | 55 | 28,57 | ||||
| 2026-02-12 | 13F | Commonwealth Equity Services, Llc | 35.637 | -1,55 | 3.106 | 103.433,33 | ||||
| 2026-02-10 | 13F | Goldman Sachs Group Inc | 1.191.811 | 22,41 | 103.890 | 26,29 | ||||
| 2026-01-29 | 13F | Sanctuary Advisors, LLC | 17.900 | 21,16 | 1.560 | 25,00 | ||||
| 2026-02-02 | 13F | Strs Ohio | 4.207 | -0,94 | 367 | 2,23 | ||||
| 2026-02-13 | 13F | Alta Fox Capital Management, Llc | 0 | -100,00 | 0 | |||||
| 2026-02-13 | 13F | Truvestments Capital Llc | 101 | -26,28 | 9 | -27,27 | ||||
| 2026-01-14 | 13F | ORG Partners LLC | 42 | 50,00 | 4 | 50,00 | ||||
| 2026-02-13 | 13F | Treasurer of the State of North Carolina | 73.593 | -7,85 | 6 | 0,00 | ||||
| 2026-01-06 | 13F | Nelson, Van Denburg & Campbell Wealth Management Group, LLC | 0 | -100,00 | 0 | |||||
| 2026-02-17 | 13F | Aqr Capital Management Llc | 5.357.182 | 51,10 | 466.986 | 56,58 | ||||
| 2025-11-13 | 13F | Twin Tree Management, LP | Call | 0 | -100,00 | 0 | -100,00 | |||
| 2026-02-11 | 13F | Brandywine Global Investment Management, LLC | 127.683 | -1,88 | 11.130 | 1,23 | ||||
| 2026-01-26 | 13F | Merit Financial Group, LLC | 26.018 | 44,84 | 2.268 | 49,51 | ||||
| 2026-02-05 | 13F | HFM Investment Advisors, LLC | 52 | 333,33 | 5 | 300,00 | ||||
| 2026-02-17 | 13F | Private Advisor Group, LLC | 16.003 | 4,34 | 1.395 | 7,64 | ||||
| 2026-02-11 | 13F | Waddell & Associates, Llc | 5.470 | 477 | ||||||
| 2025-11-13 | 13F | Glenmede Investment Management, LP | 14.123 | 1,02 | 1.193 | 6,33 | ||||
| 2026-01-27 | 13F | Financial Management Professionals, Inc. | 365 | 0,00 | 32 | 3,33 | ||||
| 2026-02-03 | 13F | Denali Advisors Llc | 3.710 | 323 | ||||||
| 2025-11-14 | 13F | Two Sigma Securities, Llc | 0 | -100,00 | 0 | -100,00 | ||||
| 2025-11-07 | 13F | Sierra Ocean, Llc | 0 | -100,00 | 0 | |||||
| 2026-02-12 | 13F | Massachusetts Institute Of Technology | 16.000 | 0,00 | 1.395 | 3,18 | ||||
| 2026-02-12 | 13F | DRW Securities, LLC | 2.461 | 215 | ||||||
| 2026-02-13 | 13F | Neo Ivy Capital Management | 45.766 | 588,21 | 3.989 | 611,05 | ||||
| 2026-02-11 | 13F | Vise Technologies, Inc. | 7.627 | 11,91 | 665 | 15,48 | ||||
| 2026-02-11 | 13F | CLARET ASSET MANAGEMENT Corp | 2.612 | -0,23 | 0 | |||||
| 2026-02-17 | 13F | Silvercrest Asset Management Group Llc | 29.463 | 0,00 | 2.568 | 3,17 | ||||
| 2026-02-17 | 13F | Engineers Gate Manager LP | 594.879 | -12,62 | 51.856 | -9,85 | ||||
| 2026-01-23 | 13F | Avion Wealth | 23 | -25,81 | 0 | |||||
| 2026-02-02 | 13F | Principal Financial Group Inc | 194.484 | 1,36 | 16.953 | 4,58 | ||||
| 2026-02-17 | 13F | Amundi | 135.785 | 5,87 | 11.836 | 5,67 | ||||
| 2026-04-08 | 13F | NorthCrest Asset Manangement, LLC | 13.045 | -25,00 | 1.149 | -25,84 | ||||
| 2026-02-13 | 13F | Cito Capital Group, LLC | 0 | -100,00 | 0 | |||||
| 2026-01-23 | 13F | Stanley-Laman Group, Ltd. | 27.866 | 6,64 | 2.429 | 10,06 | ||||
| 2026-02-10 | 13F | Basepoint Wealth LLC | 255 | 22 | ||||||
| 2026-02-13 | 13F | Umb Bank N A/mo | 1.488 | 5,83 | 130 | 9,32 | ||||
| 2025-11-14 | 13F | ICONIQ Capital, LLC | 0 | -100,00 | 0 | |||||
| 2026-02-17 | 13F | Tudor Investment Corp Et Al | Call | 3.100 | -6,06 | 270 | -2,88 | |||
| 2026-01-28 | 13F | CAPROCK Group, Inc. | 11.636 | 26,75 | 1.015 | 37,96 | ||||
| 2026-02-17 | 13F | Tudor Investment Corp Et Al | 4.006 | 349 | ||||||
| 2026-01-21 | 13F | Rocky Mountain Advisers, Llc | 822 | 0,00 | 72 | 2,90 | ||||
| 2026-02-13 | 13F | Mufg Securities Americas Inc. | 4.748 | -1,21 | 414 | 1,72 | ||||
| 2025-10-17 | 13F | FSC Wealth Advisors, LLC | 0 | -100,00 | 0 | -100,00 | ||||
| 2026-01-26 | 13F | Prosperity Financial Group, Inc. | 6.284 | 7,33 | 548 | 10,73 | ||||
| 2026-02-05 | 13F | Qsemble Capital Management, LP | 0 | -100,00 | 0 | -100,00 | ||||
| 2026-02-13 | 13F | Capital Financial Group Inc\co\ /adv | 5.301 | 462 | ||||||
| 2026-02-06 | 13F | Frisch Financial Group, Inc. | 2.364 | 206 | ||||||
| 2025-11-10 | 13F | Stevens Capital Management Lp | 0 | -100,00 | 0 | |||||
| 2026-01-26 | 13F | AE Wealth Management LLC | 32.556 | -0,46 | 2.838 | 2,68 | ||||
| 2026-02-11 | 13F | Prestige Wealth Management Group LLC | 1.231 | 0,00 | 107 | 2,88 | ||||
| 2026-02-11 | 13F | Vestcor Inc | 3.674 | 0,00 | 0 | |||||
| 2026-02-10 | 13F | Intech Investment Management Llc | 48.883 | 238,27 | 4.261 | 249,26 | ||||
| 2026-01-26 | 13F | Welch Group, LLC | 15.400 | 0,00 | 1.342 | 3,15 | ||||
| 2026-02-12 | 13F | Fuller & Thaler Asset Management, Inc. | 5.300 | 0,00 | 462 | 3,36 | ||||
| 2026-02-06 | 13F | Tredje AP-fonden | 0 | -100,00 | 0 | -100,00 | ||||
| 2026-02-12 | 13F | Keeler THomas Management LLC | 12.445 | -2,35 | 1.085 | 0,74 | ||||
| 2026-02-17 | 13F/A | RBF Capital, LLC | 5.000 | 0,00 | 436 | 3,08 | ||||
| 2026-01-30 | 13F | Torren Management, LLC | 572 | 50 | ||||||
| 2026-02-17 | 13F | Sciencast Management LP | 0 | -100,00 | 0 | -100,00 | ||||
| 2026-02-11 | 13F | Manchester Capital Management LLC | 324 | 28 | ||||||
| 2026-02-13 | 13F | Boston Partners | 7.235.722 | -0,30 | 630.882 | 2,86 | ||||
| 2026-01-20 | 13F | Nvwm, Llc | 5 | 0,00 | 0 | |||||
| 2026-01-29 | 13F | Nbc Securities, Inc. | 324 | -20,98 | 28 | -17,65 | ||||
| 2026-02-13 | 13F | Macquarie Group Ltd | 21.783 | -88,66 | 1.899 | -88,30 | ||||
| 2026-02-12 | 13F | Counterpoint Mutual Funds LLC | 4.420 | 319 | ||||||
| 2026-01-20 | 13F | Moseley Investment Management Inc | 2.900 | 0,00 | 253 | 2,86 | ||||
| 2026-02-10 | 13F | New Mexico Educational Retirement Board | 8.257 | 1,23 | 1 | |||||
| 2026-02-09 | 13F | Onefund, Llc | 561 | 4,86 | 49 | 6,67 | ||||
| 2026-02-09 | 13F | Glenview Trust Co | 3.021 | 0,00 | 263 | 3,14 | ||||
| 2026-04-08 | 13F | DiNuzzo Private Wealth, Inc. | 22 | 0,00 | 2 | 0,00 | ||||
| 2026-04-02 | 13F | Byrne Asset Management LLC | 1.239 | -21,23 | 108 | -21,17 | ||||
| 2026-02-10 | 13F | Fideuram Asset Management (Ireland) dac | 122 | 9 | ||||||
| 2026-04-08 | 13F | Grove Bank & Trust | 207 | 0,00 | 18 | 0,00 | ||||
| 2026-02-13 | 13F | MAI Capital Management | 5.002 | 4,97 | 436 | 8,21 | ||||
| 2026-02-02 | 13F | Greenfield Savings Bank | 2.505 | -6,00 | 218 | -3,11 | ||||
| 2026-02-06 | 13F | GPS Wealth Strategies Group, LLC | 0 | -100,00 | 0 | |||||
| 2026-02-13 | 13F | Johnson Investment Counsel Inc | 0 | -100,00 | 0 | |||||
| 2026-04-08 | 13F | Thompson Investment Management, Inc. | 500 | 0,00 | 44 | 0,00 | ||||
| 2026-02-17 | 13F | Dv Equities, Llc | 248 | 22 | ||||||
| 2026-02-12 | 13F | Scotia Capital Inc. | 21.886 | 530,36 | 1.908 | 550,85 | ||||
| 2026-02-13 | 13F | Estabrook Capital Management | 0 | -100,00 | 0 | |||||
| 2026-02-17 | 13F | North Capital, Inc. | 0 | -100,00 | 0 | |||||
| 2026-01-20 | 13F | SOA Wealth Advisors, LLC. | 439 | 0,00 | 38 | 2,70 | ||||
| 2026-01-29 | 13F | UBS Group AG | 790.542 | -15,02 | 68.912 | -12,32 | ||||
| 2026-02-17 | 13F | Grantham, Mayo, Van Otterloo & Co. LLC | 123.833 | 191,30 | 10.795 | 200,58 | ||||
| 2026-01-29 | 13F | Supplemental Annuity Collective Trust of NJ | 13.200 | -26,67 | 1.151 | -24,34 | ||||
| 2026-01-07 | 13F | CWA Asset Management Group, LLC | 22.810 | 1.988 | ||||||
| 2026-02-17 | 13F | Numerai GP LLC | 86.907 | 92,80 | 7.576 | 98,92 | ||||
| 2026-02-11 | 13F | Cookson Peirce & Co Inc | 3.473 | 17,53 | 303 | 21,29 | ||||
| 2026-02-17 | 13F | Voleon Capital Management Lp | 3.866 | 5,28 | 337 | 8,39 | ||||
| 2026-01-27 | 13F | WealthCollab, LLC | 136 | 0,00 | 12 | 0,00 | ||||
| 2026-02-04 | 13F | Oregon Public Employees Retirement Fund | 20.156 | -0,98 | 1.757 | 2,15 | ||||
| 2026-02-17 | 13F | Tcw Group Inc | 7.740 | 675 | ||||||
| 2026-02-05 | 13F | AustralianSuper Pty Ltd | 85.265 | 0,00 | 7.433 | 3,16 | ||||
| 2026-02-17 | 13F | Advisor Group Holdings, Inc. | 17.854 | 5,59 | 1.557 | 11,86 | ||||
| 2026-02-12 | 13F | Bank Of Montreal /can/ | 186.061 | -25,56 | 16.219 | -23,20 | ||||
| 2026-02-17 | 13F | Vinva Investment Management Ltd | 338.130 | 90,47 | 29.870 | 100,24 | ||||
| 2025-11-13 | 13F | Crewe Advisors LLC | 0 | -100,00 | 0 | |||||
| 2026-02-13 | 13F | Squarepoint Ops LLC | Call | 5.100 | 445 | |||||
| 2026-02-11 | 13F | MCF Advisors LLC | 50 | 4 | ||||||
| 2026-02-13 | 13F | Squarepoint Ops LLC | 4.696 | -71,74 | 409 | -70,85 | ||||
| 2026-02-10 | 13F | Eurizon Capital SGR S.p.A. | 6.753 | 590 | ||||||
| 2026-02-13 | 13F | Candriam Luxembourg S.C.A. | 27.481 | 3,13 | 2.396 | 6,40 | ||||
| 2026-01-28 | 13F | WPG Advisers, LLC | 652 | 1,72 | 57 | 3,70 | ||||
| 2025-11-07 | 13F | Shell Asset Management Co | 0 | -100,00 | 0 | |||||
| 2026-02-17 | 13F | SageView Advisory Group, LLC | 4.790 | -53,14 | 418 | -51,68 | ||||
| 2026-02-10 | 13F | Core Wealth Advisors, Llc | 40 | 3 | ||||||
| 2026-01-28 | 13F | Fishman Jay A Ltd/mi | 2.873 | -0,86 | 250 | 2,46 | ||||
| 2026-02-09 | 13F | Hartland & Co., LLC | 10.834 | 25,39 | 944 | 29,32 | ||||
| 2026-02-12 | 13F | Nuveen, LLC | 365.213 | -3,54 | 31.836 | -0,48 | ||||
| 2026-02-17 | 13F | Northern Trust Corp | 1.543.010 | -5,48 | 134.504 | -2,49 | ||||
| 2026-01-30 | 13F | Us Bancorp \de\ | 30.393 | -5,46 | 2.649 | -2,47 | ||||
| 2026-02-17 | 13F | Quantinno Capital Management LP | 265.585 | 31,38 | 23.151 | 35,55 | ||||
| 2026-02-11 | 13F | Ing Groep Nv | 63.374 | 175,08 | 5.524 | 183,86 | ||||
| 2026-04-08 | 13F | Wealth Enhancement Advisory Services, Llc | 119.151 | 27,67 | 9.343 | 10,90 | ||||
| 2026-04-06 | 13F | Rosenberg Matthew Hamilton | 750 | 0,00 | 66 | 0,00 | ||||
| 2026-02-02 | 13F | Qrg Capital Management, Inc. | 27.017 | -5,06 | 2.355 | -2,04 | ||||
| 2026-02-06 | 13F | Addison Advisors LLC | 236 | 0,00 | 21 | 5,26 | ||||
| 2026-02-12 | 13F | Dimensional Fund Advisors Lp | 2.551.781 | 18,88 | 222.455 | 22,67 | ||||
| 2026-02-13 | 13F | Polymer Capital Management (HK) LTD | 0 | -100,00 | 0 | -100,00 | ||||
| 2026-04-07 | 13F | Park Avenue Securities Llc | 0 | -100,00 | 0 | |||||
| 2026-02-13 | 13F | Wilkerson Advisory Group LLC | 298 | 26 | ||||||
| 2025-11-12 | 13F | Edgestream Partners, L.P. | 0 | -100,00 | 0 | -100,00 | ||||
| 2026-04-07 | 13F | CoreCap Advisors, LLC | 2.464 | -0,12 | 216 | 0,00 | ||||
| 2026-04-02 | 13F | Aspect Partners, LLC | 51 | 0,00 | 4 | 0,00 | ||||
| 2026-02-17 | 13F | NEOS Investment Management LLC | 29.927 | 19,81 | 2.609 | 23,60 | ||||
| 2026-01-21 | 13F | Yousif Capital Management, Llc | 13.036 | -4,67 | 1.214 | 5,11 | ||||
| 2026-02-05 | 13F | Beese Fulmer Investment Management, Inc. | 4.118 | 359 | ||||||
| 2026-02-11 | 13F | Wharton Business Group, LLC | 52.320 | 0,00 | 4.561 | 3,17 | ||||
| 2026-04-06 | 13F | Miller Global Investments, LLC | 7.892 | -0,64 | 691 | -0,14 | ||||
| 2026-01-29 | 13F | Inscription Capital, LLC | 0 | -100,00 | 0 | -100,00 | ||||
| 2025-11-07 | 13F | Synovus Financial Corp | 7.556 | -0,42 | 638 | 4,76 | ||||
| 2026-02-12 | 13F | California Public Employees Retirement System | 344.462 | 5,22 | 30.027 | 8,56 | ||||
| 2026-01-29 | 13F | Quest 10 Wealth Builders, Inc. | 1 | 0,00 | 0 | |||||
| 2026-02-17 | 13F | Alliancebernstein L.p. | 187.116 | -0,74 | 16.311 | 2,41 | ||||
| 2025-11-20 | 13F | Maven Securities LTD | Put | 0 | -100,00 | 0 | -100,00 | |||
| 2025-11-20 | 13F | Maven Securities LTD | Call | 0 | -100,00 | 0 | -100,00 | |||
| 2026-01-20 | 13F | Princeton Global Asset Management LLC | 108 | 0,00 | 9 | 0,00 | ||||
| 2025-11-14 | 13F | Wetherby Asset Management Inc | 2.769 | 3,59 | 234 | 8,88 | ||||
| 2026-02-10 | 13F | Winthrop Capital Management, LLC | 15 | 0 | ||||||
| 2026-02-13 | 13F | American Century Companies Inc | 169.180 | 80,21 | 14.747 | 85,94 | ||||
| 2026-02-17 | 13F | D. E. Shaw & Co., Inc. | 485.339 | -53,97 | 42.307 | -52,51 | ||||
| 2026-04-09 | 13F | Moody National Bank Trust Division | 8.133 | 1,13 | 712 | 1,57 | ||||
| 2026-02-05 | 13F | Gamco Investors, Inc. Et Al | 1.380.822 | -0,66 | 120.366 | 2,49 | ||||
| 2026-04-10 | 13F | Perigon Wealth Management, LLC | 0 | -100,00 | 0 | |||||
| 2026-02-09 | 13F | Clune & Associates, Ltd. | 6.583 | 574 | ||||||
| 2025-11-13 | 13F | Twin Tree Management, LP | Put | 0 | -100,00 | 0 | -100,00 | |||
| 2026-02-13 | 13F | Ariadne Wealth Management, LP | 2.139 | 211 | ||||||
| 2026-01-13 | 13F | Parsons Capital Management Inc/ri | 3.300 | 288 | ||||||
| 2026-01-22 | 13F | V-Square Quantitative Management LLC | 3.376 | 294 | ||||||
| 2026-02-17 | 13F | Voloridge Investment Management, Llc | 292.104 | -13,35 | 25.463 | -10,60 | ||||
| 2026-01-26 | 13F | Private Trust Co Na | 444 | -3,48 | 39 | 0,00 | ||||
| 2026-02-11 | 13F | Meeder Asset Management Inc | 124 | -98,76 | 11 | -98,82 | ||||
| 2026-02-13 | 13F | Rafferty Asset Management, LLC | 56.210 | -5,14 | 4.900 | -2,14 | ||||
| 2026-01-21 | 13F | Sound Income Strategies, LLC | 29 | 3 | ||||||
| 2026-02-24 | 13F | SG Trading Solutions, LLC | 4.071 | 0 | ||||||
| 2026-02-05 | 13F | Stephens Inc /ar/ | 3.487 | 2,05 | 304 | 5,21 | ||||
| 2026-01-28 | 13F | Mowery & Schoenfeld Wealth Management, LLC | 16 | 1 | ||||||
| 2026-02-09 | 13F | Integrity Alliance, Llc. | 6.267 | 546 | ||||||
| 2026-01-30 | 13F | North Star Investment Management Corp. | 6 | 0,00 | 1 | |||||
| 2026-01-29 | 13F | Pictet Asset Management Holding SA | 61.257 | 5,38 | 5.342 | 8,76 | ||||
| 2026-02-09 | 13F | V. M. Manning & Co., Inc. | 15.694 | -10,68 | 1.368 | -2,77 | ||||
| 2026-04-10 | 13F | Quaker Wealth Management, LLC | 9 | -18,18 | 1 | |||||
| 2026-02-17 | 13F | Public Employees Retirement System Of Ohio | 57.002 | -4,47 | 4.969 | -1,45 | ||||
| 2026-02-03 | 13F | We Are One Seven, LLC | 3.134 | 12,81 | 273 | 16,67 | ||||
| 2026-01-26 | 13F | Decker Retirement Planning Inc. | 81 | 0,00 | 7 | 16,67 | ||||
| 2026-03-06 | 13F | Hsbc Holdings Plc | 594.070 | -36,26 | 51.793 | -34,20 | ||||
| 2025-11-10 | 13F | Raiffeisen Bank International AG | 0 | 0 | ||||||
| 2026-02-10 | 13F | Minneapolis Portfolio Management Group, LLC | 255.945 | 1,86 | 22.311 | 5,09 | ||||
| 2026-02-09 | 13F | Legal & General Group Plc | 808.757 | -11,14 | 70.499 | -8,32 | ||||
| 2026-02-09 | 13F | Hantz Financial Services, Inc. | 5.120 | -1,04 | 0 | |||||
| 2026-02-18 | 13F | EP Wealth Advisors, Inc. | 20.087 | 45,97 | 1.751 | 58,51 | ||||
| 2026-02-19 | 13F | CI Private Wealth, LLC | 59.035 | 70,46 | 3.403 | 16,27 | ||||
| 2026-01-26 | 13F | Whittier Trust Co | 3.707 | 0,00 | 334 | 3,74 | ||||
| 2026-02-03 | 13F | Gateway Investment Advisers Llc | 2.451 | 214 | ||||||
| 2026-01-30 | 13F | American Capital Advisory, LLC | 5 | 66,67 | 0 | |||||
| 2026-02-04 | 13F | Pensionmark Financial Group, Llc | 0 | -100,00 | 0 | |||||
| 2026-01-29 | 13F | Camelot Portfolios, LLC | 4.766 | -12,85 | 415 | -10,17 | ||||
| 2026-02-10 | 13F | Daiwa Securities Group Inc. | 28.629 | 1,62 | 2 | 0,00 | ||||
| 2026-01-20 | 13F | AdvisorNet Financial, Inc | 399 | 25,87 | 35 | 30,77 | ||||
| 2026-02-10 | 13F | Mutual Of America Capital Management Llc | 18.890 | -2,05 | 1.647 | 1,04 | ||||
| 2026-02-17 | 13F | MIRAE ASSET GLOBAL ETFS HOLDINGS Ltd. | 11.381 | -1,49 | 992 | 1,64 | ||||
| 2026-02-04 | 13F | Atlantic Union Bankshares Corp | 332 | 0,00 | 29 | 0,00 | ||||
| 2026-01-26 | 13F | Moran Wealth Management, LLC | 4.412 | -32,98 | 385 | -30,94 | ||||
| 2025-10-31 | 13F | Copia Wealth Management | 0 | -100,00 | 0 | -100,00 | ||||
| 2026-02-17 | 13F | RMB Capital Management, LLC | 9.013 | 786 | ||||||
| 2026-02-12 | 13F | Federation des caisses Desjardins du Quebec | 17.391 | 14,08 | 1.516 | 17,62 | ||||
| 2026-01-21 | 13F | Greenleaf Trust | 3.450 | -3,79 | 301 | -0,66 | ||||
| 2026-02-03 | 13F | Coston, McIsaac & Partners | 325 | 0,00 | 0 | |||||
| 2026-02-10 | 13F | Spinnaker Trust | 3.084 | 0,00 | 269 | 3,08 | ||||
| 2026-02-12 | 13F | Brinker Capital Investments, LLC | 7.841 | -38,38 | 684 | -36,47 | ||||
| 2025-10-22 | 13F | Motco | 0 | -100,00 | 0 | -100,00 | ||||
| 2026-02-10 | 13F | Arcadia Investment Management Corp/mi | 3 | 0 | ||||||
| 2026-02-03 | 13F | Channel Wealth Llc | 0 | -100,00 | 0 | -100,00 | ||||
| 2026-02-17 | 13F | Norinchukin Bank, The | 10.951 | 5,55 | 955 | 8,90 | ||||
| 2026-02-05 | 13F | Cardinal Point Capital Management, ULC | 5.484 | -26,72 | 478 | -21,77 | ||||
| 2026-01-30 | 13F | Laurel Wealth Advisors LLC | 100 | 9 | ||||||
| 2026-02-17 | 13F | Toronto Dominion Bank | 101.706 | 40,28 | 8.866 | 44,73 | ||||
| 2026-02-17 | 13F | Nomura Holdings Inc | 10.272 | 139,94 | 895 | 147,92 | ||||
| 2026-02-06 | 13F | Envestnet Portfolio Solutions, Inc. | 4.187 | -55,60 | 365 | -54,15 | ||||
| 2026-02-11 | 13F | SOUTH STATE Corp | 73 | 0,00 | 6 | 0,00 | ||||
| 2026-02-06 | 13F | Advisory Alpha, LLC | 3.759 | 328 | ||||||
| 2025-11-14 | 13F | WealthTrak Capital Management LLC | 0 | -100,00 | 0 | -100,00 | ||||
| 2026-01-26 | 13F | Baxter Bros Inc | 38.590 | -3,20 | 3.364 | -0,15 | ||||
| 2026-02-10 | 13F | Axq Capital, Lp | 5.207 | 102,45 | 454 | 108,76 | ||||
| 2026-02-11 | 13F | Illinois Municipal Retirement Fund | 50.798 | -11,37 | 4.428 | -8,55 | ||||
| 2026-02-13 | 13F | Entropy Technologies, LP | 31.883 | 125,77 | 2.779 | 132,94 | ||||
| 2026-02-05 | 13F | Northwestern Mutual Investment Management Company, Llc | 5.630 | -0,86 | 491 | 2,30 | ||||
| 2026-02-17 | 13F | Royal Bank Of Canada | 517.904 | 40,13 | 45.146 | 44,57 | ||||
| 2026-01-30 | 13F | Trifecta Capital Advisors, LLC | 0 | -100,00 | 0 | |||||
| 2026-02-11 | 13F | Fidelity National Financial, Inc. This fund is a listed as child fund of Fmr Llc and if that institution has disclosed ownership in this security, then these positions will not be double counted when calculating total shares and total value | 300.000 | 26.151 | ||||||
| 2026-02-17 | 13F | Susquehanna Fundamental Investments, Llc | 250.963 | 0,00 | 21.876 | 3,17 | ||||
| 2026-02-17 | 13F | Susquehanna Portfolio Strategies, LLC | 44.944 | 0,00 | 3.918 | 3,16 | ||||
| 2026-02-12 | 13F | Cloud Capital Management, LLC | 0 | -100,00 | 0 | |||||
| 2026-01-23 | 13F | Carnegie Capital Asset Management, LLC | 3.696 | 322 | ||||||
| 2026-02-17 | 13F | Woodline Partners LP | 69.450 | 6.054 | ||||||
| 2026-02-03 | 13F | SBI Securities Co., Ltd. | 412 | -12,71 | 36 | -10,26 | ||||
| 2026-02-13 | 13F | Brown Advisory Inc | 0 | -100,00 | 0 | -100,00 | ||||
| 2026-02-09 | 13F | Coldstream Capital Management Inc | 3.723 | -10,59 | 325 | -7,69 | ||||
| 2025-11-10 | 13F | Washington Trust Advisors, Inc. | 0 | -100,00 | 0 | |||||
| 2026-02-05 | 13F | Td Private Client Wealth Llc | 3.899 | 0,26 | 340 | 3,35 | ||||
| 2026-02-11 | 13F | Sharpepoint Llc | 2.624 | 229 | ||||||
| 2026-02-17 | 13F | Integrated Advisors Network LLC | 7.198 | 1,34 | 627 | 4,50 | ||||
| 2026-02-10 | 13F | Principia Wealth Advisory, LLC | 12 | -7,69 | 1 | 0,00 | ||||
| 2026-02-13 | 13F | National Bank Of Canada /fi/ | 239.380 | 111,46 | 20.864 | 118,14 | ||||
| 2026-02-17 | 13F | Wellington Management Group Llp | 4.224 | -29,59 | 368 | -27,27 | ||||
| 2026-01-26 | 13F | JNBA Financial Advisors | 26 | 2 | ||||||
| 2026-02-12 | 13F | Steward Partners Investment Advisory, Llc | 10.092 | -2,27 | 880 | 0,80 | ||||
| 2026-02-12 | 13F | Hm Payson & Co | 670 | 0,00 | 58 | 3,57 | ||||
| 2026-02-17 | 13F | Raymond James Financial Inc | 590.044 | 0,48 | 51.434 | 3,67 | ||||
| 2025-10-23 | 13F | Ferguson Wellman Capital Management, Inc | 0 | -100,00 | 0 | |||||
| 2026-02-12 | 13F | Ci Investments Inc. | 0 | -100,00 | 0 | |||||
| 2026-02-17 | 13F | Shay Capital LLC | 0 | -100,00 | 0 | -100,00 | ||||
| 2025-10-30 | 13F | Twin Peaks Wealth Advisors, LLC | 0 | -100,00 | 0 | -100,00 | ||||
| 2026-04-06 | 13F | CX Institutional | 3.032 | -1,01 | 0 | |||||
| 2026-01-21 | 13F | Capital Advisors, Ltd. LLC | 11.089 | 2.358,76 | 0 | |||||
| 2026-02-13 | 13F | Resources Investment Advisors, LLC. | 4.320 | -10,37 | 377 | -7,62 | ||||
| 2026-04-06 | 13F | GAMMA Investing LLC | 6.922 | 10,47 | 606 | 10,99 | ||||
| 2026-01-27 | 13F | Bayforest Capital Ltd | 2.631 | 29,41 | 229 | 33,92 | ||||
| 2026-02-02 | 13F | Oppenheimer & Co Inc | 23.364 | -4,73 | 2.037 | -1,74 | ||||
| 2026-02-02 | 13F | Benjamin Edwards Inc | 8.805 | 6,88 | 767 | 10,36 | ||||
| 2026-02-04 | 13F | Swiss Life Asset Management Ltd | 15.489 | 1,54 | 1.350 | 4,81 | ||||
| 2026-02-10 | 13F | Peapack Gladstone Financial Corp | 7.658 | 0,00 | 1 | |||||
| 2026-02-04 | 13F | Paradigm Asset Management Co Llc | 12.100 | -5,47 | 1.055 | -2,50 | ||||
| 2026-02-10 | 13F | Nomura Asset Management Co Ltd | 61.836 | 0,58 | 5.390 | 3,77 | ||||
| 2026-01-16 | 13F | Louisiana State Employees Retirement System | 9.000 | -4,26 | 785 | -1,26 | ||||
| 2026-02-17 | 13F | Sandler Capital Management | 0 | -100,00 | 0 | -100,00 | ||||
| 2026-02-17 | 13F | Aster Capital Management (DIFC) Ltd | 0 | -100,00 | 0 | -100,00 | ||||
| 2026-02-17 | 13F | Magnetar Financial LLC | 5.314 | 463 | ||||||
| 2026-02-11 | 13F | Picton Mahoney Asset Management | 13 | 0,00 | 1 | |||||
| 2026-01-23 | 13F | Private Wealth Management Group, LLC | 27 | -15,62 | 2 | 0,00 | ||||
| 2026-02-04 | 13F | Meridian Wealth Management, LLC | 2.366 | 206 | ||||||
| 2026-02-04 | 13F | Virginia Retirement Systems Et Al | 937.700 | 0,00 | 81.739 | 3,17 | ||||
| 2026-01-30 | 13F | Keybank National Association/oh | 9.659 | 2,77 | 842 | 5,92 | ||||
| 2026-02-03 | 13F | Bokf, Na | 36.145 | -11,90 | 3.151 | -9,12 | ||||
| 2026-02-13 | 13F | Morgan Stanley | 2.394.940 | 4,28 | 208.767 | 7,58 | ||||
| 2026-02-17 | 13F | Fmr Llc | 8.682.271 | 51,07 | 756.834 | 55,87 | ||||
| 2026-01-26 | 13F | BLB&B Advisors, LLC | 5.327 | -9,36 | 464 | -6,45 | ||||
| 2026-01-29 | 13F | State Of Michigan Retirement System | 56.371 | 1,26 | 4.914 | 4,47 | ||||
| 2026-02-13 | 13F | Peak6 Llc | Call | 116.300 | 10.138 | |||||
| 2026-02-13 | 13F | Cornerstone Financial Management LLC | 17 | 1 | ||||||
| 2026-02-06 | 13F | Cullen/frost Bankers, Inc. | 318 | 45,87 | 28 | 50,00 | ||||
| 2026-01-23 | 13F | FSM Wealth Advisors, LLC | 4.500 | 0,16 | 392 | 3,43 | ||||
| 2026-02-17 | 13F | Warren Averett Asset Management, LLC | 5.943 | 518 | ||||||
| 2026-02-12 | 13F | CIBC Private Wealth Group, LLC | 6.920 | 253,06 | 603 | 265,45 | ||||
| 2025-11-14 | 13F | Knightsbridge Asset Management, Llc | 69.323 | -4,81 | 5.857 | 0,17 | ||||
| 2026-02-13 | 13F | Ieq Capital, Llc | 366.045 | 84,35 | 31.908 | 90,20 | ||||
| 2026-02-06 | 13F | IFP Advisors, Inc | 2.576 | 57,94 | 225 | 63,50 | ||||
| 2026-01-16 | 13F | Tema Etfs Llc | 3.457 | -0,23 | 301 | 3,08 | ||||
| 2026-03-16 | 13F | Bank of New Hampshire | 413 | -12,68 | 36 | -7,69 | ||||
| 2026-02-11 | 13F | Metis Global Partners, LLC | 5.621 | -7,91 | 490 | -5,05 | ||||
| 2026-02-17 | 13F | Optiver Holding B.V. | 1.687 | 214,15 | 147 | 226,67 | ||||
| 2025-11-07 | 13F | Putney Financial Group LLC | 0 | -100,00 | 0 | |||||
| 2026-04-10 | 13F | Country Trust Bank | 151 | 0,00 | 13 | 0,00 | ||||
| 2026-02-09 | 13F | Quest Partners LLC | 37.364 | 154,84 | 3.257 | 163,09 | ||||
| 2026-02-06 | 13F | HighTower Advisors, LLC | 39.696 | 3,54 | 3.460 | 6,82 | ||||
| 2026-02-09 | 13F | Keating Financial Advisory Services, Inc. | 146 | 13 | ||||||
| 2026-01-20 | 13F | Toth Financial Advisory Corp | 4 | 0 | ||||||
| 2026-02-04 | 13F | Rinkey Investments | 4.315 | 376 | ||||||
| 2026-02-05 | 13F | Amalgamated Bank | 33.715 | -0,17 | 3 | 0,00 | ||||
| 2026-02-17 | 13F | Delaware Management Holdings, Inc. | 170.623 | 14.873 | ||||||
| 2026-01-23 | 13F | Bellevue Asset Management, Llc | 447 | 0,00 | 39 | 2,70 | ||||
| 2026-02-03 | 13F | Wesbanco Bank Inc | 4.948 | -87,47 | 431 | -87,08 | ||||
| 2026-02-06 | 13F | Creative Financial Designs Inc /adv | 88 | 0,00 | 8 | 0,00 | ||||
| 2026-01-15 | 13F | Retirement Systems of Alabama | 37.489 | -1,38 | 3.268 | 1,74 | ||||
| 2026-02-13 | 13F | State Street Corp | 9.464.324 | 2,65 | 825.193 | 5,90 | ||||
| 2026-04-07 | 13F | Signaturefd, Llc | 3.954 | 3,43 | 346 | 3,90 | ||||
| 2026-02-17 | 13F | TCG Advisory Services, LLC | 4.168 | -6,96 | 363 | -3,97 | ||||
| 2026-02-17 | 13F | DV Trading LLC | 200 | 17 | ||||||
| 2026-02-17 | 13F | Cambria Investment Management, L.P. | 99.330 | 0,46 | 8.659 | 3,65 | ||||
| 2026-02-10 | 13F | Acadian Asset Management Llc | 94.786 | -36,35 | 8 | -33,33 | ||||
| 2026-01-21 | 13F | Inlet Private Wealth, LLC | 34.415 | 869,44 | 3.000 | 903,01 | ||||
| 2026-01-20 | 13F | Savvy Advisors, Inc. | 6.782 | 91,80 | 591 | 98,32 | ||||
| 2026-02-13 | 13F | Golden State Wealth Management, LLC | 822 | 0,00 | 72 | 2,90 | ||||
| 2026-02-19 | 13F | Evansbrook LLC | 4.355 | 380 | ||||||
| 2026-02-24 | 13F | DGS Capital Management, LLC | 4.348 | 379 | ||||||
| 2026-02-10 | 13F | Catalyst Capital Advisors LLC | 0 | -100,00 | 0 | |||||
| 2026-01-14 | 13F | Cascade Investment Advisors, Inc. | 16.675 | 4,15 | 1.454 | 7,47 | ||||
| 2026-02-02 | 13F | Bay Harbor Wealth Management, LLC | 22 | 83,33 | 2 | 0,00 | ||||
| 2025-11-14 | 13F | Jain Global LLC | 0 | -100,00 | 0 | |||||
| 2026-01-14 | 13F | Kaufman Rossin Wealth, LLC | 2.409 | 210 | ||||||
| 2026-02-12 | 13F | BRYN MAWR TRUST Co | 0 | -100,00 | 0 | -100,00 | ||||
| 2026-02-17 | 13F | Ameriprise Financial Inc | 317.920 | 23,74 | 27.715 | 27,64 | ||||
| 2026-04-09 | 13F | Park Place Capital Corp | 22 | 0,00 | 2 | 0,00 | ||||
| 2026-02-18 | 13F | Mackenzie Financial Corp | 470.141 | -14,99 | 41.451 | -11,29 | ||||
| 2026-01-23 | 13F | Patton Fund Management, Inc. | 2.803 | -12,92 | 244 | -9,96 | ||||
| 2026-01-14 | 13F | Exchange Traded Concepts, Llc | 2.425 | -11,40 | 211 | -8,66 | ||||
| 2026-01-23 | 13F | Robeco Institutional Asset Management B.V. | 727.530 | 4,54 | 63.419 | 7,85 | ||||
| 2026-01-23 | 13F | Steigerwald, Gordon & Koch Inc. | 152 | 0,00 | 13 | 8,33 | ||||
| 2026-02-06 | 13F | Resona Asset Management Co.,Ltd. | 53.059 | -6,68 | 4.640 | -3,33 | ||||
| 2026-02-10 | 13F | State of Wyoming | 8.033 | 22,94 | 700 | 26,81 | ||||
| 2026-02-04 | 13F | Sentry Investment Management Llc | 491 | 0,00 | 0 | |||||
| 2026-01-26 | 13F | Parcion Private Wealth LLC | 5.218 | 455 | ||||||
| 2026-01-26 | 13F | Xcel Wealth Management, LLC | 5.642 | 492 | ||||||
| 2026-02-18 | 13F | GWM Advisors LLC | 11.356 | 120,03 | 990 | 126,83 | ||||
| 2026-02-11 | 13F | Tiaa Trust, National Association | 4.220 | 0,00 | 368 | 3,09 | ||||
| 2026-01-30 | 13F | Catalytic Wealth RIA, LLC | 0 | -100,00 | 0 | |||||
| 2026-02-12 | 13F | Skopos Labs, Inc. | 2.556 | 227 | ||||||
| 2026-02-12 | 13F | BlackRock, Inc. | 15.821.385 | 2,17 | 1.379.150 | 5,41 | ||||
| 2026-02-11 | 13F | Buckingham Strategic Partners | 19.844 | 68,50 | 1.730 | 77,52 | ||||
| 2025-11-17 | 13F | Kestra Private Wealth Services, Llc | 0 | -100,00 | 0 | -100,00 | ||||
| 2026-02-06 | 13F | Larson Financial Group LLC | 772 | 5,03 | 67 | 8,06 | ||||
| 2026-02-06 | 13F | EverSource Wealth Advisors, LLC | 6.495 | 53,66 | 566 | 58,54 | ||||
| 2026-02-12 | 13F | Brown Brothers Harriman & Co | 5.169 | 22,31 | 451 | 26,05 | ||||
| 2026-02-02 | 13F | CENTRAL TRUST Co | 316 | -38,52 | 28 | -37,21 | ||||
| 2026-02-12 | 13F/A | Pinebridge Investments Llc | 19.233 | 1.677 | ||||||
| 2026-01-26 | 13F | Cottage Street Advisors LLC | 7.681 | -0,25 | 670 | 2,29 | ||||
| 2025-11-06 | 13F | REAP Financial Group, LLC | 0 | -100,00 | 0 | -100,00 | ||||
| 2026-02-09 | 13F | Prospera Financial Services Inc | 5.582 | -34,41 | 487 | -32,41 | ||||
| 2026-02-13 | 13F/A | Ontario Teachers Pension Plan Board | 0 | -100,00 | 0 | |||||
| 2026-01-15 | 13F | Trust Co | 36 | 3 | ||||||
| 2026-02-11 | 13F | LPL Financial LLC | 194.473 | 117,24 | 16.952 | 124,14 | ||||
| 2026-02-10 | 13F | DT Investment Partners, LLC | 75 | 0,00 | 7 | 0,00 | ||||
| 2026-02-17 | 13F | Brevan Howard Capital Management LP | 7.733 | -8,04 | 674 | -5,07 | ||||
| 2026-04-07 | 13F | Farther Finance Advisors, LLC | 3.801 | 1,77 | 338 | 3,69 | ||||
| 2026-02-12 | 13F | Principal Securities, Inc. | 0 | -100,00 | 0 | |||||
| 2026-02-13 | 13F | Sei Investments Co | 138.634 | 5,19 | 12.084 | 8,52 | ||||
| 2026-01-27 | 13F | TD Waterhouse Canada Inc. | 3.150 | 0,00 | 275 | 1,86 | ||||
| 2026-02-17 | 13F | First Manhattan Co | 3.450 | 11,29 | 301 | 14,94 | ||||
| 2026-02-17 | 13F | Glenmede Trust Co Na | 13.874 | 10,02 | 1.209 | 32,71 | ||||
| 2026-02-13 | 13F | Martingale Asset Management L P | 187.214 | 3,64 | 16.319 | 6,93 | ||||
| 2026-01-28 | 13F | Teacher Retirement System Of Texas | 5.904 | -75,05 | 515 | -74,29 | ||||
| 2026-02-17 | 13F | Snowden Capital Advisors LLC | 5.357 | -5,32 | 467 | -2,30 | ||||
| 2026-02-04 | 13F | Hartford Investment Management Co | 10.137 | -2,45 | 884 | 0,57 | ||||
| 2026-02-12 | 13F | Federated Hermes, Inc. | 795 | -1,24 | 69 | 1,47 | ||||
| 2026-02-09 | 13F | CBIZ Investment Advisory Services, LLC | 128 | 0,00 | 11 | 10,00 | ||||
| 2026-01-23 | 13F | Blue Fin Capital, Inc. | 6.024 | 19,12 | 525 | 22,95 | ||||
| 2026-02-17 | 13F | PharVision Advisers, LLC | 0 | -100,00 | 0 | -100,00 | ||||
| 2026-02-10 | 13F | Quantbot Technologies LP | 92.500 | 22,06 | 8.063 | 25,95 | ||||
| 2026-02-13 | 13F | Chevy Chase Trust Holdings, Inc. | 89.345 | -1,79 | 7.788 | 1,33 | ||||
| 2026-02-17 | 13F | Maryland State Retirement & Pension System | 8.856 | 0,00 | 772 | 3,07 | ||||
| 2026-02-23 | 13F | Virtu Financial LLC | 5.455 | 0 | ||||||
| 2026-01-29 | 13F | Quadcap Wealth Management, LLC | 7.780 | 0,22 | 678 | 3,51 | ||||
| 2026-04-10 | 13F | Pure Financial Advisors, Inc. | 3.576 | 0,87 | 313 | 1,29 | ||||
| 2026-02-11 | 13F | Fox Run Management, L.l.c. | 9.160 | 798 | ||||||
| 2026-02-11 | 13F | Inceptionr Llc | 4.605 | -57,01 | 401 | -55,69 | ||||
| 2026-04-09 | 13F | Kwmg, Llc | 91.290 | 1,79 | 7.993 | 2,25 | ||||
| 2026-02-13 | 13F | Sterling Capital Management LLC | 10.414 | -5,17 | 908 | -2,16 | ||||
| 2026-02-13 | 13F | Wells Fargo & Company/mn | 329.782 | 35,68 | 28.747 | 39,99 | ||||
| 2026-02-13 | 13F | Quattro Advisors LLC | 8 | 1 | ||||||
| 2026-02-09 | 13F | Koesten, Hirschmann & Crabtree, INC. | 0 | -100,00 | 0 | |||||
| 2026-01-12 | 13F | AllSquare Wealth Management LLC | 250 | 0,00 | 21 | 5,00 | ||||
| 2026-02-17 | 13F | Nissay Asset Management Corp /japan/ /adv | 22.882 | 0,00 | 1.995 | 3,16 | ||||
| 2026-02-11 | 13F | Rise Advisors, LLC | 0 | -100,00 | 0 | -100,00 | ||||
| 2026-02-12 | 13F | UniSuper Management Pty Ltd | 26.423 | -11,78 | 2.303 | -8,97 | ||||
| 2026-01-27 | 13F | First Horizon Corp | 1.313 | 0,00 | 114 | 3,64 | ||||
| 2026-02-17 | 13F | Polymer Capital Management (US) LLC | 4.079 | -5,97 | 356 | -3,01 | ||||
| 2026-02-17 | 13F | Cetera Investment Advisers | 44.222 | 21,87 | 3.855 | 25,74 | ||||
| 2026-02-12 | 13F | New York State Common Retirement Fund | 709.669 | -0,19 | 61.862 | 2,97 | ||||
| 2026-02-03 | 13F | Sequoia Financial Advisors, LLC | 70.715 | 9,26 | 6.164 | 12,73 | ||||
| 2026-02-17 | 13F | Banco Bilbao Vizcaya Argentaria, S.a. | 9.351 | -7,08 | 817 | -3,54 | ||||
| 2026-02-06 | 13F | Leonteq Securities AG | 64 | -91,01 | 6 | -91,67 | ||||
| 2026-02-10 | 13F | 3Chopt Investment Partners, LLC | 4.709 | 0,28 | 411 | 3,54 | ||||
| 2026-02-17 | 13F | Wiley Bros.-aintree Capital, Llc | 8.683 | 11,35 | 757 | 14,89 | ||||
| 2025-11-21 | 13F/A | CIBC Bancorp USA Inc. | 24.670 | 2.084 | ||||||
| 2026-02-04 | 13F | Clark Wealth Partners | 40 | 0,00 | 3 | 0,00 | ||||
| 2025-11-06 | 13F | Versor Investments LP | 0 | -100,00 | 0 | -100,00 | ||||
| 2026-02-17 | 13F | Clear Street Markets Llc | 262 | -14,66 | 23 | -12,00 | ||||
| 2026-02-24 | 13F | Bell Investment Advisors, Inc | 17 | 0,00 | 1 | 0,00 | ||||
| 2026-02-09 | 13F | Morningstar Investment Management LLC | 4.878 | 0,00 | 0 | |||||
| 2026-02-13 | 13F | Prudential Financial Inc | 140.129 | -18,68 | 12.215 | -16,09 | ||||
| 2026-02-10 | 13F | AdvisorShares Investments LLC | 5.700 | 497 | ||||||
| 2026-02-13 | 13F | BNP Paribas Asset Management Holding S.A. | 262.230 | 15.407,39 | 23 | |||||
| 2026-02-10 | 13F | Horizon Bancorp Inc /in/ | 330 | 0,00 | 0 | |||||
| 2026-01-23 | 13F | Ritholtz Wealth Management | 4.664 | 407 | ||||||
| 2026-02-05 | 13F | Applied Finance Capital Management, LLC | 0 | -100,00 | 0 | |||||
| 2026-02-26 | 13F | TD Capital Management LLC | 8 | 0,00 | 1 | |||||
| 2026-02-05 | 13F | Requisite Capital Management, LLC | 0 | -100,00 | 0 | -100,00 | ||||
| 2026-02-17 | 13F | Gotham Asset Management, LLC | 262.625 | 73,98 | 22.893 | 79,50 | ||||
| 2026-01-14 | 13F | Pallas Capital Advisors LLC | 18.655 | 35,74 | 1.626 | 40,05 | ||||
| 2026-01-30 | 13F | State of New Jersey Common Pension Fund D | 54.342 | -3,97 | 4.737 | -0,94 | ||||
| 2025-10-24 | 13F | Seamount Financial Group Inc | 0 | -100,00 | 0 | -100,00 | ||||
| 2026-02-10 | 13F | Savant Capital, LLC | 12.596 | 5,07 | 1.098 | 8,40 | ||||
| 2026-01-27 | 13F | Forum Financial Management, LP | 4.989 | 0,08 | 435 | 3,09 | ||||
| 2026-02-11 | 13F | O'shaughnessy Asset Management, Llc | 18.065 | 37,93 | 1.575 | 42,31 | ||||
| 2026-02-17 | 13F | Algert Global Llc | 19.180 | 0,00 | 2 | 0,00 | ||||
| 2026-02-17 | 13F | Weiss Asset Management LP | 0 | -100,00 | 0 | -100,00 | ||||
| 2025-11-21 | 13F | Nebula Research & Development LLC | 0 | -100,00 | 0 | |||||
| 2026-02-05 | 13F | Cambridge Investment Research Advisors, Inc. | 31.896 | -17,00 | 3 | -33,33 | ||||
| 2025-11-10 | 13F | Dakota Wealth Management | 0 | -100,00 | 0 | -100,00 | ||||
| 2026-04-07 | 13F | U.S. Capital Wealth Advisors, LLC | 5.519 | 34,51 | 483 | 35,29 | ||||
| 2026-04-06 | 13F | WASHINGTON TRUST Co | 5.369 | -0,41 | 470 | 0,21 | ||||
| 2026-02-17 | 13F | NorthRock Partners, LLC | 0 | -100,00 | 0 | -100,00 | ||||
| 2026-02-09 | 13F | Employees Retirement System of Texas | 0 | -100,00 | 0 | |||||
| 2025-11-14 | 13F | Freestone Grove Partners LP | 0 | -100,00 | 0 | |||||
| 2026-01-22 | 13F | Harwood Advisory Group, LLC | 6 | 1 | ||||||
| 2025-11-14 | 13F | Mount Yale Investment Advisors, LLC | 0 | -100,00 | 0 | -100,00 | ||||
| 2026-02-17 | 13F | Credit Agricole S A | 71.461 | 17,46 | 6.229 | 21,19 | ||||
| 2026-01-16 | 13F | Standard Life Aberdeen plc | 142.221 | -0,12 | 12.397 | 3,61 | ||||
| 2026-01-20 | 13F | Stratos Wealth Partners, LTD. | 12.335 | 1.075 | ||||||
| 2026-02-17 | 13F | Coastal Bridge Advisors, LLC | 2.315 | 202 | ||||||
| 2026-02-17 | 13F/A | Sentinus, LLC | 4.011 | 350 | ||||||
| 2026-02-05 | 13F | New York Life Investment Management Llc | 24.154 | -0,15 | 2.106 | 3,03 | ||||
| 2026-02-03 | 13F | Virtus Family Office LLC | 5.316 | -23,31 | 463 | -20,85 | ||||
| 2026-01-16 | 13F | Ronald Blue Trust, Inc. | 758 | -22,81 | 66 | -19,51 | ||||
| 2026-02-23 | 13F | Beaird Harris Wealth Management, LLC | 2 | 0,00 | 0 | |||||
| 2026-02-09 | 13F | Allstate Corp | 10.626 | 94,40 | 926 | 100,87 | ||||
| 2026-02-10 | 13F | Easterly Investment Partners Llc | 30.390 | -42,55 | 2.649 | -40,72 | ||||
| 2026-02-13 | 13F | Storgate, LLC | 10.519 | 917 | ||||||
| 2026-02-23 | 13F | Mv Capital Management, Inc. | 57 | 1,79 | 5 | 0,00 | ||||
| 2026-01-23 | 13F | Brown, Lisle/cummings, Inc. | 1.505 | 0,00 | 131 | 3,15 | ||||
| 2026-02-10 | 13F | Rothschild Investment Llc | 3.235 | 157,15 | 282 | 165,09 | ||||
| 2026-02-11 | 13F | Dorsey & Whitney Trust CO LLC | 3.759 | 0,05 | 328 | 3,15 | ||||
| 2026-02-09 | 13F | Key FInancial Inc | 25 | 0,00 | 2 | 0,00 | ||||
| 2025-10-16 | 13F | Ellsworth Advisors, LLC | 0 | -100,00 | 0 | |||||
| 2026-02-17 | 13F | Quadrature Capital Ltd | 10.495 | 3,10 | 915 | 6,40 | ||||
| 2026-02-17 | 13F | Utah Retirement Systems | 29.336 | 0,00 | 2.557 | 3,19 | ||||
| 2026-01-23 | 13F | Charter Oak Capital Management, LLC | 4.263 | 0,00 | 372 | 3,06 | ||||
| 2026-02-17 | 13F | Tower Research Capital LLC (TRC) | 4.082 | -28,90 | 356 | -26,80 | ||||
| 2026-02-13 | 13F | Royal London Asset Management Ltd | 74.833 | -0,70 | 6.523 | 2,45 | ||||
| 2026-01-14 | 13F | Sky Investment Group LLC | 3.100 | 0,00 | 270 | 3,45 | ||||
| 2026-02-12 | 13F | Cibc World Markets Corp | 39.074 | 71,66 | 3.406 | 86,43 | ||||
| 2026-02-17 | 13F | Bank Of America Corp /de/ | 782.273 | 12,40 | 68.191 | 15,97 | ||||
| 2026-01-29 | 13F | St Germain D J Co Inc | 850 | 0,00 | 74 | 4,23 | ||||
| 2026-02-04 | 13F | Independent Advisor Alliance | 4.307 | -0,76 | 375 | 2,46 | ||||
| 2026-04-07 | 13F | Central Pacific Bank - Trust Division | 24.950 | 0,00 | 2.185 | 0,46 | ||||
| 2026-02-10 | 13F | Argent Trust Co | 0 | -100,00 | 0 | -100,00 | ||||
| 2025-11-13 | 13F | GeoWealth Management, LLC | 0 | -100,00 | 0 | |||||
| 2026-02-13 | 13F | Public Employees Retirement Association Of Colorado | 15.712 | 0,00 | 1 | 0,00 | ||||
| 2026-02-09 | 13F | Geode Capital Management, Llc | 4.562.063 | -0,50 | 396.133 | 2,67 | ||||
| 2026-02-10 | 13F | Crescent Grove Advisors, LLC | 15.792 | 15,90 | 1.377 | 19,55 | ||||
| 2026-01-20 | 13F | Thurston, Springer, Miller, Herd & Titak, Inc. | 5 | 0 | ||||||
| 2026-02-11 | 13F | Franklin Resources Inc | 88.698 | 75,13 | 7.732 | 80,67 | ||||
| 2025-11-14 | 13F | AXA Investment Managers S.A. | 280.677 | 23.714 | ||||||
| 2026-02-06 | 13F | Harvest Portfolios Group Inc. | 28.360 | 8,50 | 2.472 | 11,96 | ||||
| 2025-11-14 | 13F | Beacon Pointe Advisors, LLC | 0 | -100,00 | 0 | |||||
| 2026-01-28 | 13F | Universal- Beteiligungs- und Servicegesellschaft mbH | 37.779 | 14,18 | 3.313 | 18,53 | ||||
| 2026-01-28 | 13F | Atwood & Palmer Inc | 120 | 0,00 | 10 | 0,00 | ||||
| 2025-11-12 | 13F | Accredited Wealth Management, LLC | 452 | 804,00 | 4 | 0,00 | ||||
| 2026-02-12 | 13F | Distillate Capital Partners LLC | 190.953 | -1,14 | 16.646 | 1,94 | ||||
| 2026-02-17 | 13F | Spears Abacus Advisors LLC | 43.637 | 3.804 | ||||||
| 2026-02-03 | 13F | Strengthening Families & Communities, LLC | 0 | -100,00 | 0 | -100,00 | ||||
| 2026-02-05 | 13F | AlphaCore Capital LLC | 2.318 | 202 | ||||||
| 2026-02-10 | 13F | Bank of New York Mellon Corp | 1.131.905 | -7,71 | 98.668 | -4,78 | ||||
| 2026-02-11 | 13F | Deseret Mutual Benefit Administrators | 391 | 0,00 | 34 | 3,03 | ||||
| 2026-02-17 | 13F | Css Llc/il | 14.013 | -10,82 | 1.222 | -7,99 | ||||
| 2026-02-03 | 13F | McIlrath & Eck, LLC | 357 | 0,00 | 31 | 3,33 | ||||
| 2026-02-06 | 13F | Radnor Capital Management, LLC | 13.050 | 1.138 | ||||||
| 2026-01-29 | 13F | D.a. Davidson & Co. | 7.314 | -2,38 | 638 | 0,79 | ||||
| 2026-02-05 | 13F | Dana Investment Advisors, Inc. | 48.556 | -0,17 | 4.233 | 2,99 | ||||
| 2026-02-12 | 13F | Voya Investment Management Llc | 164.077 | 30,43 | 14.303 | 34,57 | ||||
| 2026-02-17 | 13F | Trexquant Investment LP | 166.086 | 7,53 | 14.478 | 10,94 | ||||
| 2026-02-17 | 13F | Mercer Global Advisors Inc /adv | 69.787 | 76,36 | 6.083 | 81,96 | ||||
| 2026-02-13 | 13F | QTR Family Wealth, LLC | 3.389 | 325 | ||||||
| 2026-02-02 | 13F | Danske Bank A/s | 132.617 | 4,18 | 11.560 | 7,48 | ||||
| 2026-01-30 | 13F | Citizens Financial Group Inc/ri | 13.498 | 5,84 | 1.177 | 9,19 | ||||
| 2026-02-11 | 13F | Zions Bancorporation, National Association /ut/ | 244 | -2,79 | 21 | 0,00 | ||||
| 2026-01-23 | 13F | Sumitomo Mitsui Trust Holdings, Inc. | 455.353 | -5,58 | 39.693 | -2,59 | ||||
| 2026-02-13 | 13F | Bridgewater Associates, LP | 144.079 | 267,73 | 12.559 | 279,43 | ||||
| 2026-02-17 | 13F | Guggenheim Capital Llc | 40.971 | -16,63 | 3.571 | -13,99 | ||||
| 2026-02-05 | 13F | Pinnacle Associates Ltd | 31.389 | 8,99 | 2.736 | 12,45 | ||||
| 2025-11-13 | 13F | Css Llc/il | Call | 0 | -100,00 | 0 | -100,00 | |||
| 2025-11-14 | 13F | Axa S.a. | 0 | -100,00 | 0 | |||||
| 2026-02-13 | 13F | Verition Fund Management LLC | 131.619 | 164,26 | 11.473 | 172,65 | ||||
| 2026-01-28 | 13F | Barrett & Company, Inc. | 12.031 | 0,00 | 1.049 | 3,15 | ||||
| 2026-02-04 | 13F | LRI Investments, LLC | 157 | 0,00 | 14 | 0,00 | ||||
| 2026-02-13 | 13F | JustInvest LLC | 24.519 | -1,19 | 2.137 | 1,96 | ||||
| 2026-02-13 | 13F | Palisade Asset Management, LLC | 0 | -100,00 | 0 | |||||
| 2026-03-03 | 13F/A | Caitong International Asset Management Co., Ltd | 1.811 | 6.367,86 | 158 | 7.750,00 | ||||
| 2026-02-06 | 13F | Tortoise Investment Management, LLC | 0 | -100,00 | 0 | -100,00 | ||||
| 2026-02-03 | 13F | Ethic Inc. | 5.453 | 23,68 | 475 | 27,69 | ||||
| 2026-02-11 | 13F | Everett Harris & Co /ca/ | 3.100 | 0,00 | 270 | 3,45 | ||||
| 2026-02-04 | 13F | Blackhawk Capital Partners LLC. | 4.179 | 364 | ||||||
| 2025-11-12 | 13F | Pitcairn Co | 0 | -100,00 | 0 | |||||
| 2025-10-24 | 13F | Hemington Wealth Management | 581 | 2,11 | 0 | |||||
| 2026-01-30 | 13F | Secured Retirement Advisors, Llc | 8.853 | -5,97 | 772 | -3,02 | ||||
| 2026-02-12 | 13F | Ensign Peak Advisors, Inc | 124.243 | -28,62 | 10.830 | -26,35 | ||||
| 2026-02-13 | 13F | Kestra Advisory Services, LLC | 12.437 | 17,56 | 1.084 | 21,39 | ||||
| 2026-02-17 | 13F | Evolve Private Wealth, Llc | 12.650 | 1.103 | ||||||
| 2026-02-11 | 13F | Parallel Advisors, LLC | 1.700 | 16,28 | 148 | 20,33 | ||||
| 2026-02-17 | 13F | Captrust Financial Advisors | 192.370 | 16,02 | 16.769 | 19,69 | ||||
| 2026-02-11 | 13F | Twin Tree Management, LP | 0 | -100,00 | 0 | -100,00 | ||||
| 2026-02-09 | 13F | MQS Management LLC | 0 | -100,00 | 0 | -100,00 | ||||
| 2026-02-10 | 13F | Bnp Paribas Arbitrage, Sa | 345.887 | -6,91 | 30.151 | -3,96 | ||||
| 2026-02-24 | 13F | Chelsea Counsel Co | 0 | -100,00 | 0 | -100,00 | ||||
| 2026-02-10 | 13F | Murphy & Mullick Capital Management Corp | 150 | 0,00 | 13 | 18,18 | ||||
| 2026-02-05 | 13F | Thrivent Financial For Lutherans | 75.649 | -3,67 | 7 | 0,00 | ||||
| 2026-02-09 | 13F | Atlantic Trust, LLC | 189 | -15,25 | 16 | -11,11 | ||||
| 2026-02-13 | 13F | Great West Life Assurance Co /can/ | 55.697 | -29,93 | 5 | -33,33 | ||||
| 2026-02-18 | 13F | State of Tennessee, Treasury Department | 53.054 | -1,12 | 4.672 | 3,04 | ||||
| 2026-01-29 | 13F | Teachers Retirement System Of The State Of Kentucky | 310.869 | 50,27 | 27 | 58,82 | ||||
| 2026-02-12 | 13F | State Board Of Administration Of Florida Retirement System | 178.812 | -5,94 | 15.587 | -2,96 | ||||
| 2026-02-13 | 13F | Citigroup Inc | 330.697 | 33,40 | 28.827 | 37,63 | ||||
| 2026-02-13 | 13F | Schroder Investment Management Group | 14.028 | -6,93 | 1.239 | -2,13 | ||||
| 2026-02-11 | 13F | J.w. Cole Advisors, Inc. | 0 | -100,00 | 0 | |||||
| 2026-02-10 | 13F | Moors & Cabot, Inc. | 5.935 | 16,08 | 517 | 19,95 | ||||
| 2025-10-15 | 13F | Stephens Consulting, LLC | 0 | -100,00 | 0 | |||||
| 2026-02-13 | 13F | Charles Schwab Investment Management Inc | 1.701.030 | 0,61 | 148.279 | 3,81 | ||||
| 2026-02-17 | 13F | Two Sigma Investments, Lp | 431.986 | 649,85 | 37.656 | 673,70 | ||||
| 2026-02-17 | 13F | Boothbay Fund Management, Llc | 7.596 | 662 | ||||||
| 2026-01-15 | 13F | Foster & Motley Inc | 5.381 | 0 | ||||||
| 2026-01-16 | 13F | Trust Co Of Vermont | 549 | 0,00 | 48 | 2,17 | ||||
| 2026-02-17 | 13F | Two Sigma Investments, Lp | Call | 3.800 | 331 | |||||
| 2026-02-13 | 13F | Transamerica Financial Advisors, Inc. | 913 | 166,96 | 80 | 182,14 | ||||
| 2026-02-11 | 13F | Motley Fool Asset Management LLC | 3.008 | 3,65 | 262 | 6,94 | ||||
| 2025-11-13 | 13F | Aware Super Pty Ltd as trustee of Aware Super | 9.112 | -79,27 | 770 | -78,21 | ||||
| 2026-01-29 | 13F | RMG Wealth Management LLC | 5 | 0 | ||||||
| 2026-02-13 | 13F | Colony Group, LLC | 114.907 | 734,11 | 10.017 | 760,48 | ||||
| 2026-02-27 | 13F | Groupama Asset Managment | 11.278 | -9,40 | 983 | -6,47 | ||||
| 2026-02-10 | 13F | Bruce G. Allen Investments, LLC | 181 | 0,00 | 16 | 0,00 | ||||
| 2026-02-06 | 13F | Intrust Bank Na | 3.523 | -1,32 | 307 | 1,99 | ||||
| 2026-01-21 | 13F | Delphi Management Inc /ma/ | 17.891 | -2,12 | 2 | 0,00 | ||||
| 2026-01-30 | 13F | Valued Wealth Advisors LLC | 8 | 0,00 | 1 | |||||
| 2026-02-10 | 13F | Commonwealth Of Pennsylvania Public School Empls Retrmt Sys | 40.991 | -4,21 | 3.573 | -1,16 | ||||
| 2026-02-13 | 13F | Cornercap Investment Counsel Inc | 16.591 | -1,36 | 1.446 | 1,76 | ||||
| 2026-02-10 | 13F | Td Asset Management Inc | 543.237 | -14,05 | 47.354 | -11,32 | ||||
| 2026-01-21 | 13F | SJS Investment Consulting Inc. | 549 | 294,96 | 48 | 327,27 | ||||
| 2026-01-27 | 13F | GHP Investment Advisors, Inc. | 200 | 0,00 | 17 | 6,25 | ||||
| 2026-02-20 | 13F | Kovitz Investment Group Partners, LLC | 0 | -100,00 | 0 | |||||
| 2026-02-17 | 13F | Equitable Holdings, Inc. | 3.486 | 10,53 | 304 | 13,91 | ||||
| 2026-02-17 | 13F | Jones Financial Companies Lllp | 25.530 | 441,81 | 2.225 | 466,16 | ||||
| 2026-02-02 | 13F | Capital Management Corp /va | 12.477 | 0,97 | 1.088 | 4,12 | ||||
| 2026-02-17 | 13F | Rakuten Investment Management, Inc. | 23.266 | -60,83 | 2.065 | -25,03 | ||||
| 2025-11-05 | 13F | Wells Trecaso Financial Group, LLC | 0 | -100,00 | 0 | |||||
| 2026-02-13 | 13F | Smartleaf Asset Management LLC | 1.294 | 14,61 | 114 | 21,28 | ||||
| 2026-04-09 | 13F | Veracity Capital LLC | 5.189 | -52,55 | 454 | -52,36 | ||||
| 2026-01-30 | 13F | United Community Bank | 39 | 0,00 | 3 | 0,00 | ||||
| 2026-02-13 | 13F | Parkside Financial Bank & Trust | 653 | 22,28 | 57 | 24,44 | ||||
| 2026-02-10 | 13F | Essex Financial Services, Inc. | 2.585 | 225 | ||||||
| 2026-02-13 | 13F | Marshall Wace, Llp | 137.233 | 11.963 | ||||||
| 2025-11-14 | 13F | Bridgefront Capital, LLC | 0 | -100,00 | 0 | -100,00 | ||||
| 2026-02-13 | 13F | Y-Intercept (Hong Kong) Ltd | 60.577 | 1.030,38 | 5.280 | 1.068,14 | ||||
| 2026-01-14 | 13F | ORG Wealth Partners, LLC | 2.091 | 0,00 | 182 | 3,41 | ||||
| 2026-01-28 | 13F | U S Global Investors Inc | 183.921 | -3,22 | 16.032 | -0,15 | ||||
| 2026-03-16 | 13F/A | Rockefeller Capital Management L.P. | 42.774 | 2,68 | 3.729 | 5,94 | ||||
| 2026-02-13 | 13F | Mariner, LLC | 172.974 | 111,91 | 15.097 | 118,92 | ||||
| 2026-02-11 | 13F | Syon Capital Llc | 6.550 | 8,14 | 571 | 11,55 | ||||
| 2026-02-02 | 13F | Sachetta, LLC | 154 | 0,00 | 13 | 0,00 | ||||
| 2026-02-17 | 13F | Redwood Park Advisors LLC | 2 | 0,00 | 0 | |||||
| 2026-02-11 | 13F | Simplex Trading, Llc | Put | 300 | -95,16 | 26 | ||||
| 2025-11-14 | 13F | Lazard Asset Management Llc | 0 | -100,00 | 0 | |||||
| 2026-02-13 | 13F | Integrated Wealth Concepts LLC | 12.409 | 7,86 | 1.082 | 11,21 | ||||
| 2026-02-17 | 13F | Advisory Services Network, LLC | 0 | -100,00 | 0 | -100,00 | ||||
| 2026-01-07 | 13F | Harbor Investment Advisory, Llc | 31 | 3 | ||||||
| 2026-02-03 | 13F | Stiles Financial Services Inc | 2.598 | 0,04 | 226 | 3,20 | ||||
| 2026-02-17 | 13F | Jump Financial, LLC | 22.792 | -80,83 | 1.987 | -80,23 | ||||
| 2026-02-13 | 13F | Journey Strategic Wealth Llc | 2.414 | 210 | ||||||
| 2026-01-27 | 13F | Asset Management One Co., Ltd. | 72.949 | 0,23 | 6.473 | 5,27 | ||||
| 2026-02-06 | 13F | Gsa Capital Partners Llp | 4.368 | 0 | ||||||
| 2026-02-09 | 13F | Mizuho Securities Usa Llc | 12.831 | -1,14 | 1.067 | 2,60 | ||||
| 2026-01-28 | 13F | Chicago Partners Investment Group LLC | 8.396 | 99,81 | 798 | 137,91 | ||||
| 2026-01-23 | 13F | Westside Investment Management, Inc. | 115 | 15,00 | 10 | 25,00 | ||||
| 2026-02-17 | 13F | CastleKnight Management LP | 6.600 | 0,00 | 575 | 3,23 | ||||
| 2026-02-17 | 13F | Qube Research & Technologies Ltd | 0 | -100,00 | 0 | |||||
| 2026-02-12 | 13F | Wedbush Securities Inc | 2.342 | 0 | ||||||
| 2026-02-12 | 13F | Bradley Foster & Sargent Inc/ct | 2.890 | 8,40 | 252 | 11,56 | ||||
| 2026-01-29 | 13F | IMC-Chicago, LLC | Put | 13.300 | -45,04 | 1.159 | -43,30 | |||
| 2026-02-17 | 13F | Citadel Advisors Llc | 50.716 | -66,58 | 4.421 | -65,53 | ||||
| 2026-01-29 | 13F | IMC-Chicago, LLC | Call | 73.000 | -16,19 | 6.363 | -13,53 | |||
| 2026-02-17 | 13F | Citadel Advisors Llc | Call | 62.700 | -47,40 | 5.466 | -45,74 | |||
| 2026-02-17 | 13F | Citadel Advisors Llc | Put | 7.300 | -75,67 | 636 | -74,90 | |||
| 2026-01-09 | 13F | SG Americas Securities, LLC | 429.492 | 8.087,04 | 37 | |||||
| 2026-02-05 | 13F | Elyxium Wealth, LLC | 347 | 30 | ||||||
| 2026-01-12 | 13F | Rialto Wealth Management, LLC | 22 | 0,00 | 2 | 0,00 | ||||
| 2026-02-17 | 13F | Capital Fund Management S.a. | 13.107 | -86,25 | 1.143 | -85,82 | ||||
| 2026-02-12 | 13F | Hollencrest Capital Management | 1.000 | 0,00 | 87 | 3,57 | ||||
| 2026-01-12 | 13F | Fiduciary Financial Group, Llc | 0 | -100,00 | 0 | |||||
| 2026-01-22 | 13F | Massachusetts Financial Services Co /ma/ | 283.922 | 1,73 | 24.749 | 4,96 | ||||
| 2026-02-06 | 13F | Global Retirement Partners, LLC | 2.225 | 680,70 | 194 | 704,17 | ||||
| 2026-02-13 | 13F | Neuberger Berman Group LLC | 732.581 | -2,52 | 63.859 | 0,57 | ||||
| 2026-02-10 | 13F | Amica Mutual Insurance Co | 18.817 | 0,00 | 2 | 0,00 | ||||
| 2026-02-13 | 13F | Ubs Asset Management Americas Inc | 723.368 | 1,12 | 63.056 | 4,33 | ||||
| 2026-02-11 | 13F | GW&K Investment Management, LLC | 284 | 0 | ||||||
| 2026-02-17 | 13F | Dark Forest Capital Management Lp | 0 | -100,00 | 0 | -100,00 | ||||
| 2026-01-21 | 13F | Signature Resources Capital Management, LLC | 5 | 0 | ||||||
| 2026-02-03 | 13F | Manning & Napier Advisors Llc | 1.214 | 107 | ||||||
| 2026-04-03 | 13F | Coastline Trust Co | 100 | 0,00 | 9 | 0,00 | ||||
| 2026-02-17 | 13F | Man Group plc | 323.049 | -11,15 | 28.160 | -8,33 | ||||
| 2026-02-03 | 13F | Crestwood Advisors Group LLC | 3.001 | 262 | ||||||
| 2026-02-05 | 13F | Allworth Financial LP | 5.784 | 56,54 | 504 | 61,54 | ||||
| 2026-02-11 | 13F | Simplex Trading, Llc | Call | 6.300 | -89,30 | 549 | 13.625,00 | |||
| 2026-02-11 | 13F | Brandes Investment Partners, Lp | 2.735.047 | -4,62 | 238.415 | -1,60 | ||||
| 2026-01-15 | 13F | Uncommon Cents Investing LLC | 7.701 | 0,00 | 671 | 3,23 | ||||
| 2026-02-13 | 13F | Kilter Group LLC | 35 | 0,00 | 3 | 50,00 | ||||
| 2026-02-10 | 13F | Meramec Financial Planners, LLC | 8 | 1 | ||||||
| 2026-02-12 | 13F | Xponance, Inc. | 24.140 | 5,24 | 2.104 | 8,62 | ||||
| 2026-02-11 | 13F | Los Angeles Capital Management Llc | 53.184 | -4,46 | 4.224 | -10,21 | ||||
| 2026-02-12 | 13F | Great Lakes Advisors, Llc | 795.539 | -6,27 | 69.347 | -3,30 | ||||
| 2026-01-27 | 13F | Brighton Jones Llc | 0 | -100,00 | 0 | |||||
| 2026-02-09 | 13F | New Age Alpha Advisors, LLC | 26.675 | 36,47 | 2.325 | 40,82 | ||||
| 2026-02-12 | 13F | Penserra Capital Management LLC | 7.395 | 1 | ||||||
| 2026-03-04 | 13F | SHP Wealth Management | 4 | 0 | ||||||
| 2026-02-05 | 13F | North Dakota State Investment Board | 6.112 | 533 | ||||||
| 2026-02-13 | 13F | Toroso Investments, LLC | 10.145 | 199,09 | 884 | 209,09 | ||||
| 2026-01-29 | 13F | UMA Financial Services, Inc. | 12 | -7,69 | 1 | 0,00 | ||||
| 2026-02-04 | 13F | Securian Asset Management, Inc | 4.791 | -43,99 | 418 | -42,24 | ||||
| 2026-02-11 | 13F | OneAscent Financial Services LLC | 0 | -100,00 | 0 | -100,00 | ||||
| 2026-01-13 | 13F | Mather Group, Llc. | 0 | -100,00 | 0 | |||||
| 2026-01-14 | 13F | Wolff Wiese Magana Llc | 5 | 0,00 | 0 | |||||
| 2026-02-23 | 13F | Kera Capital Partners, Inc. | 3.201 | 282 | ||||||
| 2026-01-21 | 13F | Hartford Financial Management Inc. | 401 | 0,00 | 35 | 3,03 | ||||
| 2026-02-13 | 13F | Public Sector Pension Investment Board | 22.661 | 49,82 | 1.975 | 54,66 | ||||
| 2026-02-17 | 13F | Creative Planning | 108.161 | 81,67 | 9.428 | 87,44 | ||||
| 2026-01-20 | 13F | American National Bank | 0 | -100,00 | 0 | |||||
| 2026-02-09 | 13F | Bleakley Financial Group, LLC | 14.207 | 23,32 | 1.238 | 27,24 | ||||
| 2026-02-17 | 13F | Canada Pension Plan Investment Board | 162.211 | -0,18 | 14.140 | 2,98 | ||||
| 2026-02-10 | 13F | National Pension Service | 98.656 | 17,51 | 8.600 | 21,23 | ||||
| 2026-01-26 | 13F | Mirae Asset Global Investments Co., Ltd. | 29.036 | 16,96 | 2.531 | 20,70 | ||||
| 2026-01-22 | 13F | Bfsg, Llc | 83.230 | 7.255 | ||||||
| 2026-02-17 | 13F | Laird Norton Trust Company, Llc | 7.507 | 655 | ||||||
| 2026-01-23 | 13F | State of Alaska, Department of Revenue | 17.540 | -9,96 | 2 | 0,00 | ||||
| 2026-01-22 | 13F | Apollon Wealth Management, LLC | 0 | -100,00 | 0 | |||||
| 2025-11-14 | 13F | Wolverine Trading, Llc | 4.820 | 7,52 | 405 | 12,50 | ||||
| 2026-01-28 | 13F | waypoint wealth counsel | 4.568 | 47,26 | 398 | 51,91 | ||||
| 2025-11-14 | 13F | Wolverine Trading, Llc | Call | 29.400 | 114,60 | 2.470 | 124,55 | |||
| 2025-11-14 | 13F | Wolverine Trading, Llc | Put | 13.300 | 280,00 | 1.118 | 297,51 | |||
| 2026-01-12 | 13F | CVA Family Office, LLC | 310 | 0,00 | 27 | 3,85 | ||||
| 2026-02-17 | 13F | Redwood Investment Management, Llc | 12.562 | 1 | ||||||
| 2026-02-13 | 13F | Victory Capital Management Inc | 3.975.225 | -0,63 | 346.520 | 2,52 | ||||
| 2026-02-17 | 13F | Altrinsic Global Advisors Llc | 127.874 | -1,68 | 11.147 | 1,44 | ||||
| 2026-02-10 | 13F | United Super Pty Ltd in its capacity as Trustee for the Construction & Building Unions Superannuation Fund | 109.490 | 9.544 | ||||||
| 2026-02-17 | 13F | Schonfeld Strategic Advisors LLC | 41.573 | 62,55 | 3.624 | 67,73 | ||||
| 2026-02-03 | 13F | Costello Asset Management, INC | 200 | 0,00 | 17 | 6,25 | ||||
| 2026-02-10 | 13F | Gulf International Bank (UK) Ltd | 9.939 | 0,00 | 1 | |||||
| 2026-01-30 | 13F | Activest Wealth Management | 302 | 3.255,56 | 26 | |||||
| 2026-01-29 | 13F | Quent Capital, LLC | 611 | 58,29 | 53 | 65,63 | ||||
| 2026-04-07 | 13F | Eastern Bank | 0 | -100,00 | 0 | |||||
| 2026-02-17 | 13F | Prelude Capital Management, Llc | 6.002 | 59,08 | 523 | 64,47 | ||||
| 2026-02-03 | 13F | Farmers & Merchants Investments Inc | 166 | 0,00 | 14 | 0,00 | ||||
| 2026-02-02 | 13F | Cornerstone Planning Group LLC | 104 | 316,00 | 9 | |||||
| 2026-02-17 | 13F | Millennium Management Llc | 857.235 | -7,45 | 74.725 | -4,51 | ||||
| 2026-02-04 | 13F | Plato Investment Management Ltd | 18.505 | 0,00 | 1.621 | 4,45 | ||||
| 2026-04-09 | 13F | Wedmont Private Capital | 4.709 | 5,68 | 430 | 9,14 | ||||
| 2026-02-11 | 13F | IMA Wealth, Inc. | 1.307 | 114 | ||||||
| 2026-02-10 | 13F | MUFG Securities EMEA plc | 7.224 | 111,79 | 630 | 118,40 | ||||
| 2026-02-12 | 13F | Johnson Financial Group, Inc. | 368 | -72,41 | 32 | -71,43 | ||||
| 2026-02-02 | 13F | Fifth Third Bancorp | 7.217 | 0,63 | 629 | 3,97 | ||||
| 2026-02-06 | 13F | Elk River Wealth Management, LLC | 52.132 | -2,22 | 4.541 | 0,78 | ||||
| 2026-02-11 | 13F | Smithbridge Asset Management Inc/de | 25.500 | 2.223 | ||||||
| 2026-02-09 | 13F | HBK Sorce Advisory LLC | 5.060 | 4,74 | 483 | 21,11 | ||||
| 2026-02-06 | 13F | Pnc Financial Services Group, Inc. | 44.092 | 1,65 | 3.843 | 4,86 | ||||
| 2026-01-14 | 13F | Accurate Wealth Management, LLC | 2.342 | 220 | ||||||
| 2026-02-13 | 13F | Atlas Capital Advisors Llc | 3.584 | 0,00 | 312 | 8,71 | ||||
| 2026-04-06 | 13F | Versant Capital Management, Inc | 2.261 | 267,05 | 198 | 271,70 | ||||
| 2026-02-13 | 13F | Barclays Plc | 376.292 | -18,84 | 32.801 | -16,26 | ||||
| 2026-04-06 | 13F | Highline Wealth Partners Llc | 102 | 9 | ||||||
| 2026-01-12 | 13F | Salem Investment Counselors Inc | 46.524 | -1,66 | 4.056 | 1,45 | ||||
| 2026-02-17 | 13F | Worldquant Millennium Advisors Llc | 648.813 | 38,26 | 56.557 | 42,65 | ||||
| 2026-02-17 | 13F | Pinnacle Financial Partners, Inc. | 8.130 | 709 | ||||||
| 2026-02-17 | 13F | ISAM Funds (UK) Ltd | 7.160 | 20,07 | 624 | 24,06 | ||||
| 2026-01-23 | 13F | Rsm Us Wealth Management Llc | 3.281 | 29,63 | 290 | 35,68 | ||||
| 2026-02-09 | 13F | Themes Management Co LLC | 5.334 | 465 | ||||||
| 2026-02-10 | 13F | Natixis Advisors, L.p. | 284.012 | 3,58 | 25 | 4,35 | ||||
| 2026-02-05 | 13F | Atria Investments Llc | 10.572 | 4,09 | 922 | 7,34 | ||||
| 2026-02-06 | 13F | ProShare Advisors LLC | 47.952 | 3,44 | 4.180 | 6,72 | ||||
| 2026-02-10 | 13F | Connor, Clark & Lunn Investment Management Ltd. | 42.016 | 167,50 | 3.663 | 175,96 | ||||
| 2025-11-07 | 13F | Readystate Asset Management Lp | 0 | -100,00 | 0 | |||||
| 2026-01-26 | 13F | Whittier Trust Co Of Nevada Inc | 3.600 | 0,00 | 324 | 3,85 | ||||
| 2025-11-13 | 13F | EntryPoint Capital, LLC | 0 | -100,00 | 0 | |||||
| 2025-10-15 | 13F | Chesapeake Asset Management Llc | 0 | -100,00 | 0 | |||||
| 2026-02-11 | 13F | Primecap Management Co/ca/ | 1.264.940 | -58,43 | 110.265 | -57,12 | ||||
| 2026-01-27 | 13F | Krilogy Financial LLC | 15.005 | 32,40 | 1.420 | 56,22 | ||||
| 2026-02-12 | 13F | Tocqueville Asset Management L.p. | 6.130 | 0,00 | 534 | 3,29 | ||||
| 2026-01-09 | 13F | 180 Wealth Advisors, Llc | 3.113 | 271 | ||||||
| 2026-01-15 | 13F | Allspring Global Investments Holdings, LLC | 7.772 | -0,89 | 677 | 1,20 | ||||
| 2026-02-13 | 13F | Baird Financial Group, Inc. | 17.416 | -12,96 | 1.518 | -10,18 | ||||
| 2026-01-28 | 13F | B. Metzler seel. Sohn & Co. AG | 64.602 | 3,16 | 5.631 | 6,43 | ||||
| 2026-02-17 | 13F | Susquehanna International Group, Llp | Put | 40.900 | 61,02 | 3.565 | 66,12 | |||
| 2026-02-17 | 13F | Susquehanna International Group, Llp | Call | 127.000 | -14,65 | 11.071 | -11,95 | |||
| 2026-02-17 | 13F | Howard Hughes Medical Institute | 38 | -2,56 | 3 | 0,00 | ||||
| 2026-02-17 | 13F | Susquehanna International Group, Llp | 34.035 | -51,27 | 2.967 | -49,73 | ||||
| 2026-01-14 | 13F | First City Capital Management, Inc. | 7.840 | 0,00 | 683 | 3,17 | ||||
| 2026-02-12 | 13F | Callan Family Office, LLC | 13.429 | 89,38 | 1.171 | 95,33 | ||||
| 2026-02-12 | 13F | Colonial Trust Co / SC | 11 | -71,05 | 1 | -100,00 | ||||
| 2026-01-20 | 13F | Pflug Koory, LLC | 13.763 | 0,00 | 1.200 | 3,18 | ||||
| 2026-02-17 | 13F | Russell Investments Group, Ltd. | 438.846 | -13,16 | 38.258 | -10,39 | ||||
| 2026-02-17 | 13F | Strive Financial Group ,LLC | 360 | 31 | ||||||
| 2026-02-02 | 13F | PFA Pension, Forsikringsaktieselskab | 192.309 | 16.989 | ||||||
| 2026-02-06 | 13F | Transce3nd, LLC | 73 | 0,00 | 7 | 0,00 | ||||
| 2026-02-11 | 13F | Empowered Funds, LLC | 158.173 | 2.735,15 | 13.788 | 2.827,18 | ||||
| 2026-02-06 | 13F | Lsv Asset Management | 4.034.842 | -1,74 | 352 | 1,45 | ||||
| 2026-02-11 | 13F | Deutsche Bank Ag\ | 538.620 | -7,31 | 46.952 | -4,37 | ||||
| 2026-02-02 | 13F | Pittenger & Anderson Inc | 1.325 | 0,00 | 116 | 3,60 | ||||
| 2026-02-13 | 13F | Bank Of Nova Scotia | 58.455 | -27,57 | 5.096 | -25,28 | ||||
| 2026-02-11 | 13F | Nemes Rush Group LLC | 11 | 1 | ||||||
| 2026-01-15 | 13F | Econ Financial Services Corp | 21.554 | 1.879 | ||||||
| 2025-10-31 | 13F | Symphony Financial, Ltd. Co. | 0 | -100,00 | 0 | -100,00 | ||||
| 2026-02-10 | 13F | Envestnet Asset Management Inc | 130.072 | -21,89 | 11.338 | -19,42 | ||||
| 2026-02-13 | 13F | Barclays Plc | Call | 0 | -100,00 | 0 | -100,00 | |||
| 2026-02-13 | 13F | Barclays Plc | Put | 0 | -100,00 | 0 | -100,00 | |||
| 2025-11-14 | 13F | Mbb Public Markets I Llc | 0 | -100,00 | 0 | |||||
| 2026-02-09 | 13F | Harbour Investments, Inc. | 1.031 | -0,19 | 90 | 2,30 | ||||
| 2026-02-17 | 13F | Concentric Capital Strategies, LP | 20.410 | -84,47 | 1.779 | -83,98 | ||||
| 2026-02-11 | 13F | Group One Trading, L.p. | Call | 300 | -81,25 | 26 | -80,74 | |||
| 2026-02-11 | 13F | Winnow Wealth Llc | 5 | 0,00 | 0 | |||||
| 2026-02-12 | 13F | Triumph Capital Management | 36 | 0,00 | 3 | 0,00 | ||||
| 2026-02-17 | 13F | Ameriflex Group, Inc. | 37 | -50,00 | 3 | -50,00 | ||||
| 2026-02-11 | 13F | Group One Trading, L.p. | 3 | -99,40 | 0 | -100,00 | ||||
| 2026-01-29 | 13F | Rakuten Securities, Inc. | 30 | 50,00 | 3 | 100,00 | ||||
| 2026-02-17 | 13F | nVerses Capital, LLC | 2.388 | 208 | ||||||
| 2026-02-13 | 13F | South Plains Financial, Inc. | 46 | 0,00 | 4 | 33,33 | ||||
| 2025-10-15 | 13F | Net Worth Advisory Group | 0 | -100,00 | 0 | |||||
| 2025-11-04 | 13F | Guerra Advisors Inc | 10 | 1 | ||||||
| 2026-02-12 | 13F | Jane Street Group, Llc | Call | 51.100 | -56,95 | 4.454 | -55,58 | |||
| 2026-02-12 | 13F | Jane Street Group, Llc | 8.911 | 21,50 | 777 | 25,36 | ||||
| 2026-02-12 | 13F | Jane Street Group, Llc | Put | 9.100 | 264,00 | 793 | 275,83 | |||
| 2026-02-17 | 13F | National Asset Management, Inc. | 4.571 | -6,96 | 398 | -4,10 | ||||
| 2026-02-13 | 13F | Kayne Anderson Rudnick Investment Management Llc | 40 | 5,26 | 4 | 0,00 |