Grundlæggende statistik
| Institutionelle aktier (lange) | 84.490.716 - 96,44% (ex 13D/G) - change of -15,59MM shares -15,57% MRQ |
| Institutionel værdi (lang) | $ 14.943.168 USD ($1000) |
Institutionelt ejerskab og aktionærer
Tenet Healthcare Corporation (US:THC) har 714 institutionelle ejere og aktionærer, der har indsendt 13D/G- eller 13F-formularer til Securities Exchange Commission (SEC). Disse institutioner har i alt 84,490,716 aktier. Største aktionærer omfatter Vanguard Group Inc, BlackRock, Inc., Fmr Llc, Price T Rowe Associates Inc /md/, Boston Partners, State Street Corp, Aqr Capital Management Llc, Glenview Capital Management, Llc, Invesco Ltd., and Lone Pine Capital Llc .
Tenet Healthcare Corporation (NYSE:THC) institutionel ejerskabsstruktur viser aktuelle positioner i virksomheden efter institutioner og fonde, samt seneste ændringer i positionsstørrelse. Større aktionærer kan omfatte individuelle investorer, investeringsforeninger, hedgefonde eller institutioner. Skema 13D angiver, at investoren besidder (eller besidder) mere end 5 % af virksomheden og har til hensigt (eller har til hensigt at) aktivt at forfølge en ændring i forretningsstrategi. Skema 13G indikerer en passiv investering på over 5%.
The share price as of April 27, 2026 is 185,53 / share. Previously, on April 28, 2025, the share price was 123,91 / share. This represents an increase of 49,73% over that period.

Fondens stemningsscore
Fund Sentiment Score (fka Ownership Accumulation Score) finder de aktier, der bliver mest købt af fonde. Det er resultatet af en sofistikeret, multi-faktor kvantitativ model, der identificerer virksomheder med de højeste niveauer af institutionel akkumulering. Scoringsmodellen bruger en kombination af den samlede stigning i oplyste ejere, ændringerne i porteføljeallokeringer i disse ejere og andre målinger. Tallet går fra 0 til 100, hvor højere tal indikerer et højere niveau af akkumulering for sine jævnaldrende, og 50 er gennemsnittet.
Opdateringsfrekvens: Dagligt
Se Ownership Explorer, som giver en liste over højest rangerende virksomheder.
AI+ Ask Fintel’s AI assistant about Tenet Healthcare Corporation.
Select a question to share a public post with an AI-crafted answer.
Thinking of good questions…
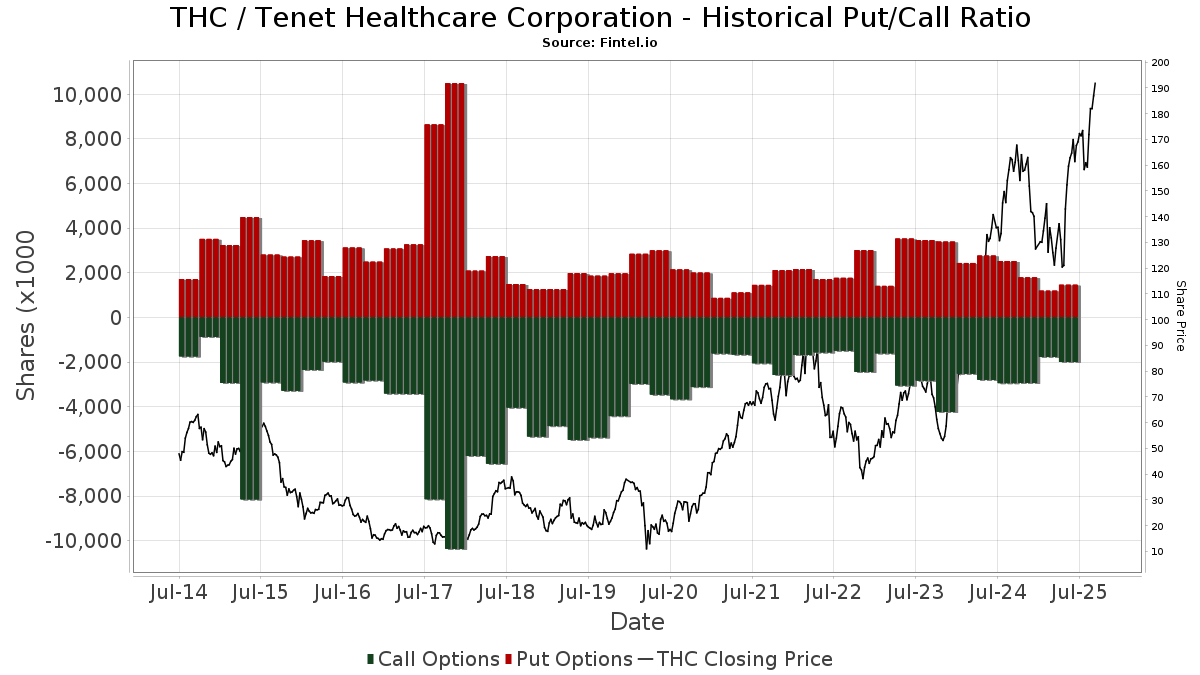
Institutionel Put/Call-forhold
Ud over at indberette standardaktie- og gældsudstedelser skal institutter med mere end 100 mill. aktiver under forvaltning også oplyse deres put- og call-optionsbeholdninger. Da salgsoptioner generelt indikerer negativ stemning, og købsoptioner indikerer positiv stemning, kan vi få en fornemmelse af den overordnede institutionelle stemning ved at plotte forholdet mellem put og kald. Diagrammet til højre viser det historiske put/call-forhold for dette instrument.
Brug af Put/Call Ratio som en indikator for investorernes stemning overvinder en af de vigtigste mangler ved at bruge totalt institutionelt ejerskab, som er, at en betydelig mængde af aktiver under forvaltning investeres passivt for at spore indekser. Passivt forvaltede fonde køber typisk ikke optioner, så indikatoren for put/call-forholdet følger mere nøje følelsen af aktivt forvaltede fonde.
13D/G-arkivering
Vi præsenterer 13D/G ansøgninger separat fra 13F ansøgninger på grund af den forskellige behandling af SEC. 13D/G-ansøgninger kan indgives af grupper af investorer (med én ledende), hvorimod 13F-ansøgninger ikke kan. Dette resulterer i situationer, hvor en investor kan indsende en 13D/G, der rapporterer én værdi for de samlede aktier (der repræsenterer alle de aktier, der ejes af investorgruppen), men derefter indsender en 13F, der rapporterer en anden værdi for de samlede aktier (der udelukkende repræsenterer deres egne) ejendomsret). Det betyder, at aktieejerskab af 13D/G-arkiver og 13F-arkiveringer ofte ikke er direkte sammenlignelige, så vi præsenterer dem separat.
Bemærk: Fra den 16. maj 2021 viser vi ikke længere ejere, der ikke har indsendt en 13D/G inden for det seneste år. Tidligere viste vi den fulde historie af 13D/G-arkiver. Generelt skal enheder, der er forpligtet til at indgive 13D/G-ansøgninger, indgive mindst årligt, før de indsender en afsluttende ansøgning. Dog forlader fonde nogle gange positioner uden at indsende en afsluttende ansøgning (dvs. de afvikler), så visning af den fulde historie resulterede nogle gange i forvirring om det nuværende ejerskab. For at undgå forvirring viser vi nu kun 'aktuelle' ejere - det vil sige - ejere, der har anmeldt inden for det seneste år.
Upgrade to unlock premium data.
| Fil dato | Form | Investor | Forrige Aktier |
Seneste Aktier |
Δ Aktier (Procent) |
Ejendomsret (Procent) |
Δ Ejerskab (Procent) |
|
|---|---|---|---|---|---|---|---|---|
| 2026-03-27 | VANGUARD GROUP INC | 11,110,396 | 0 | -100.00 | 0.00 | -100.00 | ||
| 2025-05-09 | Invesco Ltd. | 5,422,099 | 4,172,556 | -23.05 | 4.40 | -16.98 | ||
| 2025-04-17 | BlackRock, Inc. | 10,881,666 | 8,391,511 | -22.88 | 8.80 | -17.76 |
13F og NPORT arkivering
Detaljer om 13F-arkivering er gratis. Detaljer om NP-ansøgninger kræver et premium-medlemskab. Grønne rækker angiver nye positioner. Røde rækker angiver lukkede positioner. Klik på linket ikon for at se den fulde transaktionshistorik.
Opgrader
for at låse premium-data op og eksportere til Excel ![]() .
.
| Fil dato | Kilde | Investor | Type | Gennemsnitlig pris (Øst) |
Aktier | Δ Aktier (%) |
Rapporteret Værdi ($1000) |
Δ Værdi (%) |
Port Alloc (%) |
|
|---|---|---|---|---|---|---|---|---|---|---|
| 2026-02-13 | 13F | Arrowstreet Capital, Limited Partnership | 426.799 | 14,73 | 84.813 | 12,29 | ||||
| 2026-02-17 | 13F | Balyasny Asset Management Llc | Call | 6.800 | 518,18 | 1.351 | 505,83 | |||
| 2026-02-17 | 13F | Balyasny Asset Management Llc | Put | 8.400 | 600,00 | 1.669 | 586,83 | |||
| 2026-04-14 | 13F | Congress Park Capital LLC | 1.215 | -67,29 | 229 | -68,97 | ||||
| 2026-02-17 | 13F | Coppell Advisory Solutions LLC | 1.063 | 214 | ||||||
| 2026-01-15 | 13F | Nisa Investment Advisors, Llc | 1.750 | -7,36 | 348 | -9,40 | ||||
| 2026-01-23 | 13F | Transcend Wealth Collective, Llc | 1.791 | 10,42 | 356 | 7,90 | ||||
| 2026-01-29 | 13F | Quent Capital, LLC | 95 | 1,06 | 19 | -5,26 | ||||
| 2026-02-17 | 13F | Balyasny Asset Management Llc | 143.714 | -58,48 | 28.559 | -59,37 | ||||
| 2026-02-17 | 13F | Shelton Capital Management | 2.989 | -9,26 | 594 | -11,23 | ||||
| 2026-01-29 | 13F | Kestra Private Wealth Services, Llc | 0 | -100,00 | 0 | |||||
| 2026-02-17 | 13F | Summit Trail Advisors, Llc | 7.674 | 3,44 | 1.525 | 1,20 | ||||
| 2026-02-13 | 13F | Natixis | 31.062 | 37.324,10 | 6.173 | 38.475,00 | ||||
| 2026-02-13 | 13F | SRS Capital Advisors, Inc. | 341 | -98,64 | 68 | -98,68 | ||||
| 2026-02-12 | 13F | Federation des caisses Desjardins du Quebec | 19.583 | 4,07 | 3.892 | 1,86 | ||||
| 2026-02-13 | 13F | Blueshift Asset Management, LLC | 1.637 | 325 | ||||||
| 2026-02-12 | 13F | Scotia Capital Inc. | 0 | -100,00 | 0 | |||||
| 2026-01-23 | 13F | Optima Capital Llc | 3 | 1 | ||||||
| 2026-02-13 | 13F | Mml Investors Services, Llc | 14.096 | -20,95 | 2.801 | -22,62 | ||||
| 2026-02-14 | 13F | Rockefeller Capital Management L.P. | 12.112 | 24,71 | 2.407 | 22,06 | ||||
| 2026-02-17 | 13F | United Capital Financial Advisers, Llc | 1.942 | 81,84 | 386 | 78,24 | ||||
| 2026-01-30 | 13F | Turning Point Benefit Group, Inc. | 2 | 0,00 | 0 | |||||
| 2026-02-17 | 13F | CWM Advisors, LLC | 0 | -100,00 | 0 | |||||
| 2026-02-18 | 13F | Vident Advisory, LLC | 2.185 | 6,27 | 434 | 4,08 | ||||
| 2026-02-12 | 13F | Graetz Wealth LLC | 1.159 | 230 | ||||||
| 2026-02-13 | 13F | SYM FINANCIAL Corp | 1.034 | -12,22 | 205 | -14,23 | ||||
| 2026-02-13 | 13F | First Trust Advisors Lp | 214.756 | 19,38 | 42.676 | 16,84 | ||||
| 2026-02-17 | 13F | Dv Equities, Llc | 500 | 99 | ||||||
| 2026-02-17 | 13F | Ancora Advisors, LLC | 88 | 17 | ||||||
| 2026-02-17 | 13F | XTX Topco Ltd | 2.173 | 88,96 | 432 | 84,98 | ||||
| 2025-11-14 | 13F | Bridgefront Capital, LLC | 0 | -100,00 | 0 | -100,00 | ||||
| 2025-11-12 | 13F | Transce3nd, LLC | 0 | -100,00 | 0 | |||||
| 2026-04-10 | 13F | Abound Wealth Management | 8 | 700,00 | 1 | |||||
| 2026-02-12 | 13F | Andra AP-fonden | 0 | -100,00 | 0 | |||||
| 2026-01-23 | 13F | Assetmark, Inc | 6.110 | -3,98 | 1.214 | -5,96 | ||||
| 2026-02-17 | 13F | Aqr Capital Management Llc | 2.256.539 | 20,26 | 448.419 | 17,70 | ||||
| 2026-02-13 | 13F | Treasurer of the State of North Carolina | 70.656 | -14,02 | 14 | -12,50 | ||||
| 2026-04-15 | 13F | Merit Financial Group, LLC | 10.826 | -9,63 | 2.043 | -14,20 | ||||
| 2026-04-27 | 13F | BIP Wealth, LLC | 2.113 | -0,89 | 399 | -5,91 | ||||
| 2025-11-12 | 13F | 111 Capital | 0 | -100,00 | 0 | -100,00 | ||||
| 2026-02-13 | 13F | Johnson Investment Counsel Inc | 0 | -100,00 | 0 | |||||
| 2026-01-26 | 13F | Cwm, Llc | 53.435 | 17,48 | 11 | 11,11 | ||||
| 2026-01-29 | 13F | Sanctuary Advisors, LLC | 11.843 | -21,83 | 2.353 | -23,50 | ||||
| 2026-02-17 | 13F | Atom Investors LP | 17.250 | 3.428 | ||||||
| 2026-04-16 | 13F | Beese Fulmer Investment Management, Inc. | 1.223 | 13,03 | 231 | 6,98 | ||||
| 2026-01-30 | 13F | R Squared Ltd | 2.032 | -12,98 | 404 | -14,98 | ||||
| 2026-02-10 | 13F | Sivia Capital Partners, LLC | 5.215 | 117,93 | 1.036 | 113,61 | ||||
| 2026-02-11 | 13F | Clearbridge Investments, LLC | 134.261 | -22,07 | 26.680 | -23,73 | ||||
| 2026-02-11 | 13F | Brandywine Global Investment Management, LLC | 126.248 | 20,45 | 25.088 | 17,89 | ||||
| 2025-11-06 | 13F | Essex Investment Management Co Llc | 0 | -100,00 | 0 | |||||
| 2026-02-11 | 13F | Waddell & Associates, Llc | 2.459 | 62,52 | 489 | 58,96 | ||||
| 2026-02-17 | 13F | Steamboat Capital Partners, LLC | 51.326 | 0,21 | 10.200 | -1,91 | ||||
| 2026-04-13 | 13F | Wedge Capital Management L L P/nc | 160.975 | -13,78 | 30.378 | -18,13 | ||||
| 2026-04-02 | 13F | Byrne Asset Management LLC | 160 | 28,00 | 30 | 25,00 | ||||
| 2026-02-11 | 13F | MidWestOne Financial Group, Inc. | 5.676 | 35,37 | 1.128 | 32,43 | ||||
| 2026-02-13 | 13F | Van Eck Associates Corp | 3.475 | 5,02 | 1 | |||||
| 2026-02-13 | 13F | Commerce Bank | 1.054 | 2,13 | 209 | 0,00 | ||||
| 2026-02-05 | 13F | HFM Investment Advisors, LLC | 7 | 16,67 | 1 | 0,00 | ||||
| 2026-02-12 | 13F | Commonwealth Equity Services, Llc | 4.627 | -1,45 | 919 | |||||
| 2026-02-02 | 13F | Wolverine Asset Management Llc | Put | 37.000 | 0,00 | 7.353 | -2,13 | |||
| 2026-04-08 | 13F | NorthCrest Asset Manangement, LLC | 2.384 | -40,15 | 449 | -45,63 | ||||
| 2026-02-03 | 13F | Indivisible Partners | 1.726 | 343 | ||||||
| 2026-02-13 | 13F | 8 Knots Management, Llc | 0 | -100,00 | 0 | |||||
| 2026-01-30 | 13F | Torren Management, LLC | 261 | 52 | ||||||
| 2026-04-24 | 13F | Fulton Bank, N.a. | 1.945 | 7,76 | 367 | 2,51 | ||||
| 2026-01-23 | 13F | Avion Wealth | 13 | 30,00 | 0 | |||||
| 2026-04-22 | 13F | Sterling Capital Management LLC | 6.008 | -34,80 | 1.134 | -38,12 | ||||
| 2026-02-02 | 13F | Principal Financial Group Inc | 188.965 | -3,69 | 37.551 | -5,74 | ||||
| 2025-11-14 | 13F | Orbimed Advisors Llc | 0 | -100,00 | 0 | |||||
| 2026-02-13 | 13F | Magnolia Capital Advisors Llc | 1.021 | 203 | ||||||
| 2026-02-17 | 13F | Tudor Investment Corp Et Al | Put | 1.200 | 238 | |||||
| 2026-02-17 | 13F | Tudor Investment Corp Et Al | Call | 1.500 | -51,61 | 298 | -52,62 | |||
| 2026-02-17 | 13F | LMR Partners LLP | 13.377 | 22.963,79 | 2.658 | 24.063,64 | ||||
| 2026-01-26 | 13F | AE Wealth Management LLC | 2.610 | -7,08 | 519 | -9,12 | ||||
| 2026-02-17 | 13F/A | RBF Capital, LLC | 93.237 | 0,00 | 18.528 | -2,12 | ||||
| 2026-03-02 | 13F | Reflection Asset Management | 87 | 17 | ||||||
| 2026-04-06 | 13F | Highline Wealth Partners Llc | 12 | 2 | ||||||
| 2026-02-10 | 13F | Goldman Sachs Group Inc | Call | 26.200 | -59,13 | 5.206 | -60,00 | |||
| 2026-02-13 | 13F | Umb Bank N A/mo | 1.169 | 9,25 | 232 | 6,91 | ||||
| 2026-02-17 | 13F | Engineers Gate Manager LP | 94.826 | -23,73 | 18.844 | -25,35 | ||||
| 2026-02-10 | 13F | Goldman Sachs Group Inc | Put | 26.200 | -34,66 | 5.206 | -36,05 | |||
| 2026-02-13 | 13F | Boston Partners | 3.642.136 | 15,71 | 723.804 | 13,28 | ||||
| 2026-02-17 | 13F | Amundi | 66.904 | 147,70 | 13.295 | 146,43 | ||||
| 2026-01-08 | 13F | Nordea Investment Management Ab | 66.795 | -7,23 | 13.332 | -8,57 | ||||
| 2026-02-10 | 13F | Intech Investment Management Llc | 115.930 | 95,99 | 23.038 | 91,82 | ||||
| 2026-02-10 | 13F | Goldman Sachs Group Inc | 334.986 | 91,07 | 66.568 | 87,00 | ||||
| 2025-11-13 | 13F | Colonial River Wealth Management, LLC | 0 | -100,00 | 0 | |||||
| 2026-04-21 | 13F | Everpar Advisors Llc | 0 | -100,00 | 0 | |||||
| 2026-02-11 | 13F | Prestige Wealth Management Group LLC | 1.972 | 9,19 | 392 | 6,83 | ||||
| 2026-01-29 | 13F | UBS Group AG | 444.066 | -9,71 | 88.245 | -11,63 | ||||
| 2025-11-14 | 13F | Two Sigma Securities, Llc | 0 | -100,00 | 0 | |||||
| 2026-04-24 | 13F | Root Financial Partners, LLC | 658 | 146,44 | 124 | 133,96 | ||||
| 2026-04-14 | 13F | Northwest Wealth Management, Llc | 0 | -100,00 | 0 | |||||
| 2025-11-14 | 13F | Hamilton Wealth, LLC | 0 | -100,00 | 0 | |||||
| 2026-02-10 | 13F | New Mexico Educational Retirement Board | 18.900 | 0,00 | 4 | 0,00 | ||||
| 2026-04-07 | 13F | Park Avenue Securities Llc | 3.631 | -1,60 | 1 | |||||
| 2026-02-12 | 13F | Amitell Capital Pte Ltd | 35.008 | -21,49 | 6.957 | -23,16 | ||||
| 2026-02-17 | 13F | Hancock Whitney Corp | 91.935 | -1,52 | 18.269 | -3,61 | ||||
| 2026-02-13 | 13F | Beck Capital Management, Llc | 20.406 | 52,58 | 4.055 | 49,36 | ||||
| 2026-01-29 | 13F | UBS Group AG | Put | 71.300 | 0,00 | 14.169 | -2,13 | |||
| 2026-04-13 | 13F | Whalen Wealth Management Inc. | 1.899 | -17,61 | 358 | -21,83 | ||||
| 2026-01-29 | 13F | UBS Group AG | Call | 63.500 | 0,00 | 12.619 | -2,13 | |||
| 2026-04-23 | 13F | North Star Investment Management Corp. | 23 | -17,86 | 4 | -20,00 | ||||
| 2026-02-11 | 13F | Strategy Asset Managers Llc | 1.489 | 296 | ||||||
| 2026-02-17 | 13F | Harris Associates L P | 2.400 | 0,00 | 477 | -2,26 | ||||
| 2026-02-13 | 13F | Exome Asset Management LLC | 6.084 | -66,39 | 1.209 | -67,10 | ||||
| 2026-04-08 | 13F | DiNuzzo Private Wealth, Inc. | 18 | 0,00 | 3 | 0,00 | ||||
| 2026-02-13 | 13F | Change Path, LLC | 6.671 | 4,58 | 1.326 | 2,32 | ||||
| 2026-02-04 | 13F | Legacy Financial Advisors, Inc. | 1.526 | 38,60 | 303 | 35,87 | ||||
| 2026-02-12 | 13F | Ci Investments Inc. | 1.161 | -4,84 | 231 | |||||
| 2026-01-30 | 13F | Bogart Wealth, LLC | 8 | 0,00 | 2 | 0,00 | ||||
| 2026-01-28 | 13F | CAPROCK Group, Inc. | 8.680 | 7,93 | 1.725 | 16,33 | ||||
| 2026-04-09 | 13F | Tompkins Financial Corp | 73 | 0,00 | 14 | -7,14 | ||||
| 2026-02-02 | 13F | Advisors Preferred, LLC | 4.920 | -7,24 | 981 | -8,06 | ||||
| 2026-02-11 | 13F | Explore Capital Management, LLC | 22.100 | -56,06 | 4.392 | -57,00 | ||||
| 2026-02-17 | 13F | Advisory Services Network, LLC | 11.344 | 60,66 | 2.254 | 57,29 | ||||
| 2026-02-11 | 13F | Ing Groep Nv | 0 | -100,00 | 0 | |||||
| 2026-04-22 | 13F | Pictet Asset Management Holding SA | 14.336 | 6,15 | 2.705 | 0,82 | ||||
| 2026-02-03 | 13F | SBI Securities Co., Ltd. | 11 | 22,22 | 2 | 100,00 | ||||
| 2026-04-15 | 13F | Exchange Traded Concepts, Llc | 3.324 | 69,85 | 627 | 61,60 | ||||
| 2026-02-06 | 13F | Bare Financial Services, Inc | 8 | 166,67 | 2 | |||||
| 2025-11-14 | 13F | Cubist Systematic Strategies, LLC | Put | 35.400 | 35,11 | 7.188 | 55,87 | |||
| 2026-02-23 | 13F | Wealth Preservation Advisors, LLC | 8 | 33,33 | 2 | 0,00 | ||||
| 2025-11-14 | 13F | Cubist Systematic Strategies, LLC | Call | 48.400 | 20,40 | 9.827 | 38,90 | |||
| 2026-02-13 | 13F | Macquarie Group Ltd | 0 | -100,00 | 0 | |||||
| 2026-02-12 | 13F | Great Valley Advisor Group, Inc. | 1.380 | -0,72 | 274 | -2,84 | ||||
| 2025-11-14 | 13F | Cubist Systematic Strategies, LLC | 23.767 | 89,98 | 4.826 | 119,22 | ||||
| 2026-02-17 | 13F | Voleon Capital Management Lp | 32.692 | -14,57 | 6.497 | -16,39 | ||||
| 2026-01-29 | 13F | Rakuten Securities, Inc. | 19 | 35,71 | 4 | 50,00 | ||||
| 2026-02-17 | 13F | Numerai GP LLC | 4.773 | 24,62 | 948 | 22,01 | ||||
| 2026-02-13 | 13F | Brant Point Investment Management Llc | 51.439 | 0,00 | 10.222 | -2,14 | ||||
| 2026-04-02 | 13F | Ares Financial Consulting, LLC | 25 | 0,00 | 5 | 0,00 | ||||
| 2026-02-13 | 13F | FORA Capital, LLC | 0 | -100,00 | 0 | |||||
| 2026-04-08 | 13F | Dynamic Advisor Solutions LLC | 1.309 | -12,27 | 247 | -16,55 | ||||
| 2026-02-17 | 13F | SageView Advisory Group, LLC | 422 | 84 | ||||||
| 2026-02-10 | 13F | Acadian Asset Management Llc | 82.637 | 239,61 | 16 | 300,00 | ||||
| 2026-04-20 | 13F | CWA Asset Management Group, LLC | 0 | -100,00 | 0 | |||||
| 2026-02-13 | 13F | Candriam Luxembourg S.C.A. | 178.601 | 412,99 | 35.493 | 402,09 | ||||
| 2026-04-22 | 13F | Oak Harvest Investment Services | 1.391 | 0,00 | 262 | -5,07 | ||||
| 2026-04-27 | 13F | Leonteq Securities AG | 18 | -37,93 | 3 | -40,00 | ||||
| 2026-02-09 | 13F | King Wealth | 4.500 | 0,00 | 1 | |||||
| 2025-11-14 | 13F | Capstone Investment Advisors, Llc | Call | 0 | -100,00 | 0 | -100,00 | |||
| 2026-02-17 | 13F | Capitolis Liquid Global Markets LLC | 28.700 | 5.703 | ||||||
| 2026-04-27 | 13F | New York State Teachers Retirement System | 87.502 | -3,56 | 17 | -11,11 | ||||
| 2026-02-10 | 13F | Eurizon Capital SGR S.p.A. | 1.950 | 390 | ||||||
| 2026-02-17 | 13F | Persistent Asset Partners Ltd | 2.499 | -61,29 | 497 | -62,14 | ||||
| 2026-01-28 | 13F | WPG Advisers, LLC | 86 | -39,01 | 17 | -39,29 | ||||
| 2026-02-12 | 13F | Advisors Asset Management, Inc. | 6.706 | 161,85 | 1.333 | 156,65 | ||||
| 2026-02-12 | 13F | Bank Of Montreal /can/ | 21.276 | -4,12 | 4.228 | -6,17 | ||||
| 2026-04-22 | 13F | Motco | 0 | -100,00 | 0 | |||||
| 2026-02-11 | 13F | Havemeyer Place LP | 10.335 | 2.054 | ||||||
| 2026-02-12 | 13F | Dimensional Fund Advisors Lp | 1.275.779 | -4,23 | 253.541 | -6,25 | ||||
| 2026-02-13 | 13F | Squarepoint Ops LLC | Call | 36.800 | 1.652,38 | 7.313 | 1.616,43 | |||
| 2026-02-13 | 13F | Squarepoint Ops LLC | Put | 4.900 | -51,00 | 974 | -52,07 | |||
| 2026-02-13 | 13F | Squarepoint Ops LLC | 14.011 | -21,38 | 2.784 | -23,05 | ||||
| 2026-02-17 | 13F | Vinva Investment Management Ltd | 2.300 | 34,66 | 691 | 32,18 | ||||
| 2026-01-30 | 13F | Us Bancorp \de\ | 8.574 | 2,95 | 1.704 | 0,77 | ||||
| 2026-02-09 | 13F | Hartland & Co., LLC | 1.503 | 222,53 | 299 | 217,02 | ||||
| 2026-02-12 | 13F | Nuveen, LLC | 1.155.677 | 12,04 | 229.656 | 9,66 | ||||
| 2026-02-13 | 13F | Victory Capital Management Inc | 731.575 | 18,63 | 145.379 | 16,10 | ||||
| 2026-02-04 | 13F | Dogwood Wealth Management LLC | 60 | 33,33 | 12 | 22,22 | ||||
| 2026-02-17 | 13F | LMR Partners LLP | Call | 0 | -100,00 | 0 | ||||
| 2026-04-08 | 13F | Wealth Enhancement Advisory Services, Llc | 34.801 | 13,50 | 6.100 | -4,54 | ||||
| 2025-10-31 | 13F | Sector Gamma As | 0 | -100,00 | 0 | -100,00 | ||||
| 2026-04-17 | 13F | Krilogy Financial LLC | 3.151 | -34,01 | 605 | -33,33 | ||||
| 2026-02-11 | 13F | Twin Tree Management, LP | Call | 54.500 | -4,39 | 10.830 | -6,42 | |||
| 2026-02-11 | 13F | Twin Tree Management, LP | Put | 5.900 | -42,16 | 1.172 | -43,41 | |||
| 2026-02-04 | 13F | Oregon Public Employees Retirement Fund | 17.558 | -1,35 | 3.489 | -3,43 | ||||
| 2026-04-27 | 13F | Sierra Summit Advisors Llc | 0 | -100,00 | 0 | |||||
| 2026-02-12 | 13F | California Public Employees Retirement System | 231.467 | 39,18 | 45.997 | 36,22 | ||||
| 2026-02-13 | 13F | American Century Companies Inc | 5.894 | 3,15 | 1.171 | 0,95 | ||||
| 2026-04-07 | 13F | CoreCap Advisors, LLC | 49 | -50,00 | 9 | -52,63 | ||||
| 2026-01-07 | 13F | Sagespring Wealth Partners, Llc | 1.573 | 3,62 | 313 | 1,30 | ||||
| 2026-02-17 | 13F | Northern Trust Corp | 770.443 | -3,83 | 153.102 | -5,88 | ||||
| 2025-11-19 | 13F | Caitong International Asset Management Co., Ltd | 0 | -100,00 | 0 | |||||
| 2026-02-10 | 13F | Clear Harbor Asset Management, LLC | 10.094 | -5,90 | 2.006 | -7,94 | ||||
| 2026-02-12 | 13F | Loomis Sayles & Co L P | 511 | 0,00 | 101 | -1,94 | ||||
| 2026-02-18 | 13F | Hanlon Investment Management, Inc. | 6.092 | 1.211 | ||||||
| 2025-10-29 | 13F | Donoghue Forlines LLC | 0 | -100,00 | 0 | |||||
| 2026-02-18 | 13F | First Citizens Bank & Trust Co | 8.215 | -19,25 | 1.632 | -20,97 | ||||
| 2026-02-17 | 13F | Quantinno Capital Management LP | 103.538 | 7,43 | 20.575 | 5,15 | ||||
| 2026-01-29 | 13F | China Universal Asset Management Co., Ltd. | 8.000 | -33,33 | 1.590 | -34,77 | ||||
| 2026-02-17 | 13F | Farringdon Capital, Ltd. | 0 | -100,00 | 0 | |||||
| 2026-02-10 | 13F | BW Gestao de Investimentos Ltda. | Call | 0 | -100,00 | 0 | -100,00 | |||
| 2026-02-09 | 13F | Legal & General Group Plc | 145.220 | -6,10 | 28.858 | -8,10 | ||||
| 2026-02-13 | 13F | Panagora Asset Management Inc | 186.856 | 23,12 | 37.132 | 20,51 | ||||
| 2025-11-14 | 13F | Teza Capital Management LLC | 0 | -100,00 | 0 | -100,00 | ||||
| 2026-04-21 | 13F | GHP Investment Advisors, Inc. | 2 | 0 | ||||||
| 2026-02-09 | 13F | Hantz Financial Services, Inc. | 3.680 | 29,03 | 1 | |||||
| 2026-04-13 | 13F | Bank of New Hampshire | 214 | 40 | ||||||
| 2026-04-24 | 13F | Optas, LLC | 2.497 | 0,20 | 471 | -4,85 | ||||
| 2026-02-10 | 13F | Peak Retirement Planning, Inc. | 14.359 | 21,47 | 2.854 | 18,88 | ||||
| 2026-02-04 | 13F | Westport Asset Management Inc | 1.000 | 0,00 | 203 | 0,00 | ||||
| 2026-02-17 | 13F | Alliancebernstein L.p. | 740.490 | -1,55 | 147.150 | -3,65 | ||||
| 2026-02-13 | 13F | BNP Paribas Asset Management Holding S.A. | 109.237 | 480,65 | 22 | 600,00 | ||||
| 2026-02-17 | 13F | Lighthouse Investment Partners, LLC | 7.127 | -28,73 | 1.416 | -30,25 | ||||
| 2026-02-12 | 13F | South Dakota Investment Council | 45.114 | -7,58 | 9 | -11,11 | ||||
| 2026-04-10 | 13F | Perigon Wealth Management, LLC | 0 | -100,00 | 0 | |||||
| 2026-02-11 | 13F | Meeder Asset Management Inc | 192 | 146,15 | 38 | 153,33 | ||||
| 2026-02-17 | 13F | D. E. Shaw & Co., Inc. | 1.189.512 | 59,69 | 236.380 | 56,29 | ||||
| 2026-04-17 | 13F | CENTRAL TRUST Co | 2 | 0,00 | 0 | |||||
| 2026-01-26 | 13F | Private Trust Co Na | 13 | -18,75 | 3 | -33,33 | ||||
| 2026-02-03 | 13F | We Are One Seven, LLC | 2.281 | 2,24 | 453 | 0,22 | ||||
| 2026-03-06 | 13F | Hsbc Holdings Plc | 266.400 | 4.099,24 | 53.269 | 4.029,30 | ||||
| 2026-02-19 | 13F | CI Private Wealth, LLC | 45.847 | 1.103,65 | 1.056 | 36,61 | ||||
| 2026-04-17 | 13F | Bell Investment Advisors, Inc | 81 | -15,62 | 15 | -21,05 | ||||
| 2026-04-10 | 13F | Quaker Wealth Management, LLC | 1 | 0,00 | 0 | |||||
| 2026-02-13 | 13F | Aptus Capital Advisors, LLC | 1.516 | 301 | ||||||
| 2026-02-06 | 13F | FourThought Financial Partners, LLC | 1.576 | 0,06 | 313 | -1,88 | ||||
| 2026-04-20 | 13F | Inscription Capital, LLC | 2.454 | 2,25 | 463 | -2,73 | ||||
| 2026-04-27 | 13F | Thrive Capital Management, LLC | 16.143 | -5,01 | 3.046 | -9,80 | ||||
| 2026-03-26 | 13F | Leonteq Securities AG | Call | 0 | -100,00 | 0 | -100,00 | |||
| 2026-02-17 | 13F | Voloridge Investment Management, Llc | 364.487 | 70,91 | 72.431 | 67,27 | ||||
| 2026-04-16 | 13F | Baron Wealth Management LLC | 1.115 | -2,36 | 210 | -7,08 | ||||
| 2026-04-16 | 13F | BI Asset Management Fondsmaeglerselskab A/S | 83.462 | -19,68 | 16 | -25,00 | ||||
| 2026-02-19 | 13F | Atomi Financial Group, Inc. | 1.501 | 0,81 | 298 | -1,32 | ||||
| 2025-11-14 | 13F | Avidity Partners Management LP | 0 | -100,00 | 0 | |||||
| 2026-02-12 | 13F | EntryPoint Capital, LLC | 1.369 | 0,00 | 272 | -1,81 | ||||
| 2026-02-11 | 13F | CLARET ASSET MANAGEMENT Corp | 1.317 | -0,23 | 0 | |||||
| 2026-01-15 | 13F | Burns Matteson Capital Management, LLC | 3.810 | 757 | ||||||
| 2026-01-21 | 13F | New Wave Wealth Advisors Llc | 3.304 | 5,86 | 657 | 3,63 | ||||
| 2026-02-09 | 13F | Investors Portfolio Services LLC | 6 | 1 | ||||||
| 2026-02-17 | 13F | Occudo Quantitative Strategies Lp | 0 | -100,00 | 0 | |||||
| 2026-02-17 | 13F | MIRAE ASSET GLOBAL ETFS HOLDINGS Ltd. | 4.290 | 13,52 | 853 | 11,08 | ||||
| 2026-02-13 | 13F | Mariner, LLC | 55.952 | 90,52 | 11.130 | 86,67 | ||||
| 2025-11-07 | 13F | Beacon Capital Management, LLC | 0 | -100,00 | 0 | |||||
| 2026-01-26 | 13F | Whittier Trust Co | 108 | 0,00 | 22 | 4,76 | ||||
| 2026-02-13 | 13F | Ariadne Wealth Management, LP | 875 | -18,30 | 203 | -3,33 | ||||
| 2026-02-17 | 13F | Aristeia Capital Llc | 3.841 | 763 | ||||||
| 2026-02-09 | 13F | Fidelis Capital Partners, LLC | 0 | -100,00 | 0 | |||||
| 2026-02-13 | 13F | OMERS ADMINISTRATION Corp | 0 | -100,00 | 0 | |||||
| 2025-11-14 | 13F | Wolverine Trading, Llc | 3.249 | -25,19 | 654 | -13,40 | ||||
| 2025-11-14 | 13F | Wolverine Trading, Llc | Call | 62.800 | 52,80 | 12.635 | 77,06 | |||
| 2026-02-17 | 13F | PFM Health Sciences, LP | 397.767 | -13,84 | 79.044 | -15,67 | ||||
| 2025-11-14 | 13F | Wolverine Trading, Llc | Put | 79.900 | 100,75 | 16.076 | 132,63 | |||
| 2026-01-30 | 13F | American Capital Advisory, LLC | 1 | 0,00 | 0 | |||||
| 2026-01-08 | 13F | Signet Financial Management, Llc | 15.267 | 1,21 | 3.034 | -0,95 | ||||
| 2026-02-12 | 13F | Ruggiero Investments, Inc. | 1.500 | 298 | ||||||
| 2026-02-09 | 13F | Arista Wealth Management, LLC | 2.424 | -33,11 | 482 | -34,56 | ||||
| 2026-04-14 | 13F | Tran Capital Management, L.p. | 32.428 | -5,63 | 6.119 | -10,38 | ||||
| 2026-02-12 | 13F | Brinker Capital Investments, LLC | 2.397 | -4,65 | 476 | -6,67 | ||||
| 2026-02-10 | 13F | Baker Avenue Asset Management, LP | 1.181 | -1,99 | 235 | -4,10 | ||||
| 2025-11-04 | 13F | Chung Wu Investment Group, LLC | 0 | -100,00 | 0 | |||||
| 2026-02-05 | 13F | Stephens Inc /ar/ | 1.517 | -6,42 | 301 | -8,51 | ||||
| 2026-02-17 | 13F | RMB Capital Management, LLC | 3.612 | 718 | ||||||
| 2026-02-12 | 13F | Rossby Financial, LCC | 2 | 0 | ||||||
| 2026-01-26 | 13F | Childress Capital Advisors, Llc | 1.279 | 254 | 25.300,00 | |||||
| 2026-02-13 | 13F | Taproot Management LP | 30.055 | 5.973 | ||||||
| 2026-02-17 | 13F | Scientech Research LLC | 0 | -100,00 | 0 | |||||
| 2025-11-26 | 13F | Vermillion & White Wealth Management Group, LLC | 0 | -100,00 | 0 | |||||
| 2026-04-21 | 13F | Foster & Motley Inc | 9.333 | 1,28 | 2 | 0,00 | ||||
| 2026-02-05 | 13F | Northwestern Mutual Investment Management Company, Llc | 19.663 | -0,15 | 3.907 | -2,28 | ||||
| 2026-02-03 | 13F | International Assets Investment Management, Llc | 633 | 126 | ||||||
| 2026-02-12 | 13F | JPL Wealth Management, LLC | 0 | -100,00 | 0 | |||||
| 2025-10-29 | 13F | Violich Capital Management, Inc. | 0 | -100,00 | 0 | |||||
| 2026-01-23 | 13F | Freestone Capital Holdings, LLC | 1.977 | 0,20 | 393 | -2,00 | ||||
| 2026-02-12 | 13F | Qtron Investments LLC | 3.076 | 202,16 | 611 | 196,60 | ||||
| 2026-02-17 | 13F | Toronto Dominion Bank | 10 | 2 | ||||||
| 2026-04-10 | 13F | Baker Tilly Financial, Llc | 1.219 | -17,13 | 230 | -21,23 | ||||
| 2026-04-21 | 13F | Vise Technologies, Inc. | 3.038 | 0,00 | 604 | 0,00 | ||||
| 2026-01-07 | 13F | Aventura Private Wealth, LLC | 51 | 0,00 | 10 | 0,00 | ||||
| 2026-02-10 | 13F | Globeflex Capital L P | 48.424 | 0,00 | 9.623 | -2,14 | ||||
| 2026-02-17 | 13F | Graham Capital Management, L.P. | 3.830 | -47,05 | 761 | -48,16 | ||||
| 2026-02-13 | 13F | Prudential Financial Inc | 83.094 | -69,59 | 16.727 | -69,85 | ||||
| 2026-02-05 | 13F | Mount Lucas Management LP | 3.380 | -1,86 | 672 | -4,01 | ||||
| 2026-02-17 | 13F | Qube Research & Technologies Ltd | Put | 3.200 | -38,46 | 636 | -39,81 | |||
| 2026-04-24 | 13F | IFM Investors Pty Ltd | 10 | 2 | ||||||
| 2026-02-17 | 13F | Qube Research & Technologies Ltd | Call | 13.200 | -0,75 | 2.623 | -2,85 | |||
| 2026-02-17 | 13F | Qube Research & Technologies Ltd | 153.933 | 2.059,25 | 30.590 | 2.013,96 | ||||
| 2026-02-12 | 13F | Leith Wheeler Investment Counsel Ltd. | 52.239 | 2,29 | 10.381 | 0,11 | ||||
| 2026-02-06 | 13F | Envestnet Portfolio Solutions, Inc. | 10.009 | -12,80 | 1.989 | -14,68 | ||||
| 2026-02-12 | 13F | Quadrant Capital Group Llc | 8.134 | 0,72 | 1.616 | -1,40 | ||||
| 2025-11-14 | 13F | Centiva Capital, LP | 0 | -100,00 | 0 | |||||
| 2026-02-12 | 13F | Marex Group plc | 2.473 | -17,57 | 491 | -19,38 | ||||
| 2026-02-12 | 13F | Penserra Capital Management LLC | 472 | 0 | ||||||
| 2026-02-10 | 13F | Quantbot Technologies LP | 0 | -100,00 | 0 | |||||
| 2026-01-23 | 13F | Hedeker Wealth, LLC | 16.877 | -2,68 | 3.354 | -4,74 | ||||
| 2026-04-15 | 13F | Optivise Advisory Services LLC | 1.237 | -15,68 | 233 | -19,93 | ||||
| 2026-01-22 | 13F | Venturi Wealth Management, LLC | 0 | -100,00 | 0 | |||||
| 2026-02-03 | 13F | Crossmark Global Holdings, Inc. | 10.889 | -15,78 | 2.164 | -17,60 | ||||
| 2026-02-17 | 13F | Nomura Holdings Inc | 9.143 | -75,38 | 1.817 | -75,92 | ||||
| 2026-04-27 | 13F | Greenleaf Trust | 0 | -100,00 | 0 | |||||
| 2026-02-17 | 13F | Nomura Holdings Inc | Call | 273.600 | 447,20 | 54.370 | 435,55 | |||
| 2026-02-17 | 13F | Nomura Holdings Inc | Put | 42.000 | -39,39 | 8.346 | -40,68 | |||
| 2026-02-09 | 13F | Wcm Investment Management, Llc | 400.968 | -21,41 | 80.715 | -21,38 | ||||
| 2026-02-19 | 13F | Mcguire Capital Advisors Inc | 20 | 4 | ||||||
| 2026-02-09 | 13F | Coldstream Capital Management Inc | 3.782 | -1,59 | 752 | -3,72 | ||||
| 2026-02-12 | 13F | Wealthspire Advisors, LLC | 0 | -100,00 | 0 | |||||
| 2026-02-05 | 13F | Leuthold Group, Llc | 32.784 | 9,75 | 6.515 | 7,40 | ||||
| 2026-04-27 | 13F | Truist Financial Corp | 13.949 | -2,25 | 2.632 | -7,16 | ||||
| 2026-01-22 | 13F | Personal Cfo Solutions, Llc | 1.497 | 2,32 | 297 | 0,00 | ||||
| 2026-01-30 | 13F | NJ State Employees Deferred Compensation Plan | 0 | -100,00 | 0 | |||||
| 2026-02-13 | 13F | Resources Investment Advisors, LLC. | 1.077 | 5,59 | 214 | 3,38 | ||||
| 2026-04-21 | 13F | Curat Global, LLC | 63 | 0,00 | 12 | -8,33 | ||||
| 2026-02-13 | 13F | Hudson Bay Capital Management LP | 0 | -100,00 | 0 | |||||
| 2026-02-10 | 13F | Principia Wealth Advisory, LLC | 2 | 100,00 | 0 | |||||
| 2026-02-04 | 13F | Virginia Retirement Systems Et Al | 13.421 | -5,96 | 2.667 | -7,94 | ||||
| 2026-02-13 | 13F | Alerus Financial Na | 38 | 0,00 | 8 | 0,00 | ||||
| 2026-02-05 | 13F | Requisite Capital Management, LLC | 0 | -100,00 | 0 | |||||
| 2026-02-12 | 13F | Hrt Financial Lp | 0 | -100,00 | 0 | |||||
| 2026-02-12 | 13F | Steward Partners Investment Advisory, Llc | 1.926 | 0,47 | 383 | -1,80 | ||||
| 2026-04-20 | 13F | Louisiana State Employees Retirement System | 25.500 | 4,94 | 4.812 | -0,33 | ||||
| 2026-01-30 | 13F | Sigma Planning Corp | 3.568 | 6,32 | 709 | 4,11 | ||||
| 2025-11-14 | 13F | DG Capital Management, LLC | Put | 0 | -100,00 | 0 | -100,00 | |||
| 2026-02-17 | 13F | Magnetar Financial LLC | 1.055 | 210 | ||||||
| 2025-11-14 | 13F | DG Capital Management, LLC | 0 | -100,00 | 0 | -100,00 | ||||
| 2026-04-06 | 13F | Rosenberg Matthew Hamilton | 2.000 | 0,00 | 377 | -5,04 | ||||
| 2026-04-10 | 13F | Oak Thistle LLC | 33.246 | 6.274 | ||||||
| 2026-02-10 | 13F | Nomura Asset Management Co Ltd | 13.199 | 823,01 | 2.623 | 804,14 | ||||
| 2026-02-17 | 13F | Fmr Llc | 7.642.182 | -3,45 | 1.518.654 | -5,50 | ||||
| 2026-04-06 | 13F | Versant Capital Management, Inc | 1.213 | 25,31 | 229 | 18,75 | ||||
| 2026-04-20 | 13F | Ronald Blue Trust, Inc. | 173 | -1,70 | 33 | -5,88 | ||||
| 2026-02-03 | 13F | Bokf, Na | 5.033 | -3,21 | 1.000 | -5,21 | ||||
| 2026-02-04 | 13F | Swiss Life Asset Management Ltd | 6.079 | 41,21 | 1.208 | 38,22 | ||||
| 2026-02-17 | 13F | Signature Equity Partners, LLC | 58 | 12 | ||||||
| 2026-02-11 | 13F | Picton Mahoney Asset Management | 3.121 | 144,40 | 620 | |||||
| 2026-02-17 | 13F | Keebeck Alpha, LP | 1.209 | 22,00 | 240 | 19,40 | ||||
| 2026-04-24 | 13F | UMA Financial Services, Inc. | 31 | -11,43 | 6 | -16,67 | ||||
| 2026-02-17 | 13F | Raymond James Financial Inc | 649.239 | -1,72 | 129.192 | -3,68 | ||||
| 2026-02-17 | 13F | Wellington Management Group Llp | 1.135.801 | 1.114,23 | 225.706 | 1.088,43 | ||||
| 2026-02-09 | 13F | Keating Financial Advisory Services, Inc. | 92 | 18 | ||||||
| 2026-02-17 | 13F | Warren Averett Asset Management, LLC | 3.626 | 23,97 | 721 | 21,42 | ||||
| 2026-02-13 | 13F | Charles Schwab Investment Management Inc | 634.072 | -0,16 | 126.003 | -2,28 | ||||
| 2026-01-16 | 13F | RHS Financial, LLC | 1.026 | -4,38 | 204 | -6,45 | ||||
| 2026-04-17 | 13F | Stephenson National Bank & Trust | 503 | 0,00 | 95 | -5,05 | ||||
| 2026-02-18 | 13F | EP Wealth Advisors, Inc. | 3.352 | 40,13 | 666 | 58,57 | ||||
| 2026-02-09 | 13F | Quest Partners LLC | 5.866 | -1,66 | 1.166 | -3,80 | ||||
| 2026-02-05 | 13F | Applied Finance Capital Management, LLC | 1.584 | -21,12 | 315 | -22,85 | ||||
| 2026-04-06 | 13F | GAMMA Investing LLC | 2.597 | 9,30 | 490 | 3,81 | ||||
| 2026-04-23 | 13F | Marquette Asset Management, LLC | 9 | 2 | ||||||
| 2026-02-12 | 13F | Campbell & CO Investment Adviser LLC | 0 | -100,00 | 0 | |||||
| 2026-02-10 | 13F | DiMeo Schneider & Associates, L.L.C. | 2.040 | 405 | ||||||
| 2026-04-17 | 13F | AdvisorNet Financial, Inc | 5 | 25,00 | 1 | |||||
| 2026-02-11 | 13F | Vestcor Inc | 9.996 | -28,53 | 2 | -50,00 | ||||
| 2026-02-17 | 13F | Royal Bank Of Canada | 68.380 | -77,40 | 13.588 | -77,89 | ||||
| 2026-02-20 | 13F | Sunbelt Securities, Inc. | 17 | -81,32 | 3 | -83,33 | ||||
| 2026-02-17 | 13F | Pentwater Capital Management LP | 0 | -100,00 | 0 | |||||
| 2026-04-16 | 13F | Capital Advisors, Ltd. LLC | 361 | 11.933,33 | 0 | |||||
| 2026-02-06 | 13F | HighTower Advisors, LLC | 10.978 | -1,88 | 2.182 | -3,96 | ||||
| 2026-02-13 | 13F | Wilkerson Advisory Group LLC | 314 | 62 | ||||||
| 2026-02-13 | 13F | Thornburg Investment Management Inc | 63.760 | -0,66 | 12.670 | -2,77 | ||||
| 2026-04-10 | 13F | Country Trust Bank | 21 | 0,00 | 4 | -25,00 | ||||
| 2026-04-24 | 13F | Strs Ohio | 2.083 | -0,19 | 393 | -5,07 | ||||
| 2026-02-17 | 13F | Optiver Holding B.V. | 2 | -98,68 | 0 | -100,00 | ||||
| 2026-02-17 | 13F | Cambria Investment Management, L.P. | 46.173 | -37,51 | 9.175 | -38,84 | ||||
| 2026-01-20 | 13F | Trust Investment Advisors | 0 | -100,00 | 0 | -100,00 | ||||
| 2026-02-20 | 13F | Kovitz Investment Group Partners, LLC | 2.215 | -45,56 | 440 | -46,73 | ||||
| 2026-02-09 | 13F | Kestra Investment Management, LLC | 15.899 | 11,12 | 3.159 | 8,74 | ||||
| 2026-02-17 | 13F | Eminence Capital, Lp | 613.961 | -44,66 | 122.006 | -45,84 | ||||
| 2026-02-17 | 13F | Fred Alger Management, Llc | 148.117 | 51,75 | 29.434 | 48,52 | ||||
| 2025-11-12 | 13F | Headlands Technologies LLC | 0 | -100,00 | 0 | |||||
| 2026-02-13 | 13F | Greenline Wealth Management LLC | 33 | 7 | ||||||
| 2026-02-17 | 13F | T. Rowe Price Investment Management, Inc. | 90.183 | -12,20 | 18 | -15,00 | ||||
| 2026-02-06 | 13F | EverSource Wealth Advisors, LLC | 2.533 | 25,40 | 503 | 22,68 | ||||
| 2026-02-17 | 13F | Delaware Management Holdings, Inc. | 17.659 | 3.509 | ||||||
| 2026-04-27 | 13F | Qrg Capital Management, Inc. | 10.011 | 22,06 | 1.889 | 15,96 | ||||
| 2026-02-17 | 13F | Aster Capital Management (DIFC) Ltd | 0 | -100,00 | 0 | |||||
| 2026-01-12 | 13F | CVA Family Office, LLC | 4 | 0,00 | 1 | |||||
| 2026-02-13 | 13F | Ieq Capital, Llc | 134.026 | 27,01 | 26.634 | 24,30 | ||||
| 2026-04-13 | 13F | Creative Financial Designs Inc /adv | 1 | 0,00 | 0 | |||||
| 2026-04-14 | 13F | Nbc Securities, Inc. | 21 | -4,55 | 4 | -25,00 | ||||
| 2026-02-09 | 13F | Blue Bell Private Wealth Management, Llc | 3 | -81,25 | 1 | -100,00 | ||||
| 2026-04-23 | 13F | SJS Investment Consulting Inc. | 188 | -25,69 | 35 | -30,00 | ||||
| 2026-04-22 | 13F | Spire Wealth Management | 86 | -34,85 | 16 | -38,46 | ||||
| 2026-04-07 | 13F | Signaturefd, Llc | 828 | 3,76 | 156 | -1,27 | ||||
| 2026-03-12 | 13F/A | Peak6 Llc | Put | 6.300 | -89,39 | 1.252 | -89,63 | |||
| 2026-02-13 | 13F | Brant Point Investment Management Llc | Put | 500 | -98,75 | 9.936 | 22,35 | |||
| 2026-02-17 | 13F | Watershed Asset Management, L.L.C. | 2.247 | 447 | ||||||
| 2026-02-17 | 13F | Iron Triangle Partners LP | 0 | -100,00 | 0 | |||||
| 2026-04-14 | 13F | Zrc Wealth Management, Llc | 43 | 4,88 | 8 | 0,00 | ||||
| 2026-02-17 | 13F | Parkman Healthcare Partners LLC | 60.514 | -18,59 | 12.025 | -20,32 | ||||
| 2026-02-12 | 13F | CIBC Private Wealth Group, LLC | 368 | -28,27 | 73 | -29,81 | ||||
| 2026-04-21 | 13F | Moseley Investment Management Inc | 2.211 | 0,00 | 417 | -5,01 | ||||
| 2025-11-14 | 13F | Binnacle Investments Inc | 13 | 62,50 | 3 | 100,00 | ||||
| 2026-01-29 | 13F | State Of Michigan Retirement System | 20.793 | -0,95 | 4.132 | -3,07 | ||||
| 2026-02-13 | 13F | State Street Corp | 2.693.391 | -1,42 | 535.231 | -3,52 | ||||
| 2026-04-23 | 13F | waypoint wealth counsel | 1.340 | -36,28 | 253 | -39,57 | ||||
| 2026-03-12 | 13F/A | Peak6 Llc | Call | 63.700 | -16,29 | 12.658 | -18,08 | |||
| 2026-01-29 | 13F | Teachers Retirement System Of The State Of Kentucky | 27.733 | -1,77 | 6 | 0,00 | ||||
| 2025-11-06 | 13F | Illinois Municipal Retirement Fund | 0 | -100,00 | 0 | |||||
| 2026-02-03 | 13F/A | Bank Of America Corp /de/ | Put | 0 | -100,00 | 0 | -100,00 | |||
| 2026-02-03 | 13F/A | Bank Of America Corp /de/ | Call | 0 | -100,00 | 0 | -100,00 | |||
| 2026-04-27 | 13F | Evolution Wealth Management Inc. | 30 | 0,00 | 6 | 0,00 | ||||
| 2026-02-26 | 13F | TD Capital Management LLC | 38 | 0,00 | 8 | 0,00 | ||||
| 2026-02-17 | 13F | Bridgeway Capital Management Inc | 14.860 | 4,94 | 2.953 | 2,68 | ||||
| 2026-02-13 | 13F | Citigroup Inc | 361.188 | -2,26 | 71.775 | -4,34 | ||||
| 2026-04-16 | 13F | SG Americas Securities, LLC | 117.161 | -32,48 | 22 | -35,29 | ||||
| 2026-02-18 | 13F | GWM Advisors LLC | 17.358 | 7,99 | 3.449 | 5,70 | ||||
| 2026-02-17 | 13F | Ardsley Advisory Partners Lp | 25.000 | -28,57 | 4.968 | -30,09 | ||||
| 2026-02-13 | 13F | Great West Life Assurance Co /can/ | 53.473 | -20,71 | 11 | -23,08 | ||||
| 2026-02-18 | 13F | State of Tennessee, Treasury Department | 37.491 | 0,60 | 7.096 | -6,21 | ||||
| 2026-02-10 | 13F | Norges Bank | 1.250.473 | 248.494 | ||||||
| 2026-04-21 | 13F | Pallas Capital Advisors LLC | 4.415 | -36,01 | 833 | -39,24 | ||||
| 2026-02-12 | 13F | Skopos Labs, Inc. | 5.100 | 19,27 | 1.026 | 18,09 | ||||
| 2026-02-17 | 13F | Bamco Inc /ny/ | 3.500 | 0,00 | 696 | -2,11 | ||||
| 2026-04-17 | 13F | BAM Wealth Management, LLC | 1.399 | -17,61 | 264 | -21,66 | ||||
| 2026-02-13 | 13F | Knollwood Investment Advisory, LLC | 2.001 | 0,00 | 398 | -2,22 | ||||
| 2026-02-17 | 13F | Humankind Investments LLC | 0 | -100,00 | 0 | |||||
| 2026-02-12 | 13F | State Board Of Administration Of Florida Retirement System | 70.526 | 0,00 | 14.015 | -2,13 | ||||
| 2026-02-02 | 13F | Wolverine Asset Management Llc | 1.948 | 0,00 | 387 | -2,03 | ||||
| 2026-02-05 | 13F | Thrivent Financial For Lutherans | 61.175 | -35,22 | 12 | -36,84 | ||||
| 2026-02-04 | 13F | Advisor OS, LLC | 1.649 | 7,64 | 328 | 5,14 | ||||
| 2026-02-11 | 13F | Buckingham Strategic Partners | 8.481 | 12,05 | 1.685 | 12,71 | ||||
| 2025-10-29 | 13F | J.Safra Asset Management Corp | 0 | -100,00 | 0 | -100,00 | ||||
| 2025-11-10 | 13F | Counterpoint Mutual Funds LLC | 0 | -100,00 | 0 | -100,00 | ||||
| 2026-02-10 | 13F | Bnp Paribas Arbitrage, Sa | 228.144 | 24,58 | 45.337 | 21,93 | ||||
| 2026-02-11 | 13F | Parallel Advisors, LLC | 665 | 1,37 | 132 | -0,75 | ||||
| 2026-02-13 | 13F | Seneschal Advisors, LLC | 2 | 0,00 | 0 | |||||
| 2026-02-17 | 13F | Ameriprise Financial Inc | 1.738.959 | -5,29 | 345.568 | -7,31 | ||||
| 2026-04-20 | 13F | Jfs Wealth Advisors, Llc | 92 | 6,98 | 17 | 0,00 | ||||
| 2026-02-18 | 13F | Mackenzie Financial Corp | 30.569 | 32,97 | 6.141 | 31,58 | ||||
| 2026-04-15 | 13F | Sivik Global Healthcare LLC | 20.000 | -46,67 | 4 | -57,14 | ||||
| 2026-02-12 | 13F/A | Pinebridge Investments Llc | 13.241 | 2.631 | ||||||
| 2026-04-23 | 13F | Glass Jacobson Investment Advisors llc | 1.739 | 0,00 | 328 | -4,93 | ||||
| 2025-11-14 | 13F | PineBridge Investments, L.P. | 32.400 | -46,46 | 6.578 | -38,23 | ||||
| 2026-02-12 | 13F | BlackRock, Inc. | 8.535.892 | -0,12 | 1.696.252 | -2,24 | ||||
| 2026-02-12 | 13F | Integrated Quantitative Investments LLC | 0 | -100,00 | 0 | |||||
| 2026-02-13 | 13F | Ausdal Financial Partners, Inc. | 1.724 | 343 | ||||||
| 2025-10-29 | 13F | Yorktown Management & Research Co Inc | 0 | -100,00 | 0 | |||||
| 2026-02-10 | 13F | Hillsdale Investment Management Inc. | 27.490 | 20,57 | 5.463 | 18,00 | ||||
| 2026-01-28 | 13F | Teacher Retirement System Of Texas | 33.886 | -13,68 | 6.734 | -15,52 | ||||
| 2026-02-17 | 13F | Snowden Capital Advisors LLC | 2.361 | 11,37 | 469 | 9,07 | ||||
| 2026-04-27 | 13F | GenTrust, LLC | 1.130 | -77,74 | 213 | -78,87 | ||||
| 2025-11-14 | 13F | Kingdon Capital Management, L.l.c. | 0 | -100,00 | 0 | |||||
| 2026-02-13 | 13F | National Bank Of Canada /fi/ | 1.314 | 121,96 | 261 | 116,67 | ||||
| 2026-01-27 | 13F | Belpointe Asset Management LLC | 3.729 | 1,94 | 741 | -0,13 | ||||
| 2026-04-23 | 13F | Harbor Investment Advisory, Llc | 2 | 0 | ||||||
| 2026-01-27 | 13F | TD Waterhouse Canada Inc. | 119 | 56,58 | 24 | 53,33 | ||||
| 2026-02-11 | 13F | LPL Financial LLC | 122.609 | 58,51 | 24.365 | 55,15 | ||||
| 2026-02-06 | 13F | Handelsbanken Fonder AB | 24.418 | 12,95 | 5 | 0,00 | ||||
| 2026-02-17 | 13F | Maryland State Retirement & Pension System | 4.445 | 0,00 | 883 | -2,11 | ||||
| 2026-02-17 | 13F | Brevan Howard Capital Management LP | 6.347 | -75,15 | 1.261 | -75,68 | ||||
| 2026-04-21 | 13F | Aaron Wealth Advisors LLC | 1.670 | 10,30 | 315 | 5,00 | ||||
| 2026-02-12 | 13F | BRYN MAWR TRUST Co | 0 | -100,00 | 0 | -100,00 | ||||
| 2026-02-13 | 13F | Virtus ETF Advisers LLC | 2.267 | 175,79 | 450 | 171,08 | ||||
| 2026-02-17 | 13F | Advisor Group Holdings, Inc. | 13.513 | -12,95 | 2.685 | -9,72 | ||||
| 2026-02-09 | 13F | Jackson Creek Investment Advisors LLC | 9.032 | 235,64 | 2 | |||||
| 2026-01-29 | 13F | Quadcap Wealth Management, LLC | 3.854 | -3,04 | 766 | -5,20 | ||||
| 2026-04-07 | 13F | Farther Finance Advisors, LLC | 3.665 | 5,59 | 697 | 1,16 | ||||
| 2026-01-20 | 13F | Savvy Advisors, Inc. | 1.125 | -4,50 | 224 | -6,69 | ||||
| 2026-02-13 | 13F | Sei Investments Co | 340.422 | 23,06 | 67.647 | 20,44 | ||||
| 2026-02-14 | 13F | American Trust | 1.063 | 2,11 | 211 | 0,00 | ||||
| 2026-01-23 | 13F | Gibbs Wealth Management | 3.564 | -21,96 | 717 | -22,65 | ||||
| 2026-02-12 | 13F | New York State Common Retirement Fund | 35.720 | -6,08 | 7.098 | -8,08 | ||||
| 2026-02-11 | 13F | Inceptionr Llc | 3.170 | -1,18 | 630 | -3,38 | ||||
| 2026-02-03 | 13F | Sequoia Financial Advisors, LLC | 1.355 | 6,19 | 269 | 3,86 | ||||
| 2026-02-17 | 13F | Lone Pine Capital Llc | 1.787.326 | 355.177 | ||||||
| 2026-01-27 | 13F | First Horizon Corp | 112 | 27,27 | 22 | 29,41 | ||||
| 2026-02-13 | 13F | Rafferty Asset Management, LLC | 1.477 | -3,21 | 294 | -5,18 | ||||
| 2026-02-11 | 13F | Rise Advisors, LLC | 0 | -100,00 | 0 | |||||
| 2026-04-23 | 13F | Private Wealth Management Group, LLC | 57 | 0,00 | 11 | -9,09 | ||||
| 2026-02-12 | 13F | Federated Hermes, Inc. | 7.733 | -2,01 | 1.537 | -4,12 | ||||
| 2026-04-20 | 13F | Assenagon Asset Management S.A. | 123.501 | 96,63 | 23.306 | 86,72 | ||||
| 2026-02-11 | 13F | CenterBook Partners LP | 1.676 | 333 | ||||||
| 2026-02-09 | 13F | Smithfield Trust Co | 85 | 0,00 | 0 | |||||
| 2026-02-17 | 13F | Cetera Investment Advisers | 46.680 | 48,50 | 9.276 | 45,35 | ||||
| 2026-02-13 | 13F | Financial Network Wealth Advisors LLC | 283 | -12,11 | 56 | -13,85 | ||||
| 2026-02-10 | 13F | Rothschild Investment Llc | 1.784 | 11,01 | 355 | 8,59 | ||||
| 2026-02-05 | 13F | Wakefield Asset Management LLLP | 20.868 | -1,30 | 4.147 | -3,40 | ||||
| 2026-01-28 | 13F | Klp Kapitalforvaltning As | 22.300 | -0,89 | 4.431 | -3,00 | ||||
| 2026-02-13 | 13F | Wells Fargo & Company/mn | 256.484 | 6,54 | 50.969 | 4,27 | ||||
| 2026-02-13 | 13F | Walleye Trading LLC | 0 | -100,00 | 0 | -100,00 | ||||
| 2026-02-17 | 13F | Polymer Capital Management (US) LLC | 2.710 | 539 | ||||||
| 2026-01-21 | 13F | Portside Wealth Group, LLC | 5.965 | -8,39 | 1.185 | -10,30 | ||||
| 2026-01-23 | 13F | Diversify Advisory Services, LLC | 1.227 | -7,88 | 241 | -10,07 | ||||
| 2026-01-27 | 13F | Zurcher Kantonalbank (Zurich Cantonalbank) | 28.355 | 8,40 | 5.635 | 6,10 | ||||
| 2026-01-28 | 13F | Legacy Capital Group California, Inc. | 9.733 | 18,68 | 1.934 | 16,16 | ||||
| 2026-02-12 | 13F | Sit Investment Associates Inc | 0 | -100,00 | 0 | |||||
| 2025-11-14 | 13F | Point72 Hong Kong Ltd | 14.200 | -65,75 | 2.883 | -60,49 | ||||
| 2026-02-17 | 13F | Dark Forest Capital Management Lp | 21.865 | 85,31 | 4.345 | 81,42 | ||||
| 2026-02-17 | 13F | Gotham Asset Management, LLC | 109.667 | 240,94 | 21.793 | 233,74 | ||||
| 2026-02-17 | 13F | Aquatic Capital Management LLC | 0 | -100,00 | 0 | |||||
| 2026-02-06 | 13F | Cullen/frost Bankers, Inc. | 559 | 1,08 | 111 | -0,89 | ||||
| 2026-04-02 | 13F | Somerset Trust Co | 2.421 | 0,04 | 457 | -5,00 | ||||
| 2026-02-03 | 13F | Kestrel Investment Management Corp | 27.475 | -3,85 | 5 | 0,00 | ||||
| 2026-02-03 | 13F | Premier Fund Managers Ltd | 0 | -100,00 | 0 | |||||
| 2025-11-13 | 13F | Hsbc Holdings Plc | Put | 0 | -100,00 | 0 | -100,00 | |||
| 2026-04-15 | 13F | Financial Management Professionals, Inc. | 9 | 0,00 | 2 | 0,00 | ||||
| 2026-02-10 | 13F | Dynasty Wealth Management, Llc | 2.026 | 403 | ||||||
| 2026-04-08 | 13F | Oliver Luxxe Assets LLC | 5.174 | -14,04 | 976 | -18,39 | ||||
| 2026-02-17 | 13F | Wiley Bros.-aintree Capital, Llc | 10.692 | 1,83 | 2.125 | -0,33 | ||||
| 2026-04-23 | 13F | iA Global Asset Management Inc. | 60 | 0,00 | 0 | |||||
| 2026-04-17 | 13F | Signal Advisors Wealth, LLC | 2.254 | 11,92 | 425 | 6,25 | ||||
| 2026-02-06 | 13F | Tortoise Investment Management, LLC | 0 | -100,00 | 0 | |||||
| 2026-02-10 | 13F | Savant Capital, LLC | 3.846 | 0,73 | 764 | -1,42 | ||||
| 2026-02-17 | 13F | Algert Global Llc | 91.107 | 80,84 | 18 | 80,00 | ||||
| 2026-02-02 | 13F | B.O.S.S. Retirement Advisors, LLC | 3.186 | -57,47 | 633 | 28,40 | ||||
| 2026-01-16 | 13F | Standard Life Aberdeen plc | 37.237 | 0,00 | 7.400 | -1,24 | ||||
| 2026-04-20 | 13F | State of Alaska, Department of Revenue | 33.799 | 0,04 | 6 | 0,00 | ||||
| 2025-11-04 | 13F | Raleigh Capital Management Inc. | 0 | -100,00 | 0 | |||||
| 2026-01-30 | 13F | State of New Jersey Common Pension Fund D | 29.385 | -8,67 | 5.839 | -10,61 | ||||
| 2026-02-05 | 13F | Cambridge Investment Research Advisors, Inc. | 5.814 | -2,56 | 1 | 0,00 | ||||
| 2026-02-11 | 13F | O'shaughnessy Asset Management, Llc | 37.878 | -7,92 | 7.527 | -9,88 | ||||
| 2026-02-11 | 13F | Capital Analysts, Inc. | 111 | -4,31 | 0 | |||||
| 2025-11-14 | 13F | Point72 Europe (London) LLP | 962 | 195 | ||||||
| 2026-04-22 | 13F | Parcion Private Wealth LLC | 1.417 | -27,22 | 267 | -30,83 | ||||
| 2026-01-30 | 13F | Sage Rhino Capital Llc | 1.288 | 0,47 | 256 | -1,92 | ||||
| 2026-02-11 | 13F | Erste Asset Management GmbH | 0 | 0 | ||||||
| 2026-02-19 | 13F/A | Axxcess Wealth Management, Llc | 1.787 | 355 | ||||||
| 2026-02-17 | 13F/A | Sentinus, LLC | 1.590 | 316 | ||||||
| 2026-02-12 | 13F | Cloud Capital Management, LLC | 0 | -100,00 | 0 | |||||
| 2026-02-13 | 13F | Arete Wealth Advisors, LLC | 2.212 | 9,94 | 0 | |||||
| 2026-02-12 | 13F | Alps Advisors Inc | 2.386 | 1,10 | 474 | -1,04 | ||||
| 2026-02-17 | 13F | Banco Bilbao Vizcaya Argentaria, S.a. | 0 | -100,00 | 0 | |||||
| 2026-02-13 | 13F | Storgate, LLC | 2.507 | 498 | ||||||
| 2026-01-21 | 13F | Newbridge Financial Services Group, Inc. | 0 | -100,00 | 0 | |||||
| 2025-11-14 | 13F | Bayesian Capital Management, LP | 0 | -100,00 | 0 | |||||
| 2026-02-17 | 13F | Tower Research Capital LLC (TRC) | 3.740 | -51,07 | 743 | -52,13 | ||||
| 2026-01-16 | 13F | Crewe Advisors LLC | 128 | 11,30 | 25 | 8,70 | ||||
| 2026-04-23 | 13F | Oppenheimer Asset Management Inc. | 38.859 | -14,78 | 7.333 | -19,07 | ||||
| 2026-02-17 | 13F | Credit Agricole S A | 6.759 | 0,00 | 1.343 | -2,11 | ||||
| 2026-02-23 | 13F | Mv Capital Management, Inc. | 6 | 0,00 | 1 | 0,00 | ||||
| 2026-01-28 | 13F | Universal- Beteiligungs- und Servicegesellschaft mbH | 54.527 | -16,18 | 10.863 | -17,76 | ||||
| 2026-02-17 | 13F | NorthRock Partners, LLC | 0 | -100,00 | 0 | |||||
| 2025-11-14 | 13F | AXA Investment Managers S.A. | 123.957 | 25.168 | ||||||
| 2026-04-13 | 13F | IFP Advisors, Inc | 2.128 | -17,36 | 402 | -21,53 | ||||
| 2026-02-09 | 13F | Geode Capital Management, Llc | 1.723.563 | -3,06 | 342.575 | -5,12 | ||||
| 2026-02-17 | 13F | Weiss Asset Management LP | 41.085 | 1.874,29 | 8.164 | 1.834,60 | ||||
| 2026-02-17 | 13F | Bank Of America Corp /de/ | 1.198.072 | 11,08 | 238.081 | 8,71 | ||||
| 2026-02-26 | 13F/A | Alpine Global Management, LLC | Put | 120 | -62,50 | 8 | ||||
| 2025-11-05 | 13F | Optimize Financial Inc | 0 | -100,00 | 0 | -100,00 | ||||
| 2026-02-17 | 13F | Utah Retirement Systems | 4.641 | 0,00 | 922 | -2,12 | ||||
| 2026-02-11 | 13F | Franklin Resources Inc | 270.761 | -5,13 | 53.806 | -7,15 | ||||
| 2025-11-14 | 13F | Maverick Capital Ltd | 0 | -100,00 | 0 | |||||
| 2026-02-12 | 13F | Distillate Capital Partners LLC | 88.915 | 17.669 | ||||||
| 2026-02-17 | 13F | Mercer Global Advisors Inc /adv | 42.180 | 24,40 | 8.382 | 21,76 | ||||
| 2026-04-20 | 13F | William B. Walkup & Associates, Inc. | 0 | -100,00 | 0 | |||||
| 2026-02-11 | 13F | Fox Run Management, L.l.c. | 0 | -100,00 | 0 | |||||
| 2026-04-22 | 13F | Spirepoint Private Client, Llc | 2.120 | 37,66 | 400 | 30,72 | ||||
| 2026-02-17 | 13F | Bellevue Group AG | 40.239 | -0,33 | 7.996 | -2,45 | ||||
| 2026-04-07 | 13F | Retirement Wealth Solutions LLC | 22 | -4,35 | 4 | 0,00 | ||||
| 2026-02-11 | 13F | Simplex Trading, Llc | Call | 21.500 | -37,13 | 4.272 | 71.100,00 | |||
| 2026-02-13 | 13F | MorganRosel Wealth Management, LLC | 7.469 | 1.484 | ||||||
| 2026-02-11 | 13F | Simplex Trading, Llc | Put | 40.600 | -38,86 | 8.068 | 61.961,54 | |||
| 2026-02-11 | 13F | Simplex Trading, Llc | 289 | -96,34 | 57 | 5.600,00 | ||||
| 2026-04-15 | 13F | Journey Strategic Wealth Llc | 1.778 | -2,89 | 336 | -7,71 | ||||
| 2026-03-06 | 13F | Hsbc Holdings Plc | Call | 0 | -100,00 | 0 | ||||
| 2026-04-27 | 13F | HB Wealth Management, LLC | 2.227 | 7,79 | 420 | 2,44 | ||||
| 2026-02-17 | 13F | Integral Health Asset Management, LLC | 0 | -100,00 | 0 | -100,00 | ||||
| 2026-02-17 | 13F | ExodusPoint Capital Management, LP | 0 | -100,00 | 0 | -100,00 | ||||
| 2026-01-30 | 13F | Citizens Financial Group Inc/ri | 1.055 | 210 | ||||||
| 2026-02-13 | 13F | Public Employees Retirement Association Of Colorado | 96.913 | 957,66 | 19 | 1.800,00 | ||||
| 2026-02-17 | 13F | Trexquant Investment LP | 3.342 | -75,19 | 664 | -75,71 | ||||
| 2026-02-13 | 13F | JustInvest LLC | 11.326 | 1,90 | 2.251 | -0,27 | ||||
| 2026-04-14 | 13F | USA Financial Portformulas Corp | 2 | -99,75 | 0 | -100,00 | ||||
| 2026-02-13 | 13F | General American Investors Co Inc | 30.000 | -67,25 | 5.962 | -67,95 | ||||
| 2026-02-13 | 13F | General American Investors Co Inc | Put | 30.000 | 0,00 | 5.850 | 5,41 | |||
| 2026-04-06 | 13F | CX Institutional | 141 | 0 | ||||||
| 2025-11-14 | 13F | Full Sail Capital, LLC | 1.589 | 323 | ||||||
| 2026-02-10 | 13F | State of Wyoming | 3.502 | -11,72 | 696 | -13,66 | ||||
| 2026-02-17 | 13F | Guggenheim Capital Llc | 4.905 | 27,67 | 975 | 24,87 | ||||
| 2026-04-15 | 13F | Fortitude Family Office, LLC | 73 | 128,12 | 14 | 116,67 | ||||
| 2026-04-24 | 13F | Yousif Capital Management, Llc | 22.743 | -5,14 | 4.292 | -7,38 | ||||
| 2025-11-14 | 13F | WealthTrak Capital Management LLC | 0 | -100,00 | 0 | |||||
| 2026-04-08 | 13F | Arlington Trust Co LLC | 5 | 1 | ||||||
| 2026-02-17 | 13F | Css Llc/il | 6.790 | 12,98 | 1.349 | 10,57 | ||||
| 2026-04-21 | 13F | Wallace Advisory Group, LLC | 1.100 | -13,73 | 208 | -18,18 | ||||
| 2026-02-09 | 13F/A | Swedbank AB | 146.133 | 14,72 | 29.040 | 12,28 | ||||
| 2026-02-13 | 13F | Advyzon Investment Management, LLC | 1.464 | 291 | ||||||
| 2026-02-17 | 13F | Woodline Partners LP | 0 | -100,00 | 0 | |||||
| 2026-02-12 | 13F | Chilton Capital Management Llc | 53 | 0,00 | 11 | 0,00 | ||||
| 2026-02-17 | 13F | Captrust Financial Advisors | 12.155 | 14,68 | 2.415 | 12,27 | ||||
| 2026-02-12 | 13F | Soleus Capital Management, L.P. | 92.500 | 18.382 | ||||||
| 2026-02-17 | 13F | Rock Springs Capital Management LP | 125.000 | 0,00 | 24.840 | -2,13 | ||||
| 2026-02-13 | 13F | Verition Fund Management LLC | Call | 25.000 | -14,97 | 4.968 | -16,77 | |||
| 2026-04-15 | 13F | Activest Wealth Management | 3 | -97,73 | 1 | -100,00 | ||||
| 2026-04-20 | 13F | LVW Advisors, LLC | 1.496 | 8,33 | 282 | 2,92 | ||||
| 2026-02-13 | 13F | Verition Fund Management LLC | 52.610 | 52,67 | 10.455 | 49,43 | ||||
| 2025-11-06 | 13F | Wealthstream Advisors, Inc. | 0 | -100,00 | 0 | |||||
| 2026-04-24 | 13F | Kendall Capital Management | 3.955 | -2,47 | 746 | -7,33 | ||||
| 2025-11-14 | 13F | Point72 (DIFC) Ltd | 1.389 | 282 | ||||||
| 2026-02-13 | 13F | Verition Fund Management LLC | Put | 71.100 | 24,30 | 14.129 | 21,66 | |||
| 2026-04-24 | 13F | Profund Advisors Llc | 2.197 | 11,92 | 415 | 6,15 | ||||
| 2026-01-05 | 13F | GK Wealth Management LLC | 0 | -100,00 | 0 | |||||
| 2026-02-13 | 13F | Bridgewater Associates, LP | 29.337 | -2,18 | 5.830 | -4,27 | ||||
| 2026-02-12 | 13F | Voya Investment Management Llc | 98.992 | -6,85 | 19.672 | -8,83 | ||||
| 2026-01-26 | 13F | MOKAN Wealth Management Inc. | 1.198 | 239 | ||||||
| 2026-02-10 | 13F | Bank of New York Mellon Corp | 646.397 | -10,28 | 128.452 | -12,19 | ||||
| 2026-02-11 | 13F | Zions Bancorporation, National Association /ut/ | 1.283 | -7,76 | 255 | -9,93 | ||||
| 2026-02-17 | 13F | Tudor Investment Corp Et Al | 0 | -100,00 | 0 | -100,00 | ||||
| 2026-02-17 | 13F | Freestone Grove Partners LP | 0 | -100,00 | 0 | |||||
| 2026-02-13 | 13F | Schroder Investment Management Group | 41.582 | 2,68 | 8.370 | 2,74 | ||||
| 2026-02-02 | 13F | Danske Bank A/s | 800 | -91,03 | 159 | -91,27 | ||||
| 2026-02-09 | 13F | Atlantic Trust, LLC | 38 | 0,00 | 8 | 0,00 | ||||
| 2026-02-17 | 13F | Lazard Asset Management Llc | 150.126 | 1,90 | 29.833 | -0,27 | ||||
| 2026-02-17 | 13F | Price T Rowe Associates Inc /md/ | 7.490.350 | 1,63 | 1.488 | -0,53 | ||||
| 2026-02-14 | 13F | Whipplewood Advisors, LLC | 11 | 2 | ||||||
| 2025-11-04 | 13F | Guerra Advisors Inc | 273 | 55 | ||||||
| 2025-11-13 | 13F | Riggs Asset Managment Co. Inc. | 0 | -100,00 | 0 | |||||
| 2026-04-15 | 13F | Valley National Advisers Inc | 750 | 0 | ||||||
| 2026-04-13 | 13F | True Wealth Design, LLC | 559 | -9,40 | 105 | -13,93 | ||||
| 2026-02-12 | 13F | Ensign Peak Advisors, Inc | 4.977 | -67,42 | 989 | -68,11 | ||||
| 2026-01-16 | 13F | Trust Co Of Vermont | 200 | 0,00 | 40 | -2,50 | ||||
| 2026-02-13 | 13F | Transamerica Financial Advisors, Inc. | 27.703 | 5.505 | ||||||
| 2026-02-18 | 13F | CTC Alternative Strategies, Ltd. | 0 | -100,00 | 0 | |||||
| 2026-02-13 | 13F | Cynosure Management, Llc | 2.253 | -18,69 | 448 | -20,46 | ||||
| 2025-11-03 | 13F | LRI Investments, LLC | 0 | -100,00 | 0 | |||||
| 2026-02-06 | 13F | Lsv Asset Management | 187.800 | -17,96 | 37 | -19,57 | ||||
| 2026-02-13 | 13F | Colony Group, LLC | 16.249 | 39,31 | 3.229 | 36,32 | ||||
| 2026-01-28 | 13F | DekaBank Deutsche Girozentrale | 3.083 | 0,00 | 0 | |||||
| 2026-03-10 | 13F | PeakShares LLC | 1.639 | 326 | ||||||
| 2026-02-11 | 13F | Ameritas Investment Partners, Inc. | 25.862 | 5.139 | ||||||
| 2026-02-17 | 13F | Twinbeech Capital Lp | 66.900 | 13.294 | ||||||
| 2026-02-06 | 13F | Saranac Partners Ltd | 2.463 | 0,00 | 489 | -2,20 | ||||
| 2026-02-05 | 13F | Qsemble Capital Management, LP | 2.300 | -80,43 | 457 | -80,85 | ||||
| 2025-11-14 | 13F | ArrowMark Colorado Holdings LLC | 0 | -100,00 | 0 | |||||
| 2026-02-13 | 13F | Smartleaf Asset Management LLC | 1.352 | 149,45 | 272 | 149,54 | ||||
| 2026-02-24 | 13F/A | Pacer Advisors, Inc. | 430.060 | -20,11 | 85.462 | -21,81 | ||||
| 2026-01-28 | 13F | N.E.W. Advisory Services LLC | 227 | 0,00 | 45 | -2,17 | ||||
| 2026-02-03 | 13F | Crestwood Advisors Group LLC | 2.952 | 13,28 | 587 | 10,78 | ||||
| 2026-02-17 | 13F | Jain Global LLC | 0 | -100,00 | 0 | |||||
| 2026-02-17 | 13F | Strive Financial Group ,LLC | 14 | 3 | ||||||
| 2026-02-17 | 13F | Quadrature Capital Ltd | 0 | -100,00 | 0 | |||||
| 2026-02-17 | 13F | Jones Financial Companies Lllp | 1.674 | 2,89 | 333 | 1,22 | ||||
| 2026-02-11 | 13F | Cerity Partners LLC | 156.141 | 8,37 | 31.028 | 6,06 | ||||
| 2026-02-06 | 13F | Mach-1 Financial Group, Inc. | 3.244 | 645 | ||||||
| 2025-11-14 | 13F | Eqis Capital Management, Inc. | 0 | -100,00 | 0 | |||||
| 2026-02-17 | 13F | Cresset Asset Management, LLC | 2.525 | -6,41 | 502 | -8,41 | ||||
| 2026-02-10 | 13F | Td Asset Management Inc | 126.882 | 4,21 | 25.214 | 1,99 | ||||
| 2026-02-11 | 13F | Los Angeles Capital Management Llc | 9.112 | -0,51 | 1.901 | 2,21 | ||||
| 2026-02-10 | 13F | Commonwealth Of Pennsylvania Public School Empls Retrmt Sys | 21.992 | -3,01 | 4.370 | -5,06 | ||||
| 2026-04-21 | 13F | Pinnacle Wealth Management Advisory Group, LLC | 0 | -100,00 | 0 | |||||
| 2026-01-30 | 13F | Wealthfront Advisers Llc | 0 | -100,00 | 0 | |||||
| 2026-02-04 | 13F | Ameritas Advisory Services, LLC | 0 | -100,00 | 0 | |||||
| 2026-04-24 | 13F | Gilliland Jeter Wealth Management LLC | 4.932 | 0,00 | 931 | -5,10 | ||||
| 2026-04-17 | 13F | Andina Capital Management, LLC | 0 | -100,00 | 0 | |||||
| 2026-01-27 | 13F | Asset Management One Co., Ltd. | 1.374 | -24,05 | 276 | -24,80 | ||||
| 2026-01-23 | 13F | Westside Investment Management, Inc. | 216 | 12,50 | 43 | 13,16 | ||||
| 2026-01-29 | 13F | IMC-Chicago, LLC | Put | 100.600 | 5,56 | 19.991 | 3,32 | |||
| 2026-02-02 | 13F | Sachetta, LLC | 8 | 0,00 | 2 | 0,00 | ||||
| 2026-01-29 | 13F | IMC-Chicago, LLC | Call | 109.500 | -6,97 | 21.760 | -8,95 | |||
| 2026-01-28 | 13F | Chicago Partners Investment Group LLC | 2.908 | -1,42 | 549 | -9,12 | ||||
| 2026-02-11 | 13F | Allianz Asset Management GmbH | 868.134 | 78,08 | 172.516 | 74,29 | ||||
| 2026-02-13 | 13F/A | Ontario Teachers Pension Plan Board | 0 | -100,00 | 0 | |||||
| 2026-02-17 | 13F | Two Sigma Investments, Lp | 189.930 | 185,31 | 37.743 | 179,24 | ||||
| 2026-02-04 | 13F | First Eagle Investment Management, LLC | 6.433 | -14,60 | 1.278 | -16,42 | ||||
| 2026-02-17 | 13F | Jump Financial, LLC | 2.922 | -23,06 | 581 | -24,77 | ||||
| 2026-04-13 | 13F | Mather Group, Llc. | 23 | 4 | ||||||
| 2026-02-02 | 13F | Winslow Asset Management Inc | 119.774 | -0,91 | 24 | -4,17 | ||||
| 2026-02-13 | 13F | Cozad Asset Management Inc | 6.123 | 0,84 | 1.217 | -1,30 | ||||
| 2026-02-17 | 13F | Point72 Asset Management, L.P. | Call | 47.900 | 4.254,55 | 9.519 | 4.168,16 | |||
| 2026-02-17 | 13F | Point72 Asset Management, L.P. | Put | 28.400 | 3.055,56 | 5.644 | 3.000,55 | |||
| 2026-02-17 | 13F | Point72 Asset Management, L.P. | 84.667 | -82,13 | 16.825 | -82,51 | ||||
| 2026-02-13 | 13F | Parkside Financial Bank & Trust | 222 | 18,09 | 44 | 15,79 | ||||
| 2026-04-21 | 13F | One Wealth Advisors, LLC | 0 | -100,00 | 0 | |||||
| 2026-02-05 | 13F | Baader Bank INC | 2.567 | 497 | ||||||
| 2026-02-13 | 13F | Cornerstone Financial Management LLC | 5 | 1 | ||||||
| 2026-04-27 | 13F | GDS Wealth Management | 87.635 | 6,74 | 16.538 | 1,36 | ||||
| 2026-02-12 | 13F | Tiemann Investment Advisors, Llc | 1.230 | 244 | ||||||
| 2026-02-13 | 13F | Kestra Advisory Services, LLC | 0 | -100,00 | 0 | |||||
| 2026-02-05 | 13F | North Dakota State Investment Board | 3.066 | 609 | ||||||
| 2026-01-26 | 13F | Reyes Financial Architecture, Inc. | 414 | 82 | ||||||
| 2026-01-29 | 13F | Dunhill Financial, LLC | 2 | 0 | ||||||
| 2026-02-17 | 13F | Man Group plc | 71.005 | 313,16 | 14.110 | 304,41 | ||||
| 2026-02-17 | 13F | CastleKnight Management LP | 50.800 | -31,07 | 10.095 | -32,54 | ||||
| 2026-02-11 | 13F | GW&K Investment Management, LLC | 92 | 0 | ||||||
| 2025-11-12 | 13F | CIBC Bancorp USA Inc. | 5.281 | 1.072 | ||||||
| 2026-02-17 | 13F | CastleKnight Management LP | Call | 30.000 | -82,35 | 5.962 | -82,73 | |||
| 2026-02-05 | 13F | Financial Strategies Group, Inc. | 3.930 | 7,64 | 818 | 11,29 | ||||
| 2026-02-18 | 13F/A | Empowered Funds, LLC | 233.204 | 11,83 | 46.342 | 9,45 | ||||
| 2026-04-17 | 13F | Stonehearth Capital Management, LLC | 1.297 | 245 | ||||||
| 2026-02-13 | 13F | Healthcare Of Ontario Pension Plan Trust Fund | 20.077 | 0,00 | 3.990 | -2,13 | ||||
| 2026-02-17 | 13F | Public Employees Retirement System Of Ohio | 31.355 | 2,90 | 6.231 | 0,71 | ||||
| 2026-02-13 | 13F | Toroso Investments, LLC | 21.801 | 13,48 | 4.332 | 11,08 | ||||
| 2026-04-10 | 13F | PFW Advisors LLC | 0 | -100,00 | 0 | |||||
| 2026-04-27 | 13F | Sound Income Strategies, LLC | 100 | 0,00 | 19 | 0,00 | ||||
| 2026-02-13 | 13F | Rhenman & Partners Asset Management AB | 76.504 | 30,93 | 15.203 | 28,15 | ||||
| 2026-02-13 | 13F | Neuberger Berman Group LLC | 25.223 | -22,68 | 5.012 | -24,32 | ||||
| 2025-11-10 | 13F | Axq Capital, Lp | 0 | -100,00 | 0 | -100,00 | ||||
| 2026-02-04 | 13F | Securian Asset Management, Inc | 6.405 | -3,20 | 1.273 | -5,29 | ||||
| 2026-02-13 | 13F | Integrated Wealth Concepts LLC | 2.941 | -16,07 | 584 | -17,86 | ||||
| 2026-04-23 | 13F | Vista Investment Partners Ii, Llc | 14.729 | -1,01 | 2.780 | -5,99 | ||||
| 2026-02-12 | 13F | Xponance, Inc. | 8.317 | -16,84 | 1.653 | -18,62 | ||||
| 2026-02-17 | 13F | Citadel Advisors Llc | 35.243 | -96,66 | 7.003 | -96,73 | ||||
| 2026-02-17 | 13F | Citadel Advisors Llc | Call | 112.200 | -37,67 | 22.296 | -38,99 | |||
| 2026-02-17 | 13F | Meridiem Capital Partners LP | 25.851 | 5.137 | ||||||
| 2026-04-27 | 13F | Ethic Inc. | 6.428 | 189,55 | 1.213 | 174,83 | ||||
| 2026-02-17 | 13F | Citadel Advisors Llc | Put | 166.200 | -33,89 | 33.027 | -35,30 | |||
| 2026-02-09 | 13F | New Age Alpha Advisors, LLC | 17.130 | -57,19 | 3.404 | -58,09 | ||||
| 2026-02-13 | 13F | Ubs Asset Management Americas Inc | 221.260 | -3,17 | 43.969 | -5,23 | ||||
| 2026-04-13 | 13F | Salem Investment Counselors Inc | 200 | 38 | ||||||
| 2026-02-11 | 13F | Symphony Financial, Ltd. Co. | 1.019 | 204 | ||||||
| 2026-02-13 | 13F | Entropy Technologies, LP | 0 | -100,00 | 0 | |||||
| 2026-02-17 | 13F | Redwood Investment Management, Llc | 5.497 | -6,31 | 1 | 0,00 | ||||
| 2026-02-17 | 13F | Khrom Capital Management Llc | 504.279 | 0,00 | 100.210 | -2,13 | ||||
| 2026-04-17 | 13F | Baker Ellis Asset Management LLC | 2.000 | 0,00 | 377 | -5,04 | ||||
| 2026-04-24 | 13F | Heritage Investors Management Corp | 1.800 | 0,00 | 0 | |||||
| 2026-01-26 | 13F | Mirae Asset Global Investments Co., Ltd. | 640 | 127 | ||||||
| 2026-01-27 | 13F | Brighton Jones Llc | 0 | -100,00 | 0 | |||||
| 2026-02-17 | 13F | Capital Fund Management S.a. | Put | 15.300 | -61,36 | 3.040 | -62,19 | |||
| 2026-02-17 | 13F | Capital Fund Management S.a. | Call | 17.900 | -64,83 | 3.557 | -65,58 | |||
| 2026-01-29 | 13F | Live Oak Investment Partners | 7.967 | -6,85 | 1.583 | -8,81 | ||||
| 2026-02-13 | 13F | Sirios Capital Management L P | 49.051 | -31,46 | 9.747 | -32,92 | ||||
| 2026-02-17 | 13F | Creative Planning | 28.986 | 17,59 | 5.760 | 15,08 | ||||
| 2026-02-23 | 13F | Kera Capital Partners, Inc. | 1.323 | -13,36 | 250 | -19,35 | ||||
| 2026-04-17 | 13F | Kaufman Rossin Wealth, LLC | 0 | -100,00 | 0 | |||||
| 2026-02-05 | 13F | Allworth Financial LP | 13.481 | -17,92 | 2.679 | -19,68 | ||||
| 2026-02-05 | 13F | Allworth Financial LP | Put | 835 | -12,58 | |||||
| 2026-01-29 | 13F | Vanguard Group Inc | 8.856.018 | -1,70 | 1.759.868 | -3,80 | ||||
| 2026-02-17 | 13F | Laird Norton Trust Company, Llc | 1.147 | 228 | ||||||
| 2026-03-25 | 13F/A | Barclays Plc | Call | 0 | -100,00 | 0 | -100,00 | |||
| 2026-04-16 | 13F | Evolve Private Wealth, Llc | 7.430 | -8,18 | 1.402 | -12,81 | ||||
| 2026-02-13 | 13F | Inspire Advisors, LLC | 0 | -100,00 | 0 | |||||
| 2026-01-22 | 13F | Bfsg, Llc | 385 | -7,23 | 77 | -9,52 | ||||
| 2026-02-17 | 13F | Canada Pension Plan Investment Board | 64.300 | 175,97 | 12.778 | 170,13 | ||||
| 2026-01-12 | 13F | Rialto Wealth Management, LLC | 17 | 13,33 | 3 | 0,00 | ||||
| 2026-02-11 | 13F | SOUTH STATE Corp | 1 | 0,00 | 0 | |||||
| 2026-02-11 | 13F | Townsquare Capital Llc | 1.236 | 246 | ||||||
| 2025-11-17 | 13F | FSA Wealth Management LLC | 2 | 0,00 | 0 | |||||
| 2026-02-12 | 13F | Hollencrest Capital Management | 45 | -68,97 | 9 | -72,41 | ||||
| 2026-02-05 | 13F | Amalgamated Bank | 41.017 | 1,60 | 8 | 0,00 | ||||
| 2026-02-13 | 13F | Marshall Wace, Llp | 0 | -100,00 | 0 | |||||
| 2026-02-06 | 13F | Pnc Financial Services Group, Inc. | 5.506 | 3,98 | 1.094 | 1,77 | ||||
| 2026-02-17 | 13F | Capital Fund Management S.a. | 0 | -100,00 | 0 | |||||
| 2026-02-17 | 13F | Prelude Capital Management, Llc | 3.754 | -49,24 | 746 | -50,37 | ||||
| 2026-02-17 | 13F | Braidwell Lp | 0 | -100,00 | 0 | |||||
| 2026-02-02 | 13F | Fifth Third Bancorp | 1.118 | 3,33 | 222 | 1,37 | ||||
| 2026-01-29 | 13F | Ashton Thomas Private Wealth, LLC | 1.891 | 4,71 | 376 | 2,46 | ||||
| 2026-02-03 | 13F | Primoris Wealth Advisors, Llc | 3.002 | -0,83 | 597 | -2,93 | ||||
| 2026-02-10 | 13F | Mutual Of America Capital Management Llc | 62.335 | -6,58 | 12.387 | -8,56 | ||||
| 2025-11-07 | 13F | Readystate Asset Management Lp | 0 | -100,00 | 0 | -100,00 | ||||
| 2026-02-10 | 13F | CIBC Asset Management Inc | 2.944 | -5,15 | 585 | -7,14 | ||||
| 2026-02-10 | 13F | Bruce G. Allen Investments, LLC | 5 | 0,00 | 1 | -100,00 | ||||
| 2026-02-05 | 13F | DnB Asset Management AS | 32.580 | 7,66 | 6.474 | 5,37 | ||||
| 2026-02-11 | 13F | IMA Wealth, Inc. | 20 | 4 | ||||||
| 2026-02-23 | 13F | Virtu Financial LLC | 0 | -100,00 | 0 | |||||
| 2026-01-15 | 13F | Jaffetilchin Investment Partners, LLC | 2.622 | -1,76 | 521 | -3,70 | ||||
| 2026-02-17 | 13F | Schonfeld Strategic Advisors LLC | 22.249 | 105,32 | 4.421 | 100,95 | ||||
| 2026-02-02 | 13F | Cornerstone Planning Group LLC | 3 | -99,21 | 1 | -100,00 | ||||
| 2026-02-17 | 13F | Farallon Capital Management Llc | 372.153 | -10,11 | 73.954 | -12,02 | ||||
| 2026-04-09 | 13F | Wedmont Private Capital | 2.217 | 6,18 | 442 | 4,75 | ||||
| 2026-04-24 | 13F | Private Advisor Group, LLC | 1.512 | -78,73 | 285 | -79,82 | ||||
| 2026-02-13 | 13F | Atlas Capital Advisors Llc | 8.325 | 11,28 | 1.654 | 25,68 | ||||
| 2026-02-17 | 13F | Millennium Management Llc | Put | 16.600 | -26,87 | 3.299 | -28,44 | |||
| 2025-11-07 | 13F | Shell Asset Management Co | 2.709 | -57,74 | 1 | -100,00 | ||||
| 2026-02-17 | 13F | Millennium Management Llc | 215.072 | -71,11 | 42.739 | -71,72 | ||||
| 2026-02-17 | 13F | Millennium Management Llc | Call | 15.400 | -62,98 | 3.060 | -63,77 | |||
| 2026-02-05 | 13F | Atria Investments Llc | 13.086 | 156,39 | 2.600 | 150,97 | ||||
| 2026-01-06 | 13F | Tucker Asset Management Llc | 0 | -100,00 | 0 | |||||
| 2026-04-21 | 13F | Claro Advisors LLC | 1.500 | 283 | ||||||
| 2026-02-17 | 13F | Worldquant Millennium Advisors Llc | 44.411 | -9,09 | 8.825 | -11,03 | ||||
| 2026-02-10 | 13F | Natixis Advisors, L.p. | 35.933 | -7,82 | 7 | 0,00 | ||||
| 2026-01-23 | 13F | Rsm Us Wealth Management Llc | 2.609 | -1,02 | 525 | -1,87 | ||||
| 2026-02-02 | 13F | PFA Pension, Forsikringsaktieselskab | 9.492 | 1.911 | ||||||
| 2025-11-14 | 13F | Quarry LP | 0 | -100,00 | 0 | |||||
| 2025-11-12 | 13F | Integrated Advisors Network LLC | 0 | -100,00 | 0 | |||||
| 2026-04-16 | 13F | Brookstone Capital Management | 15.742 | 1,88 | 2.971 | -3,26 | ||||
| 2026-02-13 | 13F | Barclays Plc | 94.159 | -27,89 | 18.711 | -29,42 | ||||
| 2026-04-20 | 13F | Apella Capital, LLC | 2.973 | 585 | ||||||
| 2026-02-17 | 13F | Russell Investments Group, Ltd. | 48.585 | 5,47 | 9.657 | 3,25 | ||||
| 2026-01-09 | 13F | 180 Wealth Advisors, Llc | 2.428 | 0,00 | 482 | -2,03 | ||||
| 2026-02-12 | 13F | Callan Family Office, LLC | 2.134 | 424 | ||||||
| 2025-11-13 | 13F | Jefferies Financial Group Inc. | 0 | -100,00 | 0 | |||||
| 2026-04-27 | 13F | Td Private Client Wealth Llc | 1.598 | -10,83 | 302 | -15,45 | ||||
| 2026-04-27 | 13F | Moran Wealth Management, LLC | 0 | -100,00 | 0 | |||||
| 2026-02-13 | 13F | Morgan Stanley | 840.693 | 5,76 | 167.063 | 3,51 | ||||
| 2026-01-28 | 13F | B. Metzler seel. Sohn & Co. AG | 26.406 | 10,84 | 5.247 | 8,48 | ||||
| 2026-02-12 | 13F | Brown Brothers Harriman & Co | 76 | -10,59 | 15 | -11,76 | ||||
| 2026-04-20 | 13F | Parkway Wealth Management Group, LLC | 1.500 | 0,00 | 303 | 1,34 | ||||
| 2026-04-20 | 13F | Concurrent Investment Advisors, LLC | 0 | -100,00 | 0 | -100,00 | ||||
| 2026-02-06 | 13F | Global Retirement Partners, LLC | 2.029 | 23,49 | 403 | 21,02 | ||||
| 2025-11-14 | 13F | Owl Creek Asset Management, L.P. | Put | 0 | -100,00 | 0 | -100,00 | |||
| 2026-04-27 | 13F | Y-Intercept (Hong Kong) Ltd | 63.397 | 174,47 | 11.964 | 160,63 | ||||
| 2026-02-10 | 13F | BW Gestao de Investimentos Ltda. | 357.435 | -14,49 | 71.029 | -16,31 | ||||
| 2026-02-13 | 13F | Manufacturers Life Insurance Company, The | 0 | -100,00 | 0 | |||||
| 2026-02-11 | 13F | Deutsche Bank Ag\ | 161.036 | 7,33 | 32.001 | 5,05 | ||||
| 2026-02-13 | 13F | Baird Financial Group, Inc. | 3.038 | 604 | ||||||
| 2026-02-12 | 13F | Triumph Capital Management | 125 | 0,00 | 25 | -4,00 | ||||
| 2026-02-03 | 13F | Strengthening Families & Communities, LLC | 18 | 4 | ||||||
| 2026-04-22 | 13F | Pinnacle Bancorp, Inc. | 47 | 9 | ||||||
| 2026-02-12 | 13F | Principal Securities, Inc. | 1.037 | 1,77 | 206 | 0,00 | ||||
| 2026-02-17 | 13F | Cinctive Capital Management LP | 9.594 | -11,40 | 1.907 | -13,28 | ||||
| 2026-01-20 | 13F | Wall Street Access Asset Management, LLC | 5 | 0,00 | 1 | -100,00 | ||||
| 2026-02-10 | 13F | Envestnet Asset Management Inc | 234.589 | 43,51 | 46.618 | 40,46 | ||||
| 2026-04-22 | 13F | Janney Montgomery Scott LLC | 23.662 | 10,60 | 4 | 0,00 | ||||
| 2025-11-17 | 13F | Alyeska Investment Group, L.P. | 0 | -100,00 | 0 | -100,00 | ||||
| 2026-02-12 | 13F | AlphaCentric Advisors LLC | 523 | -56,88 | 104 | -32,68 | ||||
| 2026-02-11 | 13F | Livforsakringsbolaget Skandia, Omsesidigt | 38.650 | 107,80 | 7.679 | 103,50 | ||||
| 2026-04-23 | 13F | Brown Miller Wealth Management, LLC | 1.932 | 8,11 | 365 | 2,54 | ||||
| 2026-02-17 | 13F | Susquehanna International Group, Llp | Put | 158.000 | -41,61 | 31.398 | -42,85 | |||
| 2026-02-03 | 13F | Alta Wealth Advisors LLC | 2.318 | -0,77 | 461 | -2,95 | ||||
| 2026-02-17 | 13F | Susquehanna International Group, Llp | Call | 427.400 | -11,20 | 84.933 | -13,09 | |||
| 2026-02-11 | 13F | Syon Capital Llc | 1.254 | 249 | ||||||
| 2026-01-20 | 13F | Harbor Capital Advisors, Inc. | 133 | 4,72 | 0 | |||||
| 2026-02-17 | 13F | Susquehanna International Group, Llp | 1.081 | -97,64 | 215 | -97,70 | ||||
| 2025-11-14 | 13F | Point72 Asia (Singapore) Pte. Ltd. | 9.849 | 25,58 | 2.000 | 44,86 | ||||
| 2026-04-10 | 13F/A | OP Asset Management Ltd | 259 | 49 | ||||||
| 2026-01-15 | 13F | Allspring Global Investments Holdings, LLC | 344.388 | -14,88 | 68.688 | -15,67 | ||||
| 2026-02-13 | 13F | Kayne Anderson Rudnick Investment Management Llc | 258 | 0,00 | 51 | -1,92 | ||||
| 2026-02-12 | 13F | Jane Street Group, Llc | Call | 205.100 | -21,21 | 40.757 | -22,88 | |||
| 2026-02-12 | 13F | Jane Street Group, Llc | 193.925 | -46,60 | 38.537 | -47,74 | ||||
| 2026-02-12 | 13F | Jane Street Group, Llc | Put | 42.100 | -59,75 | 8.366 | -60,61 | |||
| 2025-11-14 | 13F | Holocene Advisors, LP | 0 | -100,00 | 0 | |||||
| 2026-02-17 | 13F | Whitebox Advisors Llc | 0 | -100,00 | 0 | |||||
| 2025-11-04 | 13F | Pineridge Advisors LLC | 0 | -100,00 | 0 | |||||
| 2026-02-17 | 13F | Glenview Capital Management, Llc | 1.983.753 | -14,63 | 394.211 | -16,45 | ||||
| 2026-02-09 | 13F | Employees Retirement System of Texas | 774 | 0,00 | 0 | |||||
| 2026-02-11 | 13F | Group One Trading, L.p. | Put | 43.900 | -44,29 | 8.724 | -45,48 | |||
| 2026-01-29 | 13F | Comerica Bank | 48.445 | -0,93 | 9.627 | -3,03 | ||||
| 2026-02-11 | 13F | Group One Trading, L.p. | Call | 7.900 | -54,86 | 1.570 | -55,84 | |||
| 2026-02-09 | 13F | Harbour Investments, Inc. | 16 | 6,67 | 3 | 0,00 | ||||
| 2026-02-11 | 13F | Winnow Wealth Llc | 4.726 | -14,57 | 940 | -16,67 | ||||
| 2026-02-17 | 13F | California State Teachers Retirement System | 83.790 | -4,32 | 16.651 | -6,36 | ||||
| 2025-11-14 | 13F | Axa S.a. | 0 | -100,00 | 0 | |||||
| 2026-04-16 | 13F | Diversified Trust Co | 3.660 | -14,63 | 691 | -18,92 | ||||
| 2026-02-10 | 13F | Private Wealth Asset Management, LLC | 1 | 0,00 | 0 | |||||
| 2026-04-09 | 13F | Vista Investment Partners Llc | 25.749 | 2,31 | 4.859 | -2,86 | ||||
| 2026-04-15 | 13F | Norden Group Llc | 3.778 | -16,10 | 713 | -20,36 | ||||
| 2026-02-13 | 13F | Jacobs Levy Equity Management, Inc | 1.014 | 0,00 | 202 | -1,95 | ||||
| 2026-04-14 | 13F | Clean Yield Group | 21 | 0,00 | 4 | -25,00 | ||||
| 2026-02-05 | 13F | GABELLI & Co INVESTMENT ADVISERS, INC. | 1.350 | 0,00 | 268 | -2,19 | ||||
| 2025-11-14 | 13F/A | Massar Capital Management, LP | 0 | -100,00 | 0 | |||||
| 2026-02-11 | 13F | Group One Trading, L.p. | 0 | -100,00 | 0 | -100,00 | ||||
| 2026-04-20 | 13F | Ritholtz Wealth Management | 16.820 | 1,17 | 3.174 | -3,91 | ||||
| 2026-02-17 | 13F | Two Sigma Advisers, Lp | 70.000 | 1.791,89 | 13.910 | 1.752,20 | ||||
| 2026-01-28 | 13F | Arizona State Retirement System | 24.625 | -10,41 | 4.893 | -12,31 | ||||
| 2026-02-17 | 13F | Janus Henderson Group Plc | 40.600 | -1,83 | 8.071 | -3,91 | ||||
| 2026-02-11 | 13F | Jpmorgan Chase & Co | 422.868 | 2,63 | 84.032 | 0,45 | ||||
| 2026-02-06 | 13F | Gsa Capital Partners Llp | 4.602 | 143,36 | 1 | |||||
| 2026-02-11 | 13F | Jpmorgan Chase & Co | Call | 73.600 | -5,76 | 14.626 | -7,77 | |||
| 2026-01-21 | 13F | Flagship Harbor Advisors, Llc | 34 | -97,71 | 7 | -98,01 | ||||
| 2026-02-11 | 13F | Jpmorgan Chase & Co | Put | 101.000 | 113,98 | 20.071 | 109,43 | |||
| 2026-01-30 | 13F/A | M&t Bank Corp | 9.785 | 91,83 | 1.945 | 87,83 | ||||
| 2026-02-18 | 13F | Caitlin John, LLC | 122 | 0,00 | 24 | 0,00 | ||||
| 2026-02-17 | 13F | Caisse De Depot Et Placement Du Quebec | 75.087 | -25,20 | 14.921 | -26,79 | ||||
| 2026-02-13 | 13F | MAI Capital Management | 410 | 89,81 | 81 | 88,37 | ||||
| 2026-04-17 | 13F | Vermillion Wealth Management, Inc. | 6 | 1 | ||||||
| 2026-02-03 | 13F | Mitsubishi UFJ Kokusai Asset Management Co., Ltd. | 336 | 0,00 | 67 | -1,47 | ||||
| 2026-02-20 | 13F | Dorsey Wright & Associates | 54.095 | 10.750 | ||||||
| 2026-02-11 | 13F | Winton Capital Group Ltd | 0 | -100,00 | 0 | |||||
| 2026-04-14 | 13F | Davidson Capital Management Inc. | 6.435 | 42.800,00 | 1.214 | 60.600,00 | ||||
| 2026-02-13 | 13F | Searle & Co. | 0 | -100,00 | 0 | |||||
| 2026-02-06 | 13F | Evoke Wealth, Llc | 1.354 | 1,73 | 269 | -0,37 | ||||
| 2026-01-28 | 13F | Salomon & Ludwin, LLC | 49 | 0,00 | 10 | 11,11 | ||||
| 2026-02-13 | 13F | Walleye Trading LLC | Put | 13.100 | -22,94 | 2.603 | -24,57 | |||
| 2026-04-24 | 13F | Retirement Systems of Alabama | 168.100 | 1,37 | 31.722 | -3,74 | ||||
| 2026-02-13 | 13F | Walleye Trading LLC | Call | 26.600 | 146,30 | 5.286 | 141,10 | |||
| 2026-02-13 | 13F | Caxton Associates Llp | 2.712 | 0,00 | 539 | -2,18 | ||||
| 2025-10-30 | 13F | Twin Peaks Wealth Advisors, LLC | 0 | -100,00 | 0 | |||||
| 2026-04-23 | 13F | Forum Financial Management, LP | 0 | -100,00 | 0 | |||||
| 2026-02-11 | 13F | Harvest Fund Management Co., Ltd | 0 | -100,00 | 0 | |||||
| 2026-02-12 | 13F | MetLife Investment Management, LLC | 42.931 | -5,42 | 8.531 | -7,43 | ||||
| 2026-02-12 | 13F | Colonial Trust Co / SC | 114 | -12,98 | 23 | -15,38 | ||||
| 2026-02-13 | 13F | Glen Eagle Advisors, LLC | 100 | 0,00 | 20 | -5,00 | ||||
| 2026-01-27 | 13F/A | Capital Performance Advisors Llp | 1.354 | 19,93 | 269 | 17,47 | ||||
| 2026-02-11 | 13F | Renaissance Group Llc | 5.615 | -0,58 | 1.116 | -2,71 | ||||
| 2026-01-16 | 13F | Empirical Financial Services, LLC d.b.a. Empirical Wealth Management | 1.291 | 257 | ||||||
| 2026-02-13 | 13F | Aigen Investment Management, Lp | 0 | -100,00 | 0 | |||||
| 2026-02-10 | 13F/A | Northwestern Mutual Wealth Management Co | 1.882 | 2,17 | 374 | -0,27 | ||||
| 2026-04-14 | 13F | Bay Harbor Wealth Management, LLC | 17 | 41,67 | 3 | 50,00 | ||||
| 2026-04-27 | 13F | Pensionmark Financial Group, Llc | 2.325 | -10,82 | 439 | -15,44 | ||||
| 2025-11-14 | 13F | Texas Permanent School Fund | 0 | -100,00 | 0 | |||||
| 2026-02-17 | 13F | GeoWealth Management, LLC | 463 | 92 | ||||||
| 2026-04-23 | 13F | TFC Financial Management | 1 | 0,00 | 0 | |||||
| 2026-02-17 | 13F | DZ BANK AG Deutsche Zentral Genossenschafts Bank, Frankfurt am Main | 0 | -100,00 | 0 | |||||
| 2026-02-05 | 13F | Bessemer Group Inc | 582 | 0,00 | 0 | |||||
| 2026-02-13 | 13F | Pinnacle Wealth Planning Services, Inc. | 113 | 22 | ||||||
| 2026-02-06 | 13F | Meiji Yasuda Asset Management Co Ltd. | 2.017 | -1,75 | 401 | -3,85 | ||||
| 2026-02-12 | 13F | Caerus Investment Advisors, LLC | 2.953 | 73,20 | 587 | 69,36 | ||||
| 2026-02-09 | 13F | Huntington National Bank | 3.151 | -0,35 | 626 | -2,49 | ||||
| 2026-02-17 | 13F | Zacks Investment Management | 22.586 | -0,04 | 4.488 | -2,16 | ||||
| 2025-11-14 | 13F | D. E. Shaw & Co., Inc. | Call | 0 | -100,00 | 0 | -100,00 | |||
| 2026-02-02 | 13F | Horizon Investments, LLC | 30.052 | -23,59 | 5.972 | -25,22 | ||||
| 2026-02-17 | 13F | State Of Wisconsin Investment Board | 78.888 | -3,36 | 15.677 | -5,42 | ||||
| 2026-02-06 | 13F | Larson Financial Group LLC | 112 | 31,76 | 22 | 29,41 | ||||
| 2026-02-13 | 13F | Walleye Capital LLC | Call | 10.400 | 2.067 | |||||
| 2026-02-13 | 13F | Walleye Capital LLC | Put | 10.900 | 2.625,00 | 2.166 | 2.574,07 | |||
| 2026-02-13 | 13F | Walleye Capital LLC | 122.689 | -14,37 | 24.381 | -16,19 | ||||
| 2026-02-13 | 13F | Pathstone Holdings, LLC | 20.030 | 7,72 | 3.980 | 5,43 | ||||
| 2026-04-23 | 13F | Fairman Group, LLC | 3 | 0,00 | 1 | |||||
| 2026-02-13 | 13F | S&t Bank/pa | 0 | -100,00 | 0 | |||||
| 2026-02-13 | 13F | Rhumbline Advisers | 224.474 | -5,94 | 44.607 | -7,94 | ||||
| 2026-02-13 | 13F | Huber Capital Management LLC | 60.301 | 17,54 | 11.983 | 15,04 | ||||
| 2026-02-13 | 13F | Police & Firemen's Retirement System of New Jersey | 36.920 | -3,92 | 7.337 | -5,96 | ||||
| 2026-01-30 | 13F | Exencial Wealth Advisors, Llc | 0 | -100,00 | 0 | |||||
| 2025-11-07 | 13F | Skandinaviska Enskilda Banken AB (publ) | 0 | -100,00 | 0 | -100,00 | ||||
| 2026-02-10 | 13F | CIBC World Markets Inc. | 24.145 | 0,82 | 4.798 | -1,32 | ||||
| 2026-04-06 | 13F | Washington Trust Advisors, Inc. | 28 | 0,00 | 5 | 0,00 | ||||
| 2026-04-21 | 13F | Pinnacle Associates Ltd | 1.182 | -25,10 | 223 | -28,75 | ||||
| 2026-02-03 | 13F | Diversify Wealth Management, Llc | 2.603 | -0,69 | 518 | -1,71 | ||||
| 2026-01-22 | 13F | Jackson Thornton Asset Management, Llc | 1.913 | -13,67 | 398 | -10,36 | ||||
| 2026-02-13 | 13F | Silvant Capital Management LLC | 0 | -100,00 | 0 | -100,00 | ||||
| 2026-04-16 | 13F | Davis Capital Management | 1 | 0 | ||||||
| 2026-02-06 | 13F | Covestor Ltd | 572 | -22,18 | 0 | |||||
| 2026-02-13 | 13F | Stifel Financial Corp | 38.033 | 99,52 | 7.558 | 95,27 | ||||
| 2026-02-04 | 13F | WealthTrust Asset Management, LLC | 5.195 | -3,90 | 1.032 | -5,93 | ||||
| 2025-11-05 | 13F | Davy Global Fund Management Ltd | 0 | -100,00 | 0 | |||||
| 2026-02-06 | 13F | Entrust Financial Llc | 76 | 15 | ||||||
| 2026-02-17 | 13F | Ameriflex Group, Inc. | 0 | -100,00 | 0 | |||||
| 2026-04-16 | 13F | SG Americas Securities, LLC | Put | 0 | -100,00 | 0 | ||||
| 2026-04-16 | 13F | SG Americas Securities, LLC | Call | 0 | -100,00 | 0 | ||||
| 2026-02-05 | 13F | Gabelli Funds Llc | 63.535 | -33,43 | 12.626 | -34,85 | ||||
| 2025-11-14 | 13F | Goldentree Asset Management Lp | 0 | -100,00 | 0 | |||||
| 2026-02-19 | 13F | Invesco Ltd. | 1.975.267 | -7,11 | 392.525 | -9,09 | ||||
| 2026-02-09 | 13F | Catalyst Funds Management Pty Ltd | 0 | -100,00 | 0 | |||||
| 2026-02-13 | 13F | Fieldview Capital Management, LLC | 1.813 | 360 | ||||||
| 2026-02-17 | 13F | Caption Management, LLC | 26.231 | -5,73 | 5.213 | -7,74 | ||||
| 2026-02-17 | 13F | Caption Management, LLC | Call | 28.000 | 5.564 | |||||
| 2026-04-24 | 13F | ProShare Advisors LLC | 3.524 | 0,00 | 665 | -5,00 | ||||
| 2026-01-20 | 13F | Cromwell Holdings LLC | 14 | 0,00 | 3 | 0,00 | ||||
| 2026-04-27 | 13F | Mount Yale Investment Advisors, LLC | 2.633 | 497 | ||||||
| 2026-04-08 | 13F | Holos Integrated Wealth LLC | 8 | 2 | ||||||
| 2026-02-12 | 13F | denkapparat Operations GmbH | 2.700 | 0,00 | 537 | -2,19 | ||||
| 2026-02-14 | 13F | Bank of Marin | 1.311 | -6,02 | 261 | -8,13 | ||||
| 2026-01-30 | 13F | Mitsubishi UFJ Trust & Banking Corp | 26.396 | 17,88 | 5.245 | 15,38 | ||||
| 2026-02-17 | 13F | Adage Capital Partners Gp, L.l.c. | 191.854 | -51,49 | 38.125 | -52,52 | ||||
| 2026-02-12 | 13F | Groupe la Francaise | 3.783 | 0,00 | 751 | -2,21 | ||||
| 2025-11-12 | 13F | NewSquare Capital LLC | 0 | -100,00 | 0 | -100,00 | ||||
| 2026-02-12 | 13F | Swiss National Bank | 174.300 | -3,17 | 34.637 | -5,23 | ||||
| 2026-02-17 | 13F | ISAM Funds (UK) Ltd | 0 | -100,00 | 0 | |||||
| 2025-11-21 | 13F | Nebula Research & Development LLC | 0 | -100,00 | 0 | |||||
| 2026-04-13 | 13F | Massmutual Trust Co Fsb/adv | 264 | -8,01 | 50 | -14,04 | ||||
| 2026-02-05 | 13F | Elyxium Wealth, LLC | 146 | 29 | ||||||
| 2026-04-17 | 13F | Willner & Heller, Llc | 1.205 | 0,00 | 227 | -5,02 | ||||
| 2026-01-26 | 13F | KBC Group NV | 53.250 | 368,54 | 11 | 400,00 | ||||
| 2026-04-13 | 13F | Gateway Investment Advisers Llc | 1.931 | 48,20 | 364 | 41,09 | ||||
| 2026-02-11 | 13F | Hughes Financial Services, LLC | 6 | 50,00 | 1 | |||||
| 2025-11-12 | 13F | Horizon Financial Services, Llc | 0 | -100,00 | 0 | |||||
| 2026-01-27 | 13F | Evergreen Capital Management Llc | 2.764 | -13,57 | 549 | -15,41 | ||||
| 2026-02-12 | 13F | Tocqueville Asset Management L.p. | 0 | -100,00 | 0 | |||||
| 2026-04-24 | 13F | National Asset Management, Inc. | 3.293 | -7,03 | 619 | -11,95 | ||||
| 2026-02-11 | 13F | Private Management Group Inc | 62.087 | -9,50 | 12.338 | -11,43 |