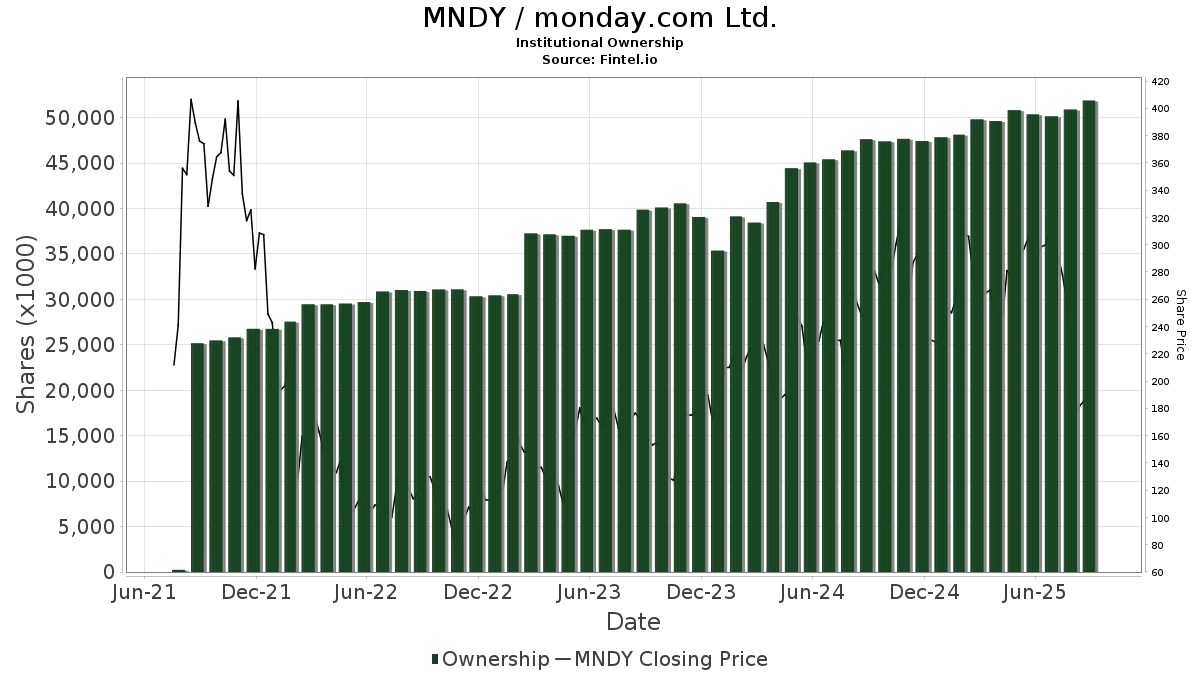
Grundlæggende statistik
| Institutionelle aktier (lange) | 38.725.066 - 76,27% (ex 13D/G) - change of -11,18MM shares -22,40% MRQ |
| Institutionel værdi (lang) | $ 5.287.565 USD ($1000) |
Institutionelt ejerskab og aktionærer
monday.com Ltd. (US:MNDY) har 406 institutionelle ejere og aktionærer, der har indsendt 13D/G- eller 13F-formularer til Securities Exchange Commission (SEC). Disse institutioner har i alt 38,725,066 aktier. Største aktionærer omfatter Wcm Investment Management, Llc, Capital World Investors, BlackRock, Inc., Sonnipe Ltd, Rubicon Global Capital Ltd, Fmr Llc, Renaissance Technologies Llc, Jpmorgan Chase & Co, SG Americas Securities, LLC, and Morgan Stanley .
monday.com Ltd. (NasdaqGS:MNDY) institutionel ejerskabsstruktur viser aktuelle positioner i virksomheden efter institutioner og fonde, samt seneste ændringer i positionsstørrelse. Større aktionærer kan omfatte individuelle investorer, investeringsforeninger, hedgefonde eller institutioner. Skema 13D angiver, at investoren besidder (eller besidder) mere end 5 % af virksomheden og har til hensigt (eller har til hensigt at) aktivt at forfølge en ændring i forretningsstrategi. Skema 13G indikerer en passiv investering på over 5%.
The share price as of April 13, 2026 is 63,55 / share. Previously, on April 14, 2025, the share price was 245,80 / share. This represents a decline of 74,15% over that period.
Fondens stemningsscore
Fund Sentiment Score (fka Ownership Accumulation Score) finder de aktier, der bliver mest købt af fonde. Det er resultatet af en sofistikeret, multi-faktor kvantitativ model, der identificerer virksomheder med de højeste niveauer af institutionel akkumulering. Scoringsmodellen bruger en kombination af den samlede stigning i oplyste ejere, ændringerne i porteføljeallokeringer i disse ejere og andre målinger. Tallet går fra 0 til 100, hvor højere tal indikerer et højere niveau af akkumulering for sine jævnaldrende, og 50 er gennemsnittet.
Opdateringsfrekvens: Dagligt
Se Ownership Explorer, som giver en liste over højest rangerende virksomheder.
AI+ Ask Fintel’s AI assistant about monday.com Ltd..
Select a question to share a public post with an AI-crafted answer.
Thinking of good questions…
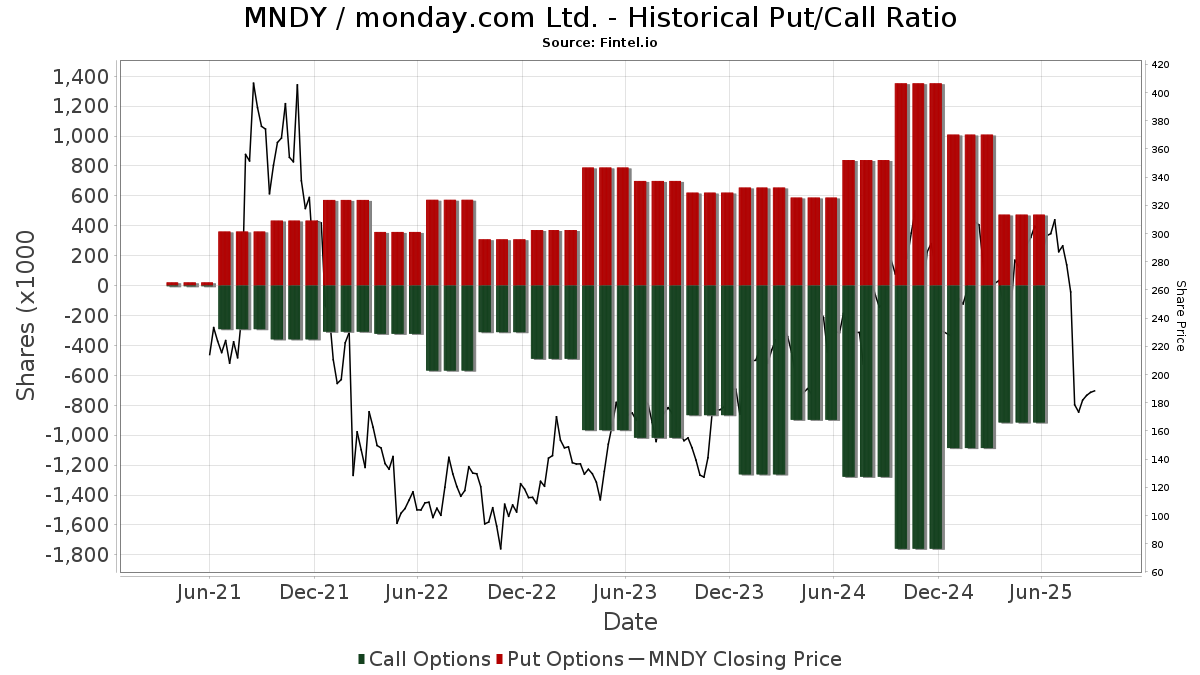
Institutionel Put/Call-forhold
Ud over at indberette standardaktie- og gældsudstedelser skal institutter med mere end 100 mill. aktiver under forvaltning også oplyse deres put- og call-optionsbeholdninger. Da salgsoptioner generelt indikerer negativ stemning, og købsoptioner indikerer positiv stemning, kan vi få en fornemmelse af den overordnede institutionelle stemning ved at plotte forholdet mellem put og kald. Diagrammet til højre viser det historiske put/call-forhold for dette instrument.
Brug af Put/Call Ratio som en indikator for investorernes stemning overvinder en af de vigtigste mangler ved at bruge totalt institutionelt ejerskab, som er, at en betydelig mængde af aktiver under forvaltning investeres passivt for at spore indekser. Passivt forvaltede fonde køber typisk ikke optioner, så indikatoren for put/call-forholdet følger mere nøje følelsen af aktivt forvaltede fonde.
13D/G-arkivering
Vi præsenterer 13D/G ansøgninger separat fra 13F ansøgninger på grund af den forskellige behandling af SEC. 13D/G-ansøgninger kan indgives af grupper af investorer (med én ledende), hvorimod 13F-ansøgninger ikke kan. Dette resulterer i situationer, hvor en investor kan indsende en 13D/G, der rapporterer én værdi for de samlede aktier (der repræsenterer alle de aktier, der ejes af investorgruppen), men derefter indsender en 13F, der rapporterer en anden værdi for de samlede aktier (der udelukkende repræsenterer deres egne) ejendomsret). Det betyder, at aktieejerskab af 13D/G-arkiver og 13F-arkiveringer ofte ikke er direkte sammenlignelige, så vi præsenterer dem separat.
Bemærk: Fra den 16. maj 2021 viser vi ikke længere ejere, der ikke har indsendt en 13D/G inden for det seneste år. Tidligere viste vi den fulde historie af 13D/G-arkiver. Generelt skal enheder, der er forpligtet til at indgive 13D/G-ansøgninger, indgive mindst årligt, før de indsender en afsluttende ansøgning. Dog forlader fonde nogle gange positioner uden at indsende en afsluttende ansøgning (dvs. de afvikler), så visning af den fulde historie resulterede nogle gange i forvirring om det nuværende ejerskab. For at undgå forvirring viser vi nu kun 'aktuelle' ejere - det vil sige - ejere, der har anmeldt inden for det seneste år.
Upgrade to unlock premium data.
| Fil dato | Form | Investor | Forrige Aktier |
Seneste Aktier |
Δ Aktier (Procent) |
Ejendomsret (Procent) |
Δ Ejerskab (Procent) |
|
|---|---|---|---|---|---|---|---|---|
| 2026-04-06 | WCM INVESTMENT MANAGEMENT, LLC | 3,761,924 | 750 | -99.98 | 0.00 | -99.98 | ||
| 2026-02-13 | Capital World Investors | 3,286,461 | 6.50 | |||||
| 2025-11-05 | FMR LLC | 5,076,858 | 1,854,687 | -63.47 | 3.70 | -63.00 | ||
| 2025-08-14 | Sonnipe Ltd | 3,159,843 | 2,154,980 | -31.80 | 4.20 | -32.26 |
13F og NPORT arkivering
Detaljer om 13F-arkivering er gratis. Detaljer om NP-ansøgninger kræver et premium-medlemskab. Grønne rækker angiver nye positioner. Røde rækker angiver lukkede positioner. Klik på linket ikon for at se den fulde transaktionshistorik.
Opgrader
for at låse premium-data op og eksportere til Excel ![]() .
.
| Fil dato | Kilde | Investor | Type | Gennemsnitlig pris (Øst) |
Aktier | Δ Aktier (%) |
Rapporteret Værdi ($1000) |
Δ Værdi (%) |
Port Alloc (%) |
|
|---|---|---|---|---|---|---|---|---|---|---|
| 2026-02-17 | 13F | Melqart Asset Management (uk) Ltd | 0 | -100,00 | 0 | |||||
| 2026-01-27 | 13F | WealthCollab, LLC | 34 | 0,00 | 5 | -16,67 | ||||
| 2026-02-02 | 13F | Triasima Portfolio Management inc. | 2.329 | 1,13 | 344 | -23,09 | ||||
| 2026-02-03 | 13F | NewEdge Wealth, LLC | 38.187 | 5.635 | ||||||
| 2026-01-28 | 13F | Quaker Wealth Management, LLC | 0 | -100,00 | 0 | -100,00 | ||||
| 2026-02-13 | 13F | QVT Financial LP | 0 | -100,00 | 0 | |||||
| 2026-02-10 | 13F | FDx Advisors, Inc. | 0 | -100,00 | 0 | |||||
| 2025-11-14 | 13F | Adage Capital Partners Gp, L.l.c. | 0 | -100,00 | 0 | |||||
| 2026-02-17 | 13F | Two Sigma Investments, Lp | 367.979 | 7.221,51 | 54.299 | 5.480,47 | ||||
| 2026-02-06 | 13F | Capco Asset Management, LLC | 577 | 79,75 | 85 | 37,10 | ||||
| 2026-02-10 | 13F | Nomura Asset Management Co Ltd | 14.620 | 21,33 | 2.157 | -7,54 | ||||
| 2026-02-10 | 13F | Natixis Advisors, L.p. | 31.361 | 4,31 | 5 | -20,00 | ||||
| 2026-02-17 | 13F | Advisor Group Holdings, Inc. | 789 | -64,20 | 116 | -72,83 | ||||
| 2026-02-12 | 13F | Commonwealth Equity Services, Llc | 4.407 | 24,35 | 650 | |||||
| 2026-02-17 | 13F | Point72 Asset Management, L.P. | Put | 12.300 | 2.360,00 | 1.815 | 1.789,58 | |||
| 2025-11-14 | 13F | Wolverine Trading, Llc | Call | 55.000 | 292,86 | 11.086 | 157,16 | |||
| 2026-02-17 | 13F | Point72 Asset Management, L.P. | Call | 3.300 | 487 | |||||
| 2025-11-14 | 13F | Wolverine Trading, Llc | Put | 62.500 | 328,08 | 12.598 | 180,20 | |||
| 2025-11-06 | 13F | Metis Global Partners, LLC | 0 | -100,00 | 0 | |||||
| 2026-02-13 | 13F | SRS Capital Advisors, Inc. | 527 | -31,47 | 78 | -47,97 | ||||
| 2026-02-17 | 13F | Brown Capital Management Llc | 71.052 | -26,40 | 10.484 | -43,93 | ||||
| 2026-02-11 | 13F | ARK Investment Management LLC | 11.724 | 74,44 | 1.730 | 32,90 | ||||
| 2026-02-13 | 13F | Baird Financial Group, Inc. | 16.311 | -12,69 | 2.407 | -33,50 | ||||
| 2026-02-17 | 13F | Delaware Management Holdings, Inc. | 21.256 | 3.137 | ||||||
| 2025-11-13 | 13F | Lord, Abbett & Co. Llc | 0 | -100,00 | 0 | |||||
| 2025-11-14 | 13F | Wolverine Trading, Llc | 23.671 | 493,11 | 4.771 | 288,20 | ||||
| 2025-10-20 | 13F | Los Angeles Capital Management Llc | 0 | -100,00 | 0 | -100,00 | ||||
| 2026-02-04 | 13F | Hallmark Capital Management Inc | 13 | 2 | ||||||
| 2026-01-16 | 13F | Ronald Blue Trust, Inc. | 191 | -90,44 | 28 | -92,75 | ||||
| 2026-02-17 | 13F | Twinbeech Capital Lp | 17.629 | 2.601 | ||||||
| 2026-02-12 | 13F | MetLife Investment Management, LLC | 4.018 | 0,00 | 593 | -23,91 | ||||
| 2025-10-23 | 13F | Granite Group Advisors, LLC | 0 | -100,00 | 0 | |||||
| 2026-04-08 | 13F | Arlington Trust Co LLC | 1 | 0 | ||||||
| 2026-01-14 | 13F | Barnes Dennig Private Wealth Management LLC | 7 | 1 | ||||||
| 2026-02-12 | 13F | Swiss National Bank | 123.700 | 1,89 | 18.253 | -22,37 | ||||
| 2026-02-13 | 13F | FORA Capital, LLC | 11.666 | 1.849 | ||||||
| 2026-02-17 | 13F | Aqr Capital Management Llc | 1.555 | 17,09 | 229 | -10,89 | ||||
| 2026-04-13 | 13F | Massmutual Trust Co Fsb/adv | 75 | 257,14 | 5 | 66,67 | ||||
| 2026-02-13 | 13F | USS Investment Management Ltd | 8.985 | 21,90 | 1.326 | -7,28 | ||||
| 2026-02-17 | 13F | Citadel Advisors Llc | Call | 275.600 | 23,15 | 40.668 | -6,18 | |||
| 2026-02-13 | 13F | Cornerstone Financial Management LLC | 4 | 1 | ||||||
| 2026-02-11 | 13F | Jpmorgan Chase & Co | 1.099.826 | -26,44 | 162.291 | -43,96 | ||||
| 2026-02-17 | 13F | Citadel Advisors Llc | Put | 355.900 | 53,74 | 52.517 | 17,12 | |||
| 2026-02-17 | 13F | Citadel Advisors Llc | 155.126 | 35,01 | 22.890 | 2,86 | ||||
| 2025-11-14 | 13F | Bwcp, Lp | 0 | -100,00 | 0 | |||||
| 2026-02-06 | 13F | Addison Advisors LLC | 4 | 33,33 | 1 | |||||
| 2026-04-06 | 13F | GAMMA Investing LLC | 0 | -100,00 | 0 | -100,00 | ||||
| 2026-02-12 | 13F | Renaissance Technologies Llc | 1.129.090 | 7,09 | 166.609 | -18,41 | ||||
| 2026-02-24 | 13F | Avory & Company, LLC | 2.284 | 337 | ||||||
| 2025-11-14 | 13F | Credit Agricole S A | 0 | -100,00 | 0 | -100,00 | ||||
| 2025-11-12 | 13F | CIBC Bancorp USA Inc. | 195.151 | 37.799 | ||||||
| 2026-02-03 | 13F | Sumitomo Mitsui DS Asset Management Company, Ltd | 4.300 | 0,00 | 635 | -23,80 | ||||
| 2026-02-13 | 13F | Pinnacle Wealth Planning Services, Inc. | 184 | 27 | ||||||
| 2026-02-17 | 13F | Quadrature Capital Ltd | 11.782 | 1.739 | ||||||
| 2026-02-17 | 13F | D. E. Shaw & Co., Inc. | 419.571 | 1.842,91 | 61.912 | 1.380,42 | ||||
| 2026-02-17 | 13F | D. E. Shaw & Co., Inc. | Call | 19.800 | 32,89 | 2.922 | 1,25 | |||
| 2026-02-13 | 13F | Charles Schwab Investment Management Inc | 33.296 | 10,75 | 4.913 | -15,63 | ||||
| 2026-02-17 | 13F | D. E. Shaw & Co., Inc. | Put | 77.400 | -44,48 | 11.421 | -57,70 | |||
| 2026-02-17 | 13F | Fairscale Capital, LLC | 15 | 0,00 | 2 | 0,00 | ||||
| 2026-02-11 | 13F | United Financial Planning Group LLC | 35 | 5 | ||||||
| 2025-11-14 | 13F | Durable Capital Partners LP | 0 | -100,00 | 0 | |||||
| 2026-02-17 | 13F | Tudor Investment Corp Et Al | Call | 28.400 | 4.191 | |||||
| 2026-02-17 | 13F | Crosslink Capital Inc | 162.225 | -20,43 | 23.938 | -39,38 | ||||
| 2026-01-06 | 13F | Nelson, Van Denburg & Campbell Wealth Management Group, LLC | 0 | -100,00 | 0 | -100,00 | ||||
| 2026-02-17 | 13F | Tudor Investment Corp Et Al | Put | 52.200 | 7.703 | |||||
| 2026-02-13 | 13F | Verition Fund Management LLC | 14.751 | 158,88 | 2.177 | 97,28 | ||||
| 2026-02-17 | 13F | Jones Financial Companies Lllp | 3.925 | 80,05 | 579 | 28,67 | ||||
| 2026-02-10 | 13F | Td Asset Management Inc | 107.998 | 10,77 | 15.936 | -15,61 | ||||
| 2026-02-12 | 13F | California Public Employees Retirement System | 74.342 | -0,02 | 10.970 | -23,84 | ||||
| 2026-01-28 | 13F | Peregrine Capital Management Llc | 186.725 | -0,42 | 27.553 | -24,14 | ||||
| 2026-01-20 | 13F | Princeton Global Asset Management LLC | 0 | -100,00 | 0 | -100,00 | ||||
| 2026-01-27 | 13F | First Horizon Corp | 38 | -35,59 | 6 | -54,55 | ||||
| 2026-01-13 | 13F/A | Sanctuary Advisors, LLC | 0 | -100,00 | 0 | -100,00 | ||||
| 2026-02-11 | 13F | Westfield Capital Management Co Lp | 13.955 | -97,99 | 2.059 | -98,47 | ||||
| 2025-10-23 | 13F | Venturi Wealth Management, LLC | 0 | -100,00 | 0 | |||||
| 2026-02-13 | 13F | Wells Fargo & Company/mn | 85.701 | 160,07 | 12.646 | 98,15 | ||||
| 2026-01-20 | 13F | Cromwell Holdings LLC | 15 | -88,64 | 2 | -92,00 | ||||
| 2026-02-11 | 13F | Tiaa Trust, National Association | 0 | -100,00 | 0 | |||||
| 2026-02-17 | 13F | Northern Trust Corp | 416.920 | 0,30 | 61.521 | -23,59 | ||||
| 2026-02-02 | 13F | Oppenheimer & Co Inc | 1.379 | -74,39 | 203 | -80,52 | ||||
| 2026-02-06 | 13F | EverSource Wealth Advisors, LLC | 71 | -44,96 | 10 | -58,33 | ||||
| 2026-02-17 | 13F | Wiley Bros.-aintree Capital, Llc | 0 | -100,00 | 0 | |||||
| 2026-02-10 | 13F | Catalyst Capital Advisors LLC | 660 | 0,00 | 97 | -23,62 | ||||
| 2026-01-16 | 13F | SWS Partners | 16.215 | 162,72 | 2.393 | 100,17 | ||||
| 2025-11-13 | 13F | Loomis Sayles & Co L P | 0 | -100,00 | 0 | |||||
| 2026-02-06 | 13F | Fortis Group Advisors, LLC | 0 | -100,00 | 0 | -100,00 | ||||
| 2026-02-17 | 13F | Advisory Services Network, LLC | 0 | -100,00 | 0 | |||||
| 2026-02-06 | 13F | Pnc Financial Services Group, Inc. | 5.100 | -16,65 | 753 | -36,54 | ||||
| 2025-10-16 | 13F | Sheets Smith Wealth Management | 0 | -100,00 | 0 | -100,00 | ||||
| 2026-02-13 | 13F | McAdam, LLC | 2.587 | -0,42 | 382 | -24,25 | ||||
| 2026-02-13 | 13F | Golden State Wealth Management, LLC | 3 | 0,00 | 0 | |||||
| 2026-02-13 | 13F | Public Sector Pension Investment Board | 0 | -100,00 | 0 | |||||
| 2025-10-23 | 13F | Spire Wealth Management | 0 | -100,00 | 0 | |||||
| 2026-01-28 | 13F | DekaBank Deutsche Girozentrale | 17.498 | 0,00 | 4 | 0,00 | ||||
| 2026-02-03 | 13F | ASR Vermogensbeheer N.V. | 0 | -100,00 | 0 | -100,00 | ||||
| 2026-02-05 | 13F | Stephens Investment Management Group LLC | 0 | -100,00 | 0 | -100,00 | ||||
| 2026-02-12 | 13F | Pinnacle Holdings, LLC | 122 | 0,00 | 18 | -21,74 | ||||
| 2026-02-11 | 13F | Twin Tree Management, LP | Call | 16.900 | 186,44 | 2.494 | 118,30 | |||
| 2026-01-26 | 13F | Shelton Wealth Management, Llc | 0 | -100,00 | 0 | -100,00 | ||||
| 2026-02-05 | 13F | S&co Inc | 6.875 | 1 | ||||||
| 2026-02-06 | 13F | GPS Wealth Strategies Group, LLC | 0 | -100,00 | 0 | |||||
| 2026-02-11 | 13F | Twin Tree Management, LP | Put | 1.300 | 0,00 | 192 | -23,90 | |||
| 2026-02-11 | 13F | Twin Tree Management, LP | 929 | -90,49 | 137 | -92,76 | ||||
| 2026-01-28 | 13F | WPG Advisers, LLC | 5 | -50,00 | 1 | -100,00 | ||||
| 2026-02-06 | 13F | Resona Asset Management Co.,Ltd. | 9.974 | 0,50 | 1.472 | -23,47 | ||||
| 2026-02-09 | 13F | Harbour Investments, Inc. | 833 | -2,57 | 123 | -26,06 | ||||
| 2025-11-07 | 13F | Beacon Capital Management, LLC | 0 | -100,00 | 0 | |||||
| 2025-11-12 | 13F | APG Asset Management N.V. | 0 | -100,00 | 0 | -100,00 | ||||
| 2026-02-13 | 13F | Prudential Financial Inc | 2.158 | -13,26 | 314 | -34,93 | ||||
| 2025-11-03 | 13F | Annis Gardner Whiting Capital Advisors, LLC | 0 | -100,00 | 0 | |||||
| 2026-01-27 | 13F | Zurcher Kantonalbank (Zurich Cantonalbank) | 28.805 | 53,34 | 4.250 | 16,82 | ||||
| 2026-01-21 | 13F | Yousif Capital Management, Llc | 2.076 | 0,00 | 263 | -34,58 | ||||
| 2026-02-13 | 13F | Smartleaf Asset Management LLC | 123 | -44,84 | 18 | -61,36 | ||||
| 2026-02-13 | 13F | Manufacturers Life Insurance Company, The | 0 | -100,00 | 0 | |||||
| 2025-11-14 | 13F | Lazard Asset Management Llc | 0 | -100,00 | 0 | |||||
| 2025-11-14 | 13F | Whale Rock Capital Management LLC | 0 | -100,00 | 0 | |||||
| 2025-11-14 | 13F | Castle Hook Partners LP | 0 | -100,00 | 0 | -100,00 | ||||
| 2026-02-06 | 13F | Summit Creek Advisors LLC | 1.552 | 0,00 | 229 | -23,67 | ||||
| 2026-02-13 | 13F | Stifel Financial Corp | 15.294 | -33,32 | 2.257 | -49,21 | ||||
| 2025-10-21 | 13F | Munro Partners | 0 | -100,00 | 0 | -100,00 | ||||
| 2026-02-17 | 13F | RMB Capital Management, LLC | 58.477 | 0,96 | 8.629 | -23,09 | ||||
| 2026-02-13 | 13F | Panagora Asset Management Inc | 10.944 | 1.615 | ||||||
| 2026-02-17 | 13F | Millennium Management Llc | Put | 0 | -100,00 | 0 | ||||
| 2026-01-23 | 13F | Bellevue Asset Management, Llc | 0 | -100,00 | 0 | -100,00 | ||||
| 2025-10-31 | 13F | Kornitzer Capital Management Inc /ks | 0 | -100,00 | 0 | |||||
| 2026-02-17 | 13F | Millennium Management Llc | Call | 61.300 | 168,86 | 9.045 | 104,82 | |||
| 2026-02-17 | 13F | Caption Management, LLC | 0 | -100,00 | 0 | -100,00 | ||||
| 2026-02-17 | 13F | Caption Management, LLC | Put | 0 | -100,00 | 0 | -100,00 | |||
| 2026-02-17 | 13F | Millennium Management Llc | 148.095 | 148,42 | 21.853 | 89,26 | ||||
| 2026-02-10 | 13F | Bank of New York Mellon Corp | 170.595 | -55,05 | 25.173 | -65,76 | ||||
| 2026-02-13 | 13F | Morgan Stanley | 907.723 | -9,62 | 133.944 | -31,14 | ||||
| 2026-01-29 | 13F | IMC-Chicago, LLC | 29.772 | 4.393 | ||||||
| 2026-02-02 | 13F | WT Wealth Management | 0 | -100,00 | 0 | -100,00 | ||||
| 2026-02-10 | 13F | Lido Advisors, LLC | 1.366 | 0,00 | 265 | 0,00 | ||||
| 2025-11-13 | 13F | Himension Fund | 0 | -100,00 | 0 | |||||
| 2026-02-11 | 13F | Group One Trading, L.p. | 15.405 | 514,23 | 2.273 | 368,66 | ||||
| 2026-01-30 | 13F | Us Bancorp \de\ | 14.591 | -9,78 | 2.153 | -31,26 | ||||
| 2026-03-09 | 13F/A | CI Private Wealth, LLC | 0 | -100,00 | 0 | -100,00 | ||||
| 2026-01-23 | 13F | Baillie Gifford & Co | 723.655 | 2,17 | 106.783 | -22,16 | ||||
| 2026-02-05 | 13F | Allworth Financial LP | 132 | -14,84 | 19 | -36,67 | ||||
| 2025-11-14 | 13F | Ion Asset Management Ltd. | 55.000 | 20,14 | 10.653 | -26,01 | ||||
| 2026-01-15 | 13F | Allspring Global Investments Holdings, LLC | 43.229 | 6.200 | ||||||
| 2026-01-29 | 13F | Coronation Fund Managers Ltd. | 138.085 | 43,52 | 20.376 | 9,34 | ||||
| 2025-11-12 | 13F | West Family Investments, Inc. | 0 | -100,00 | 0 | -100,00 | ||||
| 2026-02-13 | 13F | Ingalls & Snyder Llc | Call | 0 | -100,00 | 0 | ||||
| 2025-11-13 | 13F | Quantitative Investment Management, LLC | 0 | -100,00 | 0 | |||||
| 2026-02-10 | 13F | Commonwealth Of Pennsylvania Public School Empls Retrmt Sys | 49.646 | -5,70 | 7.326 | -28,17 | ||||
| 2025-11-10 | 13F | Hartland & Co., LLC | 0 | -100,00 | 0 | |||||
| 2025-11-14 | 13F | Harvest Fund Management Co., Ltd | 0 | -100,00 | 0 | |||||
| 2026-02-10 | 13F | Goldman Sachs Group Inc | Put | 24.100 | -89,29 | 3.556 | -91,84 | |||
| 2026-02-10 | 13F | Bnp Paribas Arbitrage, Sa | 172.016 | 1.517,60 | 25.383 | 1.132,73 | ||||
| 2025-11-14 | 13F | Graham Capital Management, L.P. | 0 | -100,00 | 0 | |||||
| 2026-02-10 | 13F | Goldman Sachs Group Inc | 293.883 | -46,44 | 43.365 | -59,20 | ||||
| 2026-02-10 | 13F | Goldman Sachs Group Inc | Call | 244.900 | 3,55 | 36.137 | -21,11 | |||
| 2026-02-17 | 13F | Watershed Asset Management, L.L.C. | 20.750 | 3.062 | ||||||
| 2026-01-09 | 13F | Park Place Capital Corp | 0 | -100,00 | 0 | |||||
| 2026-02-12 | 13F | Principal Securities, Inc. | 0 | -100,00 | 0 | -100,00 | ||||
| 2026-01-28 | 13F | Teacher Retirement System Of Texas | 17.116 | -14,18 | 2.526 | -34,62 | ||||
| 2026-02-17 | 13F | Edmond De Rothschild Holding S.a. | 12 | 0,00 | 2 | -50,00 | ||||
| 2026-02-13 | 13F | Gen-Wealth Partners Inc | 0 | -100,00 | 0 | |||||
| 2026-02-17 | 13F | Maytus Capital Management, LLC | 9.000 | 1.328 | ||||||
| 2026-02-18 | 13F | Caitlin John, LLC | 5 | 0,00 | 1 | |||||
| 2025-11-14 | 13F | Circle Wealth Management, LLC | 0 | -100,00 | 0 | |||||
| 2026-02-17 | 13F | Canada Pension Plan Investment Board | 126.424 | 42,03 | 18.655 | 8,21 | ||||
| 2026-02-17 | 13F | Light Street Capital Management, Llc | 0 | -100,00 | 0 | |||||
| 2025-10-22 | 13F | Cigna Investments Inc /new | 0 | -100,00 | 0 | |||||
| 2026-04-08 | 13F | Legacy Wealth Asset Management, LLC | 3.337 | 75,17 | 231 | -18,15 | ||||
| 2026-02-09 | 13F | Legal & General Group Plc | 148.417 | 18,25 | 21.900 | -9,91 | ||||
| 2026-02-17 | 13F | Magnetar Financial LLC | 2.415 | 356 | ||||||
| 2026-02-11 | 13F | LPL Financial LLC | 8.310 | -32,69 | 1.226 | -48,72 | ||||
| 2026-02-17 | 13F | Raymond James Financial Inc | 63.530 | -22,82 | 9.259 | -41,93 | ||||
| 2025-11-14 | 13F | Grandeur Peak Global Advisors, LLC | 0 | -100,00 | 0 | |||||
| 2026-02-19 | 13F | Invesco Ltd. | 11.881 | -62,16 | 1.753 | -71,17 | ||||
| 2026-02-12 | 13F | Square Peg Capital Pty Ltd | 119.645 | -2,90 | 17.655 | -26,03 | ||||
| 2026-02-17 | 13F | Altshuler Shaham Ltd | 16 | -99,59 | 2 | -99,73 | ||||
| 2026-02-11 | 13F | GW&K Investment Management, LLC | 8 | 0,00 | 0 | |||||
| 2026-02-02 | 13F | Principal Financial Group Inc | 4.271 | 82,44 | 630 | 39,07 | ||||
| 2026-02-10 | 13F | Rothschild Investment Llc | 2 | -60,00 | 0 | |||||
| 2026-02-17 | 13F | MIRAE ASSET GLOBAL ETFS HOLDINGS Ltd. | 327 | 15,96 | 48 | -11,11 | ||||
| 2026-01-21 | 13F | Newbridge Financial Services Group, Inc. | 318 | -0,62 | 47 | -24,59 | ||||
| 2026-02-12 | 13F | Marex Group plc | 3.155 | -8,44 | 466 | -30,28 | ||||
| 2026-02-17 | 13F | California State Teachers Retirement System | 33.800 | 4,66 | 4.988 | -20,27 | ||||
| 2026-02-17 | 13F | Woodline Partners LP | 42.259 | 6.236 | ||||||
| 2026-02-17 | 13F | Ravenswood Partners LP | 0 | -100,00 | 0 | -100,00 | ||||
| 2026-02-17 | 13F | Topline Capital Management, LLC | 468.000 | 69.058 | ||||||
| 2026-01-28 | 13F | Paradice Investment Management LLC | 0 | -100,00 | 0 | -100,00 | ||||
| 2026-02-12 | 13F | Lansforsakringar Fondforvaltning AB (publ) | 8.402 | 0,00 | 1.240 | -23,85 | ||||
| 2026-01-15 | 13F | J. Safra Sarasin Holding AG | 2.468 | -94,76 | 364 | -96,01 | ||||
| 2025-11-14 | 13F | Mercer Global Advisors Inc /adv | 0 | -100,00 | 0 | |||||
| 2026-02-05 | 13F | Thrivent Financial For Lutherans | 378.078 | 20,75 | 56 | -8,33 | ||||
| 2026-01-12 | 13F | CVA Family Office, LLC | 7 | 0,00 | 1 | 0,00 | ||||
| 2026-01-30 | 13F | WoodTrust Financial Corp | 0 | -100,00 | 0 | |||||
| 2026-02-11 | 13F | Motley Fool Asset Management LLC | 11.761 | 1.735 | ||||||
| 2026-02-03 | 13F | Washington Trust Advisors, Inc. | 0 | -100,00 | 0 | -100,00 | ||||
| 2026-02-10 | 13F | State of Wyoming | 1.779 | 128,08 | 263 | 73,51 | ||||
| 2026-02-13 | 13F | Police & Firemen's Retirement System of New Jersey | 5.839 | 0,00 | 862 | -23,81 | ||||
| 2026-02-06 | 13F | Cullen/frost Bankers, Inc. | 15 | 0,00 | 2 | 0,00 | ||||
| 2026-04-13 | 13F | Hm Payson & Co | 455 | 0,00 | 31 | -53,73 | ||||
| 2025-11-14 | 13F | Skopos Labs, Inc. | 0 | -100,00 | 0 | |||||
| 2026-01-14 | 13F | Legal Advantage Investments, Inc. | 0 | -100,00 | 0 | -100,00 | ||||
| 2025-11-14 | 13F | Nissay Asset Management Corp /japan/ /adv | 0 | -100,00 | 0 | |||||
| 2026-02-17 | 13F | Prelude Capital Management, Llc | 1.430 | -74,62 | 211 | -80,66 | ||||
| 2025-11-12 | 13F | AlphaCore Capital LLC | 0 | -100,00 | 0 | |||||
| 2026-02-13 | 13F | Sands Capital Management, Llc | 0 | -100,00 | 0 | |||||
| 2026-02-13 | 13F | Sei Investments Co | 41.098 | 0,64 | 6.065 | -23,33 | ||||
| 2026-02-14 | 13F | Rockefeller Capital Management L.P. | 287 | -58,41 | 42 | -68,42 | ||||
| 2026-02-12 | 13F | Federation des caisses Desjardins du Quebec | 3.295 | 14,49 | 486 | -12,75 | ||||
| 2026-02-06 | 13F | Leonteq Securities AG | 3.130 | 462 | ||||||
| 2026-02-10 | 13F | CIBC Asset Management Inc | 5.148 | 30,49 | 760 | -0,65 | ||||
| 2026-01-21 | 13F | Portside Wealth Group, LLC | 0 | -100,00 | 0 | -100,00 | ||||
| 2026-02-09 | 13F | Coldstream Capital Management Inc | 2.088 | -4,22 | 308 | -27,01 | ||||
| 2026-02-12 | 13F | Polen Capital Management Llc | 0 | -100,00 | 0 | |||||
| 2026-02-17 | 13F | DZ BANK AG Deutsche Zentral Genossenschafts Bank, Frankfurt am Main | 321.195 | 47.396 | ||||||
| 2026-02-11 | 13F | Fiera Capital Corp | 273.530 | 100,75 | 40.362 | 52,94 | ||||
| 2026-02-17 | 13F | Ardmore Road Asset Management LP | 100.466 | 14.825 | ||||||
| 2026-01-27 | 13F | TD Waterhouse Canada Inc. | 2.816 | -2,36 | 415 | -21,99 | ||||
| 2026-01-29 | 13F | Washington Capital Management Inc | 3.700 | 546 | ||||||
| 2026-02-13 | 13F | Quarry LP | 194 | 29 | ||||||
| 2026-02-13 | 13F | Strategy Capital LLC | 222.388 | -10,39 | 32.816 | -31,73 | ||||
| 2026-02-17 | 13F | Two Sigma Advisers, Lp | 208.200 | 30.722 | ||||||
| 2026-01-09 | 13F | SG Americas Securities, LLC | 932.912 | 110,87 | 138 | 61,18 | ||||
| 2026-01-28 | 13F | Salomon & Ludwin, LLC | 43 | 72,00 | 6 | 50,00 | ||||
| 2026-02-13 | 13F | Mariner, LLC | 9.542 | 84,28 | 1.408 | 40,42 | ||||
| 2025-11-14 | 13F | Prudential Plc | 0 | -100,00 | 0 | |||||
| 2026-01-29 | 13F | UBS Group AG | Put | 7.000 | -87,93 | 1.033 | -90,81 | |||
| 2026-01-29 | 13F | UBS Group AG | Call | 11.100 | -75,21 | 1.638 | -81,12 | |||
| 2026-01-29 | 13F | UBS Group AG | 294.532 | -43,93 | 43.461 | -57,28 | ||||
| 2026-01-23 | 13F | Sumitomo Mitsui Trust Holdings, Inc. | 65.290 | 9,04 | 9.634 | -16,93 | ||||
| 2025-11-14 | 13F | Cubist Systematic Strategies, LLC | Put | 7.800 | -44,68 | 1.511 | -65,94 | |||
| 2026-01-27 | 13F | Evergreen Capital Management Llc | 2.035 | 300 | ||||||
| 2026-02-17 | 13F | Investment Management Corp of Ontario | 2.921 | 60,41 | 431 | 22,44 | ||||
| 2026-02-04 | 13F | LRI Investments, LLC | 16 | 0,00 | 2 | -33,33 | ||||
| 2026-02-13 | 13F | Whetstone Capital Advisors, LLC | 0 | -100,00 | 0 | |||||
| 2025-11-14 | 13F | Binnacle Investments Inc | 2 | 0,00 | 0 | |||||
| 2026-02-03 | 13F | RFG Advisory, LLC | 0 | -100,00 | 0 | -100,00 | ||||
| 2026-02-13 | 13F | State Street Corp | 688.751 | 3,77 | 101.632 | -20,95 | ||||
| 2026-02-17 | 13F | Bank Of America Corp /de/ | 145.633 | -40,44 | 21.490 | -54,63 | ||||
| 2026-01-29 | 13F | Vanguard Group Inc | 81.609 | 3,93 | 12.042 | -20,82 | ||||
| 2026-02-06 | 13F | Envestnet Portfolio Solutions, Inc. | 1.456 | -17,18 | 215 | -37,06 | ||||
| 2026-02-17 | 13F | Price T Rowe Associates Inc /md/ | 493.760 | -66,67 | 73 | -74,83 | ||||
| 2026-02-17 | 13F | Janus Henderson Group Plc | 6.741 | -97,15 | 995 | -97,83 | ||||
| 2025-10-20 | 13F | Calamos Advisors LLC | 0 | -100,00 | 0 | |||||
| 2026-04-06 | 13F | Versant Capital Management, Inc | 238 | -22,98 | 16 | -64,44 | ||||
| 2026-01-29 | 13F | Nbc Securities, Inc. | Put | 3 | 9 | |||||
| 2026-02-12 | 13F | Callan Family Office, LLC | 2.538 | 375 | ||||||
| 2026-02-05 | 13F | Qsemble Capital Management, LP | 4.159 | 614 | ||||||
| 2026-01-26 | 13F | Cwm, Llc | 367 | 353,09 | 0 | |||||
| 2026-01-21 | 13F | Palumbo Wealth Management LLC | 8.608 | 18,85 | 1.270 | -9,42 | ||||
| 2026-02-13 | 13F | 1832 Asset Management L.P. | 0 | -100,00 | 0 | |||||
| 2026-02-09 | 13F | Employees Retirement System of Texas | 0 | -100,00 | 0 | -100,00 | ||||
| 2026-01-23 | 13F | Tectonic Advisors Llc | 1.754 | 259 | ||||||
| 2026-02-17 | 13F | Captrust Financial Advisors | 5.151 | -9,39 | 760 | -30,97 | ||||
| 2026-02-10 | 13F | Meitav Dash Investments Ltd | 0 | -100,00 | 0 | |||||
| 2026-02-10 | 13F | Principia Wealth Advisory, LLC | 3 | 50,00 | 0 | |||||
| 2026-01-20 | 13F | Toth Financial Advisory Corp | 600 | 89 | ||||||
| 2026-02-02 | 13F | Strs Ohio | 17.172 | -39,51 | 2.534 | -53,93 | ||||
| 2026-02-13 | 13F | Squarepoint Ops LLC | Call | 5.000 | -34,21 | 738 | -49,93 | |||
| 2026-02-13 | 13F | Squarepoint Ops LLC | Put | 3.700 | 37,04 | 546 | 4,41 | |||
| 2026-02-13 | 13F | Squarepoint Ops LLC | 68.525 | 291,84 | 10.112 | 198,52 | ||||
| 2026-02-17 | 13F | Gotham Asset Management, LLC | 93.141 | 0,00 | 13.744 | -23,82 | ||||
| 2026-02-06 | 13F | Larson Financial Group LLC | 85 | -86,00 | 13 | -89,74 | ||||
| 2026-02-12 | 13F | Federated Hermes, Inc. | 1.500 | 221 | ||||||
| 2026-02-17 | 13F | Fmr Llc | 1.156.954 | -35,86 | 170.720 | -51,14 | ||||
| 2026-02-17 | 13F | Metavasi Capital LP | 0 | -100,00 | 0 | -100,00 | ||||
| 2026-02-17 | 13F | T. Rowe Price Investment Management, Inc. | 833.395 | -24,85 | 123 | -42,99 | ||||
| 2026-02-11 | 13F | Franklin Resources Inc | 25.363 | -92,05 | 3.743 | -93,95 | ||||
| 2026-01-23 | 13F | Robeco Institutional Asset Management B.V. | 56.506 | -21,74 | 8.338 | -40,38 | ||||
| 2026-02-13 | 13F | Pathstone Holdings, LLC | 9.320 | -11,53 | 1.375 | -32,60 | ||||
| 2026-02-13 | 13F | Barclays Plc | 138.633 | 13,19 | 20.457 | -13,77 | ||||
| 2026-02-17 | 13F | GAM Holding AG | 0 | -100,00 | 0 | -100,00 | ||||
| 2026-02-13 | 13F | Barclays Plc | Put | 54.700 | 8.072 | |||||
| 2026-02-24 | 13F | Bell Investment Advisors, Inc | 23 | -11,54 | 3 | -40,00 | ||||
| 2025-11-13 | 13F | Aware Super Pty Ltd as trustee of Aware Super | 44.345 | 353,38 | 8.589 | 179,32 | ||||
| 2026-01-15 | 13F | Retirement Systems of Alabama | 12.380 | 0,00 | 1.827 | -23,82 | ||||
| 2026-02-17 | 13F | Palidye Holdings (Caymans) Ltd | 47.808 | 7.055 | ||||||
| 2026-01-23 | 13F | Rsm Us Wealth Management Llc | 2.846 | -3,26 | 414 | -27,42 | ||||
| 2026-02-12 | 13F | Wasatch Advisors Inc | 47.365 | -12,88 | 6.989 | -33,63 | ||||
| 2026-02-13 | 13F | Siren, L.L.C. | 17.000 | 142,86 | 2.509 | 85,09 | ||||
| 2025-11-12 | 13F | Angeles Wealth Management, Llc | 0 | -100,00 | 0 | |||||
| 2026-02-06 | 13F | Berbice Capital Management LLC | 0 | -100,00 | 0 | -100,00 | ||||
| 2026-02-13 | 13F | Motiv8 Investments LLC | 17 | 0 | ||||||
| 2026-02-12 | 13F | State Board Of Administration Of Florida Retirement System | 2.635 | 6,25 | 389 | -19,17 | ||||
| 2025-10-22 | 13F | D.a. Davidson & Co. | 0 | -100,00 | 0 | |||||
| 2026-02-11 | 13F | Zions Bancorporation, National Association /ut/ | 4 | 33,33 | 1 | |||||
| 2025-11-13 | 13F | Evolutionary Tree Capital Management, LLC | 0 | -100,00 | 0 | |||||
| 2025-11-06 | 13F | Whipplewood Advisors, LLC | 0 | -100,00 | 0 | -100,00 | ||||
| 2026-02-05 | 13F | Bank Julius Baer & Co. Ltd, Zurich | 0 | -100,00 | 0 | -100,00 | ||||
| 2026-02-12 | 13F | Brown Brothers Harriman & Co | 0 | -100,00 | 0 | |||||
| 2026-02-04 | 13F | Plato Investment Management Ltd | 5.142 | 127,62 | 762 | 75,58 | ||||
| 2025-11-14 | 13F | Driehaus Capital Management Llc | 0 | -100,00 | 0 | |||||
| 2026-02-11 | 13F | Fjarde Ap-fonden /fourth Swedish National Pension Fund | 11.121 | 13,24 | 1.641 | 164.000,00 | ||||
| 2026-02-17 | 13F | ION Fund Management Ltd | 30.000 | 4.427 | ||||||
| 2025-11-07 | 13F | Sierra Ocean, Llc | 0 | -100,00 | 0 | |||||
| 2026-01-08 | 13F | Fulton Bank, N.a. | 3.356 | -5,09 | 495 | -27,63 | ||||
| 2026-01-29 | 13F | China Universal Asset Management Co., Ltd. | 4.500 | -18,18 | 664 | -37,65 | ||||
| 2026-01-14 | 13F | Inflection Point Investments LLP | 0 | -100,00 | 0 | -100,00 | ||||
| 2026-02-04 | 13F | Swiss Life Asset Management Ltd | 2.807 | -20,32 | 414 | -39,30 | ||||
| 2026-04-13 | 13F | True Wealth Design, LLC | 120 | 1.900,00 | 8 | |||||
| 2026-01-23 | 13F | Assetmark, Inc | 7.324 | 40,98 | 1.081 | 7,36 | ||||
| 2026-02-05 | 13F | Bessemer Group Inc | 6.636 | -0,12 | 1 | -100,00 | ||||
| 2026-02-13 | 13F | Citigroup Inc | Put | 0 | -100,00 | 0 | -100,00 | |||
| 2026-02-12 | 13F | Steward Partners Investment Advisory, Llc | 212 | -40,45 | 31 | -54,41 | ||||
| 2026-02-17 | 13F | Voleon Capital Management Lp | 24.655 | 3.638 | ||||||
| 2026-01-28 | 13F | Klp Kapitalforvaltning As | 13.950 | 0,72 | 2.058 | -23,27 | ||||
| 2026-02-02 | 13F | Cornerstone Planning Group LLC | 72 | -36,28 | 9 | -59,09 | ||||
| 2026-01-26 | 13F | Chicago Capital, LLC | 3.886 | 61,58 | 573 | 23,23 | ||||
| 2025-10-21 | 13F | Financiere des Professionnels - Fonds d,investissement inc. | 0 | -100,00 | 0 | |||||
| 2026-02-09 | 13F | Hantz Financial Services, Inc. | 13.929 | -14,32 | 2 | -33,33 | ||||
| 2026-04-07 | 13F | CoreCap Advisors, LLC | 7 | -98,20 | 0 | -100,00 | ||||
| 2026-02-12 | 13F | Mount Yale Investment Advisors, LLC | 1.937 | 286 | ||||||
| 2026-01-26 | 13F | AE Wealth Management LLC | 0 | -100,00 | 0 | |||||
| 2026-02-03 | 13F | Connable Office Inc | 3.329 | 0,00 | 491 | -23,76 | ||||
| 2026-03-12 | 13F/A | Peak6 Llc | Call | 3.500 | -76,19 | 516 | -81,88 | |||
| 2026-02-18 | 13F | Mackenzie Financial Corp | 2.823 | 0,43 | 409 | -24,82 | ||||
| 2026-02-12 | 13F | CIBC Private Wealth Group, LLC | 125.868 | -35,63 | 18.573 | -50,96 | ||||
| 2025-11-14 | 13F | Joho Capital Llc | 0 | -100,00 | 0 | |||||
| 2026-02-02 | 13F | Oppenheimer Asset Management Inc. | 1.519 | 25,12 | 224 | -4,68 | ||||
| 2025-11-14 | 13F | Moore Capital Management, Lp | 0 | -100,00 | 0 | |||||
| 2025-11-10 | 13F | Fortis Capital Management LLC | 0 | -100,00 | 0 | -100,00 | ||||
| 2025-11-17 | 13F | LGT Financial Advisors LLC | 0 | -100,00 | 0 | -100,00 | ||||
| 2026-02-11 | 13F | Spark Investment Management LLC | 5.900 | 0,00 | 871 | -23,82 | ||||
| 2026-02-17 | 13F | Summit Partners Public Asset Management, Llc | 0 | -100,00 | 0 | |||||
| 2025-11-05 | 13F | Alps Advisors Inc | 0 | -100,00 | 0 | |||||
| 2026-02-04 | 13F | Tsfg, Llc | 11 | -47,62 | 0 | |||||
| 2026-02-13 | 13F | Van Eck Associates Corp | 12.597 | -5,65 | 2 | -50,00 | ||||
| 2025-11-13 | 13F | Riggs Asset Managment Co. Inc. | 0 | -100,00 | 0 | |||||
| 2026-01-23 | 13F | Gibbs Wealth Management | 2.499 | -16,08 | 370 | -35,94 | ||||
| 2025-11-14 | 13F/A | Massar Capital Management, LP | 0 | -100,00 | 0 | |||||
| 2026-02-11 | 13F | Vestcor Inc | 680 | 0,00 | 0 | |||||
| 2026-02-17 | 13F | Creative Planning | 7.415 | 100,35 | 1.094 | 52,79 | ||||
| 2026-02-11 | 13F | Parallel Advisors, LLC | 463 | 3,58 | 68 | -20,93 | ||||
| 2026-02-13 | 13F | National Bank Of Canada /fi/ | 10.358 | 0,63 | 1.528 | -23,38 | ||||
| 2026-02-17 | 13F | Ameriprise Financial Inc | 162.996 | -8,09 | 24.052 | -29,98 | ||||
| 2026-02-05 | 13F | Cambridge Investment Research Advisors, Inc. | 2.734 | -20,59 | 0 | |||||
| 2026-02-13 | 13F | Walleye Capital LLC | Call | 10.300 | 106,00 | 1.520 | 56,92 | |||
| 2026-02-13 | 13F | Walleye Capital LLC | Put | 28.200 | 907,14 | 4.161 | 667,71 | |||
| 2026-01-22 | 13F | Personal Cfo Solutions, Llc | 3.302 | -1,14 | 487 | -24,61 | ||||
| 2026-01-26 | 13F | Private Trust Co Na | 7 | 0,00 | 1 | 0,00 | ||||
| 2026-02-13 | 13F | Dai-Ichi Life Insurance Company, Ltd | 0 | -100,00 | 0 | |||||
| 2026-02-17 | 13F | Tremblant Capital Group | 654.848 | 272,43 | 96.629 | 183,74 | ||||
| 2026-02-18 | 13F | Sunstone Asset Management, L.P. | 11.641 | 1.718 | ||||||
| 2026-02-12 | 13F | Senvest Management, LLC | 0 | -100,00 | 0 | -100,00 | ||||
| 2025-11-10 | 13F | Transatlantique Private Wealth Llc | 0 | -100,00 | 0 | -100,00 | ||||
| 2026-02-17 | 13F | Trexquant Investment LP | 109.661 | 570,67 | 16.182 | 410,93 | ||||
| 2026-01-30 | 13F | Values First Advisors, Inc. | 0 | -100,00 | 0 | -100,00 | ||||
| 2026-02-02 | 13F | Danske Bank A/s | 7.700 | 5,48 | 1.136 | -19,60 | ||||
| 2026-02-04 | 13F | Ground Swell Capital, LLC | 0 | -100,00 | 0 | |||||
| 2026-02-11 | 13F | CenterBook Partners LP | 12.433 | 1.835 | ||||||
| 2026-02-13 | 13F | Hel Ved Capital Management Ltd | 8.105 | -21,04 | 1.196 | -39,89 | ||||
| 2025-10-22 | 13F | Geneos Wealth Management Inc. | 0 | -100,00 | 0 | |||||
| 2026-01-26 | 13F | La Banque Postale Asset Management SA | 13.401 | -15,22 | 1.977 | -35,41 | ||||
| 2026-02-10 | 13F | Root Financial Partners, LLC | 26 | 225,00 | 4 | 200,00 | ||||
| 2026-02-13 | 13F | Rhumbline Advisers | 10.275 | -5,13 | 1.516 | -27,71 | ||||
| 2026-02-13 | 13F | Headlands Technologies LLC | 22.558 | 305,79 | 3.329 | 209,29 | ||||
| 2026-02-17 | 13F | Parkwood LLC | 27.148 | -23,27 | 4 | -33,33 | ||||
| 2026-02-06 | 13F | Prescott Group Capital Management, L.l.c. | 7.000 | 0,00 | 1.033 | -23,84 | ||||
| 2026-02-04 | 13F | Argos Wealth Advisors, LLC | 1.405 | 207 | ||||||
| 2026-02-17 | 13F | LMR Partners LLP | Put | 8.400 | 0,00 | 1.240 | -23,80 | |||
| 2026-02-17 | 13F | Sonnipe Ltd | 1.978.479 | -3,06 | 291.944 | -26,15 | ||||
| 2026-02-17 | 13F | LMR Partners LLP | 3.391 | 45,60 | 500 | 10,86 | ||||
| 2026-02-13 | 13F | American Century Companies Inc | 6.281 | 23,76 | 927 | -5,70 | ||||
| 2026-02-17 | 13F | LMR Partners LLP | Call | 10.900 | 0,00 | 1.608 | -23,83 | |||
| 2025-11-14 | 13F | Axiom International Investors Llc /de | 0 | -100,00 | 0 | |||||
| 2026-02-17 | 13F | Snowden Capital Advisors LLC | 4.995 | 2,59 | 737 | -21,85 | ||||
| 2026-02-09 | 13F | Huntington National Bank | 307 | 6.040,00 | 45 | |||||
| 2026-02-11 | 13F | Simplex Trading, Llc | 0 | -100,00 | 0 | |||||
| 2026-02-17 | 13F | Lombard Odier Asset Management (USA) Corp | 0 | -100,00 | 0 | |||||
| 2026-02-13 | 13F | Parkside Financial Bank & Trust | 5 | 66,67 | 1 | |||||
| 2026-02-17 | 13F | Cadian Capital Management, Lp | 0 | -100,00 | 0 | |||||
| 2026-02-17 | 13F | XTX Topco Ltd | 27.927 | 244,78 | 4.121 | 162,76 | ||||
| 2026-02-06 | 13F | Global Retirement Partners, LLC | 26 | -40,91 | 4 | -62,50 | ||||
| 2026-02-02 | 13F | Equitable Trust Co | 9.608 | -0,71 | 1.418 | -24,39 | ||||
| 2026-01-14 | 13F | Congress Park Capital LLC | 0 | -100,00 | 0 | -100,00 | ||||
| 2026-02-13 | 13F | Walleye Capital LLC | 27.808 | 734,32 | 4.103 | 536,12 | ||||
| 2026-02-13 | 13F | First Trust Advisors Lp | 0 | -100,00 | 0 | |||||
| 2026-02-13 | 13F | Neuberger Berman Group LLC | 466.356 | -22,31 | 68.815 | -40,83 | ||||
| 2026-02-13 | 13F | Victory Capital Management Inc | 11.278 | 52,82 | 1.664 | 16,45 | ||||
| 2026-02-17 | 13F | Tower Research Capital LLC (TRC) | 11 | -96,18 | 2 | -98,18 | ||||
| 2026-02-12 | 13F | Advisors Asset Management, Inc. | 545 | 25,29 | 80 | -4,76 | ||||
| 2026-02-02 | 13F | Truist Financial Corp | 4.406 | -19,66 | 650 | -38,79 | ||||
| 2026-02-24 | 13F | DGS Capital Management, LLC | 1.922 | 36,99 | 284 | 4,43 | ||||
| 2026-04-07 | 13F | Signaturefd, Llc | 1.124 | 124,80 | 78 | 5,48 | ||||
| 2026-01-26 | 13F | Taylor Frigon Capital Management LLC | 14.662 | 8,26 | 2.164 | -17,54 | ||||
| 2026-02-17 | 13F | Amundi | 525.013 | 2,64 | 77.471 | -19,72 | ||||
| 2026-02-10 | 13F | Quantbot Technologies LP | 10.741 | -70,32 | 1.585 | -77,40 | ||||
| 2026-02-13 | 13F | Eventide Asset Management, Llc | 91.472 | -1,23 | 13.496 | -24,84 | ||||
| 2026-02-13 | 13F | Public Employees Retirement Association Of Colorado | 7.000 | 0,00 | 1 | 0,00 | ||||
| 2025-11-14 | 13F | Cubist Systematic Strategies, LLC | Call | 0 | -100,00 | 0 | -100,00 | |||
| 2026-02-13 | 13F | Ranger Investment Management, L.P. | 0 | -100,00 | 0 | |||||
| 2026-02-24 | 13F/A | Pacer Advisors, Inc. | 366 | -4,19 | 54 | -26,03 | ||||
| 2026-02-09 | 13F | Wcm Investment Management, Llc | 3.761.924 | -10,10 | 546.683 | -35,19 | ||||
| 2026-02-05 | 13F | Atria Investments Llc | 0 | -100,00 | 0 | |||||
| 2025-11-14 | 13F | Polar Capital Holdings Plc | 0 | -100,00 | 0 | |||||
| 2026-02-17 | 13F | Two Sigma Securities, Llc | 1.673 | 6,09 | 247 | -19,34 | ||||
| 2026-01-14 | 13F | Yarbrough Capital, LLC | 4.381 | 0,00 | 646 | -23,82 | ||||
| 2026-02-04 | 13F | Nicholas Company, Inc. | 0 | -100,00 | 0 | |||||
| 2026-02-11 | 13F | Ibex Investors LLC | 282.000 | 56,67 | 41.612 | 19,35 | ||||
| 2026-02-17 | 13F | Susquehanna International Group, Llp | Put | 596.200 | 46,81 | 87.975 | 11,85 | |||
| 2026-02-17 | 13F | Susquehanna International Group, Llp | Call | 208.400 | -16,77 | 30.752 | -36,59 | |||
| 2025-11-10 | 13F | Jag Capital Management, Llc | 0 | -100,00 | 0 | |||||
| 2025-11-13 | 13F | VGI Partners Ltd | 0 | -100,00 | 0 | |||||
| 2025-11-14 | 13F | Axa S.a. | 0 | -100,00 | 0 | |||||
| 2026-01-23 | 13F | Valley National Advisers Inc | 85 | 0,00 | 0 | |||||
| 2026-02-11 | 13F | Motley Fool Wealth Management, LLC | 14.271 | -17,58 | 2.106 | -37,22 | ||||
| 2026-02-12 | 13F | Bank Of Montreal /can/ | 15.793 | -8,31 | 2.330 | -30,16 | ||||
| 2026-02-17 | 13F | Susquehanna International Group, Llp | 191.625 | 95,52 | 28.276 | 48,95 | ||||
| 2026-02-02 | 13F | Fifth Third Bancorp | 33 | -58,75 | 5 | -73,33 | ||||
| 2026-01-20 | 13F | Stratos Wealth Advisors, LLC | 3.108 | 147,06 | 459 | 88,48 | ||||
| 2026-02-17 | 13F | PharVision Advisers, LLC | 2.871 | 424 | ||||||
| 2025-11-12 | 13F | Left Brain Wealth Management, LLC | 0 | -100,00 | 0 | |||||
| 2026-02-17 | 13F | Susquehanna Fundamental Investments, Llc | 75.757 | 11.179 | ||||||
| 2026-02-13 | 13F | Korea Investment CORP | 15.758 | 5,35 | 2.325 | -19,74 | ||||
| 2026-02-17 | 13F | Quantinno Capital Management LP | 12.418 | 75,57 | 1.832 | 33,82 | ||||
| 2026-01-27 | 13F | Asset Management One Co., Ltd. | 14.703 | -27,06 | 2.138 | -45,29 | ||||
| 2026-01-30 | 13F | Jennison Associates Llc | 0 | -100,00 | 0 | -100,00 | ||||
| 2026-02-13 | 13F | Caitong International Asset Management Co., Ltd | 0 | -100,00 | 0 | |||||
| 2025-10-28 | 13F | BRYN MAWR TRUST Co | 47 | -96,53 | 9 | -97,89 | ||||
| 2026-02-12 | 13F | BlackRock, Inc. | 2.352.011 | 22,35 | 347.063 | -6,79 | ||||
| 2026-01-23 | 13F | Oak Ridge Investments Llc | 0 | -100,00 | 0 | |||||
| 2026-02-13 | 13F | Entropy Technologies, LP | 13.100 | 1.933 | ||||||
| 2025-10-20 | 13F | Merit Financial Group, LLC | 0 | -100,00 | 0 | |||||
| 2026-02-10 | 13F | Envestnet Asset Management Inc | 172.531 | -20,92 | 25.459 | -39,76 | ||||
| 2026-02-13 | 13F | Kilter Group LLC | 0 | -100,00 | 0 | |||||
| 2026-02-12 | 13F | Wealthspire Advisors, LLC | 0 | -100,00 | 0 | |||||
| 2026-02-13 | 13F | Thornburg Investment Management Inc | 41.714 | 95,84 | 6.155 | 49,21 | ||||
| 2025-11-13 | 13F | Tairen Capital Ltd | 0 | -100,00 | 0 | |||||
| 2026-02-17 | 13F | Glenmede Trust Co Na | 5.029 | -1,89 | 742 | -40,45 | ||||
| 2026-02-18 | 13F/A | Delta Global Management LP | 0 | -100,00 | 0 | -100,00 | ||||
| 2026-02-10 | 13F | BW Gestao de Investimentos Ltda. | 18.701 | -42,49 | 2.760 | -56,19 | ||||
| 2026-02-11 | 13F | Deutsche Bank Ag\ | 199.118 | 121,80 | 29.382 | 68,97 | ||||
| 2026-02-17 | 13F | Russell Investments Group, Ltd. | 11.846 | -50,75 | 1.747 | -62,51 | ||||
| 2026-02-18 | 13F | GWM Advisors LLC | 61 | -7,58 | 9 | -25,00 | ||||
| 2026-01-21 | 13F | Y.D. More Investments Ltd | 0 | -100,00 | 0 | |||||
| 2026-02-11 | 13F | Fox Run Management, L.l.c. | 5.073 | -47,54 | 749 | -60,04 | ||||
| 2026-02-12 | 13F | Counterpoint Mutual Funds LLC | 3.438 | 75,14 | 507 | 33,42 | ||||
| 2025-11-14 | 13F | Honeycomb Asset Management LP | 0 | -100,00 | 0 | |||||
| 2026-01-28 | 13F | Migdal Insurance & Financial Holdings Ltd. | 139.009 | 75,94 | 21 | 33,33 | ||||
| 2026-02-17 | 13F | Public Employees Retirement System Of Ohio | 2.000 | 5,26 | 295 | -19,84 | ||||
| 2026-04-10 | 13F | Viking Fund Management Llc | 0 | -100,00 | 0 | -100,00 | ||||
| 2026-01-26 | 13F | Generali Investments Towarzystwo Funduszy Inwestycyjnych | 18.500 | 42,31 | 2.730 | 8,42 | ||||
| 2025-11-14 | 13F | Sphera Management Technology Funds Ltd | 0 | -100,00 | 0 | |||||
| 2026-02-10 | 13F | Daiwa Securities Group Inc. | 3.811 | 5,54 | 1 | |||||
| 2026-02-12 | 13F | Ensign Peak Advisors, Inc | 36.789 | 6,89 | 5.429 | -18,57 | ||||
| 2025-11-14 | 13F | Kirtland Hills Capital Management, Llc | 0 | -100,00 | 0 | |||||
| 2026-02-06 | 13F | Gsa Capital Partners Llp | 2.449 | 0 | ||||||
| 2026-02-10 | 13F | TenCore Partners, LP | 127.890 | -9,55 | 18.871 | -31,09 | ||||
| 2026-02-10 | 13F | Hazlett, Burt & Watson, Inc. | 295 | 0,00 | 0 | |||||
| 2026-02-13 | 13F | Osmosis Investment Management UK Ltd | 24.865 | 3.669 | ||||||
| 2026-02-13 | 13F | Vontobel Holding Ltd. | 0 | -100,00 | 0 | |||||
| 2026-02-23 | 13F | Virtu Financial LLC | 0 | -100,00 | 0 | -100,00 | ||||
| 2026-02-13 | 13F | Mml Investors Services, Llc | 17.801 | -2,27 | 2.627 | -25,57 | ||||
| 2026-02-12 | 13F | Nuveen, LLC | 95.207 | 1,91 | 14.049 | -22,37 | ||||
| 2025-11-17 | 13F | PDT Partners, LLC | 0 | -100,00 | 0 | -100,00 | ||||
| 2026-02-11 | 13F | Capital World Investors | 3.286.461 | 91,38 | 484.950 | 45,80 | ||||
| 2026-02-12 | 13F | Hrt Financial Lp | 16.959 | -57,54 | 3 | -71,43 | ||||
| 2026-02-13 | 13F | Aigen Investment Management, Lp | 3.083 | 186,79 | 455 | 118,27 | ||||
| 2026-01-29 | 13F | Rakuten Securities, Inc. | 174 | -73,23 | 26 | -80,00 | ||||
| 2025-11-17 | 13F | Alyeska Investment Group, L.P. | 0 | -100,00 | 0 | -100,00 | ||||
| 2025-10-20 | 13F | Diversified Trust Co | 0 | -100,00 | 0 | -100,00 | ||||
| 2025-10-24 | 13F | Opal Wealth Advisors, LLC | 0 | -100,00 | 0 | -100,00 | ||||
| 2026-02-04 | 13F | Bailard, Inc. | 1.835 | -29,53 | 271 | -46,43 | ||||
| 2026-02-17 | 13F | Schonfeld Strategic Advisors LLC | 0 | -100,00 | 0 | |||||
| 2026-02-18 | 13F | State of Tennessee, Treasury Department | 73.539 | -29,61 | 8.439 | -58,30 | ||||
| 2026-02-17 | 13F | Capital Fund Management S.a. | 89.151 | 13.155 | ||||||
| 2026-02-17 | 13F | Benchstone Capital Management LP | 0 | -100,00 | 0 | |||||
| 2026-02-13 | 13F | JustInvest LLC | 2.657 | -21,55 | 392 | -41,67 | ||||
| 2026-02-13 | 13F | Ubs Asset Management Americas Inc | 184.258 | 27.189 | ||||||
| 2026-02-17 | 13F | Scientech Research LLC | 2.240 | -48,15 | 331 | -60,53 | ||||
| 2026-01-30 | 13F/A | M&t Bank Corp | 10.351 | -15,38 | 1.528 | -35,54 | ||||
| 2026-02-13 | 13F | Kestra Advisory Services, LLC | 0 | -100,00 | 0 | |||||
| 2026-02-13 | 13F | Resources Investment Advisors, LLC. | 2.451 | 2,98 | 362 | -21,52 | ||||
| 2026-02-17 | 13F | Xn Lp | 0 | -100,00 | 0 | |||||
| 2026-01-21 | 13F | Rheos Capital Works Inc. | 0 | -100,00 | 0 | -100,00 | ||||
| 2026-01-26 | 13F | KBC Group NV | 1.942 | 0,00 | 0 | |||||
| 2026-02-17 | 13F | Limestone Investment Advisors LP | Put | 0 | -100,00 | 0 | -100,00 | |||
| 2026-02-12 | 13F | Quadrant Capital Group Llc | 1.896 | 5.166,67 | 280 | 4.550,00 | ||||
| 2026-04-07 | 13F | Farther Finance Advisors, LLC | 949 | 29,12 | 65 | -40,74 | ||||
| 2026-02-05 | 13F | DnB Asset Management AS | 6.400 | -2,05 | 944 | -25,38 | ||||
| 2026-01-23 | 13F | Brown, Lisle/cummings, Inc. | 0 | -100,00 | 0 | |||||
| 2026-02-10 | 13F | Norges Bank | 540.720 | 79.789 | ||||||
| 2026-02-17 | 13F | Worldquant Millennium Advisors Llc | 56.741 | 8.373 | ||||||
| 2026-02-10 | 13F | Acadian Asset Management Llc | 15.742 | 579,71 | 2 | |||||
| 2025-11-14 | 13F | AXA Investment Managers S.A. | 77.280 | 14.968 | ||||||
| 2026-02-17 | 13F | Cape Investment Advisory, Inc. | 16 | 77,78 | 2 | 100,00 | ||||
| 2026-01-21 | 13F | SJS Investment Consulting Inc. | 3 | 0 | ||||||
| 2026-02-09 | 13F | Geode Capital Management, Llc | 438.076 | 10,79 | 64.295 | -15,56 | ||||
| 2026-02-03 | 13F | SBI Securities Co., Ltd. | 563 | -69,93 | 83 | -77,07 | ||||
| 2026-02-17 | 13F | Boothbay Fund Management, Llc | 2.794 | 412 | ||||||
| 2026-02-17 | 13F | Oddo Bhf Asset Management Sas | 0 | -100,00 | 0 | |||||
| 2026-02-13 | 13F | Alberta Investment Management Corp | 6.400 | 0,00 | 944 | -23,81 | ||||
| 2026-02-13 | 13F | Sterling Capital Management LLC | 69 | -99,26 | 10 | -99,45 | ||||
| 2025-11-14 | 13F | Consolidated Press International Holdings Ltd | 51.554 | 26,70 | 9.985 | -21,97 | ||||
| 2026-02-17 | 13F | State Of Wisconsin Investment Board | 15.100 | 0,67 | 2.228 | -23,30 | ||||
| 2026-02-13 | 13F | Rafferty Asset Management, LLC | 0 | -100,00 | 0 | |||||
| 2026-02-17 | 13F | Optimus Prime Fund Management Co., Ltd. | 70.000 | 10.329 | ||||||
| 2026-02-13 | 13F | Transamerica Financial Advisors, Inc. | 7 | 1 | ||||||
| 2026-02-13 | 13F | Citigroup Inc | 397.340 | 78,03 | 58.631 | 35,63 | ||||
| 2025-10-31 | 13F | Whittier Trust Co Of Nevada Inc | 0 | -100,00 | 0 | |||||
| 2026-02-13 | 13F | Healthcare Of Ontario Pension Plan Trust Fund | 36.742 | 5.422 | ||||||
| 2026-02-17 | 13F | Wellington Management Group Llp | 119.649 | -42,41 | 17.655 | -56,12 | ||||
| 2026-02-13 | 13F | Royal London Asset Management Ltd | 1.792 | 8,47 | 264 | -17,24 | ||||
| 2026-02-11 | 13F | Empowered Funds, LLC | 336 | 50 | ||||||
| 2026-02-11 | 13F | Janney Montgomery Scott LLC | 0 | -100,00 | 0 | |||||
| 2025-11-13 | 13F | Promus Capital, LLC | 0 | -100,00 | 0 | |||||
| 2026-01-09 | 13F | Assenagon Asset Management S.A. | 488.056 | -0,50 | 72.018 | -24,20 | ||||
| 2026-02-17 | 13F | ClearAlpha Technologies LP | 0 | -100,00 | 0 | |||||
| 2026-02-11 | 13F | Clearbridge Investments, LLC | 187.671 | -22,80 | 27.693 | -41,19 | ||||
| 2025-11-13 | 13F | Vise Technologies, Inc. | 0 | -100,00 | 0 | -100,00 | ||||
| 2026-01-30 | 13F | American Capital Advisory, LLC | 1 | 0,00 | 0 | |||||
| 2025-11-04 | 13F | Umb Bank N A/mo | 0 | -100,00 | 0 | |||||
| 2025-10-30 | 13F | Rakuten Investment Management, Inc. | 0 | -100,00 | 0 | |||||
| 2026-01-14 | 13F | Wincap Financial Llc | 0 | -100,00 | 0 | -100,00 | ||||
| 2026-02-04 | 13F | Pier 88 Investment Partners Llc | 5.260 | 15,60 | 776 | -11,92 | ||||
| 2026-02-09 | 13F | Mediolanum International Funds Ltd | 26.228 | 36,36 | 3.811 | -1,70 | ||||
| 2026-02-13 | 13F | Y-Intercept (Hong Kong) Ltd | 69.125 | 10.200 | ||||||
| 2026-02-12 | 13F | NZS Capital, LLC | 16.646 | -74,43 | 2.456 | -80,52 | ||||
| 2025-11-13 | 13F | Glenmede Investment Management, LP | 4.972 | -3,42 | 963 | -40,48 | ||||
| 2026-02-12 | 13F | New York State Common Retirement Fund | 55.201 | 61,35 | 8.145 | 22,92 | ||||
| 2026-01-28 | 13F | City State Bank | 45 | 0,00 | 7 | -25,00 | ||||
| 2025-11-14 | 13F | 3G Capital Partners LP | 0 | -100,00 | 0 | -100,00 | ||||
| 2026-02-12 | 13F | Qtron Investments LLC | 0 | -100,00 | 0 | |||||
| 2025-11-14 | 13F | Susquehanna Portfolio Strategies, LLC | 0 | -100,00 | 0 | -100,00 | ||||
| 2026-01-27 | 13F | Bayforest Capital Ltd | 0 | -100,00 | 0 | |||||
| 2026-02-13 | 13F | Clal Insurance Enterprises Holdings Ltd | 882 | 0,00 | 0 | |||||
| 2026-02-13 | 13F | Sands Capital Ventures, LLC | 67.868 | 16,34 | 10.015 | -11,37 | ||||
| 2025-10-15 | 13F | Manchester Financial Inc | 0 | -100,00 | 0 | -100,00 | ||||
| 2026-02-06 | 13F | VSM Wealth Advisory, LLC | 0 | -100,00 | 0 | |||||
| 2026-02-17 | 13F | Summit Trail Advisors, Llc | 15.878 | -59,12 | 2.343 | -68,86 | ||||
| 2025-11-12 | 13F | NewSquare Capital LLC | 0 | -100,00 | 0 | |||||
| 2025-11-14 | 13F | Aragon Global Management, LP | 0 | -100,00 | 0 | -100,00 | ||||
| 2026-02-11 | 13F | Winton Capital Group Ltd | 0 | -100,00 | 0 | |||||
| 2025-11-12 | 13F | APG Asset Management US Inc. | 0 | -100,00 | 0 | |||||
| 2026-04-13 | 13F | Wolff Wiese Magana Llc | 19 | 0,00 | 1 | -50,00 | ||||
| 2026-03-04 | 13F | SHP Wealth Management | 5 | 1 | ||||||
| 2026-02-04 | 13F | Virginia Retirement Systems Et Al | 3.100 | 457 | ||||||
| 2026-02-06 | 13F | BloombergSen Inc. | 11.772 | -10,07 | 1.737 | -31,48 | ||||
| 2026-02-13 | 13F | MAI Capital Management | 70 | 7,69 | 10 | -16,67 | ||||
| 2026-01-08 | 13F | Nordea Investment Management Ab | 49.093 | -84,98 | 7.172 | -88,62 | ||||
| 2026-02-17 | 13F | Balyasny Asset Management Llc | 0 | -100,00 | 0 | |||||
| 2026-02-17 | 13F | Balyasny Asset Management Llc | Call | 0 | -100,00 | 0 | ||||
| 2026-02-17 | 13F | Octahedron Capital Management L.P. | 17.800 | -71,24 | 2.627 | -78,10 | ||||
| 2026-02-13 | 13F | Blueshift Asset Management, LLC | 8.467 | 244,05 | 1.249 | 162,39 | ||||
| 2025-11-06 | 13F | New York Life Investment Management Llc | 0 | -100,00 | 0 | |||||
| 2026-02-03 | 13F | Mitsubishi UFJ Kokusai Asset Management Co., Ltd. | 95.239 | 12,27 | 13.659 | -16,87 | ||||
| 2026-04-13 | 13F | IFP Advisors, Inc | 1.281 | 3,31 | 89 | -51,65 | ||||
| 2026-02-17 | 13F | Alliancebernstein L.p. | 52.257 | -87,86 | 7.711 | -90,75 | ||||
| 2026-01-30 | 13F | Mitsubishi UFJ Trust & Banking Corp | 20.575 | 11,23 | 3.036 | -15,24 | ||||
| 2026-01-21 | 13F | Sound Income Strategies, LLC | 1 | 0 | ||||||
| 2026-01-27 | 13F | Pekao Towarzystwo Funduszy Inwestycyjnych S.A. | 10.835 | 1.599 | ||||||
| 2026-02-17 | 13F | Perbak Capital Partners LLP | 2.059 | -48,33 | 304 | -60,70 | ||||
| 2026-03-11 | 13F | DUTCH ASSET Corp | 2.194 | 0 | ||||||
| 2026-01-26 | 13F | PFG Investments, LLC | 0 | -100,00 | 0 | |||||
| 2026-02-17 | 13F | FIL Ltd | 61.657 | 9.098 | ||||||
| 2026-02-17 | 13F | Limestone Investment Advisors LP | Call | 0 | -100,00 | 0 | -100,00 | |||
| 2026-02-12 | 13F | Cloud Capital Management, LLC | 0 | -100,00 | 0 | |||||
| 2026-02-17 | 13F | Freestone Grove Partners LP | 0 | -100,00 | 0 | |||||
| 2026-02-13 | 13F | Marshall Wace, Llp | 0 | -100,00 | 0 | |||||
| 2026-02-11 | 13F | Curio Wealth, Llc | 4 | 1 | ||||||
| 2026-02-12 | 13F | Johnson Financial Group, Inc. | 0 | -100,00 | 0 | |||||
| 2025-11-14 | 13F | Sora Investors Llc | 0 | -100,00 | 0 | |||||
| 2026-02-10 | 13F | Foundations Investment Advisors, LLC | 0 | -100,00 | 0 | |||||
| 2026-02-03 | 13F | Ethic Inc. | 1.417 | -33,57 | 209 | -49,39 | ||||
| 2026-01-05 | 13F | Park Avenue Securities Llc | 0 | -100,00 | 0 | |||||
| 2026-02-02 | 13F | Alliance Wealth Advisors, LLC /UT | 0 | -100,00 | 0 | |||||
| 2026-02-17 | 13F | Jump Financial, LLC | 39.781 | 1.683,90 | 5.870 | 1.261,95 | ||||
| 2026-01-16 | 13F | Crewe Advisors LLC | 12 | 2 | ||||||
| 2026-02-17 | 13F | Disciplined Growth Investors Inc /mn | 72.949 | 10.764 | ||||||
| 2026-02-17 | 13F | Oxford Asset Management Llp | 0 | -100,00 | 0 | -100,00 | ||||
| 2026-01-30 | 13F | State of New Jersey Common Pension Fund D | 19.791 | 6,45 | 2.920 | -18,89 | ||||
| 2026-01-20 | 13F | Rubicon Global Capital Ltd | 1.442.900 | 0,00 | 212.914 | -23,82 | ||||
| 2025-11-14 | 13F | Diker Management Llc | 0 | -100,00 | 0 | |||||
| 2026-01-30 | 13F | Activest Wealth Management | 0 | -100,00 | 0 | -100,00 | ||||
| 2026-02-10 | 13F | Andar Capital Management HK Ltd | 15.343 | 2.264 | ||||||
| 2026-01-28 | 13F | Eagle Global Advisors Llc | 0 | -100,00 | 0 | -100,00 | ||||
| 2026-02-13 | 13F | Macquarie Group Ltd | 4.301 | -98,56 | 635 | -98,90 | ||||
| 2026-02-05 | 13F | ANTIPODES PARTNERS Ltd | 2.381 | 82,73 | 351 | 39,29 | ||||
| 2026-02-12 | 13F | Voya Investment Management Llc | 29.659 | -89,31 | 4.376 | -91,86 | ||||
| 2026-02-17 | 13F | Bienville Capital Management, LLC | 234.818 | 15,10 | 34.650 | -12,31 | ||||
| 2026-04-07 | 13F | AMS Capital Ltda | 0 | -100,00 | 5 | 0,00 | ||||
| 2025-11-10 | 13F | Dakota Wealth Management | 0 | -100,00 | 0 | |||||
| 2026-02-13 | 13F | ShawSpring Partners LLC | 253.959 | -32,14 | 37.474 | -48,30 | ||||
| 2026-02-18 | 13F | SkyView Investment Advisors, LLC | 2.658 | 0,91 | 0 | |||||
| 2025-11-14 | 13F | Shay Capital LLC | 0 | -100,00 | 0 | |||||
| 2026-02-06 | 13F | Vestmark Advisory Solutions, Inc. | 1.937 | 286 | ||||||
| 2026-02-13 | 13F | Walleye Trading LLC | 19.508 | -20,41 | 2.879 | -39,37 | ||||
| 2026-02-13 | 13F | Integrated Wealth Concepts LLC | 0 | -100,00 | 0 | |||||
| 2026-01-26 | 13F | Mirae Asset Global Investments Co., Ltd. | 303 | -23,29 | 45 | -42,11 | ||||
| 2025-10-24 | 13F | Covenant Partners, LLC | 0 | -100,00 | 0 | |||||
| 2026-04-08 | 13F | Grove Bank & Trust | 11 | 0,00 | 1 | -100,00 | ||||
| 2026-02-04 | 13F | Atlantic Union Bankshares Corp | 670 | -1,47 | 99 | -25,19 | ||||
| 2026-02-13 | 13F | Walleye Trading LLC | Put | 24.300 | -24,77 | 3.586 | -42,70 | |||
| 2026-02-10 | 13F/A | Northwestern Mutual Wealth Management Co | 1.849 | 25,78 | 273 | -4,23 | ||||
| 2026-02-13 | 13F | Walleye Trading LLC | Call | 43.900 | -32,15 | 6.478 | -48,31 | |||
| 2026-02-13 | 13F | BNP Paribas Asset Management Holding S.A. | 697 | 0 | ||||||
| 2026-02-17 | 13F | SageView Advisory Group, LLC | 20 | 3 | ||||||
| 2026-04-10 | 13F | Abound Wealth Management | 2 | -99,01 | 0 | -100,00 | ||||
| 2026-02-11 | 13F | Cerity Partners LLC | 1.963 | -12,48 | 290 | -33,41 | ||||
| 2026-02-18 | 13F | Vident Advisory, LLC | 2.621 | -17,63 | 387 | -37,34 | ||||
| 2026-02-17 | 13F | Dorsal Capital Management, LLC | 425.000 | 0,00 | 62.713 | -23,82 | ||||
| 2026-02-12 | 13F | Custom Index Systems, Llc | 1.556 | 0,00 | 230 | -23,92 | ||||
| 2026-02-12 | 13F | Jane Street Group, Llc | Call | 228.200 | -26,86 | 33.673 | -44,28 | |||
| 2026-01-26 | 13F | Reyes Financial Architecture, Inc. | 0 | -100,00 | 0 | -100,00 | ||||
| 2026-02-12 | 13F | Jane Street Group, Llc | Put | 138.400 | -55,84 | 20.422 | -66,36 | |||
| 2025-10-30 | 13F | Ridgewood Investments LLC | 0 | -100,00 | 0 | |||||
| 2026-02-12 | 13F | Jane Street Group, Llc | 218.057 | 5.313,53 | 32.176 | 4.025,13 | ||||
| 2026-02-13 | 13F | Oberndorf William E | 73.705 | 5,11 | 10.876 | -19,92 | ||||
| 2026-02-13 | 13F | Barclays Plc | Call | 0 | -100,00 | 0 | -100,00 | |||
| 2025-11-14 | 13F | Investors Towarzystwo Funduszy Inwestycyjnych Spolka Akcyjna | 1.250 | 86,57 | 242 | 15,24 | ||||
| 2025-11-14 | 13F | Firsthand Capital Management, Inc. | 0 | -100,00 | 0 | -100,00 | ||||
| 2026-02-12 | 13F | Integrated Quantitative Investments LLC | 5.923 | 13,47 | 874 | -13,65 | ||||
| 2026-02-17 | 13F | Royal Bank Of Canada | 16.122 | -60,05 | 2.379 | -69,57 | ||||
| 2026-02-17 | 13F | Qube Research & Technologies Ltd | 145.255 | 21.434 | ||||||
| 2026-02-05 | 13F | Mesirow Financial Investment Management, Inc. | 0 | -100,00 | 0 | |||||
| 2026-02-13 | 13F | Silicon Valley Capital Partners | 352 | -57,95 | 52 | -68,52 | ||||
| 2026-02-13 | 13F | Centiva Capital, LP | 0 | -100,00 | 0 | |||||
| 2026-02-06 | 13F | HighTower Advisors, LLC | 4.228 | -29,36 | 624 | -46,25 | ||||
| 2026-02-17 | 13F | MIC Capital Management UK LLP | 66.000 | 0,00 | 9.739 | -23,82 | ||||
| 2026-02-13 | 13F | Formula Growth Ltd | 20.000 | 0,00 | 2.951 | -23,81 | ||||
| 2026-02-13 | 13F | Kcm Investment Advisors Llc | 4.937 | 0,00 | 729 | -23,85 | ||||
| 2026-02-13 | 13F | Bridgewater Associates, LP | 239.186 | 19,93 | 35.294 | -8,63 | ||||
| 2026-02-17 | 13F | Summit Partners Public Asset Management, Llc | Call | 0 | -100,00 | 0 | ||||
| 2026-02-17 | 13F | Cetera Investment Advisers | 18.626 | 1,23 | 2.748 | -22,87 | ||||
| 2026-02-13 | 13F | Toroso Investments, LLC | 23.440 | -3,73 | 3.459 | -26,66 | ||||
| 2026-02-12 | 13F | Ankerstar Wealth, LLC | 3 | 0 | ||||||
| 2026-03-12 | 13F/A | Peak6 Llc | 2.268 | -85,54 | 335 | -89,00 | ||||
| 2026-02-13 | 13F | Arrowstreet Capital, Limited Partnership | 10.377 | 1.531 | ||||||
| 2026-03-06 | 13F | Hsbc Holdings Plc | 21.774 | 6,35 | 3.226 | -18,47 | ||||
| 2026-03-12 | 13F/A | Peak6 Llc | Put | 2.300 | -92,01 | 339 | -93,92 | |||
| 2026-02-12 | 13F | Brinker Capital Investments, LLC | 4.036 | -29,18 | 596 | -46,06 | ||||
| 2026-02-17 | 13F | ArrowMark Colorado Holdings LLC | 85.892 | -52,00 | 12.674 | -63,43 | ||||
| 2026-01-29 | 13F | Nbc Securities, Inc. | 291 | -1,02 | 43 | -31,15 | ||||
| 2026-01-29 | 13F | Pictet Asset Management Holding SA | 17.519 | 37,44 | 2.585 | 4,74 | ||||
| 2026-02-05 | 13F | HighMark Wealth Management LLC | 0 | -100,00 | 0 | |||||
| 2026-02-17 | 13F | Man Group plc | 301.179 | -25,86 | 44.442 | -43,52 | ||||
| 2025-10-30 | 13F | Dilation Capital Management LP | 0 | -100,00 | 0 |
Other Listings
| DE:6B6 | 50,00 € |