Grundlæggende statistik
| Institutionelle aktier (lange) | 68.978.262 - 106,17% (ex 13D/G) - change of -23,38MM shares -25,31% MRQ |
| Institutionel værdi (lang) | $ 4.483.409 USD ($1000) |
Institutionelt ejerskab og aktionærer
Lantheus Holdings, Inc. (US:LNTH) har 397 institutionelle ejere og aktionærer, der har indsendt 13D/G- eller 13F-formularer til Securities Exchange Commission (SEC). Disse institutioner har i alt 68,978,262 aktier. Største aktionærer omfatter BlackRock, Inc., Vanguard Group Inc, Janus Henderson Group Plc, Farallon Capital Management Llc, Fmr Llc, State Street Corp, Morgan Stanley, Geode Capital Management, Llc, Reinhart Partners, Inc., and Dimensional Fund Advisors Lp .
Lantheus Holdings, Inc. (NasdaqGM:LNTH) institutionel ejerskabsstruktur viser aktuelle positioner i virksomheden efter institutioner og fonde, samt seneste ændringer i positionsstørrelse. Større aktionærer kan omfatte individuelle investorer, investeringsforeninger, hedgefonde eller institutioner. Skema 13D angiver, at investoren besidder (eller besidder) mere end 5 % af virksomheden og har til hensigt (eller har til hensigt at) aktivt at forfølge en ændring i forretningsstrategi. Skema 13G indikerer en passiv investering på over 5%.
The share price as of April 1, 2026 is 75,70 / share. Previously, on April 2, 2025, the share price was 97,42 / share. This represents a decline of 22,30% over that period.

Fondens stemningsscore
Fund Sentiment Score (fka Ownership Accumulation Score) finder de aktier, der bliver mest købt af fonde. Det er resultatet af en sofistikeret, multi-faktor kvantitativ model, der identificerer virksomheder med de højeste niveauer af institutionel akkumulering. Scoringsmodellen bruger en kombination af den samlede stigning i oplyste ejere, ændringerne i porteføljeallokeringer i disse ejere og andre målinger. Tallet går fra 0 til 100, hvor højere tal indikerer et højere niveau af akkumulering for sine jævnaldrende, og 50 er gennemsnittet.
Opdateringsfrekvens: Dagligt
Se Ownership Explorer, som giver en liste over højest rangerende virksomheder.
AI+ Ask Fintel’s AI assistant about Lantheus Holdings, Inc..
Select a question to share a public post with an AI-crafted answer.
Thinking of good questions…
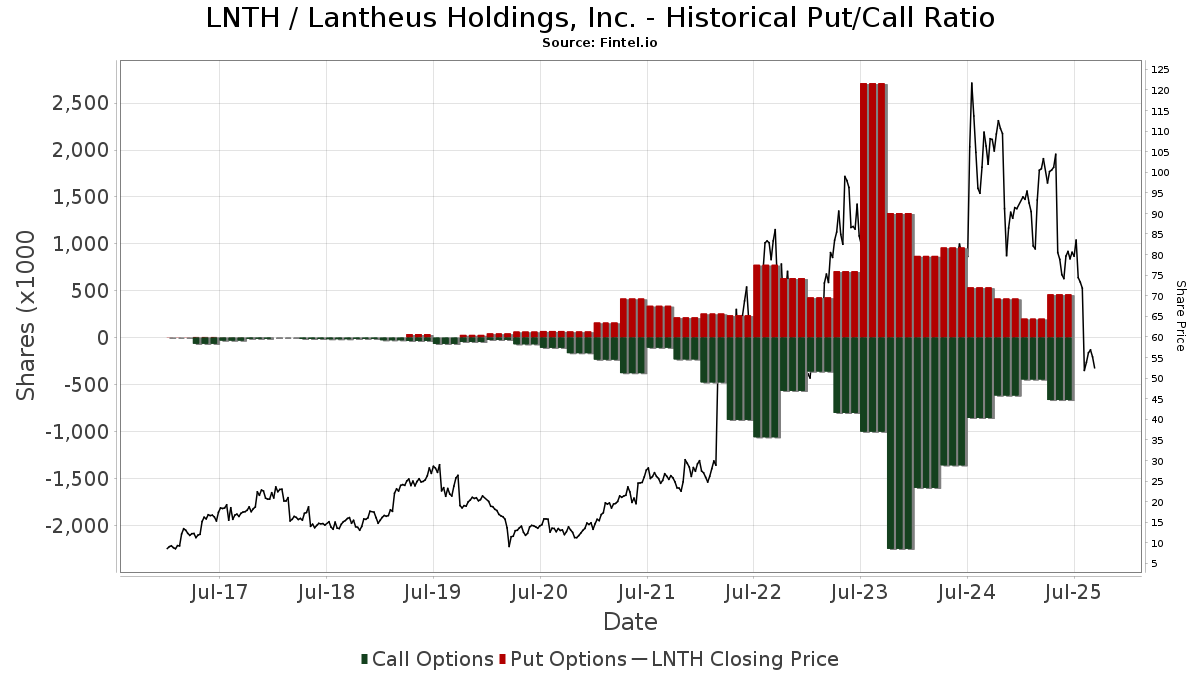
Institutionel Put/Call-forhold
Ud over at indberette standardaktie- og gældsudstedelser skal institutter med mere end 100 mill. aktiver under forvaltning også oplyse deres put- og call-optionsbeholdninger. Da salgsoptioner generelt indikerer negativ stemning, og købsoptioner indikerer positiv stemning, kan vi få en fornemmelse af den overordnede institutionelle stemning ved at plotte forholdet mellem put og kald. Diagrammet til højre viser det historiske put/call-forhold for dette instrument.
Brug af Put/Call Ratio som en indikator for investorernes stemning overvinder en af de vigtigste mangler ved at bruge totalt institutionelt ejerskab, som er, at en betydelig mængde af aktiver under forvaltning investeres passivt for at spore indekser. Passivt forvaltede fonde køber typisk ikke optioner, så indikatoren for put/call-forholdet følger mere nøje følelsen af aktivt forvaltede fonde.
13D/G-arkivering
Vi præsenterer 13D/G ansøgninger separat fra 13F ansøgninger på grund af den forskellige behandling af SEC. 13D/G-ansøgninger kan indgives af grupper af investorer (med én ledende), hvorimod 13F-ansøgninger ikke kan. Dette resulterer i situationer, hvor en investor kan indsende en 13D/G, der rapporterer én værdi for de samlede aktier (der repræsenterer alle de aktier, der ejes af investorgruppen), men derefter indsender en 13F, der rapporterer en anden værdi for de samlede aktier (der udelukkende repræsenterer deres egne) ejendomsret). Det betyder, at aktieejerskab af 13D/G-arkiver og 13F-arkiveringer ofte ikke er direkte sammenlignelige, så vi præsenterer dem separat.
Bemærk: Fra den 16. maj 2021 viser vi ikke længere ejere, der ikke har indsendt en 13D/G inden for det seneste år. Tidligere viste vi den fulde historie af 13D/G-arkiver. Generelt skal enheder, der er forpligtet til at indgive 13D/G-ansøgninger, indgive mindst årligt, før de indsender en afsluttende ansøgning. Dog forlader fonde nogle gange positioner uden at indsende en afsluttende ansøgning (dvs. de afvikler), så visning af den fulde historie resulterede nogle gange i forvirring om det nuværende ejerskab. For at undgå forvirring viser vi nu kun 'aktuelle' ejere - det vil sige - ejere, der har anmeldt inden for det seneste år.
Upgrade to unlock premium data.
| Fil dato | Form | Investor | Forrige Aktier |
Seneste Aktier |
Δ Aktier (Procent) |
Ejendomsret (Procent) |
Δ Ejerskab (Procent) |
|
|---|---|---|---|---|---|---|---|---|
| 2026-03-27 | VANGUARD GROUP INC | 6,973,141 | 0 | -100.00 | 0.00 | -100.00 | ||
| 2026-02-17 | JANUS HENDERSON GROUP PLC | 6,684,737 | 5,707,247 | -14.62 | 8.60 | -12.24 | ||
| 2026-02-12 | MORGAN STANLEY | 3,777,712 | 1,640,837 | -56.57 | 2.50 | -55.36 | ||
| 2025-11-05 | FMR LLC | 5,223,735 | 4,399,523 | -15.78 | 6.50 | -13.33 |
13F og NPORT arkivering
Detaljer om 13F-arkivering er gratis. Detaljer om NP-ansøgninger kræver et premium-medlemskab. Grønne rækker angiver nye positioner. Røde rækker angiver lukkede positioner. Klik på linket ikon for at se den fulde transaktionshistorik.
Opgrader
for at låse premium-data op og eksportere til Excel ![]() .
.
| Fil dato | Kilde | Investor | Type | Gennemsnitlig pris (Øst) |
Aktier | Δ Aktier (%) |
Rapporteret Værdi ($1000) |
Δ Værdi (%) |
Port Alloc (%) |
|
|---|---|---|---|---|---|---|---|---|---|---|
| 2026-02-17 | 13F | Trexquant Investment LP | 0 | -100,00 | 0 | |||||
| 2026-02-11 | 13F | Winnow Wealth Llc | 59 | 0,00 | 4 | 0,00 | ||||
| 2026-02-05 | 13F | Td Private Client Wealth Llc | 31 | 82,35 | 2 | |||||
| 2026-02-04 | 13F | Swiss Life Asset Management Ltd | 3.907 | 0,00 | 260 | 30,00 | ||||
| 2026-02-11 | 13F | Townsquare Capital Llc | 7.622 | 507 | ||||||
| 2026-02-03 | 13F | Bokf, Na | 4.423 | -24,37 | 294 | -1,67 | ||||
| 2026-02-02 | 13F | Equitable Trust Co | 12.865 | 0,00 | 856 | 29,89 | ||||
| 2026-02-05 | 13F | Cambridge Investment Research Advisors, Inc. | 78.082 | 21,36 | 5 | 66,67 | ||||
| 2026-02-09 | 13F | Legal & General Group Plc | 110.496 | -22,36 | 7.354 | 0,74 | ||||
| 2026-02-10 | 13F | Intech Investment Management Llc | 81.221 | 28,17 | 5.405 | 66,31 | ||||
| 2026-02-17 | 13F | MIRAE ASSET GLOBAL ETFS HOLDINGS Ltd. | 33.700 | 2,20 | 2.243 | 32,58 | ||||
| 2025-11-07 | 13F | Shell Asset Management Co | 769 | -58,81 | 0 | |||||
| 2026-02-04 | 13F | UNIVEST FINANCIAL Corp | 0 | -100,00 | 0 | |||||
| 2026-01-23 | 13F | Private Wealth Management Group, LLC | 64 | 100,00 | 4 | 300,00 | ||||
| 2026-02-03 | 13F | Harel Insurance Investments & Financial Services Ltd. | 2.579 | 0 | ||||||
| 2026-02-12 | 13F | Loomis Sayles & Co L P | 162.415 | -50,43 | 10.809 | -35,68 | ||||
| 2026-02-17 | 13F | XTX Topco Ltd | 18.440 | 64,82 | 1.227 | 114,14 | ||||
| 2026-01-15 | 13F | Retirement Systems of Alabama | 172.290 | -1,50 | 11.466 | 27,80 | ||||
| 2026-02-17 | 13F | Captrust Financial Advisors | 22.603 | -2,65 | 1.504 | 26,39 | ||||
| 2026-02-13 | 13F | National Bank Of Canada /fi/ | 90 | 69,81 | 6 | 150,00 | ||||
| 2026-01-07 | 13F | Tealwood Asset Management Inc | 0 | -100,00 | 0 | |||||
| 2026-01-26 | 13F | Cwm, Llc | 333 | -26,65 | 0 | |||||
| 2026-02-12 | 13F | Federation des caisses Desjardins du Quebec | 55 | -98,82 | 4 | -98,74 | ||||
| 2026-02-12 | 13F | Federated Hermes, Inc. | 36.230 | -80,47 | 2.411 | -74,65 | ||||
| 2026-02-17 | 13F | Raymond James Financial Inc | 109.066 | -3,79 | 7.258 | 24,84 | ||||
| 2026-02-13 | 13F | Jacobs Levy Equity Management, Inc | 182.305 | 33,14 | 12.132 | 72,77 | ||||
| 2026-02-17 | 13F | Glenmede Trust Co Na | 0 | -100,00 | 0 | |||||
| 2026-02-24 | 13F | Bell Investment Advisors, Inc | 22 | -8,33 | 1 | 0,00 | ||||
| 2026-02-17 | 13F | EFG International AG | 900 | 60 | ||||||
| 2026-02-11 | 13F | LPL Financial LLC | 76.953 | -16,58 | 5.121 | 8,24 | ||||
| 2026-02-17 | 13F | Gotham Asset Management, LLC | 26.401 | -33,90 | 1.757 | -14,26 | ||||
| 2026-01-30 | 13F | Us Bancorp \de\ | 6.509 | 587,33 | 433 | 802,08 | ||||
| 2026-01-30 | 13F | United Community Bank | 1.100 | -39,39 | 73 | -21,51 | ||||
| 2026-02-13 | 13F | Morgan Stanley | 1.757.569 | -54,68 | 116.966 | -41,20 | ||||
| 2026-02-13 | 13F | Pathstone Holdings, LLC | 12.207 | -23,82 | 812 | -1,10 | ||||
| 2026-02-12 | 13F | BlackRock, Inc. | 8.266.414 | 0,01 | 550.130 | 29,76 | ||||
| 2026-02-03 | 13F | Pier Capital, LLC | 47 | -47,19 | 3 | -25,00 | ||||
| 2026-02-05 | 13F | Bank Julius Baer & Co. Ltd, Zurich | 0 | -100,00 | 0 | -100,00 | ||||
| 2026-02-10 | 13F | Private Wealth Asset Management, LLC | 73 | 0,00 | 5 | 33,33 | ||||
| 2026-02-17 | 13F | Voleon Capital Management Lp | 8.745 | 582 | ||||||
| 2026-02-10 | 13F | 1492 Capital Management LLC | 0 | -100,00 | 0 | |||||
| 2026-02-17 | 13F | Jones Financial Companies Lllp | 1.938 | -48,92 | 129 | -33,33 | ||||
| 2026-02-12 | 13F | Jane Street Group, Llc | 36.562 | -86,49 | 2.433 | -82,47 | ||||
| 2026-02-13 | 13F | Citigroup Inc | 163.806 | 719,93 | 10.901 | 964,55 | ||||
| 2026-02-12 | 13F | Jane Street Group, Llc | Put | 32.700 | -17,22 | 2.176 | 7,46 | |||
| 2026-02-12 | 13F | Wealthspire Advisors, LLC | 0 | -100,00 | 0 | |||||
| 2026-02-12 | 13F | Jane Street Group, Llc | Call | 18.500 | -32,48 | 1.231 | -12,38 | |||
| 2026-02-13 | 13F | Squarepoint Ops LLC | 0 | -100,00 | 0 | -100,00 | ||||
| 2026-01-27 | 13F | WealthCollab, LLC | 300 | -29,41 | 20 | -9,52 | ||||
| 2026-02-12 | 13F | Skopos Labs, Inc. | 4.194 | 282 | ||||||
| 2025-11-14 | 13F | 2Xideas AG | 0 | -100,00 | 0 | |||||
| 2025-11-14 | 13F | Private Capital Management, LLC | Call | 0 | -100,00 | 0 | -100,00 | |||
| 2026-01-20 | 13F | Harbor Capital Advisors, Inc. | 32.596 | 6,04 | 2 | 100,00 | ||||
| 2025-11-14 | 13F | Frontier Capital Management Co Llc | 0 | -100,00 | 0 | |||||
| 2025-11-14 | 13F | Cubist Systematic Strategies, LLC | Call | 34.200 | 2,70 | 1.754 | -35,63 | |||
| 2026-01-08 | 13F | Versant Capital Management, Inc | 388 | 13,45 | 26 | 47,06 | ||||
| 2026-01-07 | 13F | CWA Asset Management Group, LLC | 25.096 | 1.670 | ||||||
| 2026-02-13 | 13F | Allianz Se | 386 | 0,00 | 26 | 31,58 | ||||
| 2026-02-04 | 13F | Pacer Advisors, Inc. | 0 | -100,00 | 0 | |||||
| 2026-02-12 | 13F | South Dakota Investment Council | 19.359 | -7,63 | 1 | 0,00 | ||||
| 2026-02-17 | 13F | Canada Pension Plan Investment Board | 10.200 | -75,83 | 679 | -68,67 | ||||
| 2026-02-17 | 13F | Janus Henderson Group Plc | 5.707.247 | -14,62 | 379.821 | 10,78 | ||||
| 2026-01-28 | 13F | Klp Kapitalforvaltning As | 34.323 | 31,89 | 2.284 | 71,21 | ||||
| 2025-11-12 | 13F | Empirical Asset Management, LLC | 0 | -100,00 | 0 | |||||
| 2026-02-17 | 13F | Balyasny Asset Management Llc | 140.781 | 391,83 | 9.369 | 538,15 | ||||
| 2026-01-23 | 13F | Assetmark, Inc | 118.300 | -0,17 | 7.873 | 29,52 | ||||
| 2025-12-16 | 13F | Lindenwold Advisors | 0 | -100,00 | 0 | |||||
| 2025-10-15 | 13F | Drum Hill Capital, LLC | 0 | -100,00 | 0 | |||||
| 2025-11-13 | 13F | Formula Growth Ltd | 0 | -100,00 | 0 | |||||
| 2025-11-04 | 13F | Lisanti Capital Growth, LLC | 0 | -100,00 | 0 | |||||
| 2026-01-23 | 13F | Sumitomo Mitsui Trust Holdings, Inc. | 0 | -100,00 | 0 | |||||
| 2025-11-04 | 13F | Raleigh Capital Management Inc. | 0 | -100,00 | 0 | |||||
| 2026-01-27 | 13F | Waterfront Wealth Inc. | 18.518 | 0,00 | 1.268 | 19,62 | ||||
| 2026-02-11 | 13F | Los Angeles Capital Management Llc | 588 | 33 | ||||||
| 2026-02-17 | 13F | Delaware Management Holdings, Inc. | 939.997 | 62.557 | ||||||
| 2026-02-17 | 13F | State Of Wisconsin Investment Board | 136.431 | 12,96 | 9.079 | 46,58 | ||||
| 2026-02-10 | 13F | Crescent Grove Advisors, LLC | 21.073 | 0,00 | 1.402 | 29,81 | ||||
| 2025-11-13 | 13F | Boston Partners | 0 | -100,00 | 0 | |||||
| 2026-02-17 | 13F | Advisor Group Holdings, Inc. | 9.317 | -21,11 | 620 | -0,80 | ||||
| 2026-02-17 | 13F | Wiley Bros.-aintree Capital, Llc | 13.853 | -10,14 | 922 | 16,73 | ||||
| 2026-02-17 | 13F | Artisan Partners Limited Partnership | 0 | -100,00 | 0 | |||||
| 2025-11-07 | 13F | Rialto Wealth Management, LLC | 0 | -100,00 | 0 | |||||
| 2026-02-03 | 13F | Farmers & Merchants Investments Inc | 61 | 5,17 | 4 | 100,00 | ||||
| 2025-11-12 | 13F | Westfield Capital Management Co Lp | 0 | -100,00 | 0 | -100,00 | ||||
| 2026-02-11 | 13F | Franklin Resources Inc | 74.096 | 4,08 | 4.931 | 35,06 | ||||
| 2026-02-10 | 13F | Godfrey Financial Associates, Inc. | 18 | 1 | ||||||
| 2026-02-17 | 13F | D. E. Shaw & Co., Inc. | Call | 0 | -100,00 | 0 | ||||
| 2026-01-15 | 13F | Three Seasons Wealth, LLC | 9.602 | 41,04 | 639 | 83,09 | ||||
| 2025-11-14 | 13F | Caption Management, LLC | Put | 0 | -100,00 | 0 | ||||
| 2025-11-14 | 13F | Nelson, Van Denburg & Campbell Wealth Management Group, LLC | 0 | -100,00 | 0 | -100,00 | ||||
| 2025-10-31 | 13F | PFG Investments, LLC | 0 | -100,00 | 0 | -100,00 | ||||
| 2025-10-20 | 13F | Mid-American Wealth Advisory Group, Inc. | 0 | -100,00 | 0 | |||||
| 2025-11-14 | 13F | Caption Management, LLC | Call | 0 | -100,00 | 0 | ||||
| 2026-02-10 | 13F | Goldman Sachs Group Inc | 357.134 | -35,93 | 23.767 | -16,87 | ||||
| 2026-02-03 | 13F | Gallacher Capital Management LLC | 12.381 | -7,52 | 824 | 19,97 | ||||
| 2025-11-04 | 13F | Gitterman Wealth Management, LLC | 0 | -100,00 | 0 | |||||
| 2026-01-13 | 13F | Mather Group, Llc. | 0 | -100,00 | 0 | |||||
| 2026-02-12 | 13F | Front Row Advisors LLC | 13 | 0,00 | 1 | |||||
| 2026-02-12 | 13F | California Public Employees Retirement System | 119.716 | -0,76 | 7.967 | 28,79 | ||||
| 2025-10-21 | 13F | True Wealth Design, LLC | 0 | -100,00 | 0 | |||||
| 2025-11-14 | 13F | Hood River Capital Management LLC | 0 | -100,00 | 0 | -100,00 | ||||
| 2026-02-10 | 13F | Td Asset Management Inc | 711.894 | -10,00 | 47.377 | 16,78 | ||||
| 2026-02-11 | 13F | Fox Run Management, L.l.c. | 0 | -100,00 | 0 | |||||
| 2026-02-04 | 13F | Oregon Public Employees Retirement Fund | 13.259 | -2,93 | 882 | 26,00 | ||||
| 2026-02-17 | 13F | T. Rowe Price Investment Management, Inc. | 50 | 0,00 | 0 | |||||
| 2026-01-23 | 13F | Optima Capital Llc | 9 | 1 | ||||||
| 2025-11-13 | 13F | Riggs Asset Managment Co. Inc. | 0 | -100,00 | 0 | |||||
| 2026-02-04 | 13F | Securian Asset Management, Inc | 4.832 | -5,11 | 322 | 22,99 | ||||
| 2025-10-31 | 13F | Riverwater Partners LLC | 0 | -100,00 | 0 | |||||
| 2025-11-12 | 13F | Pitcairn Co | 0 | -100,00 | 0 | |||||
| 2026-02-17 | 13F | Wellington Management Group Llp | 116.374 | -84,93 | 7.745 | -80,44 | ||||
| 2026-02-02 | 13F | Bay Harbor Wealth Management, LLC | 1 | 0,00 | 0 | |||||
| 2026-02-17 | 13F | Price T Rowe Associates Inc /md/ | 817.247 | 0,66 | 54 | 31,71 | ||||
| 2025-11-12 | 13F | Hohimer Wealth Management, Llc | 0 | -100,00 | 0 | |||||
| 2026-01-29 | 13F | Dunhill Financial, LLC | 1 | 0 | ||||||
| 2026-01-30 | 13F | Richardson Capital Management LLC | 120 | 0,00 | 8 | 16,67 | ||||
| 2026-02-05 | 13F | Bessemer Group Inc | 160 | -43,86 | 0 | |||||
| 2025-11-14 | 13F | Axa S.a. | 0 | -100,00 | 0 | |||||
| 2026-02-12 | 13F | Great Lakes Advisors, Llc | 32.535 | 0,00 | 2.165 | 29,80 | ||||
| 2025-11-13 | 13F | Smith Group Asset Management, LLC | 0 | -100,00 | 0 | |||||
| 2026-02-17 | 13F | Equitable Holdings, Inc. | 3.640 | 242 | ||||||
| 2026-01-23 | 13F | Farther Finance Advisors, LLC | 660 | 71,43 | 44 | 126,32 | ||||
| 2026-02-09 | 13F | New Age Alpha Advisors, LLC | 12.670 | -15,46 | 843 | 9,77 | ||||
| 2026-02-10 | 13F | Eurizon Capital SGR S.p.A. | 1.419 | 95 | ||||||
| 2026-02-11 | 13F | Capital World Investors | 0 | -100,00 | 0 | |||||
| 2026-02-13 | 13F | Heron Bay Capital Management | 24.788 | 47,62 | 1.650 | 91,52 | ||||
| 2026-02-17 | 13F | Numerai GP LLC | 0 | -100,00 | 0 | |||||
| 2025-10-23 | 13F | Venturi Wealth Management, LLC | 0 | -100,00 | 0 | |||||
| 2026-02-10 | 13F | Rothschild Investment Llc | 71 | 255,00 | 5 | 300,00 | ||||
| 2026-01-14 | 13F | USA Financial Portformulas Corp | 8 | 1 | ||||||
| 2026-02-10 | 13F | Bnp Paribas Arbitrage, Sa | 306.723 | -53,48 | 20.412 | -39,64 | ||||
| 2026-02-17 | 13F | Schonfeld Strategic Advisors LLC | 8.610 | 573 | ||||||
| 2026-02-09 | 13F | Fisher Asset Management, LLC | 0 | -100,00 | 0 | |||||
| 2026-02-12 | 13F | Commonwealth Equity Services, Llc | 6.681 | -87,74 | 445 | 22.100,00 | ||||
| 2026-02-13 | 13F | State Street Corp | 2.427.254 | -2,79 | 161.534 | 26,13 | ||||
| 2026-02-06 | 13F | EverSource Wealth Advisors, LLC | 543 | 14,08 | 36 | 50,00 | ||||
| 2026-02-10 | 13F | Thompson Siegel & Walmsley Llc | 234.531 | -14,47 | 16 | 7,14 | ||||
| 2026-02-04 | 13F | LRI Investments, LLC | 1.982 | 132 | ||||||
| 2026-01-28 | 13F | DekaBank Deutsche Girozentrale | 10.551 | 0,00 | 1 | |||||
| 2025-11-14 | 13F | Icon Wealth Advisors, LLC | 0 | -100,00 | 0 | |||||
| 2026-02-05 | 13F | Isthmus Partners, Llc | 38.768 | 60,60 | 2.580 | 108,40 | ||||
| 2026-02-11 | 13F | Twin Tree Management, LP | Call | 12.100 | 0,00 | 805 | 29,84 | |||
| 2025-10-09 | 13F | Whalen Wealth Management Inc. | 0 | -100,00 | 0 | |||||
| 2026-01-15 | 13F | Founders Capital Management | 250 | 0,00 | 17 | 33,33 | ||||
| 2026-02-05 | 13F | SkyOak Wealth, LLC | 63.130 | 8,38 | 4.201 | 40,64 | ||||
| 2026-02-06 | 13F | Larson Financial Group LLC | 658 | 324,52 | 44 | 514,29 | ||||
| 2026-02-12 | 13F | JPL Wealth Management, LLC | 0 | -100,00 | 0 | |||||
| 2026-02-17 | 13F | Fmr Llc | 4.323.526 | 2,97 | 287.731 | 33,60 | ||||
| 2026-01-23 | 13F | Stanley-Laman Group, Ltd. | 75.446 | -5,32 | 5.021 | 22,83 | ||||
| 2026-02-12 | 13F | MetLife Investment Management, LLC | 68.242 | -7,54 | 4.542 | 19,97 | ||||
| 2026-02-17 | 13F | Diker Management Llc | 8.222 | 0,00 | 547 | 29,93 | ||||
| 2025-11-14 | 13F | Prosight Management, LP | 0 | -100,00 | 0 | |||||
| 2026-02-12 | 13F | BRYN MAWR TRUST Co | 0 | -100,00 | 0 | |||||
| 2026-02-13 | 13F | Manufacturers Life Insurance Company, The | 0 | -100,00 | 0 | |||||
| 2026-02-13 | 13F | Pinnacle Wealth Planning Services, Inc. | 30 | 2 | ||||||
| 2025-10-30 | 13F | Twin Peaks Wealth Advisors, LLC | 0 | -100,00 | 0 | |||||
| 2026-02-23 | 13F | Virtu Financial LLC | 0 | -100,00 | 0 | |||||
| 2025-11-13 | 13F | Empowered Funds, LLC | 0 | -100,00 | 0 | |||||
| 2026-01-28 | 13F | Milestone Asset Management, Llc | 20.172 | 35,75 | 1.342 | 76,12 | ||||
| 2026-02-13 | 13F | Prudential Financial Inc | 5.145 | -50,46 | 342 | -35,71 | ||||
| 2026-01-07 | 13F | Aventura Private Wealth, LLC | 0 | -100,00 | 0 | |||||
| 2026-02-17 | 13F | Boothbay Fund Management, Llc | 0 | -100,00 | 0 | |||||
| 2026-01-16 | 13F | Ronald Blue Trust, Inc. | 990 | 30,26 | 66 | 71,05 | ||||
| 2026-02-11 | 13F | Twin Tree Management, LP | Put | 0 | -100,00 | 0 | -100,00 | |||
| 2026-03-31 | 13F | Sankala Group LLC | 22 | 0,00 | 2 | 0,00 | ||||
| 2025-11-13 | 13F | Sit Investment Associates Inc | 0 | -100,00 | 0 | |||||
| 2026-02-05 | 13F | Abacus Wealth Partners, LLC | 3.938 | 262 | ||||||
| 2026-02-11 | 13F | Twin Tree Management, LP | 0 | -100,00 | 0 | -100,00 | ||||
| 2026-02-17 | 13F | Northern Trust Corp | 798.127 | -5,46 | 53.115 | 22,67 | ||||
| 2025-10-14 | 13F | J2 Capital Management Inc | 0 | -100,00 | 0 | |||||
| 2026-02-17 | 13F | Cresset Asset Management, LLC | 10.171 | -1,39 | 677 | 27,79 | ||||
| 2026-02-11 | 13F | O'shaughnessy Asset Management, Llc | 5.161 | 343 | ||||||
| 2026-01-29 | 13F | Comerica Bank | 16.838 | -7,93 | 1.121 | 19,40 | ||||
| 2026-01-14 | 13F | Exchange Traded Concepts, Llc | 15.619 | -2,34 | 1.039 | 26,71 | ||||
| 2026-02-12 | 13F | Ensign Peak Advisors, Inc | 6.799 | -85,24 | 452 | -80,86 | ||||
| 2026-02-05 | 13F | Gabelli Funds Llc | 24.000 | -55,64 | 1.597 | -42,43 | ||||
| 2026-02-13 | 13F | Smartleaf Asset Management LLC | 508 | 63,34 | 34 | 126,67 | ||||
| 2026-02-13 | 13F | Marshall Wace, Llp | 232.677 | 15.485 | ||||||
| 2026-01-28 | 13F | Universal- Beteiligungs- und Servicegesellschaft mbH | 61.714 | 5,91 | 4.112 | 37,62 | ||||
| 2026-02-17 | 13F | Freestone Grove Partners LP | 608.526 | 4.114,75 | 40.497 | 5.372,57 | ||||
| 2025-11-14 | 13F | CSM Advisors, LLC | 0 | -100,00 | 0 | |||||
| 2026-01-29 | 13F | Sanctuary Advisors, LLC | 6.383 | -20,60 | 425 | 2,91 | ||||
| 2026-01-30 | 13F | New York State Teachers Retirement System | 73.824 | -2,02 | 5 | 33,33 | ||||
| 2026-02-12 | 13F | Colonial Trust Co / SC | 0 | -100,00 | 0 | |||||
| 2026-01-21 | 13F | Trueblood Wealth Management, LLC | 11.043 | 0,00 | 735 | 29,68 | ||||
| 2026-01-26 | 13F | Martin Capital Advisors, LLP | 14.166 | 9,15 | 943 | 41,65 | ||||
| 2026-01-30 | 13F/A | M&t Bank Corp | 8.106 | 539 | ||||||
| 2025-11-14 | 13F | SummitTX Capital, L.P. | 0 | -100,00 | 0 | |||||
| 2026-02-05 | 13F | Northwestern Mutual Investment Management Company, Llc | 14.836 | -2,10 | 987 | 27,03 | ||||
| 2026-02-04 | 13F | Pensionmark Financial Group, Llc | 0 | -100,00 | 0 | |||||
| 2026-02-17 | 13F | Private Capital Management, LLC | 558.824 | -0,33 | 37.190 | 29,33 | ||||
| 2025-11-13 | 13F | Clearbridge Investments, LLC | 0 | -100,00 | 0 | -100,00 | ||||
| 2026-02-10 | 13F | Re Advisers Corp | 29.300 | 0,00 | 1.950 | 29,76 | ||||
| 2026-02-14 | 13F | Rockefeller Capital Management L.P. | 2.023 | 65,55 | 135 | 116,13 | ||||
| 2026-02-17 | 13F | Two Sigma Securities, Llc | 6.517 | 434 | ||||||
| 2025-11-05 | 13F | Renaissance Group Llc | 0 | -100,00 | 0 | |||||
| 2026-02-17 | 13F | Portolan Capital Management, LLC | 475.789 | 60,09 | 31.664 | 107,72 | ||||
| 2026-01-29 | 13F | Ashton Thomas Private Wealth, LLC | 21.700 | 1,82 | 1.444 | 32,11 | ||||
| 2026-02-13 | 13F | Velan Capital Investment Management LP | 74.687 | 1,55 | 4.970 | 31,76 | ||||
| 2026-02-13 | 13F | Peak6 Llc | Put | 0 | -100,00 | 0 | ||||
| 2026-02-13 | 13F | Peak6 Llc | 0 | -100,00 | 0 | |||||
| 2026-02-18 | 13F | State of Tennessee, Treasury Department | 30.744 | -25,79 | 2.057 | -3,15 | ||||
| 2025-11-06 | 13F | Profund Advisors Llc | 0 | -100,00 | 0 | |||||
| 2025-11-14 | 13F | Fred Alger Management, Llc | 0 | -100,00 | 0 | -100,00 | ||||
| 2026-02-17 | 13F | Tang Capital Management Llc | 0 | -100,00 | 0 | |||||
| 2026-02-12 | 13F | Campbell & CO Investment Adviser LLC | 0 | -100,00 | 0 | |||||
| 2026-01-02 | 13F | Global Wealth Strategies & Associates | 92 | 0,00 | 6 | 50,00 | ||||
| 2025-11-10 | 13F | Mitsubishi UFJ Asset Management (UK) Ltd. | 0 | -100,00 | 0 | |||||
| 2026-02-13 | 13F | Caitong International Asset Management Co., Ltd | 0 | -100,00 | 0 | |||||
| 2026-02-13 | 13F | American Century Companies Inc | 769.030 | 6,60 | 51.179 | 38,32 | ||||
| 2026-02-06 | 13F | GPS Wealth Strategies Group, LLC | 0 | -100,00 | 0 | -100,00 | ||||
| 2026-02-17 | 13F | Deerfield Management Company, L.p. (series C) | 827.999 | 55.103 | ||||||
| 2025-11-07 | 13F | Standard Life Aberdeen plc | 0 | -100,00 | 0 | |||||
| 2026-02-06 | 13F | Lsv Asset Management | 76.400 | 0,00 | 5 | 66,67 | ||||
| 2026-02-10 | 13F | Natixis Advisors, L.p. | 0 | -100,00 | 0 | |||||
| 2026-02-17 | 13F | Hotchkis & Wiley Capital Management Llc | 224.496 | 0,63 | 14.940 | 30,57 | ||||
| 2026-02-06 | 13F | Pnc Financial Services Group, Inc. | 2.824 | -44,54 | 188 | -28,35 | ||||
| 2026-02-11 | 13F | Manchester Capital Management LLC | 0 | -100,00 | 0 | |||||
| 2026-02-12 | 13F | Tripletail Wealth Management, LLC | 1.040 | -19,38 | 70 | 2,99 | ||||
| 2026-01-23 | 13F | Nbt Bank N A /ny | 0 | -100,00 | 0 | |||||
| 2025-10-16 | 13F | Burney Co/ | 0 | -100,00 | 0 | |||||
| 2026-02-17 | 13F | Quantinno Capital Management LP | 6.171 | 411 | ||||||
| 2026-02-13 | 13F | First Trust Advisors Lp | 15.545 | -9,13 | 1.035 | 17,90 | ||||
| 2026-01-29 | 13F | Rakuten Securities, Inc. | 74 | -11,90 | 5 | 0,00 | ||||
| 2026-02-13 | 13F | JustInvest LLC | 5.879 | -9,29 | 391 | 17,77 | ||||
| 2025-10-24 | 13F | We Are One Seven, LLC | 0 | -100,00 | 0 | |||||
| 2025-11-10 | 13F | Empirical Financial Services, LLC d.b.a. Empirical Wealth Management | 0 | -100,00 | 0 | |||||
| 2026-02-12 | 13F | Ci Investments Inc. | 0 | -100,00 | 0 | |||||
| 2026-01-29 | 13F | Verdence Capital Advisors LLC | 8.455 | 3,81 | 563 | 18,82 | ||||
| 2026-02-17 | 13F | Lazard Asset Management Llc | 15.003 | -93,66 | 998 | -91,78 | ||||
| 2026-02-17 | 13F | Citadel Advisors Llc | Put | 56.700 | -43,41 | 3.773 | -26,58 | |||
| 2025-11-13 | 13F | Hsbc Holdings Plc | 0 | -100,00 | 0 | -100,00 | ||||
| 2026-02-17 | 13F | Citadel Advisors Llc | Call | 51.100 | -45,93 | 3.401 | -29,84 | |||
| 2026-02-10 | 13F | Envestnet Asset Management Inc | 52.804 | -43,96 | 3.514 | -27,29 | ||||
| 2026-01-08 | 13F | NorthCrest Asset Manangement, LLC | 4.080 | 0,27 | 281 | 33,81 | ||||
| 2026-02-17 | 13F | Citadel Advisors Llc | 644.196 | 24,03 | 42.871 | 60,94 | ||||
| 2026-01-29 | 13F | Teachers Retirement System Of The State Of Kentucky | 20.321 | 0,00 | 1 | 0,00 | ||||
| 2025-11-14 | 13F | Wolverine Trading, Llc | 17.328 | 85,15 | 877 | 15,09 | ||||
| 2025-11-14 | 13F | Balyasny Asset Management Llc | Put | 0 | -100,00 | 0 | -100,00 | |||
| 2025-11-14 | 13F | Wolverine Trading, Llc | Call | 24.800 | 45,03 | 1.255 | -9,91 | |||
| 2025-11-14 | 13F | Wolverine Trading, Llc | Put | 22.100 | 78,23 | 1.119 | 10,69 | |||
| 2026-02-03 | 13F | American Assets Inc | 17.000 | 0,00 | 1.131 | 29,85 | ||||
| 2025-11-14 | 13F | Balyasny Asset Management Llc | Call | 0 | -100,00 | 0 | -100,00 | |||
| 2026-02-13 | 13F | Sei Investments Co | 18.096 | -49,53 | 1.204 | -34,53 | ||||
| 2026-02-17 | 13F | Advisory Services Network, LLC | 0 | -100,00 | 0 | |||||
| 2026-02-12 | 13F | Portland Investment Counsel Inc. | 18.000 | 0,00 | 1.198 | 29,69 | ||||
| 2026-02-13 | 13F | Stifel Financial Corp | 59.969 | 5,07 | 3.991 | 36,32 | ||||
| 2026-02-17 | 13F | Elequin Capital Lp | 119 | 8 | ||||||
| 2026-02-10 | 13F | Norges Bank | 1.144.955 | 76.197 | ||||||
| 2026-02-04 | 13F | Versor Investments LP | 7.800 | 519 | ||||||
| 2026-02-13 | 13F | Rhumbline Advisers | 195.104 | -8,89 | 12.984 | 18,22 | ||||
| 2026-02-06 | 13F | Handelsbanken Fonder AB | 20.700 | 12,50 | 1 | |||||
| 2026-02-11 | 13F | Rise Advisors, LLC | 0 | -100,00 | 0 | |||||
| 2026-02-11 | 13F | Ameritas Investment Partners, Inc. | 17.594 | 1.171 | ||||||
| 2026-02-11 | 13F | Parallel Advisors, LLC | 541 | 122,63 | 36 | 200,00 | ||||
| 2026-01-09 | 13F | Assenagon Asset Management S.A. | 71.943 | -94,38 | 4.788 | -92,71 | ||||
| 2026-02-13 | 13F | Charles Schwab Investment Management Inc | 643.168 | 2,13 | 42.803 | 32,51 | ||||
| 2026-02-17 | 13F | Woodline Partners LP | 42.382 | 0,00 | 2.821 | 29,77 | ||||
| 2026-01-12 | 13F | E. Ohman J:or Asset Management AB | 33.938 | 16,07 | 2.259 | 50,63 | ||||
| 2026-01-27 | 13F | Bayforest Capital Ltd | 578 | -94,82 | 38 | -93,35 | ||||
| 2026-02-12 | 13F | Bank Of Montreal /can/ | 14.882 | -7,67 | 990 | 19,85 | ||||
| 2025-11-13 | 13F | B. Metzler seel. Sohn & Co. AG | 0 | -100,00 | 0 | |||||
| 2026-01-13 | 13F | CoreCap Advisors, LLC | 4 | 0 | ||||||
| 2026-02-13 | 13F | First National Bank Of Omaha | 0 | -100,00 | 0 | |||||
| 2026-02-03 | 13F | Crossmark Global Holdings, Inc. | 4.644 | 0,65 | 309 | 30,93 | ||||
| 2025-11-13 | 13F | Fuller & Thaler Asset Management, Inc. | 0 | -100,00 | 0 | |||||
| 2025-11-14 | 13F | Texas Permanent School Fund | 0 | -100,00 | 0 | |||||
| 2025-10-22 | 13F | Galvin, Gaustad & Stein, LLC | 0 | -100,00 | 0 | |||||
| 2026-02-17 | 13F | Aster Capital Management (DIFC) Ltd | 0 | -100,00 | 0 | |||||
| 2025-10-22 | 13F | Torray Llc | 0 | -100,00 | 0 | -100,00 | ||||
| 2026-01-08 | 13F | Armstrong Advisory Group, Inc | 200 | 0,00 | 13 | 30,00 | ||||
| 2026-01-26 | 13F | KBC Group NV | 1.839 | 0,00 | 0 | |||||
| 2026-02-09 | 13F | Bleakley Financial Group, LLC | 11.583 | 771 | ||||||
| 2026-02-13 | 13F | Umb Bank N A/mo | 955 | 104,06 | 64 | 162,50 | ||||
| 2026-02-13 | 13F | Carmignac Gestion | 1.122.000 | 38,96 | 74.669 | 80,31 | ||||
| 2025-11-10 | 13F | Granite Investment Partners, LLC | 0 | -100,00 | 0 | -100,00 | ||||
| 2026-02-17 | 13F | Alliancebernstein L.p. | 133.722 | -3,65 | 8.899 | 25,02 | ||||
| 2026-02-17 | 13F | Scientech Research LLC | 0 | -100,00 | 0 | |||||
| 2026-02-04 | 13F | First National Advisers, LLC | 0 | -100,00 | 0 | |||||
| 2026-01-27 | 13F | Evergreen Capital Management Llc | 3.008 | 200 | ||||||
| 2026-02-13 | 13F | Walleye Capital LLC | 5.586 | 372 | ||||||
| 2026-02-13 | 13F | Great West Life Assurance Co /can/ | 38.862 | -26,88 | 3 | 0,00 | ||||
| 2026-01-29 | 13F | Polaris Capital Management, LLC | 538.000 | -15,58 | 35.804 | 9,53 | ||||
| 2026-02-17 | 13F | Summit Street Capital Management, LLC | 405.664 | 26.997 | ||||||
| 2026-02-17 | 13F | Toronto Dominion Bank | 12 | 1 | ||||||
| 2025-10-31 | 13F | National Asset Management, Inc. | 0 | -100,00 | 0 | |||||
| 2026-02-13 | 13F | Baird Financial Group, Inc. | 0 | -100,00 | 0 | |||||
| 2026-02-12 | 13F | Sector Gamma As | 93.823 | 45,68 | 6.244 | 89,01 | ||||
| 2026-02-12 | 13F | Dimensional Fund Advisors Lp | 1.415.463 | 3,24 | 94.202 | 33,97 | ||||
| 2026-01-28 | 13F | Teacher Retirement System Of Texas | 9.987 | -22,93 | 665 | 0,00 | ||||
| 2026-02-24 | 13F | Villanova Investment Management Co LLC | 22.710 | 1.511 | ||||||
| 2026-02-10 | 13F | State of Wyoming | 1 | -99,67 | 0 | -100,00 | ||||
| 2026-02-13 | 13F | Sirios Capital Management L P | 0 | -100,00 | 0 | |||||
| 2026-01-28 | 13F | N.E.W. Advisory Services LLC | 1.740 | -10,95 | 116 | 15,00 | ||||
| 2026-02-11 | 13F | Simplex Trading, Llc | Put | 1.100 | -73,81 | 73 | ||||
| 2026-02-11 | 13F | Prestige Wealth Management Group LLC | 25 | 0,00 | 2 | 0,00 | ||||
| 2026-02-11 | 13F | Simplex Trading, Llc | 368 | 24 | ||||||
| 2026-02-04 | 13F | Virginia Retirement Systems Et Al | 9.033 | -36,09 | 601 | -16,99 | ||||
| 2026-02-11 | 13F | Simplex Trading, Llc | Call | 8.400 | -50,59 | 559 | ||||
| 2026-02-11 | 13F | Deutsche Bank Ag\ | 235.298 | 19,07 | 15.659 | 54,50 | ||||
| 2026-02-12 | 13F | State Board Of Administration Of Florida Retirement System | 17.603 | 0,00 | 1.171 | 29,82 | ||||
| 2026-01-23 | 13F | Bellevue Asset Management, Llc | 475 | 0,00 | 32 | 29,17 | ||||
| 2026-01-12 | 13F | Silverberg Bernstein Capital Management LLC | 31.879 | 8,51 | 2.122 | 40,84 | ||||
| 2026-02-02 | 13F | Principal Financial Group Inc | 227.075 | 9,98 | 15.112 | 42,70 | ||||
| 2026-02-12 | 13F | Oak Associates Ltd /oh/ | 39.164 | 2.606 | ||||||
| 2026-02-12 | 13F | Clark Estates Inc/ny | 42.000 | 0,00 | 2.795 | 29,76 | ||||
| 2026-02-17 | 13F | GAM Holding AG | 0 | -100,00 | 0 | |||||
| 2025-11-12 | 13F | HFM Investment Advisors, LLC | 0 | -100,00 | 0 | |||||
| 2026-02-17 | 13F | Russell Investments Group, Ltd. | 74.214 | 8,82 | 4.939 | 41,17 | ||||
| 2026-01-15 | 13F | Fortitude Family Office, LLC | 3 | -88,46 | 0 | -100,00 | ||||
| 2025-10-28 | 13F | Wolff Wiese Magana Llc | 0 | -100,00 | 0 | |||||
| 2026-01-08 | 13F | Ulland Investment Advisors, LLC | 4.807 | -20,31 | 0 | |||||
| 2026-02-10 | 13F | Reinhart Partners, Inc. | 1.562.576 | 15,94 | 103.990 | 50,43 | ||||
| 2026-02-13 | 13F | Ubs Asset Management Americas Inc | 499.873 | 11,47 | 33.267 | 44,63 | ||||
| 2026-02-05 | 13F | Qsemble Capital Management, LP | 5.058 | -22,12 | 337 | 0,90 | ||||
| 2026-02-06 | 13F | IFP Advisors, Inc | 488 | -79,85 | 32 | -74,19 | ||||
| 2026-02-02 | 13F | Truist Financial Corp | 3.779 | -41,49 | 251 | -24,17 | ||||
| 2025-11-07 | 13F | Ontario Teachers Pension Plan Board | 0 | -100,00 | 0 | -100,00 | ||||
| 2025-11-12 | 13F | Segall Bryant & Hamill, Llc | 0 | -100,00 | 0 | |||||
| 2026-01-29 | 13F | State Of Michigan Retirement System | 15.700 | -3,09 | 1.045 | 25,78 | ||||
| 2026-02-13 | 13F | OMERS ADMINISTRATION Corp | 0 | -100,00 | 0 | |||||
| 2026-03-09 | 13F | EMC Capital Management | 962 | -15,02 | 0 | |||||
| 2026-02-17 | 13F | Brevan Howard Capital Management LP | 14.747 | -62,90 | 981 | -51,86 | ||||
| 2025-11-10 | 13F | Axq Capital, Lp | 0 | -100,00 | 0 | |||||
| 2025-10-21 | 13F | Moody Aldrich Partners Llc | 0 | -100,00 | 0 | -100,00 | ||||
| 2026-02-05 | 13F | Thrivent Financial For Lutherans | 14.932 | -4,41 | 1 | |||||
| 2026-02-02 | 13F | Kornitzer Capital Management Inc /ks | 40.385 | -49,09 | 2.688 | -33,95 | ||||
| 2026-02-11 | 13F | Hughes Financial Services, LLC | 1 | 0 | ||||||
| 2026-01-28 | 13F | Arizona State Retirement System | 18.973 | -7,22 | 1.263 | 20,42 | ||||
| 2026-02-17 | 13F | Two Sigma Investments, Lp | 0 | -100,00 | 0 | |||||
| 2026-02-13 | 13F | Walleye Capital LLC | Put | 0 | -100,00 | 0 | -100,00 | |||
| 2026-02-17 | 13F | Nearwater Capital Markets, Ltd | 0 | -100,00 | 0 | |||||
| 2026-02-11 | 13F | J.Safra Asset Management Corp | 74 | 37,04 | 5 | 100,00 | ||||
| 2026-02-13 | 13F | Walleye Capital LLC | Call | 0 | -100,00 | 0 | -100,00 | |||
| 2026-02-13 | 13F | BNP Paribas Asset Management Holding S.A. | 5.937 | 4,51 | 0 | |||||
| 2025-11-10 | 13F | Jupiter Asset Management Ltd | 0 | -100,00 | 0 | |||||
| 2025-11-14 | 13F | Cubist Systematic Strategies, LLC | Put | 0 | -100,00 | 0 | -100,00 | |||
| 2026-02-09 | 13F | William Blair Investment Management, Llc | 522.177 | -9,14 | 34.751 | 17,90 | ||||
| 2026-01-30 | 13F | Keybank National Association/oh | 43.631 | -76,67 | 2.904 | -69,74 | ||||
| 2026-02-13 | 13F | Aurora Investment Counsel | 0 | -100,00 | 0 | |||||
| 2026-02-12 | 13F | Quadrant Capital Group Llc | 7.458 | 14,44 | 496 | 48,50 | ||||
| 2026-02-06 | 13F | Leonteq Securities AG | 271 | -46,97 | 18 | -30,77 | ||||
| 2026-02-13 | 13F | Centerpoint Advisors, LLC | 0 | -100,00 | 0 | |||||
| 2026-02-10 | 13F | Rational Advisors Llc | 25 | 25,00 | 2 | 0,00 | ||||
| 2026-02-03 | 13F | Legacy Wealth Managment, LLC/ID | 46 | 3 | ||||||
| 2026-01-29 | 13F | IMC-Chicago, LLC | 36.079 | -8,20 | 2.401 | 19,16 | ||||
| 2026-01-29 | 13F | IMC-Chicago, LLC | Put | 43.800 | -25,26 | 2.915 | -3,03 | |||
| 2026-02-17 | 13F | Abel Hall, LLC | 3.743 | 249 | ||||||
| 2026-01-29 | 13F | IMC-Chicago, LLC | Call | 61.700 | -9,53 | 4.106 | 17,41 | |||
| 2026-02-12 | 13F | Voya Investment Management Llc | 40.696 | -13,33 | 2.708 | 12,46 | ||||
| 2026-02-12 | 13F | Nuveen, LLC | 151.816 | -2,57 | 10.103 | 26,43 | ||||
| 2025-11-14 | 13F | Nitorum Capital, L.P. | 0 | -100,00 | 0 | |||||
| 2026-02-13 | 13F | Wells Fargo & Company/mn | 165.896 | 10,77 | 11.040 | 43,73 | ||||
| 2026-02-11 | 13F | Havemeyer Place LP | 9.096 | 605 | ||||||
| 2025-11-07 | 13F | Skandinaviska Enskilda Banken AB (publ) | 0 | -100,00 | 0 | -100,00 | ||||
| 2026-02-10 | 13F | Tidemark, LLC | 0 | -100,00 | 0 | |||||
| 2025-11-14 | 13F | Mount Yale Investment Advisors, LLC | 0 | -100,00 | 0 | -100,00 | ||||
| 2026-02-12 | 13F | Logan Capital Management Inc | 7.662 | -31,76 | 510 | -11,48 | ||||
| 2026-02-03 | 13F | Mitsubishi UFJ Kokusai Asset Management Co., Ltd. | 93 | 0,00 | 6 | 50,00 | ||||
| 2025-10-30 | 13F | Jennison Associates Llc | 0 | -100,00 | 0 | |||||
| 2026-02-13 | 13F | Sterling Capital Management LLC | 438 | -90,51 | 29 | -87,71 | ||||
| 2026-02-10 | 13F | Savant Capital, LLC | 5.440 | 362 | ||||||
| 2026-02-10 | 13F | Bank of New York Mellon Corp | 469.243 | -3,81 | 31.228 | 24,81 | ||||
| 2026-02-19 | 13F | Invesco Ltd. | 366.124 | -50,05 | 24.366 | -35,19 | ||||
| 2025-11-13 | 13F | Change Path, LLC | 0 | -100,00 | 0 | |||||
| 2026-02-18 | 13F | Caitlin John, LLC | 0 | -100,00 | 0 | |||||
| 2026-01-29 | 13F | Vanguard Group Inc | 6.699.381 | -3,64 | 445.844 | 25,03 | ||||
| 2026-02-10 | 13F | New Mexico Educational Retirement Board | 14.100 | 0,00 | 1 | |||||
| 2026-02-12 | 13F | New York State Common Retirement Fund | 22.131 | -88,66 | 1.473 | -85,30 | ||||
| 2026-02-13 | 13F | FORA Capital, LLC | 0 | -100,00 | 0 | |||||
| 2026-02-18 | 13F | Vident Advisory, LLC | 44.763 | 0,52 | 2.979 | 30,39 | ||||
| 2026-02-17 | 13F | First Manhattan Co | 4.324 | 0,00 | 288 | 29,86 | ||||
| 2026-02-17 | 13F | Vestal Point Capital, LP | 360.000 | 111,76 | 23.958 | 174,78 | ||||
| 2026-02-26 | 13F | Anchor Investment Management, LLC | 115 | 0,00 | 8 | 40,00 | ||||
| 2026-02-13 | 13F | MAI Capital Management | 3 | -84,21 | 0 | |||||
| 2025-11-14 | 13F | Clark Capital Management Group, Inc. | 0 | -100,00 | 0 | |||||
| 2026-01-30 | 13F | State of New Jersey Common Pension Fund D | 40.315 | 12,13 | 2.683 | 45,44 | ||||
| 2026-02-11 | 13F | Jpmorgan Chase & Co | 738.479 | -5,55 | 49.146 | 22,56 | ||||
| 2025-11-14 | 13F | Millennium Management Llc | Call | 0 | -100,00 | 0 | -100,00 | |||
| 2026-02-03 | 13F | Pilgrim Partners Asia Pte Ltd | 660 | -43,10 | 44 | -27,12 | ||||
| 2026-02-12 | 13F | Peterson Wealth Services | 205 | 1.476,92 | 14 | -97,69 | ||||
| 2026-02-13 | 13F | Colony Group, LLC | 78.399 | -2,19 | 5.217 | 26,78 | ||||
| 2026-02-13 | 13F | Quarry LP | 0 | -100,00 | 0 | |||||
| 2026-02-12 | 13F | Brinker Capital Investments, LLC | 14.168 | 55,78 | 943 | 102,15 | ||||
| 2026-02-17 | 13F | Farallon Capital Management Llc | 5.427.479 | 56,09 | 361.199 | 102,53 | ||||
| 2026-02-13 | 13F | Neuberger Berman Group LLC | 7.745 | -39,93 | 515 | -22,09 | ||||
| 2025-10-29 | 13F | WPG Advisers, LLC | 0 | -100,00 | 0 | -100,00 | ||||
| 2026-02-13 | 13F | Cynosure Management, Llc | 0 | -100,00 | 0 | -100,00 | ||||
| 2025-12-01 | 13F | Groupama Asset Managment | 423 | -16,57 | ||||||
| 2026-02-09 | 13F | Geode Capital Management, Llc | 1.726.521 | -1,59 | 114.918 | 27,69 | ||||
| 2026-02-13 | 13F | Glen Eagle Advisors, LLC | 433 | 0,00 | 29 | 27,27 | ||||
| 2026-02-11 | 13F | Inceptionr Llc | 3.138 | 209 | ||||||
| 2026-02-17 | 13F | SageView Advisory Group, LLC | 85 | 6 | ||||||
| 2025-11-14 | 13F | Marex Group plc | 0 | -100,00 | 0 | -100,00 | ||||
| 2026-01-29 | 13F | Pictet Asset Management Holding SA | 10.658 | 8,86 | 709 | 41,24 | ||||
| 2026-02-11 | 13F | Prudential Plc | 0 | -100,00 | 0 | |||||
| 2026-02-13 | 13F | Centaurus Financial, Inc. | 7.187 | 7,73 | 0 | |||||
| 2026-02-13 | 13F | Mml Investors Services, Llc | 0 | -100,00 | 0 | |||||
| 2026-02-13 | 13F | S&t Bank/pa | 41.840 | -17,66 | 2.784 | 6,83 | ||||
| 2025-10-23 | 13F | Peregrine Capital Management Llc | 0 | -100,00 | 0 | -100,00 | ||||
| 2025-11-14 | 13F | Axiom International Investors Llc /de | 0 | -100,00 | 0 | |||||
| 2025-11-14 | 13F | Dark Forest Capital Management Lp | 14.221 | 0,00 | 1.164 | 0,00 | ||||
| 2026-02-13 | 13F | Bridgewater Associates, LP | 166.706 | -43,85 | 11.094 | -27,15 | ||||
| 2026-02-17 | 13F | Ameriprise Financial Inc | 224.697 | -10,07 | 14.954 | 16,68 | ||||
| 2026-02-13 | 13F | Landscape Capital Management, L.l.c. | 15.060 | 1.002 | ||||||
| 2026-02-13 | 13F | Kilter Group LLC | 39 | 680,00 | 3 | |||||
| 2026-02-11 | 13F | CenterBook Partners LP | 38.354 | 2.552 | ||||||
| 2026-02-02 | 13F | Montag A & Associates Inc | 0 | -100,00 | 0 | |||||
| 2026-01-21 | 13F | Phocas Financial Corp. | 0 | -100,00 | 0 | |||||
| 2026-02-13 | 13F | Axim Planning & Wealth | 3.351 | -30,98 | 223 | -10,44 | ||||
| 2026-01-29 | 13F | DecisionPoint Financial, LLC | 4 | 0,00 | 0 | |||||
| 2026-02-03 | 13F | Premier Fund Managers Ltd | 6.861 | 0,00 | 0 | |||||
| 2026-02-13 | 13F | Toroso Investments, LLC | 19.268 | -25,82 | 1.282 | -3,75 | ||||
| 2026-02-12 | 13F | Aviva Plc | 0 | -100,00 | 0 | |||||
| 2026-02-17 | 13F | Millennium Management Llc | 174.043 | -60,75 | 11.583 | -49,08 | ||||
| 2026-01-26 | 13F | Private Trust Co Na | 264 | 0,00 | 18 | 30,77 | ||||
| 2026-02-13 | 13F | Edgestream Partners, L.P. | 115.319 | 2.037,12 | 7.674 | 2.680,43 | ||||
| 2026-03-05 | 13F/A | Banco Santander, S.A. | 0 | -100,00 | 0 | |||||
| 2025-10-30 | 13F | Bruce G. Allen Investments, LLC | 0 | -100,00 | 0 | |||||
| 2026-02-11 | 13F | Vise Technologies, Inc. | 4.082 | 272 | ||||||
| 2026-02-17 | 13F | Man Group plc | 58.723 | -8,22 | 3.908 | 19,11 | ||||
| 2026-01-05 | 13F | GAMMA Investing LLC | 2.907 | 29,72 | 193 | 69,30 | ||||
| 2025-10-28 | 13F | MeadowBrook Investment Advisors LLC | 0 | -100,00 | 0 | |||||
| 2026-01-30 | 13F | Citizens National Bank Trust Department | 7.684 | -12,65 | 511 | 13,30 | ||||
| 2026-01-16 | 13F | Linden Thomas Advisory Services, LLC | 20.739 | -6,42 | 1.380 | 21,48 | ||||
| 2026-01-23 | 13F | Oak Ridge Investments Llc | 0 | -100,00 | 0 | |||||
| 2026-02-09 | 13F | Harbour Investments, Inc. | 1.375 | 6.775,00 | 92 | 9.000,00 | ||||
| 2026-02-12 | 13F | Principal Securities, Inc. | 0 | -100,00 | 0 | -100,00 | ||||
| 2026-02-09 | 13F | Hartland & Co., LLC | 406 | -56,48 | 27 | -42,55 | ||||
| 2026-02-09 | 13F | Hantz Financial Services, Inc. | 1.788 | 263,41 | 0 | |||||
| 2026-01-27 | 13F/A | Tributary Capital Management, LLC | 0 | -100,00 | 0 | -100,00 | ||||
| 2026-01-30 | 13F | Bogart Wealth, LLC | 18 | 1 | ||||||
| 2026-02-17 | 13F | Lion Point Capital, LP | 5.500 | 366 | ||||||
| 2025-11-07 | 13F | Hardy Reed LLC | 0 | -100,00 | 0 | |||||
| 2026-02-12 | 13F | Elo Mutual Pension Insurance Co | 0 | -100,00 | 0 | |||||
| 2025-11-13 | 13F | Martingale Asset Management L P | 0 | -100,00 | 0 | |||||
| 2026-02-06 | 13F | Resona Asset Management Co.,Ltd. | 1.109 | 35,74 | 75 | 80,49 | ||||
| 2025-11-14 | 13F | First Light Asset Management, LLC | 0 | -100,00 | 0 | |||||
| 2025-10-28 | 13F | Eagle Global Advisors Llc | 0 | -100,00 | 0 | |||||
| 2026-02-06 | 13F | ProShare Advisors LLC | 14.911 | 2,44 | 992 | 32,98 | ||||
| 2026-02-17 | 13F | Hilltop Holdings Inc. | 0 | -100,00 | 0 | |||||
| 2026-02-17 | 13F | Signature Equity Partners, LLC | 16 | 1 | ||||||
| 2026-02-11 | 13F | Cerity Partners LLC | 4.402 | 293 | ||||||
| 2026-02-02 | 13F | Danske Bank A/s | 600 | -92,07 | 40 | -89,95 | ||||
| 2026-02-17 | 13F | Cetera Investment Advisers | 24.949 | -10,29 | 1.660 | 16,41 | ||||
| 2026-01-16 | 13F | DiNuzzo Private Wealth, Inc. | 1 | 0,00 | 0 | |||||
| 2026-02-20 | 13F | Sunbelt Securities, Inc. | 17 | 0,00 | 1 | |||||
| 2026-02-17 | 13F | Css Llc/il | 0 | -100,00 | 0 | |||||
| 2026-02-06 | 13F | HighTower Advisors, LLC | 9.796 | 17,35 | 652 | 52,10 | ||||
| 2026-02-13 | 13F | Epoch Investment Partners, Inc. | 407.529 | -10,60 | 27.121 | 16,00 | ||||
| 2026-02-02 | 13F | Oppenheimer Asset Management Inc. | 26.133 | -6,40 | 1.739 | 21,44 | ||||
| 2026-02-10 | 13F | Measured Wealth Private Client Group, LLC | 0 | -100,00 | 0 | |||||
| 2025-10-24 | 13F | Hemington Wealth Management | 6 | -78,57 | 0 | |||||
| 2025-10-22 | 13F | Geneos Wealth Management Inc. | 0 | -100,00 | 0 | -100,00 | ||||
| 2026-02-03 | 13F | SBI Securities Co., Ltd. | 119 | -4,03 | 8 | 16,67 | ||||
| 2026-02-13 | 13F | Macquarie Group Ltd | 0 | -100,00 | 0 | |||||
| 2026-01-27 | 13F | First Horizon Corp | 410 | -18,33 | 27 | 8,00 | ||||
| 2026-02-13 | 13F | Candriam Luxembourg S.C.A. | 0 | -100,00 | 0 | |||||
| 2026-01-15 | 13F | Highline Wealth Partners Llc | 0 | -100,00 | 0 | |||||
| 2026-02-12 | 13F | CIBC Private Wealth Group, LLC | 1.474 | 10,74 | 98 | 44,12 | ||||
| 2025-11-21 | 13F/A | CIBC Bancorp USA Inc. | 7.271 | 373 | ||||||
| 2026-02-05 | 13F | Chase Investment Counsel Corp | 20.000 | 0,00 | 1 | 0,00 | ||||
| 2026-01-30 | 13F | Harbor Advisors LLC | 4.000 | 0,00 | 266 | 29,76 | ||||
| 2025-11-05 | 13F | Alps Advisors Inc | 0 | -100,00 | 0 | |||||
| 2025-10-28 | 13F | Richardson Financial Services Inc. | 0 | -100,00 | 0 | |||||
| 2026-02-12 | 13F | Steward Partners Investment Advisory, Llc | 11.424 | 54,17 | 760 | 100,00 | ||||
| 2026-01-22 | 13F | Massachusetts Financial Services Co /ma/ | 0 | -100,00 | 0 | |||||
| 2025-11-13 | 13F | Glenmede Investment Management, LP | 0 | -100,00 | 0 | |||||
| 2025-11-14 | 13F | Polar Asset Management Partners Inc. | 0 | -100,00 | 0 | |||||
| 2026-01-26 | 13F | AE Wealth Management LLC | 7.443 | 495 | ||||||
| 2026-02-13 | 13F | Public Employees Retirement Association Of Colorado | 7.202 | 0,00 | 0 | |||||
| 2026-02-13 | 13F | Blueshift Asset Management, LLC | 0 | -100,00 | 0 | |||||
| 2025-10-17 | 13F | Shaker Investments Llc/oh | 0 | -100,00 | 0 | -100,00 | ||||
| 2026-01-23 | 13F | State of Alaska, Department of Revenue | 6.580 | -9,24 | 0 | |||||
| 2026-02-13 | 13F | Parkside Financial Bank & Trust | 94 | 370,00 | 6 | 500,00 | ||||
| 2026-02-13 | 13F | Entropy Technologies, LP | 0 | -100,00 | 0 | |||||
| 2025-11-10 | 13F | Estabrook Capital Management | 0 | -100,00 | 0 | |||||
| 2025-11-14 | 13F | Ancora Advisors, LLC | 0 | -100,00 | 0 | -100,00 | ||||
| 2026-01-29 | 13F | Concurrent Investment Advisors, LLC | 0 | -100,00 | 0 | |||||
| 2026-02-09 | 13F | Huntington National Bank | 9 | 125,00 | 1 | |||||
| 2026-02-17 | 13F | Two Sigma Advisers, Lp | 0 | -100,00 | 0 | |||||
| 2026-02-17 | 13F | Amundi | 78.495 | 37,85 | 5.224 | 74,10 | ||||
| 2025-11-14 | 13F | Osterweis Capital Management Inc | 0 | -100,00 | 0 | |||||
| 2026-02-12 | 13F | Hrt Financial Lp | 0 | -100,00 | 0 | |||||
| 2025-10-14 | 13F | Mendota Financial Group, LLC | 0 | -100,00 | 0 | |||||
| 2025-10-28 | 13F | Thrive Capital Management, LLC | 0 | -100,00 | 0 | |||||
| 2025-11-12 | 13F | Park Square Financial Group, LLC | 0 | -100,00 | 0 | |||||
| 2026-01-09 | 13F | SG Americas Securities, LLC | 13.479 | 134,87 | 1 | |||||
| 2026-02-17 | 13F | Guggenheim Capital Llc | 4.883 | -52,39 | 325 | -38,40 | ||||
| 2026-02-18 | 13F | Mackenzie Financial Corp | 657.674 | 31,12 | 44.082 | 71,35 | ||||
| 2026-02-05 | 13F | Dana Investment Advisors, Inc. | 0 | -100,00 | 0 | |||||
| 2026-01-15 | 13F | Allspring Global Investments Holdings, LLC | 10.473 | -89,30 | 705 | -86,07 | ||||
| 2026-02-17 | 13F | Sarissa Capital Management LP | 181.450 | 0,00 | 12.075 | 29,75 | ||||
| 2026-01-14 | 13F | Jfs Wealth Advisors, Llc | 22 | 69,23 | 1 | |||||
| 2026-02-10 | 13F | Lido Advisors, LLC | 62.205 | -7,38 | 3.346 | -2,85 | ||||
| 2026-02-13 | 13F | Brigade Capital Management, Lp | 127.607 | -59,66 | 8.492 | -47,66 | ||||
| 2026-02-12 | 13F | Brown Brothers Harriman & Co | 64 | -78,81 | 4 | -73,33 | ||||
| 2026-02-09 | 13F | Keating Financial Advisory Services, Inc. | 33.971 | 2.261 | ||||||
| 2026-02-13 | 13F | Barclays Plc | 145.098 | 15,14 | 9.656 | -30,18 | ||||
| 2026-01-26 | 13F | Campbell Newman Asset Management Inc | 34.616 | -3,64 | 2.304 | 25,03 | ||||
| 2026-02-13 | 13F | Capstone Wealth Management Group, Llc | 4.375 | 291 | ||||||
| 2026-02-17 | 13F | ISAM Funds (UK) Ltd | 0 | -100,00 | 0 | |||||
| 2025-11-14 | 13F | Keebeck Wealth Management, LLC | 0 | -100,00 | 0 | |||||
| 2026-02-03 | 13F | International Assets Investment Management, Llc | 1.114 | 74 | ||||||
| 2025-11-14 | 13F | Shelton Capital Management | 0 | -100,00 | 0 | |||||
| 2025-11-14 | 13F | Jain Global LLC | 0 | -100,00 | 0 | |||||
| 2026-02-17 | 13F | Bank Of America Corp /de/ | 819.803 | 58,32 | 54.558 | 105,43 | ||||
| 2026-02-17 | 13F | Public Employees Retirement System Of Ohio | 349 | 35,80 | 23 | 76,92 | ||||
| 2026-02-02 | 13F | Fifth Third Bancorp | 561 | 20,39 | 37 | 60,87 | ||||
| 2026-02-06 | 13F | Bare Financial Services, Inc | 91 | 810,00 | 6 | |||||
| 2026-02-17 | 13F | Aqr Capital Management Llc | 403.622 | 368,03 | 26.861 | 516,93 | ||||
| 2026-01-29 | 13F | Nbc Securities, Inc. | 0 | -100,00 | 0 | |||||
| 2026-01-29 | 13F | UMA Financial Services, Inc. | 0 | -100,00 | 0 | |||||
| 2026-02-12 | 13F | Renaissance Technologies Llc | 75.782 | 26,66 | 5.043 | 64,37 | ||||
| 2026-01-20 | 13F | Signaturefd, Llc | 31 | -80,62 | 2 | -75,00 | ||||
| 2026-02-12 | 13F | Swiss National Bank | 134.154 | 0,00 | 8.928 | 29,75 | ||||
| 2025-10-31 | 13F | Whittier Trust Co Of Nevada Inc | 0 | -100,00 | 0 | -100,00 | ||||
| 2026-02-11 | 13F | Winton Capital Group Ltd | 0 | -100,00 | 0 | |||||
| 2025-11-10 | 13F | Dakota Wealth Management | 0 | -100,00 | 0 | |||||
| 2026-02-02 | 13F | CENTRAL TRUST Co | 0 | -100,00 | 0 | |||||
| 2026-02-17 | 13F | Point72 Asset Management, L.P. | 1.014.369 | 67.506 | ||||||
| 2026-02-17 | 13F | Hancock Whitney Corp | 18.273 | -5,85 | 1.216 | 22,21 | ||||
| 2026-01-08 | 13F | Wealth Enhancement Advisory Services, Llc | 2.396 | 14,37 | 170 | 56,48 | ||||
| 2026-02-13 | 13F | Victory Capital Management Inc | 84.641 | -39,69 | 5.633 | -21,75 | ||||
| 2025-11-07 | 13F | Synovus Financial Corp | 0 | -100,00 | 0 | |||||
| 2025-11-12 | 13F | Ameriflex Group, Inc. | 0 | -100,00 | 0 | |||||
| 2026-01-12 | 13F | Moody National Bank Trust Division | 11.413 | -31,72 | 760 | -11,44 | ||||
| 2026-01-15 | 13F | Nisa Investment Advisors, Llc | 6.555 | 0,85 | 436 | 30,93 | ||||
| 2026-02-05 | 13F | HighMark Wealth Management LLC | 0 | -100,00 | 0 | |||||
| 2025-11-06 | 13F | Foresight Group Ltd Liability Partnership | 0 | -100,00 | 0 | |||||
| 2026-02-17 | 13F | California State Teachers Retirement System | 63.968 | -0,14 | 4.257 | 29,59 | ||||
| 2026-02-13 | 13F | Golden State Wealth Management, LLC | 10 | 0,00 | 1 | |||||
| 2026-02-17 | 13F | Tudor Investment Corp Et Al | Put | 4.700 | -71,52 | 313 | -63,12 | |||
| 2026-01-21 | 13F | Yousif Capital Management, Llc | 21.171 | -3,71 | 1.395 | 23,69 | ||||
| 2026-02-17 | 13F | Tudor Investment Corp Et Al | Call | 3.400 | -78,21 | 226 | -71,75 | |||
| 2026-02-09 | 13F/A | Swedbank AB | 1.228.743 | 0,00 | 81.773 | 29,75 | ||||
| 2026-01-12 | 13F | Legacy Wealth Asset Management, LLC | 7.146 | -6,31 | 476 | 21,48 | ||||
| 2026-02-17 | 13F | Point72 Asset Management, L.P. | Call | 22.600 | 1.504 | |||||
| 2026-02-13 | 13F | Alberta Investment Management Corp | 24.300 | 1.617 | ||||||
| 2026-02-17 | 13F | Quantitative Investment Management, LLC | 0 | -100,00 | 0 | |||||
| 2026-02-13 | 13F | Motiv8 Investments LLC | 325 | 0 | ||||||
| 2026-02-13 | 13F | Police & Firemen's Retirement System of New Jersey | 17.901 | -6,04 | 1.191 | 21,90 | ||||
| 2026-02-11 | 13F | Vestcor Inc | 12.334 | -31,63 | 1 | |||||
| 2026-02-12 | 13F | Groupe la Francaise | 2.250 | 0,00 | 150 | 29,57 | ||||
| 2026-02-06 | 13F | Covestor Ltd | 2.602 | 49,54 | 0 | |||||
| 2026-02-17 | 13F | Moore Capital Management, Lp | 25.984 | 30,28 | 1.729 | 69,18 | ||||
| 2026-01-09 | 13F | Zrc Wealth Management, Llc | 55 | 4 | ||||||
| 2026-02-17 | 13F | New Vernon Capital Holdings II LLC | 2.855 | -0,56 | 190 | 29,25 | ||||
| 2026-02-13 | 13F | Headlands Technologies LLC | 0 | -100,00 | 0 | |||||
| 2026-02-11 | 13F | Group One Trading, L.p. | Put | 2.700 | 8,00 | 180 | 39,84 | |||
| 2026-02-10 | 13F | Mutual Of America Capital Management Llc | 52.188 | -7,06 | 3.473 | 20,59 | ||||
| 2026-02-05 | 13F | 1620 Investment Advisors, Inc. | 497 | 0,00 | 33 | 32,00 | ||||
| 2026-02-11 | 13F | Group One Trading, L.p. | Call | 6.600 | -34,00 | 439 | -14,26 | |||
| 2026-02-13 | 13F | Healthcare Of Ontario Pension Plan Trust Fund | 76.179 | 5.070 | ||||||
| 2025-10-20 | 13F | TrimTabs Asset Management, LLC | 0 | -100,00 | 0 | -100,00 | ||||
| 2026-02-10 | 13F | Quantbot Technologies LP | 0 | -100,00 | 0 | |||||
| 2026-02-11 | 13F | Group One Trading, L.p. | 0 | -100,00 | 0 | -100,00 | ||||
| 2026-02-11 | 13F | Illinois Municipal Retirement Fund | 0 | -100,00 | 0 | |||||
| 2026-02-17 | 13F | Susquehanna International Group, Llp | Put | 76.900 | -23,79 | 5.118 | -1,12 | |||
| 2026-02-10 | 13F | Commonwealth Of Pennsylvania Public School Empls Retrmt Sys | 16.594 | -4,91 | 1.104 | 23,35 | ||||
| 2026-02-17 | 13F | Susquehanna International Group, Llp | Call | 168.400 | 11,67 | 11.207 | 44,91 | |||
| 2026-01-16 | 13F | Louisiana State Employees Retirement System | 18.300 | -3,17 | 1.218 | 25,59 | ||||
| 2026-02-13 | 13F | Walleye Trading LLC | 0 | -100,00 | 0 | |||||
| 2026-02-13 | 13F | Y-Intercept (Hong Kong) Ltd | 0 | -100,00 | 0 | |||||
| 2026-02-17 | 13F | Susquehanna International Group, Llp | 19.990 | -52,81 | 1.330 | -38,77 | ||||
| 2026-01-07 | 13F | Massmutual Trust Co Fsb/adv | 76 | 117,14 | 5 | 400,00 | ||||
| 2026-02-12 | 13F | Cloud Capital Management, LLC | 0 | -100,00 | 0 | |||||
| 2026-02-13 | 13F | Rice Hall James & Associates, Llc | 44.648 | 1,21 | 2.971 | 31,34 | ||||
| 2026-02-13 | 13F | Walleye Trading LLC | Call | 0 | -100,00 | 0 | ||||
| 2026-02-05 | 13F | Amalgamated Bank | 27.945 | -6,36 | 2 | 0,00 | ||||
| 2026-02-13 | 13F | Verition Fund Management LLC | 87.500 | -46,31 | 5.823 | -30,33 | ||||
| 2026-01-27 | 13F | Zurcher Kantonalbank (Zurich Cantonalbank) | 54.485 | 156,58 | 3.626 | 232,87 | ||||
| 2026-02-13 | 13F | Walleye Trading LLC | Put | 0 | -100,00 | 0 | ||||
| 2025-11-12 | 13F | 111 Capital | 3.913 | 201 | ||||||
| 2026-01-16 | 13F | FNY Investment Advisers, LLC | 0 | -100,00 | 0 | |||||
| 2026-02-18 | 13F | Vermillion & White Wealth Management Group, LLC | 53 | 0,00 | 4 | 50,00 | ||||
| 2026-02-13 | 13F | Transamerica Financial Advisors, Inc. | 6 | 0 | ||||||
| 2026-01-20 | 13F | AdvisorNet Financial, Inc | 0 | -100,00 | 0 | |||||
| 2026-02-17 | 13F | Royal Bank Of Canada | 49.159 | -69,99 | 3.271 | -61,06 | ||||
| 2026-01-08 | 13F | Nordea Investment Management Ab | 43.352 | -12,15 | 2.891 | 16,11 | ||||
| 2025-11-03 | 13F | Annis Gardner Whiting Capital Advisors, LLC | 0 | -100,00 | 0 | |||||
| 2026-02-13 | 13F | Kestra Advisory Services, LLC | 3.273 | 218 | ||||||
| 2026-02-12 | 13F | Xponance, Inc. | 8.153 | -15,38 | 543 | 9,72 | ||||
| 2025-11-06 | 13F | Aspect Partners, LLC | 0 | -100,00 | 0 | |||||
| 2025-12-03 | 13F | Severin Investments, LLC | 0 | -100,00 | 0 | -100,00 | ||||
| 2025-11-05 | 13F | BI Asset Management Fondsmaeglerselskab A/S | 0 | -100,00 | 0 | |||||
| 2026-02-09 | 13F | Quest Partners LLC | 1.159 | -45,20 | 77 | -28,70 | ||||
| 2025-11-04 | 13F | Wcm Investment Management, Llc | 0 | -100,00 | 0 | -100,00 | ||||
| 2026-02-17 | 13F | Capital Fund Management S.a. | 24.336 | 1.620 | ||||||
| 2026-02-17 | 13F | Quadrature Capital Ltd | 3.924 | 261 | ||||||
| 2026-02-17 | 13F | Creative Planning | 64.033 | 130,96 | 4.261 | 199,65 | ||||
| 2025-11-14 | 13F | Corton Capital Inc. | 3.902 | 200 | ||||||
| 2026-01-29 | 13F | UBS Group AG | 396.455 | 23,45 | 26.384 | 60,18 | ||||
| 2026-02-17 | 13F | Silvercrest Asset Management Group Llc | 416.328 | -11,32 | 27.707 | 15,07 | ||||
| 2026-03-04 | 13F | SHP Wealth Management | 5 | 0 | ||||||
| 2026-02-12 | 13F | Correct Capital Wealth Management | 0 | -100,00 | 0 | |||||
| 2025-11-05 | 13F | SOUTH STATE Corp | 0 | -100,00 | 0 | |||||
| 2025-11-18 | 13F | Kozak & Associates, Inc. | 0 | -100,00 | 0 | -100,00 | ||||
| 2025-11-06 | 13F | Oppenheimer & Co Inc | 0 | -100,00 | 0 | |||||
| 2025-11-12 | 13F | Legato Capital Management LLC | 0 | -100,00 | 0 | -100,00 | ||||
| 2026-02-10 | 13F | Daiwa Securities Group Inc. | 3.518 | 4,36 | 0 | |||||
| 2026-01-26 | 13F | Whittier Trust Co | 170 | 0,00 | 12 | 22,22 | ||||
| 2025-11-14 | 13F | Shapiro Capital Management Llc | 0 | -100,00 | 0 | |||||
| 2026-02-17 | 13F | Kemnay Advisory Services Inc. | 121 | 8 | ||||||
| 2026-02-13 | 13F | SRS Capital Advisors, Inc. | 320 | 21 | ||||||
| 2026-02-17 | 13F | FIL Ltd | 214.808 | 14.295 | ||||||
| 2026-02-17 | 13F | Optiver Holding B.V. | 310 | -46,55 | 21 | -31,03 | ||||
| 2026-02-13 | 13F | Public Sector Pension Investment Board | 85.761 | 5.707 | ||||||
| 2026-02-17 | 13F | DZ BANK AG Deutsche Zentral Genossenschafts Bank, Frankfurt am Main | 0 | -100,00 | 0 | |||||
| 2026-01-12 | 13F | Focus Financial Network, Inc. | 4.256 | 283 | ||||||
| 2026-02-10 | 13F | Root Financial Partners, LLC | 30 | 20,00 | 2 | 0,00 | ||||
| 2025-11-10 | 13F | Intrust Bank Na | 0 | -100,00 | 0 | |||||
| 2026-01-27 | 13F | GHP Investment Advisors, Inc. | 145 | 0,00 | 10 | 28,57 | ||||
| 2025-11-04 | 13F | Peak Retirement Planning, Inc. | 0 | -100,00 | 0 | -100,00 | ||||
| 2026-02-13 | 13F | Van Eck Associates Corp | 0 | -100,00 | 0 | -100,00 | ||||
| 2026-02-17 | 13F | Expect Equity LLC | 29.699 | 9,09 | 1.976 | 41,55 | ||||
| 2026-02-13 | 13F | Liberty One Investment Management, Llc | 0 | -100,00 | 0 | |||||
| 2025-11-14 | 13F | Engineers Gate Manager LP | 0 | -100,00 | 0 | |||||
| 2026-02-11 | 13F | Janney Montgomery Scott LLC | 19.247 | -30,99 | 1 | 0,00 | ||||
| 2026-02-23 | 13F | Mv Capital Management, Inc. | 6 | 500,00 | 0 | |||||
| 2026-02-12 | 13F | Cibc World Markets Corp | 4.435 | -46,69 | 295 | -56,62 | ||||
| 2026-02-13 | 13F | Wilkerson Advisory Group LLC | 52 | 3 | ||||||
| 2025-11-13 | 13F | Jefferies Financial Group Inc. | 0 | -100,00 | 0 | |||||
| 2026-01-26 | 13F | Mirae Asset Global Investments Co., Ltd. | 673 | -92,42 | 45 | -90,33 | ||||
| 2026-02-06 | 13F | Cullen/frost Bankers, Inc. | 0 | -100,00 | 0 | |||||
| 2025-10-23 | 13F | Park Avenue Securities Llc | 0 | -100,00 | 0 | |||||
| 2026-02-17 | 13F | Tower Research Capital LLC (TRC) | 9.618 | 150,99 | 640 | 226,53 | ||||
| 2026-02-11 | 13F | Allianz Asset Management GmbH | 5.606 | -87,26 | 373 | -83,47 | ||||
| 2026-02-02 | 13F | Strs Ohio | 3.900 | 0,00 | 260 | 29,50 | ||||
| 2026-02-05 | 13F | Allworth Financial LP | 364 | -12,71 | 24 | 14,29 | ||||
| 2026-03-19 | 13F/A | Barclays Plc | Call | 0 | -100,00 | 0 | -100,00 | |||
| 2026-01-14 | 13F | Spire Wealth Management | 582 | 35,35 | 39 | 72,73 | ||||
| 2025-11-14 | 13F | Peak6 Llc | Call | 0 | -100,00 | 0 | -100,00 | |||
| 2026-03-19 | 13F/A | Barclays Plc | Put | 0 | -100,00 | 0 | -100,00 | |||
| 2026-02-11 | 13F | Vermillion Wealth Management, Inc. | 0 | -100,00 | 0 | |||||
| 2025-11-04 | 13F | Bridges Investment Management Inc | 0 | -100,00 | 0 | |||||
| 2026-01-21 | 13F | SJS Investment Consulting Inc. | 1 | 0,00 | 0 | |||||
| 2026-02-06 | 13F | Global Retirement Partners, LLC | 179 | 22,60 | 12 | 57,14 |