Grundlæggende statistik
| Institutionelle ejere | 183 total, 183 long only, 0 short only, 0 long/short - change of -1,60% MRQ |
| Gennemsnitlig porteføljeallokering | 0.2607 % - change of 33,36% MRQ |
| Institutionelle aktier (lange) | 50.185.193 (ex 13D/G) - change of 2,50MM shares 5,24% MRQ |
| Institutionel værdi (lang) | $ 243.183 USD ($1000) |
Institutionelt ejerskab og aktionærer
Nuveen Credit Strategies Income Fund (US:JQC) har 183 institutionelle ejere og aktionærer, der har indsendt 13D/G- eller 13F-formularer til Securities Exchange Commission (SEC). Disse institutioner har i alt 50,185,193 aktier. Største aktionærer omfatter Morgan Stanley, Oak Hill Advisors Lp, Guggenheim Capital Llc, Invesco Ltd., Sit Investment Associates Inc, Wells Fargo & Company/mn, Absolute Investment Advisers Llc, PCEF - Invesco CEF Income Composite ETF, Pathstone Holdings, LLC, and Raymond James Financial Inc .
Nuveen Credit Strategies Income Fund (NYSE:JQC) institutionel ejerskabsstruktur viser aktuelle positioner i virksomheden efter institutioner og fonde, samt seneste ændringer i positionsstørrelse. Større aktionærer kan omfatte individuelle investorer, investeringsforeninger, hedgefonde eller institutioner. Skema 13D angiver, at investoren besidder (eller besidder) mere end 5 % af virksomheden og har til hensigt (eller har til hensigt at) aktivt at forfølge en ændring i forretningsstrategi. Skema 13G indikerer en passiv investering på over 5%.
The share price as of September 10, 2025 is 5,50 / share. Previously, on September 11, 2024, the share price was 5,91 / share. This represents a decline of 6,94% over that period.

Fondens stemningsscore
Fund Sentiment Score (fka Ownership Accumulation Score) finder de aktier, der bliver mest købt af fonde. Det er resultatet af en sofistikeret, multi-faktor kvantitativ model, der identificerer virksomheder med de højeste niveauer af institutionel akkumulering. Scoringsmodellen bruger en kombination af den samlede stigning i oplyste ejere, ændringerne i porteføljeallokeringer i disse ejere og andre målinger. Tallet går fra 0 til 100, hvor højere tal indikerer et højere niveau af akkumulering for sine jævnaldrende, og 50 er gennemsnittet.
Opdateringsfrekvens: Dagligt
Se Ownership Explorer, som giver en liste over højest rangerende virksomheder.
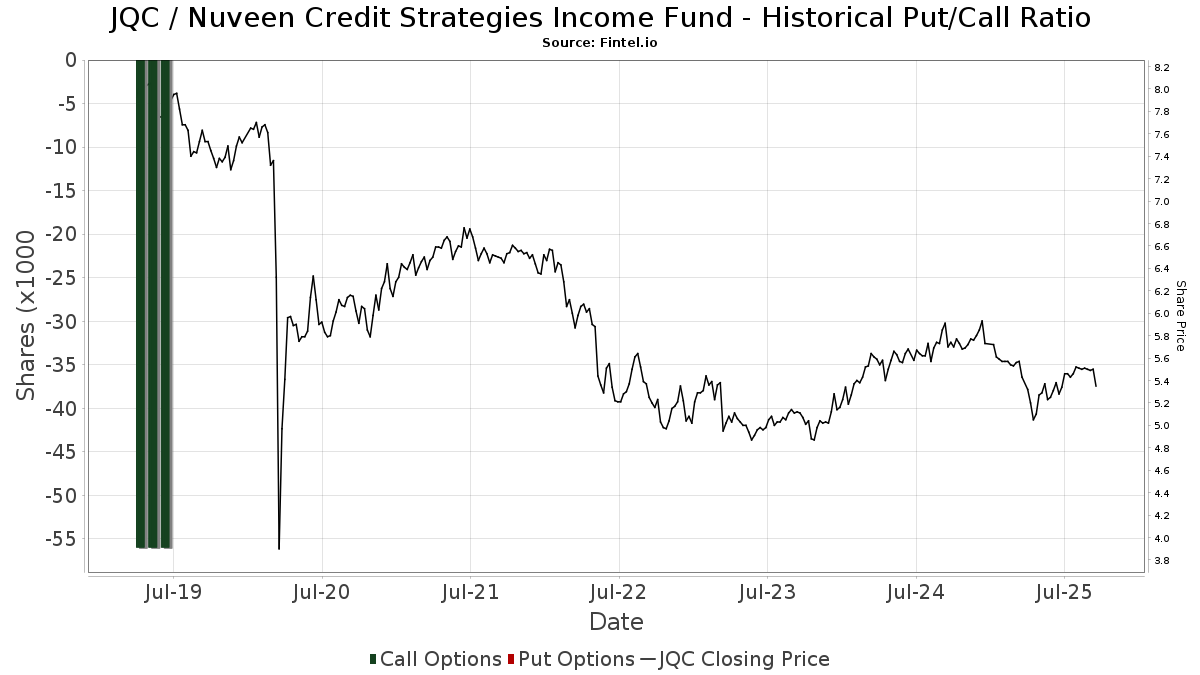
Institutionel Put/Call-forhold
Ud over at indberette standardaktie- og gældsudstedelser skal institutter med mere end 100 mill. aktiver under forvaltning også oplyse deres put- og call-optionsbeholdninger. Da salgsoptioner generelt indikerer negativ stemning, og købsoptioner indikerer positiv stemning, kan vi få en fornemmelse af den overordnede institutionelle stemning ved at plotte forholdet mellem put og kald. Diagrammet til højre viser det historiske put/call-forhold for dette instrument.
Brug af Put/Call Ratio som en indikator for investorernes stemning overvinder en af de vigtigste mangler ved at bruge totalt institutionelt ejerskab, som er, at en betydelig mængde af aktiver under forvaltning investeres passivt for at spore indekser. Passivt forvaltede fonde køber typisk ikke optioner, så indikatoren for put/call-forholdet følger mere nøje følelsen af aktivt forvaltede fonde.
13D/G-arkivering
Vi præsenterer 13D/G ansøgninger separat fra 13F ansøgninger på grund af den forskellige behandling af SEC. 13D/G-ansøgninger kan indgives af grupper af investorer (med én ledende), hvorimod 13F-ansøgninger ikke kan. Dette resulterer i situationer, hvor en investor kan indsende en 13D/G, der rapporterer én værdi for de samlede aktier (der repræsenterer alle de aktier, der ejes af investorgruppen), men derefter indsender en 13F, der rapporterer en anden værdi for de samlede aktier (der udelukkende repræsenterer deres egne) ejendomsret). Det betyder, at aktieejerskab af 13D/G-arkiver og 13F-arkiveringer ofte ikke er direkte sammenlignelige, så vi præsenterer dem separat.
Bemærk: Fra den 16. maj 2021 viser vi ikke længere ejere, der ikke har indsendt en 13D/G inden for det seneste år. Tidligere viste vi den fulde historie af 13D/G-arkiver. Generelt skal enheder, der er forpligtet til at indgive 13D/G-ansøgninger, indgive mindst årligt, før de indsender en afsluttende ansøgning. Dog forlader fonde nogle gange positioner uden at indsende en afsluttende ansøgning (dvs. de afvikler), så visning af den fulde historie resulterede nogle gange i forvirring om det nuværende ejerskab. For at undgå forvirring viser vi nu kun 'aktuelle' ejere - det vil sige - ejere, der har anmeldt inden for det seneste år.
Upgrade to unlock premium data.
| Fil dato | Form | Investor | Forrige Aktier |
Seneste Aktier |
Δ Aktier (Procent) |
Ejendomsret (Procent) |
Δ Ejerskab (Procent) |
|
|---|---|---|---|---|---|---|---|---|
| 2024-11-08 | MORGAN STANLEY | 8,064,766 | 5,953,390 | -26.18 | 4.40 | -25.42 |
13F og NPORT arkivering
Detaljer om 13F-arkivering er gratis. Detaljer om NP-ansøgninger kræver et premium-medlemskab. Grønne rækker angiver nye positioner. Røde rækker angiver lukkede positioner. Klik på linket ikon for at se den fulde transaktionshistorik.
Opgrader
for at låse premium-data op og eksportere til Excel ![]() .
.
| Fil dato | Kilde | Investor | Type | Gennemsnitlig pris (Øst) |
Aktier | Δ Aktier (%) |
Rapporteret Værdi ($1000) |
Δ Værdi (%) |
Port Alloc (%) |
|
|---|---|---|---|---|---|---|---|---|---|---|
| 2025-07-29 | 13F | International Assets Investment Management, Llc | 82.452 | 0,00 | 444 | 0,23 | ||||
| 2025-08-13 | 13F | Invesco Ltd. | 2.529.455 | 9,70 | 13.634 | 9,90 | ||||
| 2025-08-12 | 13F | DCF Advisers, LLC | 371.713 | 14,47 | 2.004 | 14,72 | ||||
| 2025-07-14 | 13F | Sowell Financial Services LLC | 373.043 | -6,82 | 2.011 | -6,64 | ||||
| 2025-07-23 | 13F | Tcfg Wealth Management, Llc | 19.093 | 0,00 | 103 | 0,00 | ||||
| 2025-08-14 | 13F | Polar Asset Management Partners Inc. | 1.495.667 | 70,10 | 8.062 | 70,42 | ||||
| 2025-08-14 | 13F | Royal Bank Of Canada | 232.347 | -12,69 | 1.253 | -12,50 | ||||
| 2025-08-14 | 13F | GWM Advisors LLC | 74.608 | 39,43 | 402 | 40,07 | ||||
| 2025-08-27 | NP | THRIVENT SERIES FUND INC - Thrivent Balanced Income Plus Portfolio Class A | 12.530 | 0,00 | 68 | 0,00 | ||||
| 2025-07-24 | 13F | IFP Advisors, Inc | 1.262 | 0,00 | 7 | 0,00 | ||||
| 2025-07-10 | 13F | Atticus Wealth Management, Llc | 1.799 | 0,00 | 10 | 0,00 | ||||
| 2025-08-27 | NP | ACEFX - Absolute Strategies Fund Institutional Shares | 62.100 | 124.100,00 | 335 | |||||
| 2025-07-21 | 13F | Hilltop National Bank | 700 | 40,00 | 4 | 50,00 | ||||
| 2025-08-12 | 13F | Advisors Asset Management, Inc. | 1.289.447 | 11,88 | 6.950 | 12,10 | ||||
| 2025-07-17 | 13F | Sound Income Strategies, LLC | 4.365 | 3,12 | 24 | 4,55 | ||||
| 2025-08-15 | 13F | Provenance Wealth Advisors, LLC | 0 | -100,00 | 0 | -100,00 | ||||
| 2025-08-12 | 13F | Global Retirement Partners, LLC | 0 | -100,00 | 0 | |||||
| 2025-07-17 | 13F | Venture Visionary Partners LLC | 483.595 | 0,00 | 2.607 | 0,19 | ||||
| 2025-08-06 | 13F | Disciplined Investors, L.L.C. | 13.329 | -18,73 | 72 | -19,32 | ||||
| 2025-07-14 | 13F | Occidental Asset Management, LLC | 13.477 | -0,44 | 73 | 0,00 | ||||
| 2025-07-24 | 13F | Accredited Investor Services, Llc | 30.496 | 17,79 | 164 | 17,99 | ||||
| 2025-08-15 | 13F | First Heartland Consultants, Inc. | 31.012 | 0,00 | 167 | 0,60 | ||||
| 2025-07-16 | 13F | Castleview Partners, Llc | 216.087 | 1.165 | ||||||
| 2025-08-14 | 13F | Bank Of America Corp /de/ | 298.997 | -81,85 | 1.612 | -81,82 | ||||
| 2025-08-14 | 13F | Mariner, LLC | 77.016 | -15,31 | 415 | -15,13 | ||||
| 2025-08-13 | 13F | Level Four Advisory Services, Llc | 29.256 | 0,78 | 158 | 0,64 | ||||
| 2025-08-13 | 13F | Cary Street Partners Financial Llc | 25.965 | 140 | ||||||
| 2025-08-14 | 13F | UBS Group AG | 259.922 | 79,38 | 1.401 | 79,72 | ||||
| 2025-07-11 | 13F | Seacrest Wealth Management, Llc | 40.498 | -0,52 | 218 | -0,46 | ||||
| 2025-08-08 | 13F | Fiera Capital Corp | 185.336 | -0,89 | 999 | -0,80 | ||||
| 2025-08-15 | 13F | Kestra Advisory Services, LLC | 67.933 | 10,87 | 366 | 11,25 | ||||
| 2025-08-15 | 13F | Captrust Financial Advisors | 65.559 | 264,22 | 353 | 267,71 | ||||
| 2025-08-08 | 13F | Creative Planning | 0 | -100,00 | 0 | |||||
| 2025-08-13 | 13F | StoneX Group Inc. | 18.492 | -37,49 | 100 | -37,74 | ||||
| 2025-07-15 | 13F | Absolute Investment Advisers Llc | 1.847.341 | 9.957 | ||||||
| 2025-05-30 | NP | Rivernorth Opportunities Fund, Inc. | 100 | -99,96 | 1 | -100,00 | ||||
| 2025-08-12 | 13F | Steward Partners Investment Advisory, Llc | 248.766 | 96,94 | 1.341 | 97,35 | ||||
| 2025-08-14 | 13F | Quarry LP | 749.998 | 85,54 | 4.042 | 85,92 | ||||
| 2025-05-06 | 13F | AE Wealth Management LLC | 0 | -100,00 | 0 | -100,00 | ||||
| 2025-08-12 | 13F | Proequities, Inc. | 0 | 0 | ||||||
| 2025-08-13 | 13F | Cresset Asset Management, LLC | 0 | -100,00 | 0 | |||||
| 2025-07-10 | 13F | Stolper Co | 238.694 | 10,71 | 1 | 0,00 | ||||
| 2025-07-09 | 13F | VisionPoint Advisory Group, LLC | 27.082 | 146 | ||||||
| 2025-08-01 | 13F | Envestnet Asset Management Inc | 84.126 | -1,58 | 453 | -1,31 | ||||
| 2025-08-28 | NP | YYY - Amplify High Income ETF | 938.691 | 2,58 | 5.060 | 2,78 | ||||
| 2025-07-25 | 13F | We Are One Seven, LLC | 0 | -100,00 | 0 | |||||
| 2025-08-14 | 13F | Jane Street Group, Llc | 92.965 | 269,61 | 501 | 271,11 | ||||
| 2025-08-27 | NP | THRIVENT SERIES FUND INC - Thrivent Opportunity Income Plus Portfolio Class A | 25.612 | 0,00 | 138 | 0,73 | ||||
| 2025-07-15 | 13F | Retirement Income Solutions, Inc | 0 | -100,00 | 0 | |||||
| 2025-08-12 | 13F | Pathstone Holdings, LLC | 1.631.883 | 2.002,35 | 8.796 | 1.858,80 | ||||
| 2025-07-08 | 13F | Nbc Securities, Inc. | 251.166 | 15,15 | 1 | 0,00 | ||||
| 2025-08-14 | 13F | Robinson Capital Management, Llc | 120.650 | 650 | ||||||
| 2025-07-31 | 13F | Cambridge Investment Research Advisors, Inc. | 17.787 | -76,66 | 0 | |||||
| 2025-08-12 | 13F | LPL Financial LLC | 794.908 | 35,41 | 4.285 | 35,66 | ||||
| 2025-08-08 | 13F | Hartland & Co., LLC | 24.290 | 64,85 | 131 | 64,56 | ||||
| 2025-08-13 | 13F | Lido Advisors, LLC | 198.167 | 7,14 | 1.079 | 7,26 | ||||
| 2025-07-30 | 13F | Forum Financial Management, LP | 15.000 | 0,00 | 81 | 0,00 | ||||
| 2025-08-27 | NP | THRIVENT SERIES FUND INC - Thrivent Diversified Income Plus Portfolio Class A | 31.444 | 0,00 | 169 | 0,00 | ||||
| 2025-05-14 | 13F | Huntington National Bank | 10 | |||||||
| 2025-08-14 | 13F | Sunbelt Securities, Inc. | 2.710 | 8,40 | 15 | 15,38 | ||||
| 2025-07-28 | NP | PCEF - Invesco CEF Income Composite ETF This fund is a listed as child fund of Invesco Ltd. and if that institution has disclosed ownership in this security, then these positions will not be double counted when calculating total shares and total value | 1.717.513 | 30,35 | 8.983 | 22,84 | ||||
| 2025-08-27 | NP | RYDEX VARIABLE TRUST - Multi-Hedge Strategies Fund Variable Annuity | 591 | 278,85 | 3 | |||||
| 2025-06-27 | NP | Calamos ETF Trust - Calamos CEF Income & Arbitrage ETF | 120.972 | 7,69 | 638 | 1,59 | ||||
| 2025-07-14 | 13F | Maryland Capital Advisors Inc. | 5.000 | 27 | ||||||
| 2025-08-05 | 13F | Fullcircle Wealth Llc | 104.188 | 37,87 | 573 | 48,06 | ||||
| 2025-08-14 | 13F | Smartleaf Asset Management LLC | 401 | 0,00 | 2 | 0,00 | ||||
| 2025-07-25 | 13F | Apollon Wealth Management, LLC | 32.140 | 190,60 | 173 | 193,22 | ||||
| 2025-07-31 | 13F | Anchor Capital Management Group Inc | 175.000 | 0,00 | 943 | 0,21 | ||||
| 2025-08-13 | 13F | First Trust Advisors Lp | 375.696 | -9,74 | 2.025 | -9,56 | ||||
| 2025-05-30 | NP | RNDLX - RiverNorth/DoubleLine Strategic Income Fund Class R | 100 | -99,88 | 1 | -100,00 | ||||
| 2025-08-12 | 13F | Deutsche Bank Ag\ | 63.386 | -70,39 | 342 | -70,37 | ||||
| 2025-05-30 | NP | RNOTX - RiverNorth/Oaktree High Income Fund Class R | 100 | -99,87 | 1 | -100,00 | ||||
| 2025-08-15 | 13F | Prevail Innovative Wealth Advisors, Llc | 354.680 | 35,45 | 1.912 | 35,72 | ||||
| 2025-08-06 | 13F | Commonwealth Equity Services, Llc | 83.123 | 9,28 | 0 | |||||
| 2025-07-21 | 13F | Future Financial Wealth Managment LLC | 91.476 | 493 | ||||||
| 2025-07-08 | 13F | Allen Mooney & Barnes Investment Advisors LLC | 14.601 | 0,00 | 79 | 0,00 | ||||
| 2025-08-14 | 13F | First Foundation Advisors | 12.000 | 0,00 | 65 | 0,00 | ||||
| 2025-08-12 | 13F | Gladstone Institutional Advisory LLC | 56.474 | 0,00 | 304 | 0,33 | ||||
| 2025-08-08 | 13F | Meridian Wealth Management, LLC | 57.762 | 1,49 | 311 | 1,63 | ||||
| 2025-08-14 | 13F | EP Wealth Advisors, Inc. | 18.860 | -21,09 | 102 | -21,09 | ||||
| 2025-08-13 | 13F | Virtus Investment Advisers, Inc. | 163.884 | -19,09 | 883 | -18,92 | ||||
| 2025-08-14 | 13F | Ausdal Financial Partners, Inc. | 161.713 | -0,08 | 872 | 0,11 | ||||
| 2025-07-10 | 13F | Wealth Enhancement Advisory Services, Llc | 27.897 | -1,43 | 153 | 0,00 | ||||
| 2025-08-06 | 13F | North Capital, Inc. | 0 | -100,00 | 0 | |||||
| 2025-07-21 | 13F | Ameritas Advisory Services, LLC | 10.325 | -4,62 | 56 | -9,84 | ||||
| 2025-08-07 | 13F | Hennion & Walsh Asset Management, Inc. | 85.296 | -0,12 | 460 | 0,00 | ||||
| 2025-08-11 | 13F | HHM Wealth Advisors, LLC | 0 | -100,00 | 0 | |||||
| 2025-07-10 | 13F | Oliver Lagore Vanvalin Investment Group | 933 | 0,00 | 5 | 0,00 | ||||
| 2025-07-21 | 13F | First National Bank & Trust Co Of Newtown | 114.520 | -0,06 | 617 | 0,16 | ||||
| 2025-08-13 | 13F | Rsm Us Wealth Management Llc | 67.313 | 16,78 | 366 | 16,93 | ||||
| 2025-08-15 | 13F | Tower Research Capital LLC (TRC) | 0 | -100,00 | 0 | |||||
| 2025-07-24 | NP | DFRAX - DWS Floating Rate Fund Class A | 63.386 | -70,39 | 332 | -72,14 | ||||
| 2025-09-09 | 13F | NWF Advisory Services Inc. | 49.800 | 0,00 | 268 | 0,37 | ||||
| 2025-08-13 | 13F | Icon Advisers Inc/co | 64.776 | 349 | ||||||
| 2025-08-06 | 13F | Tabor Asset Management, LP | 0 | -100,00 | 0 | -100,00 | ||||
| 2025-08-05 | 13F | GHP Investment Advisors, Inc. | 550 | 0,00 | 3 | 0,00 | ||||
| 2025-08-14 | 13F | Bramshill Investments, LLC | 150.459 | 19,80 | 811 | 20,00 | ||||
| 2025-08-18 | 13F | Geneos Wealth Management Inc. | 34.629 | -1,85 | 187 | -1,59 | ||||
| 2025-07-15 | 13F | DKM Wealth Management, Inc. | 15.000 | 0,00 | 81 | 0,00 | ||||
| 2025-08-08 | 13F | Avantax Advisory Services, Inc. | 75.180 | 79,44 | 405 | 80,00 | ||||
| 2025-08-26 | 13F/A | Thrivent Financial For Lutherans | 391.087 | -50,00 | 2 | -50,00 | ||||
| 2025-04-23 | 13F | Navis Wealth Advisors, LLC | 0 | -100,00 | 0 | |||||
| 2025-08-11 | 13F | Elequin Capital Lp | 0 | -100,00 | 0 | |||||
| 2025-08-11 | 13F | Keyes, Stange & Wooten Wealth Management, LLC | 26.820 | 2,44 | 145 | 2,86 | ||||
| 2025-07-31 | 13F | Oppenheimer & Co Inc | 10.147 | -12,67 | 55 | -12,90 | ||||
| 2025-08-13 | 13F | Fiduciary Group LLC | 12.950 | 0,00 | 70 | 0,00 | ||||
| 2025-08-19 | 13F | National Asset Management, Inc. | 35.771 | -1,84 | 193 | -7,25 | ||||
| 2025-08-14 | 13F | Garden State Investment Advisory Services LLC | 12.773 | 0,48 | 69 | 0,00 | ||||
| 2025-08-08 | 13F | City Of London Investment Management Co Ltd | 635.847 | 238,70 | 3.427 | 239,64 | ||||
| 2025-07-28 | 13F | Harbour Investments, Inc. | 44.624 | 54,49 | 241 | 54,84 | ||||
| 2025-07-29 | 13F | Private Trust Co Na | 9.000 | 0,00 | 49 | 0,00 | ||||
| 2025-08-14 | 13F | Boston Private Wealth Llc | 0 | -100,00 | 0 | |||||
| 2025-06-26 | NP | ATCAX - Anchor Risk Managed Credit Strategies Fund Advisor Class Shares | 175.000 | 0,00 | 915 | -5,77 | ||||
| 2025-08-14 | 13F | Wells Fargo & Company/mn | 1.912.762 | 1,42 | 10.310 | 1,61 | ||||
| 2025-05-14 | 13F | Virtus ETF Advisers LLC | 0 | -100,00 | 0 | |||||
| 2025-07-17 | 13F | Halbert Hargrove Global Advisors, Llc | 3.000 | 0,00 | 16 | 0,00 | ||||
| 2025-06-26 | NP | AABFX - Thrivent Balanced Income Plus Fund Class A | 12.898 | 0,00 | 68 | -6,94 | ||||
| 2025-08-07 | 13F | Allworth Financial LP | 15.250 | 82 | ||||||
| 2025-08-07 | 13F | Encompass More Asset Management | 125.476 | 0,80 | 676 | 1,05 | ||||
| 2025-08-11 | 13F | HighTower Advisors, LLC | 10.414 | 56 | ||||||
| 2025-08-13 | 13F | Walleye Capital LLC | 0 | -100,00 | 0 | |||||
| 2025-08-28 | NP | RNCOX - RiverNorth Core Opportunity Fund Class R | 81.830 | 81.730,00 | 441 | |||||
| 2025-08-12 | 13F | CIBC Private Wealth Group, LLC | 8.061 | 0,99 | 43 | 10,26 | ||||
| 2025-08-05 | 13F | Shaker Financial Services, LLC | 24.452 | 135 | ||||||
| 2025-08-14 | 13F | CoreCap Advisors, LLC | 17.115 | 0,00 | 92 | 0,00 | ||||
| 2025-08-27 | NP | RYMSX - Guggenheim Multi-Hedge Strategies Fund Class P | 351 | 194,96 | 2 | |||||
| 2025-08-06 | 13F | Penserra Capital Management LLC | 948.351 | 3,64 | 5 | 25,00 | ||||
| 2025-05-30 | NP | Rivernorth/doubleline Strategic Opportunity Fund, Inc. | 100 | -99,97 | 1 | -100,00 | ||||
| 2025-08-14 | 13F | Alpine Global Management, LLC | 0 | -100,00 | 0 | |||||
| 2025-08-14 | 13F | Comerica Bank | 29.246 | -62,66 | 158 | -62,71 | ||||
| 2025-08-27 | NP | AAHYX - Thrivent Diversified Income Plus Fund Class A | 50.149 | 0,00 | 270 | 0,37 | ||||
| 2025-07-24 | 13F | Us Bancorp \de\ | 4.492 | 0,00 | 24 | 0,00 | ||||
| 2025-08-07 | 13F | Readystate Asset Management Lp | 291.903 | 1.573 | ||||||
| 2025-06-26 | NP | AAINX - Thrivent Opportunity Income Plus Fund Class A | 102.539 | 0,00 | 540 | -5,76 | ||||
| 2025-04-22 | 13F | Synergy Financial Management, LLC | 0 | -100,00 | 0 | |||||
| 2025-08-08 | 13F | Calamos Advisors LLC | 120.972 | 12,00 | 652 | 12,22 | ||||
| 2025-08-01 | 13F | Ashton Thomas Private Wealth, LLC | 19.721 | 51,21 | 107 | 52,86 | ||||
| 2025-07-31 | 13F | Glass Jacobson Investment Advisors llc | 0 | -100,00 | 0 | |||||
| 2025-08-04 | 13F | Kovack Advisors, Inc. | 56.940 | 89,80 | 307 | 90,06 | ||||
| 2025-07-15 | 13F | Financial Management Professionals, Inc. | 846 | 20,00 | 5 | 33,33 | ||||
| 2025-08-11 | 13F | WPG Advisers, LLC | 6.151 | -22,25 | 33 | -21,43 | ||||
| 2025-07-29 | 13F | Koshinski Asset Management, Inc. | 130.257 | -2,25 | 702 | -1,96 | ||||
| 2025-04-21 | 13F | ORG Partners LLC | 0 | -100,00 | 0 | |||||
| 2025-07-11 | 13F | Annex Advisory Services, LLC | 16.725 | 0,00 | 90 | 1,12 | ||||
| 2025-05-14 | 13F | Van Hulzen Asset Management, LLC | 0 | -100,00 | 0 | -100,00 | ||||
| 2025-08-14 | 13F | Sit Investment Associates Inc | 2.225.536 | 487,58 | 12 | 450,00 | ||||
| 2025-07-25 | 13F | Cwm, Llc | 5.041 | 0,00 | 0 | |||||
| 2025-05-08 | 13F | Private Advisory Group LLC | 0 | -100,00 | 0 | -100,00 | ||||
| 2025-07-10 | 13F | Sovran Advisors, LLC | 214.914 | -44,28 | 1.173 | -39,29 | ||||
| 2025-08-14 | 13F | Raymond James Financial Inc | 1.532.147 | -4,91 | 8.258 | -4,73 | ||||
| 2025-08-15 | 13F | Morgan Stanley | 10.640.087 | 8,66 | 57.350 | 8,87 | ||||
| 2025-06-30 | NP | CVY - Invesco Zacks Multi-Asset Income ETF This fund is a listed as child fund of Invesco Ltd. and if that institution has disclosed ownership in this security, then these positions will not be double counted when calculating total shares and total value | 130.300 | -3,40 | 687 | -8,90 | ||||
| 2025-08-05 | 13F | Tsfg, Llc | 3.000 | 0,00 | 0 | |||||
| 2025-08-13 | 13F | Beacon Pointe Advisors, LLC | 51.758 | 1,92 | 279 | 1,83 | ||||
| 2025-08-14 | 13F | Cohen & Steers, Inc. | 734.738 | 0,00 | 4 | 0,00 | ||||
| 2025-08-14 | 13F | Susquehanna International Group, Llp | 81.153 | 437 | ||||||
| 2025-07-07 | 13F | Centurion Wealth Management LLC | 66.465 | -2,06 | 358 | -7,25 | ||||
| 2025-08-12 | 13F | Coldstream Capital Management Inc | 0 | -100,00 | 0 | |||||
| 2025-08-08 | 13F | Family Firm, Inc. | 124.051 | 2,86 | 669 | 3,09 | ||||
| 2025-08-05 | 13F | Kesler, Norman & Wride, LLC | 11.151 | -1,02 | 60 | 0,00 | ||||
| 2025-08-15 | 13F | Equitable Holdings, Inc. | 0 | -100,00 | 0 | |||||
| 2025-08-14 | 13F | Ameriprise Financial Inc | 552.310 | 20,37 | 2.977 | 20,58 | ||||
| 2025-08-08 | 13F/A | Ignite Planners, LLC | 17.891 | 28,68 | 98 | 32,43 | ||||
| 2025-08-13 | 13F | Summit Financial, LLC | 56.897 | 310 | ||||||
| 2025-08-08 | 13F | Cetera Investment Advisers | 360.249 | -9,05 | 1.942 | -8,92 | ||||
| 2025-08-14 | 13F | Cable Car Capital LLC | 0 | -100,00 | 0 | |||||
| 2025-07-30 | NP | HYIN - WisdomTree Alternative Income Fund N/A | 407.112 | 46,47 | 2.129 | 38,07 | ||||
| 2025-05-08 | 13F | Plante Moran Financial Advisors, LLC | 0 | -100,00 | 0 | |||||
| 2025-08-12 | 13F | Virtu Financial LLC | 21.661 | 78,21 | 0 | |||||
| 2025-07-16 | 13F | PFS Partners, LLC | 1.000 | 5 | ||||||
| 2025-08-12 | 13F | J.w. Cole Advisors, Inc. | 211.630 | 10,18 | 1.141 | 10,36 | ||||
| 2025-08-08 | 13F | Pnc Financial Services Group, Inc. | 16.200 | 0,00 | 87 | 0,00 | ||||
| 2025-08-04 | 13F | Assetmark, Inc | 41 | -92,26 | 0 | -100,00 | ||||
| 2025-08-14 | 13F | Oak Hill Advisors Lp | 3.301.932 | -50,35 | 17.797 | -0,51 | ||||
| 2025-08-04 | 13F | Integrity Alliance, Llc. | 0 | -100,00 | 0 | |||||
| 2025-07-23 | 13F | Sax Wealth Advisors, Llc | 12.374 | 0,00 | 67 | 0,00 | ||||
| 2025-07-25 | NP | FCEF - First Trust CEF Income Opportunity ETF This fund is a listed as child fund of First Trust Advisors Lp and if that institution has disclosed ownership in this security, then these positions will not be double counted when calculating total shares and total value | 144.026 | -26,36 | 753 | -30,60 | ||||
| 2025-08-14 | 13F | Millennium Management Llc | 48.686 | 262 | ||||||
| 2025-08-12 | 13F | Landscape Capital Management, L.l.c. | 291.952 | -11,23 | 1.574 | -11,08 | ||||
| 2025-08-20 | NP | LSPAX - LoCorr Spectrum Income Fund Class A | 137.766 | 20,00 | 743 | 20,26 | ||||
| 2025-06-25 | NP | VPC - Virtus Private Credit Strategy ETF | 225.536 | 41,95 | 1.189 | 33,78 | ||||
| 2025-08-11 | 13F | Private Advisor Group, LLC | 0 | -100,00 | 0 | |||||
| 2025-09-04 | 13F/A | Advisor Group Holdings, Inc. | 129.605 | 9,81 | 699 | 9,92 | ||||
| 2025-07-16 | 13F | Formidable Asset Management, LLC | 18.300 | 0,00 | 98 | 0,00 | ||||
| 2025-08-13 | 13F | Thomas J. Herzfeld Advisors, Inc. | 676.389 | 3.646 | ||||||
| 2025-05-15 | 13F | Ancora Advisors, LLC | 0 | -100,00 | 0 | |||||
| 2025-08-12 | 13F | SRS Capital Advisors, Inc. | 235 | 1 | ||||||
| 2025-08-18 | 13F | Hollencrest Capital Management | 19.780 | 0,00 | 107 | 0,00 | ||||
| 2025-08-15 | 13F | CI Private Wealth, LLC | 45.378 | -11,87 | 245 | -11,91 | ||||
| 2025-07-17 | 13F | Wolff Wiese Magana Llc | 350 | 0,00 | 2 | 0,00 | ||||
| 2025-08-13 | 13F | Townsquare Capital Llc | 0 | -100,00 | 0 | |||||
| 2025-07-15 | 13F | Main Street Group, LTD | 500 | 0,00 | 3 | 0,00 | ||||
| 2025-08-14 | 13F | Boothbay Fund Management, Llc | 0 | -100,00 | 0 | |||||
| 2025-08-14 | 13F | Almitas Capital LLC | 63.388 | 342 | ||||||
| 2025-08-14 | 13F | Mml Investors Services, Llc | 23.400 | 0,33 | 0 | |||||
| 2025-07-15 | 13F | SJS Investment Consulting Inc. | 330 | 0,00 | 2 | 0,00 | ||||
| 2025-04-15 | 13F | Noble Wealth Management PBC | 2.000 | 11 | ||||||
| 2025-05-07 | 13F | Sheaff Brock Investment Advisors, LLC | 12.650 | 0,00 | 68 | -4,23 | ||||
| 2025-07-11 | 13F | Quad-Cities Investment Group, LLC | 23.262 | -30,70 | 125 | -30,56 | ||||
| 2025-05-09 | 13F | Cornerstone Advisors, LLC | 0 | -100,00 | 0 | -100,00 | ||||
| 2025-07-11 | 13F | Farther Finance Advisors, LLC | 8.902 | 138,28 | 48 | 147,37 | ||||
| 2025-08-11 | 13F | SFI Advisors, LLC | 0 | -100,00 | 0 | |||||
| 2025-07-14 | 13F | Park Avenue Securities Llc | 36.748 | -4,34 | 0 | |||||
| 2025-08-25 | NP | IOBAX - ICON FLEXIBLE BOND FUND Investor Class | 64.776 | 349 | ||||||
| 2025-04-24 | 13F | Total Wealth Planning & Management, Inc. | 0 | -100,00 | 0 | |||||
| 2025-08-13 | 13F | Guggenheim Capital Llc | 2.815.113 | 12,87 | 15.173 | 13,08 | ||||
| 2025-07-25 | 13F | Concurrent Investment Advisors, LLC | 21.394 | 0,00 | 115 | 0,00 | ||||
| 2025-08-01 | 13F | Alexander Labrunerie & Co., Inc. | 47.903 | 32,37 | 258 | 32,99 | ||||
| 2025-09-10 | 13F | WT Wealth Management | 15.488 | 0,00 | 83 | 0,00 | ||||
| 2025-08-13 | 13F | Smith, Moore & Co. | 13.155 | 6,05 | 71 | 6,06 | ||||
| 2025-08-12 | 13F | Bokf, Na | 0 | -100,00 | 0 | |||||
| 2025-08-27 | NP | RBNAX - Robinson Opportunistic Income Fund Class A Shares | 120.000 | 647 | ||||||
| 2025-08-14 | 13F | Stifel Financial Corp | 340.699 | 1,79 | 1.836 | 2,00 | ||||
| 2025-07-15 | 13F | BKA Wealth Consulting, Inc. | 145.963 | -29,50 | 787 | -29,38 | ||||
| 2025-07-30 | 13F | FNY Investment Advisers, LLC | 1.800 | 0,00 | 0 | |||||
| 2025-07-22 | 13F | Merit Financial Group, LLC | 46.963 | 95,03 | 253 | 96,12 | ||||
| 2025-08-06 | 13F | Wedbush Securities Inc | 55.101 | 1,97 | 0 | |||||
| 2025-08-18 | 13F/A | National Bank Of Canada /fi/ | 2.230 | -40,21 | 12 | -40,00 | ||||
| 2025-08-13 | 13F | Yakira Capital Management, Inc. | 253.121 | -72,78 | 1.364 | -72,74 | ||||
| 2025-08-14 | 13F | Rivernorth Capital Management, Llc | 81.830 | 441 |