Grundlæggende statistik
| Institutionelle aktier (lange) | 374.256.797 - 63,56% (ex 13D/G) - change of -88,18MM shares -19,07% MRQ |
| Institutionel værdi (lang) | $ 5.264.051 USD ($1000) |
Institutionelt ejerskab og aktionærer
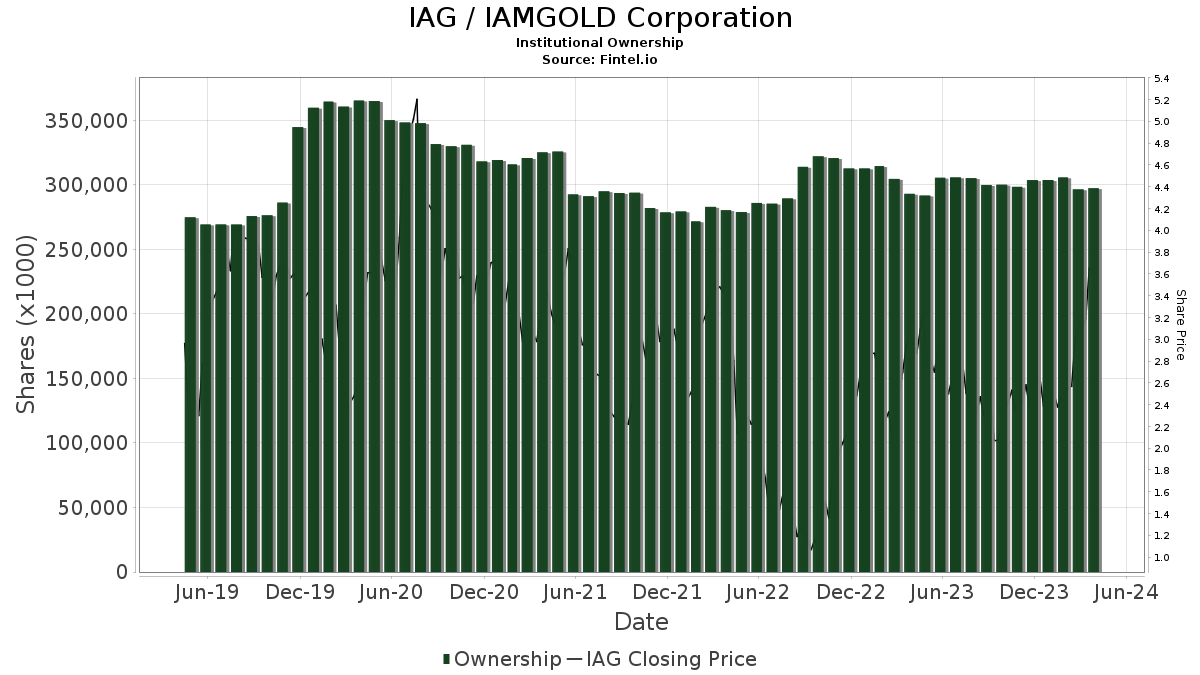
IAMGOLD Corporation (US:IAG) har 309 institutionelle ejere og aktionærer, der har indsendt 13D/G- eller 13F-formularer til Securities Exchange Commission (SEC). Disse institutioner har i alt 374,256,797 aktier. Største aktionærer omfatter Van Eck Associates Corp, FIL Ltd, Fmr Llc, Vanguard Group Inc, Donald Smith & Co., Inc., BlackRock, Inc., Bank Of America Corp /de/, American Century Companies Inc, Dimensional Fund Advisors Lp, and VASVX - Vanguard Selected Value Fund Investor Shares .
IAMGOLD Corporation (NYSE:IAG) institutionel ejerskabsstruktur viser aktuelle positioner i virksomheden efter institutioner og fonde, samt seneste ændringer i positionsstørrelse. Større aktionærer kan omfatte individuelle investorer, investeringsforeninger, hedgefonde eller institutioner. Skema 13D angiver, at investoren besidder (eller besidder) mere end 5 % af virksomheden og har til hensigt (eller har til hensigt at) aktivt at forfølge en ændring i forretningsstrategi. Skema 13G indikerer en passiv investering på over 5%.
The share price as of March 23, 2026 is 16,87 / share. Previously, on March 24, 2025, the share price was 5,94 / share. This represents an increase of 184,01% over that period.
Fondens stemningsscore
Fund Sentiment Score (fka Ownership Accumulation Score) finder de aktier, der bliver mest købt af fonde. Det er resultatet af en sofistikeret, multi-faktor kvantitativ model, der identificerer virksomheder med de højeste niveauer af institutionel akkumulering. Scoringsmodellen bruger en kombination af den samlede stigning i oplyste ejere, ændringerne i porteføljeallokeringer i disse ejere og andre målinger. Tallet går fra 0 til 100, hvor højere tal indikerer et højere niveau af akkumulering for sine jævnaldrende, og 50 er gennemsnittet.
Opdateringsfrekvens: Dagligt
Se Ownership Explorer, som giver en liste over højest rangerende virksomheder.
AI+ Ask Fintel’s AI assistant about IAMGOLD Corporation.
Select a question to share a public post with an AI-crafted answer.
Thinking of good questions…
Institutionel Put/Call-forhold
Ud over at indberette standardaktie- og gældsudstedelser skal institutter med mere end 100 mill. aktiver under forvaltning også oplyse deres put- og call-optionsbeholdninger. Da salgsoptioner generelt indikerer negativ stemning, og købsoptioner indikerer positiv stemning, kan vi få en fornemmelse af den overordnede institutionelle stemning ved at plotte forholdet mellem put og kald. Diagrammet til højre viser det historiske put/call-forhold for dette instrument.
Brug af Put/Call Ratio som en indikator for investorernes stemning overvinder en af de vigtigste mangler ved at bruge totalt institutionelt ejerskab, som er, at en betydelig mængde af aktiver under forvaltning investeres passivt for at spore indekser. Passivt forvaltede fonde køber typisk ikke optioner, så indikatoren for put/call-forholdet følger mere nøje følelsen af aktivt forvaltede fonde.

13D/G-arkivering
Vi præsenterer 13D/G ansøgninger separat fra 13F ansøgninger på grund af den forskellige behandling af SEC. 13D/G-ansøgninger kan indgives af grupper af investorer (med én ledende), hvorimod 13F-ansøgninger ikke kan. Dette resulterer i situationer, hvor en investor kan indsende en 13D/G, der rapporterer én værdi for de samlede aktier (der repræsenterer alle de aktier, der ejes af investorgruppen), men derefter indsender en 13F, der rapporterer en anden værdi for de samlede aktier (der udelukkende repræsenterer deres egne) ejendomsret). Det betyder, at aktieejerskab af 13D/G-arkiver og 13F-arkiveringer ofte ikke er direkte sammenlignelige, så vi præsenterer dem separat.
Bemærk: Fra den 16. maj 2021 viser vi ikke længere ejere, der ikke har indsendt en 13D/G inden for det seneste år. Tidligere viste vi den fulde historie af 13D/G-arkiver. Generelt skal enheder, der er forpligtet til at indgive 13D/G-ansøgninger, indgive mindst årligt, før de indsender en afsluttende ansøgning. Dog forlader fonde nogle gange positioner uden at indsende en afsluttende ansøgning (dvs. de afvikler), så visning af den fulde historie resulterede nogle gange i forvirring om det nuværende ejerskab. For at undgå forvirring viser vi nu kun 'aktuelle' ejere - det vil sige - ejere, der har anmeldt inden for det seneste år.
Upgrade to unlock premium data.
| Fil dato | Form | Investor | Forrige Aktier |
Seneste Aktier |
Δ Aktier (Procent) |
Ejendomsret (Procent) |
Δ Ejerskab (Procent) |
|
|---|---|---|---|---|---|---|---|---|
| 2026-02-05 | FIL Ltd | 36,367,149 | 6.10 | |||||
| 2026-02-05 | FMR LLC | 9,743,327 | 32,713,937 | 235.76 | 5.50 | 112.52 | ||
| 2025-11-12 | VAN ECK ASSOCIATES CORP | 39,323,605 | 53,023,647 | 34.84 | 9.22 | 34.80 | ||
| 2025-08-14 | DONALD SMITH & CO., INC. | 28,805,304 | 26,937,710 | -6.48 | 4.70 | -6.00 |
13F og NPORT arkivering
Detaljer om 13F-arkivering er gratis. Detaljer om NP-ansøgninger kræver et premium-medlemskab. Grønne rækker angiver nye positioner. Røde rækker angiver lukkede positioner. Klik på linket ikon for at se den fulde transaktionshistorik.
Opgrader
for at låse premium-data op og eksportere til Excel ![]() .
.
| Fil dato | Kilde | Investor | Type | Gennemsnitlig pris (Øst) |
Aktier | Δ Aktier (%) |
Rapporteret Værdi ($1000) |
Δ Værdi (%) |
Port Alloc (%) |
|
|---|---|---|---|---|---|---|---|---|---|---|
| 2025-09-25 | NP | CCNR - ALPS | CoreCommodity Natural Resources ETF | 119.841 | -14,66 | 810 | -18,51 | ||||
| 2026-02-17 | 13F | Prelude Capital Management, Llc | 11.911 | -60,82 | 196 | -50,13 | ||||
| 2026-02-13 | 13F | Great West Life Assurance Co /can/ | 77.462 | -53,39 | 1 | -50,00 | ||||
| 2026-02-13 | 13F | Quarry LP | 636 | -98,45 | 10 | -98,12 | ||||
| 2026-02-13 | 13F | American Century Companies Inc | 8.828.236 | -8,02 | 145.661 | 17,43 | ||||
| 2025-11-14 | 13F | Point72 (DIFC) Ltd | 0 | -100,00 | 0 | -100,00 | ||||
| 2026-02-17 | 13F | Hartree Partners, LP | 0 | -100,00 | 0 | |||||
| 2026-02-17 | 13F | Lazard Asset Management Llc | 26.484 | -61,48 | 437 | -50,79 | ||||
| 2026-02-17 | 13F | Engineers Gate Manager LP | 34.128 | 563 | ||||||
| 2026-02-12 | 13F | Penserra Capital Management LLC | 159.225 | 3 | ||||||
| 2026-02-10 | 13F | Scheer, Rowlett & Associates Investment Management Ltd. | 0 | -100,00 | 0 | |||||
| 2026-02-10 | 13F | State of Wyoming | 13.278 | 219 | ||||||
| 2026-02-13 | 13F | Thomist Capital Management, LP | 493.625 | -53,00 | 8.268 | -38,64 | ||||
| 2026-02-11 | 13F | Winton Capital Group Ltd | 305.068 | -23,10 | 5.031 | -1,93 | ||||
| 2026-02-13 | 13F | First Trust Advisors Lp | 320.007 | 2.763,08 | 5.281 | 3.566,67 | ||||
| 2026-02-13 | 13F | Marshall Wace, Llp | 799.472 | 13.183 | ||||||
| 2026-02-13 | 13F | Mudita Advisors LLP | 0 | -100,00 | 0 | |||||
| 2026-02-17 | 13F | Toronto Dominion Bank | Call | 120.000 | -20,00 | 1.980 | 2,22 | |||
| 2026-02-09 | 13F | Todd Asset Management Llc | 0 | -100,00 | 0 | |||||
| 2026-02-17 | 13F | Toronto Dominion Bank | 225.960 | -5,06 | 3.729 | 21,28 | ||||
| 2026-01-14 | 13F | Appian Way Asset Management LP | 0 | -100,00 | 0 | |||||
| 2026-02-13 | 13F | Wexford Capital Lp | 0 | -100,00 | 0 | |||||
| 2026-03-06 | 13F | Hsbc Holdings Plc | 0 | -100,00 | 0 | |||||
| 2026-02-17 | 13F | Qube Research & Technologies Ltd | 74.012 | 1.220 | ||||||
| 2026-02-13 | 13F | Evelyn Partners Investment Management LLP | 0 | -100,00 | 0 | |||||
| 2025-11-14 | 13F | Mml Investors Services, Llc | 0 | -100,00 | 0 | |||||
| 2026-02-03 | 13F/A | Bank Of America Corp /de/ | Put | 0 | -100,00 | 0 | -100,00 | |||
| 2026-02-09 | 13F | Kingsview Wealth Management, LLC | 0 | -100,00 | 0 | |||||
| 2026-02-13 | 13F | Candriam Luxembourg S.C.A. | 1.540.000 | -25,24 | 25.396 | -4,66 | ||||
| 2026-02-12 | 13F | Sprott Inc. | 6.902.659 | -5,62 | 113.833 | 20,38 | ||||
| 2026-02-13 | 13F | National Bank Of Canada /fi/ | 1.426.707 | -34,81 | 23.400 | -16,80 | ||||
| 2026-02-04 | 13F | Swiss Life Asset Management Ltd | 26.214 | 0,00 | 432 | 27,43 | ||||
| 2026-02-12 | 13F | Sprott Inc. | Call | 60.000 | 1.140 | |||||
| 2026-02-17 | 13F | Murchinson Ltd. | 0 | -100,00 | 0 | |||||
| 2026-02-17 | 13F | Asset One Wealth Management LLC | 107.423 | 1.954 | ||||||
| 2026-02-12 | 13F | Callan Family Office, LLC | 12.030 | 198 | ||||||
| 2025-11-14 | 13F | Axa S.a. | 0 | -100,00 | 0 | -100,00 | ||||
| 2026-02-17 | 13F | Millennium Management Llc | 3.300.768 | 1,16 | 54.432 | 29,01 | ||||
| 2026-02-18 | 13F | GWM Advisors LLC | 75 | 0,00 | 1 | |||||
| 2025-11-12 | 13F | Picton Mahoney Asset Management | Call | 0 | -100,00 | 0 | -100,00 | |||
| 2026-01-27 | 13F | Fiduciary Advisors, Inc. | 8 | 0 | ||||||
| 2026-02-06 | 13F | Leonteq Securities AG | 1.300 | 21 | ||||||
| 2026-02-13 | 13F | Morgan Stanley | 1.322.664 | 6,23 | 21.811 | 35,47 | ||||
| 2026-02-10 | 13F | CIBC Asset Management Inc | 530.449 | -2,06 | 8.759 | 25,31 | ||||
| 2026-02-17 | 13F | State Of Wisconsin Investment Board | 14.788 | 244 | ||||||
| 2026-02-10 | 13F | CIBC World Markets Inc. | 1.793.058 | -10,48 | 29.585 | 14,35 | ||||
| 2026-02-17 | 13F | Canada Pension Plan Investment Board | 0 | -100,00 | 0 | |||||
| 2026-02-12 | 13F | DJE Kapital AG | 259.800 | 9,21 | 4.305 | 150,96 | ||||
| 2026-02-17 | 13F | SIG North Trading, ULC | Call | 265.800 | -14,62 | 4.383 | 8,89 | |||
| 2026-02-17 | 13F | SIG North Trading, ULC | 78.889 | 328,88 | 1.301 | 448,52 | ||||
| 2026-02-17 | 13F | SIG North Trading, ULC | Put | 47.800 | 246,38 | 788 | 342,70 | |||
| 2025-11-07 | 13F | Berkshire Asset Management Llc/pa | 0 | -100,00 | 0 | |||||
| 2025-09-25 | NP | DFA INVESTMENT DIMENSIONS GROUP INC - World ex U.S. Core Equity Portfolio Institutional Class Shares | 12.000 | -95,09 | 81 | -95,09 | ||||
| 2026-01-13 | 13F | Synergy Financial Management, LLC | 18.875 | -73,91 | 311 | -58,42 | ||||
| 2026-02-10 | 13F | Jupiter Asset Management Ltd | 0 | -100,00 | 0 | |||||
| 2026-01-27 | 13F | Ninety One UK Ltd | 5.144.604 | 22,32 | 84.835 | 56,00 | ||||
| 2026-02-17 | 13F | Millennium Management Llc | Put | 0 | -100,00 | 0 | ||||
| 2026-02-06 | 13F | Harvest Portfolios Group Inc. | 122.519 | -10,88 | 2.022 | 13,80 | ||||
| 2025-09-25 | NP | JIVE - JPMorgan International Value ETF | 173.854 | 145,89 | 1.174 | 134,33 | ||||
| 2025-09-26 | NP | EPGFX - EuroPac Gold Fund Class A | 330.000 | 230,00 | 2.231 | 301,80 | ||||
| 2026-02-12 | 13F | Dimensional Fund Advisors Lp | 7.773.004 | -21,07 | 128.190 | 0,68 | ||||
| 2025-10-27 | 13F | Eastern Bank | 0 | -100,00 | 0 | |||||
| 2026-02-11 | 13F | CLARET ASSET MANAGEMENT Corp | 60.350 | 0,00 | 1 | |||||
| 2025-09-25 | NP | DISV - Dimensional International Small Cap Value ETF | 2.443.387 | -9,97 | 16.517 | -14,04 | ||||
| 2026-02-13 | 13F | L1 Capital Pty Ltd | 1.252.077 | 961,46 | 20.647 | 1.281,00 | ||||
| 2025-11-13 | 13F | Bank Of Montreal /can/ | Put | 0 | -100,00 | 0 | -100,00 | |||
| 2025-09-26 | NP | TAISX - TIAA-CREF Quant International Small-Cap Equity Fund Advisor Class | 940.857 | -10,25 | 6.356 | -14,45 | ||||
| 2026-02-17 | 13F | Parallax Volatility Advisers, L.P. | Call | 25.000 | 0,00 | 412 | 27,55 | |||
| 2026-01-23 | 13F | Stonehaven Wealth & Tax Solutions, Llc | 0 | -100,00 | 0 | -100,00 | ||||
| 2026-01-20 | 13F | Raab & Moskowitz Asset Management LLC | 10.923 | 0,00 | 180 | 27,66 | ||||
| 2026-02-02 | 13F | Triasima Portfolio Management inc. | 620.937 | -10,53 | 10.260 | 14,41 | ||||
| 2026-02-13 | 13F | Blueshift Asset Management, LLC | 14.388 | 237 | ||||||
| 2025-09-25 | NP | DFIC - Dimensional International Core Equity 2 ETF | 896.866 | 2,29 | 6.063 | -2,34 | ||||
| 2026-02-17 | 13F | Alliancebernstein L.p. | 82.391 | 0,00 | 1.359 | 27,51 | ||||
| 2026-02-05 | 13F | Allworth Financial LP | 81 | 912,50 | 1 | |||||
| 2026-02-13 | 13F | Walleye Capital LLC | 455.373 | -54,47 | 7.509 | -41,93 | ||||
| 2026-02-17 | 13F | Advisory Services Network, LLC | 0 | -100,00 | 0 | |||||
| 2026-02-12 | 13F | Marex Group plc | 75.000 | -6,85 | 1.237 | 18,96 | ||||
| 2026-02-17 | 13F | Scientech Research LLC | 0 | -100,00 | 0 | |||||
| 2025-10-28 | 13F | Campbell & CO Investment Adviser LLC | 0 | -100,00 | 0 | |||||
| 2026-02-13 | 13F/A | Alberta Investment Management Corp | 0 | -100,00 | 0 | -100,00 | ||||
| 2025-10-21 | 13F | SJS Investment Consulting Inc. | 0 | -100,00 | 0 | -100,00 | ||||
| 2026-02-13 | 13F | Smartleaf Asset Management LLC | 273 | 5 | ||||||
| 2026-02-13 | 13F | Aviso Financial Inc. | 0 | -100,00 | 0 | |||||
| 2026-01-27 | 13F | TD Waterhouse Canada Inc. | 19.072 | 54,17 | 313 | 94,41 | ||||
| 2026-02-17 | 13F | Citadel Advisors Llc | Put | 329.400 | -1,20 | 5.432 | 26,01 | |||
| 2026-02-13 | 13F | Rhumbline Advisers | 409 | 0,00 | 7 | 20,00 | ||||
| 2026-02-17 | 13F | Citadel Advisors Llc | Call | 856.000 | -12,23 | 14.115 | 11,93 | |||
| 2026-02-17 | 13F | Oxford Asset Management Llp | 51.825 | -47,93 | 855 | 66,47 | ||||
| 2026-02-12 | 13F | CoreCommodity Management, LLC | 38.363 | -12,76 | 633 | 11,27 | ||||
| 2026-02-13 | 13F | Mariner, LLC | 110.033 | 0,56 | 1.814 | 28,29 | ||||
| 2025-11-10 | 13F | Stevens Capital Management Lp | 0 | -100,00 | 0 | |||||
| 2026-02-17 | 13F | EFG International AG | 5.000 | 82 | ||||||
| 2026-02-24 | 13F | Bell Investment Advisors, Inc | 137 | 107,58 | 2 | |||||
| 2026-02-17 | 13F | Dauntless Investment Group, LLC | 0 | -100,00 | 0 | |||||
| 2026-01-29 | 13F | IMC-Chicago, LLC | Put | 125.300 | 6,01 | 2.066 | 35,21 | |||
| 2026-02-11 | 13F | Deutsche Bank Ag\ | 3.415.886 | 56,17 | 56.328 | 99,16 | ||||
| 2026-01-14 | 13F | Generali Investments CEE, investicni spolecnost, a.s. | 20.000 | 0,00 | 330 | 27,52 | ||||
| 2026-01-29 | 13F | IMC-Chicago, LLC | Call | 253.000 | 66,67 | 4.172 | 112,59 | |||
| 2026-01-27 | 13F | WealthCollab, LLC | 261 | 0,00 | 4 | 33,33 | ||||
| 2026-02-13 | 13F | MAI Capital Management | 100 | 0,00 | 2 | 0,00 | ||||
| 2026-02-11 | 13F | O'shaughnessy Asset Management, Llc | 90.328 | 1.491 | ||||||
| 2025-11-07 | 13F | Shell Asset Management Co | 8.711 | -71,33 | 0 | |||||
| 2026-02-06 | 13F | Bastion Asset Management Inc. | 0 | -100,00 | 0 | |||||
| 2026-02-02 | 13F | PKO Investment Management Joint-Stock Co | 270.000 | 42,11 | 4.464 | 81,72 | ||||
| 2026-01-23 | 13F | LOM Asset Management Ltd | 2.954 | 67 | ||||||
| 2026-02-06 | 13F | Global Retirement Partners, LLC | 2.000 | 33 | ||||||
| 2025-09-25 | NP | TLTD - FlexShares Morningstar Developed Markets ex-US Factor Tilt Index Fund | 14.176 | 3,23 | 96 | -2,06 | ||||
| 2025-09-25 | NP | DFA INVESTMENT DIMENSIONS GROUP INC - International Social Core Equity Portfolio Institutional Class This fund is a listed as child fund of Dimensional Fund Advisors Lp and if that institution has disclosed ownership in this security, then these positions will not be double counted when calculating total shares and total value | 47.139 | 0,00 | 319 | -4,50 | ||||
| 2026-02-09 | 13F | GeoSphere Capital Management | 225.000 | 0,00 | 3.710 | 27,54 | ||||
| 2026-02-12 | 13F | CIBC Private Wealth Group, LLC | 250 | 0,00 | 4 | 33,33 | ||||
| 2026-02-17 | 13F | Citadel Advisors Llc | 3.361.994 | 113,23 | 55.439 | 171,93 | ||||
| 2026-02-17 | 13F | Merewether Investment Management, LP | 3.335.790 | -2,82 | 55.007 | 23,94 | ||||
| 2026-02-12 | 13F | Hrt Financial Lp | 443.223 | 7 | ||||||
| 2026-02-17 | 13F | Gotham Asset Management, LLC | 104.847 | 52,91 | 1.729 | 95,03 | ||||
| 2026-02-17 | 13F | MIRAE ASSET GLOBAL ETFS HOLDINGS Ltd. | 777 | 13 | ||||||
| 2026-02-12 | 13F | Nuveen, LLC | 428.797 | -79,86 | 7.085 | -74,25 | ||||
| 2026-02-17 | 13F | Ameriprise Financial Inc | 123.854 | -1,49 | 2.042 | 25,66 | ||||
| 2025-09-25 | NP | DFIS - Dimensional International Small Cap ETF | 867.585 | 2.062,58 | 5.865 | 2.063,84 | ||||
| 2026-02-10 | 13F | Connor, Clark & Lunn Investment Management Ltd. | 4.955.204 | 46,36 | 81.773 | 86,99 | ||||
| 2026-01-07 | 13F | Aventura Private Wealth, LLC | 3.500 | 0,00 | 58 | 26,67 | ||||
| 2026-01-21 | 13F | Sound Income Strategies, LLC | 400 | 7 | ||||||
| 2026-02-13 | 13F | Barclays Plc | 401.178 | -39,21 | 6.615 | -22,48 | ||||
| 2025-11-14 | 13F | Moore Capital Management, Lp | 0 | -100,00 | 0 | |||||
| 2026-01-29 | 13F | Sanctuary Advisors, LLC | 0 | -100,00 | 0 | -100,00 | ||||
| 2026-02-17 | 13F | D. E. Shaw & Co., Inc. | Call | 370.000 | 6.101 | |||||
| 2026-02-17 | 13F | D. E. Shaw & Co., Inc. | 2.083.614 | -50,99 | 34.364 | -37,47 | ||||
| 2026-02-17 | 13F | Trexquant Investment LP | 394.726 | -61,10 | 6.509 | -50,39 | ||||
| 2025-11-10 | 13F | Tableaux Llc | 0 | -100,00 | 0 | -100,00 | ||||
| 2026-02-12 | 13F | Cibc World Markets Corp | Call | 0 | -100,00 | 0 | ||||
| 2025-11-03 | 13F | Ruffer LLP | 0 | -100,00 | 0 | |||||
| 2026-02-03 | 13F | Navellier & Associates Inc | 97.007 | 1.600 | ||||||
| 2026-02-13 | 13F | Toroso Investments, LLC | 70.609 | 4,02 | 1.164 | 32,73 | ||||
| 2026-01-29 | 13F | UMA Financial Services, Inc. | 113 | 0,00 | 2 | 0,00 | ||||
| 2026-02-13 | 13F | P Schoenfeld Asset Management Lp | 563.937 | -80,21 | 9.299 | -74,76 | ||||
| 2025-11-14 | 13F | ExodusPoint Capital Management, LP | 437.893 | 535,55 | 5.662 | |||||
| 2026-02-13 | 13F | P Schoenfeld Asset Management Lp | Put | 500.000 | 0,00 | 8.245 | 27,53 | |||
| 2026-02-17 | 13F | Graham Capital Management, L.P. | 40.018 | 100,35 | 660 | 155,43 | ||||
| 2026-02-13 | 13F | Banque Transatlantique SA | 0 | -100,00 | 0 | |||||
| 2026-01-29 | 13F | Pictet Asset Management Holding SA | 106.882 | 7,46 | 1.766 | 37,43 | ||||
| 2026-02-13 | 13F | Neuberger Berman Group LLC | 52.702 | 5,19 | 871 | 34,47 | ||||
| 2026-02-12 | 13F | SWAN Capital LLC | 150 | 0,00 | 2 | 100,00 | ||||
| 2026-02-11 | 13F | Fox Run Management, L.l.c. | 43.640 | 720 | ||||||
| 2026-02-17 | 13F | Susquehanna International Group, Llp | Put | 322.900 | -12,71 | 5.325 | 11,33 | |||
| 2026-02-05 | 13F/A | Fulcrum Asset Management LLP | 20.066 | 336 | ||||||
| 2026-02-17 | 13F | Susquehanna International Group, Llp | Call | 1.626.500 | 10,56 | 26.821 | 41,00 | |||
| 2025-09-25 | NP | WELLS FARGO MASTER TRUST - Wells Fargo Real Return Portfolio Real Return Portfolio | 30.500 | 5,17 | 206 | 0,49 | ||||
| 2026-02-05 | 13F | Cardinal Point Capital Management, ULC | 31.550 | -19,41 | 521 | 3,17 | ||||
| 2026-02-17 | 13F | Susquehanna International Group, Llp | 130.240 | -44,38 | 2.148 | -29,07 | ||||
| 2026-02-17 | 13F | Royal Bank Of Canada | 3.801.052 | -7,54 | 62.679 | 17,92 | ||||
| 2026-02-17 | 13F | Cetera Investment Advisers | Call | 0 | -100,00 | 0 | ||||
| 2026-02-05 | 13F | Alpine Associates Management Inc. | 69.482 | 1.147 | ||||||
| 2026-02-13 | 13F | National Bank Of Canada /fi/ | Put | 38 | -49,33 | 63 | -35,42 | |||
| 2026-02-17 | 13F | Adage Capital Partners Gp, L.l.c. | 1.050.000 | 162,50 | 17.314 | 234,76 | ||||
| 2025-09-25 | NP | VT - Vanguard Total World Stock Index Fund ETF Shares | 57.653 | 0,00 | 390 | -4,66 | ||||
| 2025-09-25 | NP | DFSI - Dimensional International Sustainability Core 1 ETF | 15.655 | 19,28 | 106 | 14,13 | ||||
| 2026-02-13 | 13F | NewGen Asset Management Ltd | 0 | -100,00 | 0 | |||||
| 2026-02-17 | 13F | Man Group plc | 293.321 | -59,00 | 4.837 | -47,72 | ||||
| 2025-11-13 | 13F | NewGen Equity Long/Short Fund | 780.000 | -15,78 | 9.032 | 32,49 | ||||
| 2026-03-12 | 13F/A | Peak6 Llc | Call | 284.300 | 25,85 | 4.688 | 60,55 | |||
| 2026-02-17 | 13F | Guggenheim Capital Llc | 391.897 | -19,35 | 6.462 | 2,87 | ||||
| 2026-02-17 | 13F | Edmond De Rothschild Holding S.a. | 343.513 | 21,90 | 5.665 | 55,48 | ||||
| 2026-03-12 | 13F/A | Peak6 Llc | Put | 2.000 | 33 | |||||
| 2026-02-13 | 13F | National Bank Of Canada /fi/ | Call | 344 | -85,68 | 568 | -81,73 | |||
| 2025-11-13 | 13F | Eisler Capital Management Ltd. | 168.689 | 2.212 | ||||||
| 2026-02-11 | 13F | Summer Road Llc | 1.200 | 0,00 | 20 | 26,67 | ||||
| 2026-02-13 | 13F | Bridgefront Capital, LLC | 17.175 | 283 | ||||||
| 2026-01-16 | 13F | FNY Investment Advisers, LLC | 2.357 | 0 | ||||||
| 2025-10-28 | 13F | Ritholtz Wealth Management | 0 | -100,00 | 0 | |||||
| 2026-02-09 | 13F | Geode Capital Management, Llc | 2.300.370 | -3,95 | 49.855 | 20,46 | ||||
| 2026-02-17 | 13F | Amundi | 4.290.442 | -12,24 | 70.749 | 5,48 | ||||
| 2026-02-10 | 13F | PCJ Investment Counsel Ltd. | 642.050 | -14,06 | 10.595 | 9,80 | ||||
| 2025-09-24 | NP | ISCF - iShares Edge MSCI Multifactor Intl Small-Cap ETF | 27.879 | 14,10 | 188 | 8,67 | ||||
| 2026-01-06 | 13F | Nelson, Van Denburg & Campbell Wealth Management Group, LLC | 29.000 | 0,00 | 478 | 27,81 | ||||
| 2026-02-10 | 13F | Goldman Sachs Group Inc | 951.940 | -51,88 | 15.697 | -38,63 | ||||
| 2026-02-17 | 13F | Tower Research Capital LLC (TRC) | 17.504 | 189,61 | 289 | 269,23 | ||||
| 2026-02-09 | 13F | Employees Retirement System of Texas | 6.172 | 0 | ||||||
| 2026-02-19 | 13F | Invesco Ltd. | 2.613.267 | -14,05 | 43.093 | 9,62 | ||||
| 2026-02-06 | 13F | EverSource Wealth Advisors, LLC | 1.562 | -5,68 | 26 | 19,05 | ||||
| 2026-01-20 | 13F | Thurston, Springer, Miller, Herd & Titak, Inc. | 3.453 | 57 | ||||||
| 2026-02-17 | 13F | Farringdon Capital, Ltd. | 0 | -100,00 | 0 | |||||
| 2025-09-25 | NP | DFA INVESTMENT DIMENSIONS GROUP INC - World ex U.S. Targeted Value Portfolio Institutional Class This fund is a listed as child fund of Dimensional Fund Advisors Lp and if that institution has disclosed ownership in this security, then these positions will not be double counted when calculating total shares and total value | 63.068 | 0,00 | 426 | -4,48 | ||||
| 2026-02-09 | 13F | Williamson Legacy Group, LLC | 94.233 | 1.554 | ||||||
| 2026-02-13 | 13F | OMERS ADMINISTRATION Corp | 0 | -100,00 | 0 | |||||
| 2025-09-29 | NP | AIM SECTOR FUNDS (INVESCO SECTOR FUNDS) - Invesco Oppenheimer Gold & Special Minerals Fund Class C | 2.744.322 | -67,98 | 18.552 | -69,43 | ||||
| 2026-01-28 | 13F | U S Global Investors Inc | 575.000 | 15,00 | 9.482 | 46,65 | ||||
| 2026-02-05 | 13F | Gabelli Funds Llc | 2.290.700 | 10,32 | 37.774 | 40,69 | ||||
| 2026-02-12 | 13F | Counterpoint Mutual Funds LLC | 0 | -100,00 | 0 | |||||
| 2026-02-17 | 13F | Woodline Partners LP | 2.597.330 | -54,56 | 42.830 | -42,05 | ||||
| 2026-02-11 | 13F | Group One Trading, L.p. | Put | 152.200 | 4,68 | 2.510 | 33,46 | |||
| 2026-02-11 | 13F | Group One Trading, L.p. | Call | 868.400 | 7,02 | 14.320 | 36,49 | |||
| 2025-11-12 | 13F | Headlands Technologies LLC | 0 | -100,00 | 0 | |||||
| 2026-01-30 | 13F | Wealth High Governance Capital Ltda | 244.105 | -59,32 | 4.025 | -48,12 | ||||
| 2026-02-17 | 13F | Raymond James Financial Inc | 50.052 | -72,88 | 825 | -65,42 | ||||
| 2026-02-11 | 13F | Havemeyer Place LP | 73.243 | 1.208 | ||||||
| 2026-02-09 | 13F | William Blair Investment Management, Llc | 1.221.611 | -9,16 | 20.144 | 15,85 | ||||
| 2026-02-17 | 13F | SummitTX Capital, L.P. | 11.842 | 195 | ||||||
| 2026-02-09 | 13F | Hantz Financial Services, Inc. | 140 | 0 | ||||||
| 2026-01-22 | 13F | Apollon Wealth Management, LLC | 35.189 | 0,00 | 580 | 27,75 | ||||
| 2026-02-11 | 13F | Donald Smith & Co., Inc. | 19.630.207 | -20,38 | 323.702 | 1,55 | ||||
| 2026-02-13 | 13F | Towarzystwo Funduszy Inwestycyjnych Pzu Sa | 0 | -100,00 | 0 | |||||
| 2026-02-13 | 13F | Cornerstone Financial Management LLC | 165 | 3 | ||||||
| 2026-02-17 | 13F | Optiver Holding B.V. | 0 | -100,00 | 0 | |||||
| 2026-02-06 | 13F | Larson Financial Group LLC | 26 | 0 | ||||||
| 2026-02-17 | 13F | Investment Management Corp of Ontario | 71.870 | 237,67 | 1.185 | 330,91 | ||||
| 2025-09-26 | NP | PMPIX - Precious Metals Ultrasector Profund Investor Class | 43.587 | -6,04 | 295 | -10,37 | ||||
| 2026-01-16 | 13F | Louisbourg Investments Inc. | 308.400 | 5.096 | ||||||
| 2026-02-10 | 13F | Bank of New York Mellon Corp | 167.557 | 9,11 | 2.763 | 39,19 | ||||
| 2026-02-13 | 13F | Entropy Technologies, LP | 259.453 | 37,60 | 4.278 | 75,54 | ||||
| 2026-02-12 | 13F | Commonwealth Equity Services, Llc | 25.389 | -35,16 | 419 | |||||
| 2026-02-13 | 13F | JustInvest LLC | 40.823 | 6,04 | 673 | 35,41 | ||||
| 2026-02-17 | 13F | Ninepoint Partners LP | 418.900 | 0,00 | 6.908 | 27,53 | ||||
| 2026-02-11 | 13F | LPL Financial LLC | 73.243 | 79,53 | 1.208 | 129,03 | ||||
| 2026-02-17 | 13F | Caption Management, LLC | Call | 1.175.500 | 35,90 | 19.384 | 73,31 | |||
| 2026-01-27 | 13F | Financial Management Professionals, Inc. | 0 | -100,00 | 0 | |||||
| 2026-02-13 | 13F | Manufacturers Life Insurance Company, The | 0 | -100,00 | 0 | |||||
| 2026-02-13 | 13F | Public Sector Pension Investment Board | 0 | -100,00 | 0 | |||||
| 2026-02-17 | 13F | Fmr Llc | 32.713.937 | 50,27 | 539.778 | 91,92 | ||||
| 2026-02-12 | 13F | Northwest & Ethical Investments L.P. | 343.605 | 0,42 | 5.716 | 30,03 | ||||
| 2026-02-17 | 13F | Wellington Management Group Llp | 0 | -100,00 | 0 | |||||
| 2026-02-11 | 13F | Picton Mahoney Asset Management | 5.028.974 | 29,17 | 83.106 | 166.112,00 | ||||
| 2026-02-17 | 13F | Cresset Asset Management, LLC | 14.578 | 3,19 | 240 | 31,87 | ||||
| 2025-11-04 | 13F | IMC-Chicago, LLC | 0 | -100,00 | 0 | -100,00 | ||||
| 2026-02-17 | 13F | Cetera Investment Advisers | 279.653 | -14,14 | 4.611 | 9,50 | ||||
| 2026-02-18 | 13F | VGI Partners Ltd | 0 | -100,00 | 0 | |||||
| 2025-09-29 | NP | PDN - Invesco FTSE RAFI Developed Markets ex-U.S. Small-Mid ETF This fund is a listed as child fund of Invesco Ltd. and if that institution has disclosed ownership in this security, then these positions will not be double counted when calculating total shares and total value | 99.226 | -22,63 | 672 | -26,02 | ||||
| 2026-02-06 | 13F | Prescott Group Capital Management, L.l.c. | 60.000 | 0,00 | 989 | 27,61 | ||||
| 2026-02-12 | 13F | Ci Investments Inc. | 7.362.433 | -1,60 | 121.407 | 126.364,58 | ||||
| 2026-02-17 | 13F | FIL Ltd | 36.367.149 | 124,04 | 600.135 | 186,17 | ||||
| 2026-02-17 | 13F | Capital Fund Management S.a. | Put | 74.400 | 15,71 | 1.227 | 47,53 | |||
| 2026-02-17 | 13F | Capital Fund Management S.a. | Call | 156.900 | 38,60 | 2.587 | 76,83 | |||
| 2026-02-02 | 13F | Intact Investment Management Inc. | 1.072.681 | -33,45 | 17.701 | -15,01 | ||||
| 2025-09-26 | NP | EPDPX - EuroPac International Dividend Income Fund Class A | 500.000 | 0,00 | 3.380 | -4,52 | ||||
| 2026-02-04 | 13F | Ameritas Advisory Services, LLC | 0 | -100,00 | 0 | |||||
| 2026-02-03 | 13F | We Are One Seven, LLC | 17.424 | -34,49 | 287 | -16,33 | ||||
| 2026-02-17 | 13F | Boothbay Fund Management, Llc | 33.705 | -51,42 | 556 | -38,06 | ||||
| 2025-09-25 | NP | DFA INVESTMENT DIMENSIONS GROUP INC - International Vector Equity Portfolio Shares | 233.600 | -50,41 | 1.579 | -52,70 | ||||
| 2025-11-14 | 13F | Brevan Howard Capital Management LP | 0 | -100,00 | 0 | -100,00 | ||||
| 2026-02-04 | 13F | Pensionmark Financial Group, Llc | 10.869 | 179 | ||||||
| 2026-01-27 | 13F | Zurcher Kantonalbank (Zurich Cantonalbank) | 169.329 | 8,76 | 2.798 | 39,09 | ||||
| 2026-02-17 | 13F | Jain Global LLC | 79.000 | 233,52 | 1.304 | 325,82 | ||||
| 2026-02-18 | 13F | Beacon Pointe Advisors, LLC | 10.033 | -11,47 | 165 | 13,01 | ||||
| 2026-02-12 | 13F | Hollencrest Capital Management | 60.298 | 0,00 | 994 | 27,60 | ||||
| 2026-01-23 | 13F | Assetmark, Inc | 85 | 21,43 | 1 | |||||
| 2026-02-10 | 13F | Hillsdale Investment Management Inc. | 1.068.910 | 23,98 | 17.671 | 58,69 | ||||
| 2026-02-11 | 13F | Allianz Asset Management GmbH | 37.492 | -89,45 | 620 | -86,51 | ||||
| 2025-09-25 | NP | VGTSX - Vanguard Total International Stock Index Fund Investor Shares | 407.645 | 0,00 | 2.756 | -4,54 | ||||
| 2026-02-11 | 13F | Simplex Trading, Llc | Put | 78.500 | -55,22 | 1.294 | 64.600,00 | |||
| 2025-09-25 | NP | DFIEX - International Core Equity Portfolio - Institutional Class This fund is a listed as child fund of Dimensional Fund Advisors Lp and if that institution has disclosed ownership in this security, then these positions will not be double counted when calculating total shares and total value | 15.714 | 0,00 | 106 | -4,50 | ||||
| 2026-02-13 | 13F | BRITISH COLUMBIA INVESTMENT MANAGEMENT Corp | 311.951 | -6,93 | 5.148 | 18,90 | ||||
| 2026-02-11 | 13F | Simplex Trading, Llc | Call | 508.700 | -4,15 | 8.388 | 139.700,00 | |||
| 2026-02-17 | 13F | Credit Agricole S A | 120.943 | -68,82 | 1.994 | -60,24 | ||||
| 2026-02-17 | 13F | Lighthouse Investment Partners, LLC | 0 | -100,00 | 0 | |||||
| 2026-01-15 | 13F | Allspring Global Investments Holdings, LLC | 3.917.300 | 11,65 | 64.645 | 42,65 | ||||
| 2026-02-13 | 13F | Squarepoint Ops LLC | Put | 12.700 | 0,00 | 209 | 27,44 | |||
| 2025-11-13 | 13F | Groupe la Francaise | 0 | -100,00 | 0 | |||||
| 2026-02-17 | 13F | Quadrature Capital Ltd | 331.778 | -87,58 | 5.482 | -84,13 | ||||
| 2025-11-12 | 13F | HAP Trading, LLC | Call | 19.000 | 70 | |||||
| 2026-02-11 | 13F | Tiaa Trust, National Association | 10.393 | 0,62 | 171 | 28,57 | ||||
| 2026-02-24 | 13F | DGS Capital Management, LLC | 27.094 | -0,84 | 447 | 26,35 | ||||
| 2026-02-13 | 13F | Sofos Investments, Inc. | 0 | -100,00 | 0 | |||||
| 2026-02-17 | 13F | Advisor Group Holdings, Inc. | 10.540 | -8,65 | 174 | 29,10 | ||||
| 2026-02-10 | 13F | Rothschild Investment Llc | 300 | 0,00 | 5 | 33,33 | ||||
| 2026-02-10 | 13F | Acadian Asset Management Llc | 65.800 | -36,18 | 1 | 0,00 | ||||
| 2026-02-12 | 13F | Renaissance Technologies Llc | 3.510.819 | -47,08 | 57.893 | -32,51 | ||||
| 2025-09-25 | NP | VASVX - Vanguard Selected Value Fund Investor Shares | 7.741.800 | 0,00 | 52.335 | -4,52 | ||||
| 2026-02-10 | 13F | Bnp Paribas Arbitrage, Sa | 9.953 | -89,12 | 164 | -86,13 | ||||
| 2026-02-13 | 13F | Verition Fund Management LLC | 575.273 | -75,16 | 9.486 | -68,32 | ||||
| 2026-02-11 | 13F | Parallel Advisors, LLC | 3.595 | 0,31 | 59 | 28,26 | ||||
| 2026-01-30 | 13F | Us Bancorp \de\ | 525 | 0,00 | 9 | 33,33 | ||||
| 2026-02-13 | 13F | Golden State Wealth Management, LLC | 100 | 0,00 | 2 | 0,00 | ||||
| 2025-11-25 | 13F | Briaud Financial Planning, Inc | 0 | -100,00 | 0 | |||||
| 2026-02-17 | 13F | Creative Planning | 15.674 | -1,96 | 258 | 25,24 | ||||
| 2026-02-18 | 13F | Mackenzie Financial Corp | 7.085.205 | -36,64 | 118.379 | -18,04 | ||||
| 2026-02-17 | 13F | Keebeck Alpha, LP | 11.881 | -60,92 | 196 | -50,38 | ||||
| 2026-01-29 | 13F | UBS Group AG | 538.012 | -43,81 | 8.872 | -28,34 | ||||
| 2026-02-23 | 13F | Virtu Financial LLC | 0 | -100,00 | 0 | |||||
| 2026-02-13 | 13F | Hudson Bay Capital Management LP | 0 | -100,00 | 0 | |||||
| 2026-01-16 | 13F | Ronald Blue Trust, Inc. | 2.012 | -27,34 | 33 | -5,71 | ||||
| 2026-02-09 | 13F | Catalyst Funds Management Pty Ltd | 12.300 | 203 | ||||||
| 2026-02-10 | 13F | BW Gestao de Investimentos Ltda. | 155.895 | -61,03 | 2.571 | -50,31 | ||||
| 2025-09-25 | NP | DFAX - Dimensional World ex U.S. Core Equity 2 ETF | 340.638 | 0,00 | 2.306 | -4,28 | ||||
| 2026-02-17 | 13F | Tudor Investment Corp Et Al | Put | 34.700 | 572 | |||||
| 2026-02-17 | 13F | Tudor Investment Corp Et Al | Call | 39.300 | 648 | |||||
| 2026-01-28 | 13F | HB Wealth Management, LLC | 109.000 | 0,00 | 1.797 | 27,54 | ||||
| 2026-01-28 | 13F | Arizona State Retirement System | 0 | -100,00 | 0 | |||||
| 2026-02-13 | 13F | Vontobel Holding Ltd. | 428.560 | -14,29 | 7.072 | 9,51 | ||||
| 2026-02-12 | 13F | Insigneo Advisory Services, Llc | 15.535 | 256 | ||||||
| 2026-02-12 | 13F | Scotia Capital Inc. | 45.768 | 41,31 | 752 | 80,77 | ||||
| 2026-02-06 | 13F | Associated Banc-corp | 18.251 | 0,00 | 301 | 27,66 | ||||
| 2026-02-06 | 13F | Vestmark Advisory Solutions, Inc. | 33.757 | 557 | ||||||
| 2026-02-17 | 13F | Point72 Asset Management, L.P. | Put | 158.400 | 2.612 | |||||
| 2025-09-25 | NP | DXIV - Dimensional International Vector Equity ETF | 11.800 | 66,20 | 80 | 58,00 | ||||
| 2026-02-17 | 13F | Point72 Asset Management, L.P. | Call | 571.300 | 9.421 | |||||
| 2026-02-17 | 13F | Point72 Asset Management, L.P. | 1.527.199 | -9,36 | 25.187 | 15,62 | ||||
| 2025-11-13 | 13F | Dynamic Technology Lab Private Ltd | 0 | -100,00 | 0 | |||||
| 2026-02-10 | 13F | Envestnet Asset Management Inc | 23.405 | -11,97 | 386 | 12,24 | ||||
| 2026-02-12 | 13F | Alps Advisors Inc | 356.027 | 0,52 | 5.871 | 28,19 | ||||
| 2026-02-09 | 13F | Themes Management Co LLC | 101.831 | 1.680 | ||||||
| 2026-01-26 | 13F | La Banque Postale Asset Management SA | 58.049 | 152,50 | 957 | 222,22 | ||||
| 2026-02-18 | 13F | Vident Advisory, LLC | 99.567 | -54,67 | 1.642 | -42,20 | ||||
| 2026-02-04 | 13F | Tsfg, Llc | 0 | -100,00 | 0 | |||||
| 2026-02-05 | 13F | Cambridge Investment Research Advisors, Inc. | 25.649 | 73,66 | 0 | |||||
| 2026-02-10 | 13F | Continuum Advisory, LLC | 14.547 | -36,63 | 240 | -19,26 | ||||
| 2026-02-12 | 13F | BlackRock, Inc. | 19.301.077 | -23,50 | 318.275 | -2,44 | ||||
| 2025-11-12 | 13F | Northwest & Ethical Investments L.P. | Call | 0 | -100,00 | 0 | -100,00 | |||
| 2026-02-13 | 13F | Schroder Investment Management Group | 4.080.553 | 10,05 | 68.349 | 43,67 | ||||
| 2026-02-10 | 13F | Savant Capital, LLC | 20.497 | 14,51 | 338 | 45,89 | ||||
| 2026-02-06 | 13F | IFP Advisors, Inc | 317 | 0,00 | 5 | 25,00 | ||||
| 2026-02-13 | 13F | FORA Capital, LLC | 0 | -100,00 | 0 | |||||
| 2026-02-17 | 13F | Aqr Capital Management Llc | 92.514 | 1.527 | ||||||
| 2025-09-26 | NP | EPIVX - EuroPac International Value Fund Class A | 600.000 | 0,00 | 4.056 | -4,52 | ||||
| 2026-02-17 | 13F | T. Rowe Price Investment Management, Inc. | 1.258.593 | -64,90 | 21 | -56,52 | ||||
| 2026-02-17 | 13F | Two Sigma Investments, Lp | 560.193 | -40,80 | 9.238 | -24,50 | ||||
| 2026-01-29 | 13F | Golden State Equity Partners | 30.000 | -57,14 | 495 | -45,41 | ||||
| 2026-02-02 | 13F | Oppenheimer & Co Inc | 28.710 | 137,57 | 473 | 203,21 | ||||
| 2026-02-11 | 13F | Tradition Wealth Management, LLC | 0 | -100,00 | 0 | |||||
| 2025-09-25 | NP | DFA INVESTMENT TRUST CO - The Canadian Small Company Series This fund is a listed as child fund of Dimensional Fund Advisors Lp and if that institution has disclosed ownership in this security, then these positions will not be double counted when calculating total shares and total value | 1.146.593 | 0,00 | 7.751 | -4,52 | ||||
| 2026-02-17 | 13F | Jones Financial Companies Lllp | 142 | -95,08 | 2 | -94,29 | ||||
| 2025-09-29 | NP | CRNSX - CATHOLIC RESPONSIBLE INVESTMENTS INTERNATIONAL SMALL-CAP FUND Institutional Shares | 15.389 | -4,83 | 104 | -8,77 | ||||
| 2026-02-05 | 13F | Leuthold Group, Llc | 613.738 | -25,39 | 10.121 | -4,85 | ||||
| 2026-02-13 | 13F | Citigroup Inc | 77.141 | 231,60 | 1.275 | 324,67 | ||||
| 2025-09-25 | NP | DFAI - Dimensional International Core Equity Market ETF | 113.802 | 50,33 | 770 | 43,93 | ||||
| 2026-01-20 | 13F | Signaturefd, Llc | 6.383 | 4,95 | 105 | 34,62 | ||||
| 2025-09-25 | NP | DADIX - Dimensional World ex U.S. Sustainability Targeted Value Portfolio Institutional Class | 17.700 | 120 | ||||||
| 2026-02-13 | 13F | Arrowstreet Capital, Limited Partnership | 6.023.434 | -46,08 | 99.377 | -31,15 | ||||
| 2026-02-10 | 13F | Td Asset Management Inc | 3.431.834 | 38,97 | 56.707 | 77,69 | ||||
| 2026-02-17 | 13F | Anson Funds Management LP | Call | 0 | -100,00 | 0 | ||||
| 2026-02-17 | 13F | Polar Asset Management Partners Inc. | 180.000 | -21,74 | 2.971 | 0,00 | ||||
| 2026-02-17 | 13F | XTX Topco Ltd | 21.483 | -85,38 | 354 | -81,36 | ||||
| 2026-02-10 | 13F/A | Northwestern Mutual Wealth Management Co | 10.763 | 1,54 | 177 | 29,20 | ||||
| 2026-02-13 | 13F | Winmill & Co. Inc | 1.190.000 | -4,49 | 19.623 | 21,81 | ||||
| 2025-11-14 | 13F | Paulson & Co. Inc. | 0 | -100,00 | 0 | |||||
| 2026-02-09 | 13F | Legal & General Group Plc | 1.922.766 | -12,66 | 31.771 | 11,68 | ||||
| 2026-02-10 | 13F | Measured Wealth Private Client Group, LLC | 65.613 | -13,54 | 1.082 | 10,19 | ||||
| 2025-09-26 | NP | FTIHX - Fidelity Total International Index Fund This fund is a listed as child fund of Fmr Llc and if that institution has disclosed ownership in this security, then these positions will not be double counted when calculating total shares and total value | 265.256 | 4,44 | 1.792 | -0,44 | ||||
| 2026-02-17 | 13F | Nomura Holdings Inc | 1.288.777 | -11,04 | 21.252 | 13,45 | ||||
| 2025-11-14 | 13F | EAM Global Investors LLC | 0 | -100,00 | 0 | |||||
| 2026-02-17 | 13F | Covalis Capital Llp | 0 | -100,00 | 0 | |||||
| 2025-11-12 | 13F | Stifel Financial Corp | 0 | -100,00 | 0 | |||||
| 2026-02-17 | 13F | Susquehanna Advisors Group, Inc. | 339.200 | 5.593 | ||||||
| 2026-01-30 | 13F | Precision Wealth Strategies, LLC | 12.232 | 202 | ||||||
| 2026-01-22 | 13F | Alpha Omega Wealth Management LLC | 12.000 | 0,00 | 198 | 27,10 | ||||
| 2026-02-10 | 13F | Natixis Advisors, L.p. | 24.286 | 0,00 | 0 | |||||
| 2026-02-13 | 13F | Pale Fire Capital SE | 0 | -100,00 | 0 | |||||
| 2025-11-07 | 13F | HighTower Advisors, LLC | 0 | -100,00 | 0 | |||||
| 2025-11-14 | 13F | Capula Management Ltd | 0 | -100,00 | 0 | |||||
| 2025-09-24 | NP | IXUS - iShares Core MSCI Total International Stock ETF | 726.550 | 4,72 | 4.908 | -0,18 | ||||
| 2026-02-17 | 13F | Balyasny Asset Management Llc | 35.723 | -82,21 | 589 | -77,31 | ||||
| 2026-02-12 | 13F | Jane Street Group, Llc | 2.075.522 | 510,64 | 34.225 | 678,90 | ||||
| 2026-02-12 | 13F | Jane Street Group, Llc | Put | 20.800 | 3,48 | 343 | 32,05 | |||
| 2026-02-12 | 13F | Jane Street Group, Llc | Call | 185.900 | 36,99 | 3.065 | 74,74 | |||
| 2026-02-17 | 13F | Sciencast Management LP | 26.399 | 435 | ||||||
| 2025-11-14 | 13F | Skopos Labs, Inc. | 0 | -100,00 | 0 | |||||
| 2026-02-05 | 13F | Gamco Investors, Inc. Et Al | 378.025 | -3,88 | 6.242 | 22,78 | ||||
| 2026-02-05 | 13F | E Fund Management (Hong Kong) Co., Ltd. | 34.211 | 850 | ||||||
| 2026-02-17 | 13F | Orion Resource Partners LP | 124.438 | 5,40 | 2.054 | 34,62 | ||||
| 2026-01-29 | 13F | Teachers Retirement System Of The State Of Kentucky | 0 | -100,00 | 0 | |||||
| 2026-02-06 | 13F | Cumberland Partners Ltd | 27.400 | 453 | ||||||
| 2026-02-13 | 13F | Y-Intercept (Hong Kong) Ltd | 0 | -100,00 | 0 | |||||
| 2026-02-09 | 13F | Harbour Investments, Inc. | 97 | 438,89 | 2 | |||||
| 2026-02-06 | 13F | GPS Wealth Strategies Group, LLC | 0 | -100,00 | 0 | |||||
| 2026-02-06 | 13F | Banque Cantonale Vaudoise | 2.986 | 617,79 | 49 | |||||
| 2026-02-11 | 13F | Erste Asset Management GmbH | 79.500 | 1.310 | ||||||
| 2026-02-17 | 13F | Weiss Asset Management LP | 103.560 | 1.708 | ||||||
| 2025-09-24 | NP | IDEV - iShares Core MSCI International Developed Markets ETF | 468.131 | 0,00 | 3.162 | -4,67 | ||||
| 2026-02-11 | 13F | Jpmorgan Chase & Co | Call | 0 | -100,00 | 0 | -100,00 | |||
| 2026-02-17 | 13F | Voloridge Investment Management, Llc | 3.502.469 | 261,80 | 57.756 | 361,41 | ||||
| 2026-02-13 | 13F | Pin Oak Investment Advisors Inc | 1.798 | 0 | ||||||
| 2025-12-09 | 13F/A | Tudor Investment Corp Et Al | 0 | -100,00 | 0 | |||||
| 2026-02-17 | 13F | Schonfeld Strategic Advisors LLC | 307.771 | -37,35 | 5.075 | -20,09 | ||||
| 2026-02-17 | 13F | DZ BANK AG Deutsche Zentral Genossenschafts Bank, Frankfurt am Main | 0 | -100,00 | 0 | |||||
| 2026-02-13 | 13F | Eschler Asset Management LLP | 84.717 | 1.397 | ||||||
| 2025-11-14 | 13F | Cubist Systematic Strategies, LLC | Call | 112.300 | 1.452 | |||||
| 2025-11-14 | 13F | Cubist Systematic Strategies, LLC | 243.339 | 3.146 | ||||||
| 2025-09-25 | NP | DFA INVESTMENT DIMENSIONS GROUP INC - International Sustainability Core 1 Portfolio Shares | 33.494 | 0,00 | 226 | -4,64 | ||||
| 2026-02-06 | 13F/A | Rathbone Brothers plc | 41.890 | 3,71 | 691 | 32,18 | ||||
| 2026-02-02 | 13F | Danske Bank A/s | 0 | -100,00 | 0 | |||||
| 2025-11-14 | 13F | EAM Investors, LLC | 0 | -100,00 | 0 | |||||
| 2026-02-17 | 13F | Bank Of America Corp /de/ | 9.155.154 | -18,22 | 150.968 | 4,30 | ||||
| 2026-02-12 | 13F | Swiss National Bank | 1.139.000 | 1,29 | 18.834 | 29,59 | ||||
| 2026-02-13 | 13F | Charles Schwab Investment Management Inc | 1.492.579 | 0,31 | 24.663 | 28,27 | ||||
| 2025-11-13 | 13F | Macquarie Group Ltd | 0 | -100,00 | 0 | -100,00 | ||||
| 2026-02-17 | 13F | Russell Investments Group, Ltd. | 188.494 | -48,97 | 3.115 | -34,76 | ||||
| 2026-02-17 | 13F | Quantitative Investment Management, LLC | 0 | -100,00 | 0 | |||||
| 2026-02-09 | 13F | Royce & Associates Lp | 500.000 | 0,00 | 8.245 | 27,53 | ||||
| 2026-02-17 | 13F | Public Employees Retirement System Of Ohio | 196.534 | -10,85 | 3.247 | 13,97 | ||||
| 2026-02-17 | 13F | New Vernon Capital Holdings II LLC | 6.813 | 0,00 | 154 | 75,00 | ||||
| 2025-11-12 | 13F | 111 Capital | 0 | -100,00 | 0 | |||||
| 2026-02-06 | 13F | Profund Advisors Llc | 60.253 | -15,08 | 994 | 8,29 | ||||
| 2026-02-10 | 13F | Linscomb & Williams, Inc. | 20.000 | 0,00 | 330 | 27,52 | ||||
| 2025-11-21 | 13F/A | CIBC Bancorp USA Inc. | Call | 226.000 | 2.922 | |||||
| 2026-02-13 | 13F | Victory Capital Management Inc | 2.130.244 | 0,00 | 35.128 | 27,53 | ||||
| 2026-02-05 | 13F | Baader Bank INC | 0 | -100,00 | 0 | |||||
| 2026-02-13 | 13F | Bornite Capital Management LP | 0 | -100,00 | 0 | |||||
| 2025-11-14 | 13F | Eqis Capital Management, Inc. | 0 | -100,00 | 0 | |||||
| 2026-02-12 | 13F | Federation des caisses Desjardins du Quebec | 1.450.075 | 26,31 | 23.877 | 61,20 | ||||
| 2026-02-09 | 13F | Waratah Capital Advisors Ltd. | 2.603.269 | 23,17 | 42.928 | 57,08 | ||||
| 2026-02-13 | 13F | Caitong International Asset Management Co., Ltd | 0 | -100,00 | 0 | |||||
| 2026-02-03 | 13F | SBI Securities Co., Ltd. | 3.476 | 366,58 | 57 | 533,33 | ||||
| 2026-01-29 | 13F | Vanguard Group Inc | 23.836.156 | 4,69 | 393.328 | 33,72 | ||||
| 2026-02-12 | 13F | Bank Of Montreal /can/ | Call | 100.000 | 0,00 | 1.650 | 27,81 | |||
| 2026-02-12 | 13F | Bank Of Montreal /can/ | 3.329.868 | 0,07 | 54.951 | 27,85 | ||||
| 2025-11-14 | 13F | Point72 Asia (Singapore) Pte. Ltd. | 0 | -100,00 | 0 | |||||
| 2025-09-25 | NP | DISVX - Dfa International Small Cap Value Portfolio - Institutional Class This fund is a listed as child fund of Dimensional Fund Advisors Lp and if that institution has disclosed ownership in this security, then these positions will not be double counted when calculating total shares and total value | 2.819.348 | -44,94 | 19.059 | -44,90 | ||||
| 2025-09-25 | NP | Dfa Investment Dimensions Group Inc - Va International Small Portfolio This fund is a listed as child fund of Dimensional Fund Advisors Lp and if that institution has disclosed ownership in this security, then these positions will not be double counted when calculating total shares and total value | 48.212 | 0,00 | 326 | -4,69 | ||||
| 2025-09-24 | NP | SFILX - Schwab Fundamental International Small Company Index Fund Institutional Shares | 56.309 | -5,62 | 380 | -9,95 | ||||
| 2026-02-04 | 13F | BCJ Capital Management, LLC | 0 | -100,00 | 0 | -100,00 | ||||
| 2026-02-17 | 13F | 683 Capital Management, LLC | 900.000 | 0,00 | 14.841 | 27,53 | ||||
| 2026-02-12 | 13F | Wealthspire Advisors, LLC | 0 | -100,00 | 0 | |||||
| 2026-02-11 | 13F | Jpmorgan Chase & Co | 543.297 | -54,11 | 8.959 | -41,49 | ||||
| 2026-02-13 | 13F | Extract Advisors LLC | 1.232.612 | 20.326 | ||||||
| 2026-02-13 | 13F | Ubs Asset Management Americas Inc | 0 | -100,00 | 0 | |||||
| 2026-01-21 | 13F/A | Euro Pacific Asset Management, LLC | 1.343.139 | -8,85 | 22 | 15,79 | ||||
| 2026-02-13 | 13F | Van Eck Associates Corp | 45.453.726 | -12,58 | 750 | 11,46 | ||||
| 2025-11-14 | 13F | Two Sigma Advisers, Lp | 0 | -100,00 | 0 | |||||
| 2025-11-14 | 13F | Capstone Investment Advisors, Llc | 20.839 | -46,66 | 269 | -6,27 | ||||
| 2026-02-17 | 13F | Driehaus Capital Management Llc | 3.274.437 | 13,37 | 53.995 | 44,59 | ||||
| 2026-02-13 | 13F | Wells Fargo & Company/mn | 46.579 | 125,35 | 768 | 187,64 | ||||
| 2026-02-17 | 13F | Captrust Financial Advisors | 12.995 | 214 | ||||||
| 2026-02-13 | 13F | Gallo Partners, LP | 59.572 | -82,29 | 982 | -77,41 | ||||
| 2026-01-14 | 13F | ORG Partners LLC | 670 | 0,00 | 11 | 37,50 | ||||
| 2025-10-22 | 13F | Byrne Asset Management LLC | 0 | -100,00 | 0 | |||||
| 2025-09-25 | NP | VFSNX - Vanguard FTSE All-World ex-US Small-Cap Index Fund Institutional Shares | 87.004 | 39,21 | 588 | 33,03 | ||||
| 2026-02-11 | 13F | Franklin Resources Inc | 32.011 | 4,83 | 528 | 34,01 | ||||
| 2026-02-10 | 13F | Godfrey Financial Associates, Inc. | 51 | 1 | ||||||
| 2026-02-17 | 13F | Cantor Fitzgerald, L. P. | 0 | -100,00 | 0 | |||||
| 2026-01-13 | 13F | CoreCap Advisors, LLC | 100 | 2 | ||||||
| 2026-02-13 | 13F | Centiva Capital, LP | 0 | -100,00 | 0 | |||||
| 2025-11-14 | 13F | Wolverine Trading, Llc | 39.206 | 503 | ||||||
| 2025-11-14 | 13F | Wolverine Trading, Llc | Call | 148.400 | 1.904 | |||||
| 2026-02-13 | 13F | Flow Traders U.s. Llc | 0 | -100,00 | 0 | |||||
| 2025-11-14 | 13F | Wolverine Trading, Llc | Put | 34.900 | 448 | |||||
| 2026-02-12 | 13F | Chilton Capital Management Llc | 2.300 | 0,00 | 38 | 27,59 |