Grundlæggende statistik
| Institutionelle ejere | 270 total, 264 long only, 3 short only, 3 long/short - change of 3,04% MRQ |
| Gennemsnitlig porteføljeallokering | 0.1371 % - change of -38,55% MRQ |
| Institutionelle aktier (lange) | 39.570.798 (ex 13D/G) - change of -4,30MM shares -9,80% MRQ |
| Institutionel værdi (lang) | $ 1.722.955 USD ($1000) |
Institutionelt ejerskab og aktionærer
iShares Trust - iShares MSCI United Kingdom ETF (US:EWU) har 270 institutionelle ejere og aktionærer, der har indsendt 13D/G- eller 13F-formularer til Securities Exchange Commission (SEC). Disse institutioner har i alt 39,570,798 aktier. Største aktionærer omfatter BlackRock, Inc., Goldman Sachs Group Inc, Bank Of America Corp /de/, Wells Fargo & Company/mn, Morgan Stanley, Royal Bank Of Canada, Td Asset Management Inc, Catalyst Capital Advisors LLC, Millburn Ridgefield Corp, and Jpmorgan Chase & Co .
iShares Trust - iShares MSCI United Kingdom ETF (ARCA:EWU) institutionel ejerskabsstruktur viser aktuelle positioner i virksomheden efter institutioner og fonde, samt seneste ændringer i positionsstørrelse. Større aktionærer kan omfatte individuelle investorer, investeringsforeninger, hedgefonde eller institutioner. Skema 13D angiver, at investoren besidder (eller besidder) mere end 5 % af virksomheden og har til hensigt (eller har til hensigt at) aktivt at forfølge en ændring i forretningsstrategi. Skema 13G indikerer en passiv investering på over 5%.
The share price as of April 20, 2026 is 48,01 / share. Previously, on April 21, 2025, the share price was 36,82 / share. This represents an increase of 30,39% over that period.

Fondens stemningsscore
Fund Sentiment Score (fka Ownership Accumulation Score) finder de aktier, der bliver mest købt af fonde. Det er resultatet af en sofistikeret, multi-faktor kvantitativ model, der identificerer virksomheder med de højeste niveauer af institutionel akkumulering. Scoringsmodellen bruger en kombination af den samlede stigning i oplyste ejere, ændringerne i porteføljeallokeringer i disse ejere og andre målinger. Tallet går fra 0 til 100, hvor højere tal indikerer et højere niveau af akkumulering for sine jævnaldrende, og 50 er gennemsnittet.
Opdateringsfrekvens: Dagligt
Se Ownership Explorer, som giver en liste over højest rangerende virksomheder.
AI+ Ask Fintel’s AI assistant about iShares Trust - iShares MSCI United Kingdom ETF.
Select a question to share a public post with an AI-crafted answer.
Thinking of good questions…
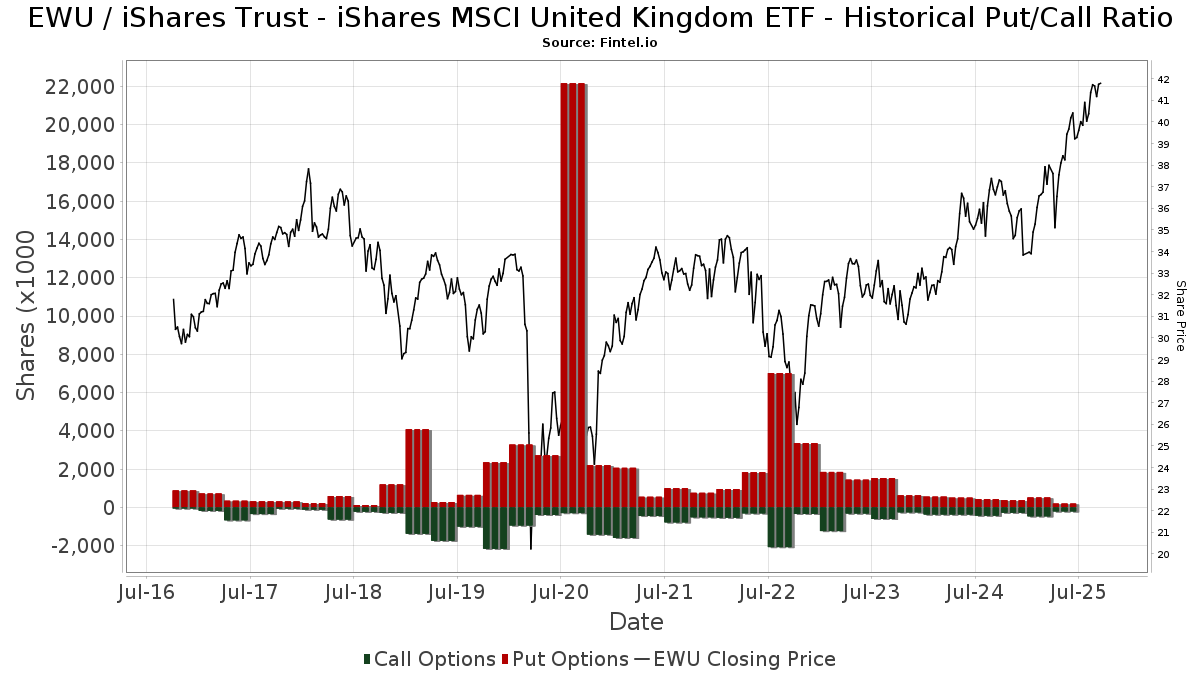
Institutionel Put/Call-forhold
Ud over at indberette standardaktie- og gældsudstedelser skal institutter med mere end 100 mill. aktiver under forvaltning også oplyse deres put- og call-optionsbeholdninger. Da salgsoptioner generelt indikerer negativ stemning, og købsoptioner indikerer positiv stemning, kan vi få en fornemmelse af den overordnede institutionelle stemning ved at plotte forholdet mellem put og kald. Diagrammet til højre viser det historiske put/call-forhold for dette instrument.
Brug af Put/Call Ratio som en indikator for investorernes stemning overvinder en af de vigtigste mangler ved at bruge totalt institutionelt ejerskab, som er, at en betydelig mængde af aktiver under forvaltning investeres passivt for at spore indekser. Passivt forvaltede fonde køber typisk ikke optioner, så indikatoren for put/call-forholdet følger mere nøje følelsen af aktivt forvaltede fonde.
13D/G-arkivering
Vi præsenterer 13D/G ansøgninger separat fra 13F ansøgninger på grund af den forskellige behandling af SEC. 13D/G-ansøgninger kan indgives af grupper af investorer (med én ledende), hvorimod 13F-ansøgninger ikke kan. Dette resulterer i situationer, hvor en investor kan indsende en 13D/G, der rapporterer én værdi for de samlede aktier (der repræsenterer alle de aktier, der ejes af investorgruppen), men derefter indsender en 13F, der rapporterer en anden værdi for de samlede aktier (der udelukkende repræsenterer deres egne) ejendomsret). Det betyder, at aktieejerskab af 13D/G-arkiver og 13F-arkiveringer ofte ikke er direkte sammenlignelige, så vi præsenterer dem separat.
Bemærk: Fra den 16. maj 2021 viser vi ikke længere ejere, der ikke har indsendt en 13D/G inden for det seneste år. Tidligere viste vi den fulde historie af 13D/G-arkiver. Generelt skal enheder, der er forpligtet til at indgive 13D/G-ansøgninger, indgive mindst årligt, før de indsender en afsluttende ansøgning. Dog forlader fonde nogle gange positioner uden at indsende en afsluttende ansøgning (dvs. de afvikler), så visning af den fulde historie resulterede nogle gange i forvirring om det nuværende ejerskab. For at undgå forvirring viser vi nu kun 'aktuelle' ejere - det vil sige - ejere, der har anmeldt inden for det seneste år.
Upgrade to unlock premium data.
| Fil dato | Form | Investor | Forrige Aktier |
Seneste Aktier |
Δ Aktier (Procent) |
Ejendomsret (Procent) |
Δ Ejerskab (Procent) |
|
|---|---|---|---|---|---|---|---|---|
| 2026-01-21 | BlackRock Portfolio Management LLC | 5,404,683 | 5,953,982 | 10.16 | 9.20 | 13.58 |
13F og NPORT arkivering
Detaljer om 13F-arkivering er gratis. Detaljer om NP-ansøgninger kræver et premium-medlemskab. Grønne rækker angiver nye positioner. Røde rækker angiver lukkede positioner. Klik på linket ikon for at se den fulde transaktionshistorik.
Opgrader
for at låse premium-data op og eksportere til Excel ![]() .
.
| Fil dato | Kilde | Investor | Type | Gennemsnitlig pris (Øst) |
Aktier | Δ Aktier (%) |
Rapporteret Værdi ($1000) |
Δ Værdi (%) |
Port Alloc (%) |
|
|---|---|---|---|---|---|---|---|---|---|---|
| 2026-02-06 | 13F | Pnc Financial Services Group, Inc. | 1.206 | 201,50 | 53 | 231,25 | ||||
| 2026-02-17 | 13F | Black Maple Capital Management LP | 67.610 | 32,02 | 2.973 | 38,34 | ||||
| 2026-02-17 | 13F | Advisor Group Holdings, Inc. | 140.467 | -23,94 | 6.178 | -19,50 | ||||
| 2026-02-17 | 13F | Fmr Llc | 8.491 | 4,76 | 373 | 9,71 | ||||
| 2026-01-26 | 13F | Mirae Asset Global Investments Co., Ltd. | 29.116 | 142,23 | 1.281 | 153,97 | ||||
| 2026-02-03 | 13F | Climber Capital SA | 6.750 | -63,38 | 296 | -59,48 | ||||
| 2026-01-28 | 13F | HB Wealth Management, LLC | 30.000 | 0,00 | 1.319 | 4,77 | ||||
| 2026-02-12 | 13F | Wealthspire Advisors, LLC | 5.387 | 1,16 | 237 | 5,83 | ||||
| 2026-02-12 | 13F | Laffer Investments | 11.600 | 0,00 | 510 | 4,94 | ||||
| 2026-02-17 | 13F | Css Llc/il | Call | 0 | -100,00 | 0 | ||||
| 2026-02-20 | 13F | Kovitz Investment Group Partners, LLC | 228.553 | -1,86 | 10.052 | 2,84 | ||||
| 2026-02-02 | 13F | Robertson Stephens Wealth Management, LLC | 45.219 | 42,67 | 1.989 | 49,47 | ||||
| 2026-02-13 | 13F | Vontobel Holding Ltd. | 291.989 | 4,43 | 12.842 | 9,43 | ||||
| 2026-04-06 | 13F | Acima Private Wealth, Llc | 19.206 | 0,11 | 875 | 3,80 | ||||
| 2026-02-04 | 13F | BCJ Capital Management, LLC | 38.439 | 2,42 | 1.691 | 7,30 | ||||
| 2026-04-20 | 13F | Contravisory Investment Management, Inc. | 26.104 | -4,98 | 1.189 | -1,57 | ||||
| 2026-02-13 | 13F | Transamerica Financial Advisors, Inc. | 1 | 0 | ||||||
| 2026-04-08 | 13F | Sharper & Granite LLC | 150.612 | 13,31 | 6.862 | 17,36 | ||||
| 2026-04-13 | 13F | Sarasin & Partners LLP | 91.732 | 4.179 | ||||||
| 2026-02-06 | 13F | BlueStem Wealth Partners, LLC | 81.130 | 3.568 | ||||||
| 2026-01-29 | 13F | Sanctuary Advisors, LLC | 53.560 | 5,18 | 2.356 | 10,20 | ||||
| 2026-02-17 | 13F | D. E. Shaw & Co., Inc. | 0 | -100,00 | 0 | |||||
| 2026-02-10 | 13F | Root Financial Partners, LLC | 163 | -6,32 | 7 | 0,00 | ||||
| 2025-11-12 | 13F | Ameriflex Group, Inc. | 0 | -100,00 | 0 | -100,00 | ||||
| 2026-01-27 | 13F | Evergreen Capital Management Llc | 45.393 | 5,47 | 1.996 | 10,52 | ||||
| 2026-02-12 | 13F | Scotia Capital Inc. | 44.455 | 1,85 | 1.955 | 6,77 | ||||
| 2026-02-13 | 13F | Evelyn Partners Asset Management Ltd | 4.767 | 0,00 | 210 | 4,50 | ||||
| 2025-11-14 | 13F | Mount Yale Investment Advisors, LLC | 0 | -100,00 | 0 | |||||
| 2026-04-07 | 13F | Park Avenue Securities Llc | 36.180 | 172,11 | 2 | |||||
| 2026-01-21 | 13F | Walkner Condon Financial Advisors LLC | 8.874 | 0,00 | 390 | 4,84 | ||||
| 2026-02-12 | 13F | Bank Of Montreal /can/ | 3.600 | 0,00 | 158 | 4,64 | ||||
| 2025-11-12 | 13F | Creekmur Asset Management LLC | 2 | 0,00 | 0 | |||||
| 2026-02-13 | 13F | Focused Alpha, Llc | 4.894 | 215 | ||||||
| 2026-02-26 | 13F | Ssa Swiss Advisors Ag | 1.869 | -84,60 | 82 | -83,89 | ||||
| 2026-01-21 | 13F | Finley Financial, LLC | 5.040 | 0,00 | 222 | 4,74 | ||||
| 2026-02-12 | 13F | DRW Securities, LLC | 8.485 | -90,65 | 373 | -90,23 | ||||
| 2026-01-15 | 13F | Nisa Investment Advisors, Llc | 18.200 | 0,00 | 800 | 4,85 | ||||
| 2026-02-12 | 13F | Skopos Labs, Inc. | 9.182 | 9,71 | 404 | 54,79 | ||||
| 2026-02-13 | 13F | Squarepoint Ops LLC | 0 | -100,00 | 0 | |||||
| 2026-02-13 | 13F | Brown Advisory Inc | 84.581 | -1,37 | 3.720 | 3,33 | ||||
| 2026-02-13 | 13F | Squarepoint Ops LLC | Call | 0 | -100,00 | 0 | ||||
| 2025-11-13 | 13F | GeoWealth Management, LLC | 0 | -100,00 | 0 | -100,00 | ||||
| 2026-01-22 | 13F | Financial Consulate, Inc | 162 | 0,00 | 7 | 16,67 | ||||
| 2026-02-11 | 13F | Syon Capital Llc | 170.998 | 7.521 | ||||||
| 2026-02-13 | 13F | Marshall Wace, Llp | 0 | -100,00 | 0 | |||||
| 2026-02-13 | 13F | Stifel Financial Corp | 22.070 | -1,52 | 971 | 3,19 | ||||
| 2026-02-13 | 13F | Ausdal Financial Partners, Inc. | 6.716 | 295 | ||||||
| 2026-02-13 | 13F | Flow Traders U.s. Llc | 0 | -100,00 | 0 | |||||
| 2026-04-17 | 13F | Visionary Horizons, LLC | 11.065 | -12,11 | 504 | -8,86 | ||||
| 2026-01-29 | 13F | UMA Financial Services, Inc. | 100 | 0,00 | 4 | 0,00 | ||||
| 2026-02-13 | 13F | DeepCurrents Investment Group LLC | Put | 1.000 | 0,00 | 4.398 | 4,79 | |||
| 2026-01-28 | 13F | CAPROCK Group, Inc. | 16.609 | 11,80 | 730 | 18,70 | ||||
| 2026-02-13 | 13F | Ubs Asset Management Americas Inc | 41.692 | 1.834 | ||||||
| 2026-04-20 | 13F | Tower View Investment Management & Research LLC | 346 | 0,00 | 16 | 0,00 | ||||
| 2026-02-02 | 13F | Truist Financial Corp | 7.590 | 2,40 | 334 | 7,07 | ||||
| 2026-02-17 | 13F | Mittelman Wealth Management | 43.965 | 17,00 | 1.934 | 22,57 | ||||
| 2026-04-14 | 13F | Pictet North America Advisors SA | 137.860 | 15,15 | 6.281 | 19,28 | ||||
| 2025-11-14 | 13F | Dai-ichi Life Holdings, Inc. | 0 | -100,00 | 0 | |||||
| 2026-02-17 | 13F | Miller Capital Partners, Inc. | 230 | 10 | ||||||
| 2026-01-28 | 13F | Legacy Capital Group California, Inc. | 27.240 | 0,04 | 1.198 | 4,90 | ||||
| 2026-02-11 | 13F | Ameraudi Asset Management, Inc. | 8.091 | 0,00 | 356 | 4,72 | ||||
| 2026-02-10 | 13F | Goldman Sachs Group Inc | 3.773.886 | -16,05 | 165.976 | -12,03 | ||||
| 2026-02-17 | 13F | Warren Averett Asset Management, LLC | 79.591 | 3.500 | ||||||
| 2026-02-10 | 13F | Bbr Partners, Llc | 5.723 | 0,00 | 252 | 4,58 | ||||
| 2026-02-17 | 13F | Green Harvest Asset Management LLC | 259.787 | 13,75 | 11.425 | 19,20 | ||||
| 2025-11-12 | 13F | Creative Financial Designs Inc /adv | 0 | -100,00 | 0 | -100,00 | ||||
| 2026-02-11 | 13F | Simplex Trading, Llc | 14.267 | -56,31 | 627 | 62.600,00 | ||||
| 2026-04-16 | 13F | Everstar Asset Management, LLC | 14.353 | -50,50 | 654 | -38,57 | ||||
| 2026-02-13 | 13F | Mml Investors Services, Llc | 96.950 | 58,38 | 4.264 | 65,94 | ||||
| 2026-01-21 | 13F | Flagship Harbor Advisors, Llc | 87 | 4 | ||||||
| 2026-02-17 | 13F | XTX Topco Ltd | 8.704 | 383 | ||||||
| 2026-02-13 | 13F | National Bank Of Canada /fi/ | 898 | 167,26 | 39 | 178,57 | ||||
| 2026-02-13 | 13F | Change Path, LLC | 8.470 | 0,12 | 373 | 4,79 | ||||
| 2026-01-29 | 13F | LFA - Lugano Financial Advisors SA | 15.869 | 0,00 | 698 | 4,65 | ||||
| 2026-04-15 | 13F | Compagnie Lombard Odier SCmA | 10.319 | -78,86 | 470 | -78,10 | ||||
| 2026-02-12 | 13F | Insigneo Advisory Services, Llc | 29.286 | 261,20 | 1.288 | 278,53 | ||||
| 2026-02-13 | 13F | Morgan Stanley | 2.523.562 | 11,15 | 110.986 | 16,47 | ||||
| 2026-02-17 | 13F | EFG International AG | 523 | 23 | ||||||
| 2026-02-11 | 13F | CSM Advisors, LLC | 131.623 | 27,78 | 6 | 25,00 | ||||
| 2025-11-13 | 13F | Parallel Advisors, LLC | 0 | -100,00 | 0 | -100,00 | ||||
| 2026-04-16 | 13F | Sterling Investment Counsel, LLC | 5.982 | 273 | ||||||
| 2026-01-07 | 13F | Harbor Investment Advisory, Llc | 139 | 0,00 | 6 | 20,00 | ||||
| 2026-02-14 | 13F | Berkshire Asset Management Llc/pa | 9.750 | 0,00 | 429 | 4,65 | ||||
| 2026-02-05 | 13F | Vertex Investment Solutions Co., Ltd. | 22.400 | 986 | ||||||
| 2026-02-10 | 13F | Envestnet Asset Management Inc | 534.378 | 6,80 | 23.502 | 11,91 | ||||
| 2026-02-17 | 13F | Zacks Investment Management | 118.488 | 8,35 | 5.211 | 13,55 | ||||
| 2026-02-17 | 13F | Tower Research Capital LLC (TRC) | 307 | 14 | ||||||
| 2026-02-17 | 13F | Russell Investments Group, Ltd. | 1.400 | 0,00 | 62 | 5,17 | ||||
| 2026-02-11 | 13F | Janney Capital Management LLC | 4.914 | 1,55 | 0 | |||||
| 2025-10-28 | 13F | JNBA Financial Advisors | 0 | -100,00 | 0 | -100,00 | ||||
| 2026-04-08 | 13F | Miracle Mile Advisors, LLC | 6.032 | 2,65 | 275 | 6,20 | ||||
| 2026-01-22 | 13F | Bartlett & Co. Wealth Management Llc | 135 | 0,00 | 6 | 0,00 | ||||
| 2026-02-12 | 13F | Jane Street Group, Llc | 273.168 | -72,66 | 12.014 | -71,36 | ||||
| 2026-02-12 | 13F | Hrt Financial Lp | 0 | -100,00 | 0 | |||||
| 2026-02-12 | 13F | Principal Securities, Inc. | 0 | -100,00 | 0 | |||||
| 2026-01-26 | 13F | Main Street Group, LTD | 0 | -100,00 | 0 | |||||
| 2026-03-04 | 13F | Rehmann Capital Advisory Group | 4.697 | 207 | ||||||
| 2026-02-13 | 13F | Schroder Investment Management Group | 14.015 | -12,21 | 616 | -8,06 | ||||
| 2026-02-12 | 13F | Federated Hermes, Inc. | 0 | -100,00 | 0 | |||||
| 2026-02-10 | 13F | Quantbot Technologies LP | 11.336 | 499 | ||||||
| 2026-02-18 | 13F | GWM Advisors LLC | 33.149 | 12,26 | 1.458 | 17,59 | ||||
| 2026-01-12 | 13F | Evolution Wealth Advisors, LLC | 25.000 | 0,00 | 1.100 | 4,77 | ||||
| 2026-02-13 | 13F | Gts Securities Llc | 37.127 | 382,73 | 1.633 | 406,83 | ||||
| 2026-02-05 | 13F | Thrivent Financial For Lutherans | 131.745 | 6 | ||||||
| 2026-02-19 | 13F | Invesco Ltd. | 26.064 | 30,10 | 1.146 | 36,43 | ||||
| 2026-02-13 | 13F | Avos Capital Management, LLC | 20.300 | 0,00 | 893 | 4,82 | ||||
| 2025-11-13 | 13F | Promus Capital, LLC | 12.258 | -7,74 | 514 | -2,47 | ||||
| 2026-04-08 | 13F | Wealth Enhancement Advisory Services, Llc | 15.344 | -31,48 | 709 | -29,66 | ||||
| 2026-02-11 | 13F | Bradley & Co. Private Wealth Management, LLC | 1.150 | 0,00 | 51 | 4,17 | ||||
| 2026-02-17 | 13F | Bank Of America Corp /de/ | 3.732.823 | -8,98 | 164.170 | -4,62 | ||||
| 2026-01-27 | 13F | TD Waterhouse Canada Inc. | 1.002 | 28,63 | 44 | 33,33 | ||||
| 2025-11-12 | 13F | Headlands Technologies LLC | 0 | -100,00 | 0 | |||||
| 2026-01-26 | 13F | Reyes Financial Architecture, Inc. | 50 | 0,00 | 2 | 0,00 | ||||
| 2026-02-05 | 13F | Mount Lucas Management LP | 20.022 | 1,53 | 881 | 6,41 | ||||
| 2026-02-09 | 13F | MTM Investment Management, LLC | 89 | 0,00 | 4 | 0,00 | ||||
| 2026-02-13 | 13F | Pathstone Holdings, LLC | 8.109 | -18,48 | 357 | -14,63 | ||||
| 2026-01-14 | 13F | BFI Infinity Ltd. | Put | 0 | -100,00 | 0 | -100,00 | |||
| 2026-02-09 | 13F | Fisher Asset Management, LLC | 1.163.974 | -3,18 | 51.192 | 1,46 | ||||
| 2026-02-17 | 13F | Pentwater Capital Management LP | Put | 0 | -100,00 | 0 | -100,00 | |||
| 2026-01-15 | 13F | Lodestone Wealth Management LLC | 75 | 3 | ||||||
| 2026-02-12 | 13F | Brinker Capital Investments, LLC | 10.409 | 458 | ||||||
| 2026-02-06 | 13F | Saranac Partners Ltd | 0 | -100,00 | 0 | -100,00 | ||||
| 2026-02-17 | 13F | SageView Advisory Group, LLC | 17.002 | 748 | ||||||
| 2026-02-17 | 13F | Banco Bilbao Vizcaya Argentaria, S.a. | 0 | -100,00 | 0 | |||||
| 2026-02-04 | 13F | Ameritas Advisory Services, LLC | 14.448 | 635 | ||||||
| 2026-01-30 | 13F | Us Bancorp \de\ | 1.200 | -8,19 | 53 | -3,70 | ||||
| 2026-02-10 | 13F | BlackDiamond Wealth Management Inc. | 5.335 | 8,59 | 251 | 21,36 | ||||
| 2026-02-10 | 13F | Bank of New York Mellon Corp | 59.095 | 117,55 | 2.599 | 127,89 | ||||
| 2026-02-05 | 13F | Bank Julius Baer & Co. Ltd, Zurich | 25.047 | 61,85 | 1.102 | 69,65 | ||||
| 2026-02-17 | 13F | Creative Planning | 218.909 | 11,80 | 9.628 | 17,15 | ||||
| 2025-11-07 | 13F | GenTrust, LLC | 0 | -100,00 | 0 | -100,00 | ||||
| 2026-04-13 | 13F | BFI Infinity Ltd. | 13.150 | 11,10 | 599 | 15,19 | ||||
| 2026-02-10 | 13F | Td Asset Management Inc | 1.495.400 | 0,00 | 65.768 | 4,79 | ||||
| 2026-02-13 | 13F | Creekside Partners | 23.376 | 0,02 | 1.028 | 4,90 | ||||
| 2026-02-13 | 13F | Colony Group, LLC | 15.858 | 11,67 | 697 | 16,95 | ||||
| 2026-02-02 | 13F | Chapman Financial Group, Llc | 7.185 | -11,41 | 316 | -7,35 | ||||
| 2026-04-13 | 13F | IFP Advisors, Inc | 8.688 | 183,27 | 396 | 194,78 | ||||
| 2026-02-11 | 13F | Meeder Asset Management Inc | 29.449 | 1.295 | ||||||
| 2026-02-10 | 13F | Nomura Asset Management Co Ltd | 10.174 | 0,00 | 447 | 4,68 | ||||
| 2025-12-09 | 13F/A | Tudor Investment Corp Et Al | 0 | -100,00 | 0 | |||||
| 2026-02-10 | 13F | Mawer Investment Management Ltd. | 107.855 | 4.743 | ||||||
| 2026-02-05 | 13F | Allworth Financial LP | 963 | 105,77 | 42 | 121,05 | ||||
| 2026-02-12 | 13F | Founders Financial Alliance, LLC | 1.325 | 0,00 | 58 | 5,45 | ||||
| 2026-01-26 | 13F | Private Trust Co Na | 127 | 0,00 | 6 | 0,00 | ||||
| 2026-02-17 | 13F | Parallax Volatility Advisers, L.P. | 0 | -100,00 | 0 | |||||
| 2025-11-14 | 13F | Wolverine Trading, Llc | Call | 9.500 | 395 | |||||
| 2026-01-20 | 13F | Ascent Group, LLC | 30.831 | 1.356 | ||||||
| 2026-04-07 | 13F | Boltwood Capital Management | 14.475 | 7,22 | 659 | 11,13 | ||||
| 2026-01-28 | 13F | Migdal Insurance & Financial Holdings Ltd. | 3.063 | 0,00 | 0 | |||||
| 2026-02-05 | 13F | Idaho Trust Bank | 73.199 | 0,54 | 3.219 | 5,34 | ||||
| 2026-02-10 | 13F | Catalyst Capital Advisors LLC | 1.281.507 | -5,60 | 56.361 | -1,08 | ||||
| 2026-04-17 | 13F | AdvisorNet Financial, Inc | 300 | 0,00 | 14 | 0,00 | ||||
| 2026-02-12 | 13F | AlphaCentric Advisors LLC | 3.030 | 112,93 | 133 | 177,08 | ||||
| 2026-01-22 | 13F | Glass Jacobson Investment Advisors llc | 1.000 | 0,00 | 44 | 4,88 | ||||
| 2026-04-17 | 13F | Boston Private Wealth Llc | 5.071 | 10,24 | 231 | 14,36 | ||||
| 2026-01-27 | 13F | Institute for Wealth Management, LLC. | 0 | -100,00 | 0 | |||||
| 2026-02-17 | 13F | Susquehanna International Group, Llp | 0 | -100,00 | 0 | -100,00 | ||||
| 2026-04-20 | 13F | Park Edge Advisors, LLC | 0 | -100,00 | 0 | |||||
| 2026-02-13 | 13F | Kestra Advisory Services, LLC | 0 | -100,00 | 0 | |||||
| 2026-02-05 | 13F | Cambridge Investment Research Advisors, Inc. | 27.012 | 231,11 | 1 | |||||
| 2025-11-14 | 13F | Wolverine Trading, Llc | Put | 8.400 | 350 | |||||
| 2026-01-21 | 13F | Sound Income Strategies, LLC | 20 | -25,93 | 1 | -100,00 | ||||
| 2026-04-08 | 13F | BOS Asset Management, LLC | 5.043 | 0,58 | 230 | 4,09 | ||||
| 2026-02-12 | 13F | Johnson Financial Group, Inc. | 0 | -100,00 | 0 | |||||
| 2026-02-11 | 13F | LPL Financial LLC | 562.266 | 33,59 | 24.728 | 39,99 | ||||
| 2026-03-06 | 13F | Hsbc Holdings Plc | 62.706 | 16,24 | 2.758 | 21,78 | ||||
| 2026-02-04 | 13F | Dynamic Wealth Strategies, LLC | 19.205 | -69,66 | 845 | -68,22 | ||||
| 2026-02-18 | 13F | Onyx Bridge Wealth Group LLC | 61.602 | 108,40 | 2.709 | 118,47 | ||||
| 2026-02-06 | 13F | Global Retirement Partners, LLC | 4.584 | 28,22 | 202 | 34,00 | ||||
| 2026-02-17 | 13F | Wiley Bros.-aintree Capital, Llc | 14.878 | 15,03 | 578 | 6,46 | ||||
| 2026-04-14 | 13F | Prospera Financial Services Inc | 96.736 | -1,12 | 4.407 | 2,44 | ||||
| 2026-02-11 | 13F | Strategic Financial Partners, Ltd. | 46.149 | 2.030 | ||||||
| 2026-02-13 | 13F | MAI Capital Management | 1.522 | 0,00 | 67 | 4,76 | ||||
| 2026-02-11 | 13F | Cerity Partners LLC | 7.072 | 311 | ||||||
| 2026-02-13 | 13F | Evelyn Partners Investment Management LLP | 950 | 216,67 | 42 | 241,67 | ||||
| 2026-02-17 | 13F | Prostatis Group LLC | 92.961 | 9,66 | 4.088 | 14,93 | ||||
| 2025-11-07 | 13F | Fifth Third Bancorp | 0 | -100,00 | 0 | -100,00 | ||||
| 2025-11-06 | 13F | Abc Arbitrage Sa | 0 | -100,00 | 0 | |||||
| 2026-01-30 | 13F | Caldwell Securities, Inc | 465 | 0,00 | 20 | 5,26 | ||||
| 2025-11-13 | 13F | Riggs Asset Managment Co. Inc. | 0 | -100,00 | 0 | |||||
| 2025-11-13 | 13F | Franklin Resources Inc | 0 | -100,00 | 0 | -100,00 | ||||
| 2026-01-23 | 13F | Assetmark, Inc | 7.278 | -4,88 | 320 | -0,31 | ||||
| 2026-02-13 | 13F | Vivaldi Capital Management, LLC | 10.960 | 11,17 | 482 | 16,71 | ||||
| 2026-04-20 | 13F | Values Added Financial LLC | 5.760 | 0,00 | 262 | 3,56 | ||||
| 2026-02-17 | 13F | Susquehanna International Group, Llp | Call | 14.300 | -80,73 | 629 | -79,83 | |||
| 2026-02-11 | 13F | Manchester Capital Management LLC | 0 | -100,00 | 0 | -100,00 | ||||
| 2026-02-17 | 13F | Raymond James Financial Inc | 50.086 | -4,24 | 2.203 | 0,32 | ||||
| 2026-02-06 | 13F/A | Rathbone Brothers plc | 350.004 | -3,47 | 15.393 | 1,15 | ||||
| 2026-02-17 | 13F | Ameriprise Financial Inc | 968.619 | 37,48 | 42.603 | 44,07 | ||||
| 2026-04-09 | 13F | Pacifica Partners Inc. | 0 | -100,00 | 0 | |||||
| 2026-02-12 | 13F | Provida Pension Fund Administrator | 0 | -100,00 | 0 | |||||
| 2026-02-17 | 13F | Susquehanna International Group, Llp | Put | 83.500 | 182,09 | 3.672 | 195,65 | |||
| 2026-03-20 | 13F | Purpose Unlimited Inc. | 579 | 25 | ||||||
| 2026-04-07 | 13F | CoreCap Advisors, LLC | 0 | -100,00 | 0 | |||||
| 2026-02-17 | 13F | Qube Research & Technologies Ltd | 313.982 | 134,54 | 13.809 | 145,78 | ||||
| 2026-01-15 | 13F | Founders Capital Management | 48 | 0,00 | 2 | 0,00 | ||||
| 2026-02-17 | 13F | Jones Financial Companies Lllp | 1.279 | -1,62 | 56 | 3,70 | ||||
| 2026-01-20 | 13F | Stratos Wealth Advisors, LLC | 187.818 | 2,79 | 8.260 | 7,72 | ||||
| 2026-02-17 | 13F | Clear Street Markets Llc | 14.900 | 655 | ||||||
| 2026-02-03 | 13F | Lmcg Investments, Llc | 27.313 | 0,88 | 1.201 | 5,72 | ||||
| 2026-02-13 | 13F | Integrated Wealth Concepts LLC | 34.433 | 109,62 | 1.514 | 119,74 | ||||
| 2026-02-03 | 13F | Retirement Planning Group | 9.032 | 1,12 | 397 | 6,15 | ||||
| 2026-02-10 | 13F | Peapack Gladstone Financial Corp | 6.600 | 0,00 | 0 | |||||
| 2026-04-07 | 13F | Farther Finance Advisors, LLC | 5.335 | 317,45 | 247 | 341,07 | ||||
| 2026-01-26 | 13F | AE Wealth Management LLC | 733 | 21,76 | 32 | 28,00 | ||||
| 2026-02-17 | 13F | Citadel Advisors Llc | 0 | -100,00 | 0 | |||||
| 2026-02-06 | 13F | EverSource Wealth Advisors, LLC | 79 | 0,00 | 3 | 0,00 | ||||
| 2026-02-10 | 13F/A | Northwestern Mutual Wealth Management Co | 18.147 | -1,06 | 798 | 3,77 | ||||
| 2026-02-10 | 13F | Marshall & Sterling Wealth Advisors Inc. | 0 | -100,00 | 0 | |||||
| 2026-02-19 | 13F | CI Private Wealth, LLC | 60.054 | 29,32 | 2.641 | 35,51 | ||||
| 2026-02-17 | 13F | Citadel Advisors Llc | Call | 0 | -100,00 | 0 | ||||
| 2026-01-15 | 13F | Allspring Global Investments Holdings, LLC | 0 | -100,00 | 0 | |||||
| 2026-02-12 | 13F | Rossby Financial, LCC | 38 | -76,10 | 2 | -83,33 | ||||
| 2026-02-17 | 13F | Cresset Asset Management, LLC | 4.781 | 0,00 | 210 | 5,00 | ||||
| 2025-11-14 | 13F | Old Mission Capital Llc | 0 | -100,00 | 0 | |||||
| 2026-02-09 | 13F | Harbour Investments, Inc. | 2.640 | 116 | ||||||
| 2026-02-06 | 13F | Curat Global, LLC | 2.661 | 0,00 | 117 | 5,41 | ||||
| 2026-02-17 | 13F | Black Maple Capital Management LP | Call | 0 | -100,00 | 0 | ||||
| 2026-04-13 | 13F | Fiduciary Financial Group, Llc | 8.247 | 0,00 | 376 | 3,59 | ||||
| 2026-01-30 | 13F | Archer Investment Corp | 37 | 0,00 | 2 | 0,00 | ||||
| 2026-02-11 | 13F | Jpmorgan Chase & Co | 1.256.472 | -5,31 | 55.260 | -0,77 | ||||
| 2026-02-12 | 13F | CIBC Private Wealth Group, LLC | 36 | 2 | ||||||
| 2026-02-02 | 13F | FSA Advisors, Inc. | 14.010 | 14 | ||||||
| 2026-02-13 | 13F | Citigroup Inc | 10.864 | -22,14 | 478 | -18,46 | ||||
| 2026-02-02 | 13F | Montag A & Associates Inc | 77.515 | 23,56 | 3.409 | 29,52 | ||||
| 2026-02-09 | 13F | Huntington National Bank | 15 | 366,67 | ||||||
| 2026-01-29 | 13F | TBH Global Asset Management, LLC | 0 | -100,00 | 0 | |||||
| 2026-02-13 | 13F | Gen-Wealth Partners Inc | 5.448 | 11,18 | 240 | 16,59 | ||||
| 2026-02-17 | 13F | Millennium Management Llc | 183.268 | 8.060 | ||||||
| 2026-01-29 | 13F | UBS Group AG | Call | 5.236 | 230 | |||||
| 2026-01-29 | 13F | UBS Group AG | 1.029.597 | -7,93 | 45.282 | -3,52 | ||||
| 2026-04-13 | 13F | Massmutual Trust Co Fsb/adv | 2.525 | -3,37 | 115 | 0,88 | ||||
| 2026-02-04 | 13F | Twin Lakes Capital Management, LLC | 1.510 | 0,00 | 66 | 4,76 | ||||
| 2025-11-07 | 13F | Beacon Capital Management, LLC | 0 | -100,00 | 0 | |||||
| 2026-02-12 | 13F | Jane Street Group, Llc | Put | 0 | -100,00 | 0 | -100,00 | |||
| 2026-02-12 | 13F | BlackRock, Inc. | 5.487.370 | 10,76 | 241.335 | 16,07 | ||||
| 2026-02-17 | 13F | New Vernon Capital Holdings II LLC | 115.898 | 0,00 | 5.097 | 4,79 | ||||
| 2026-02-11 | 13F | IMA Wealth, Inc. | 0 | -100,00 | 0 | |||||
| 2026-01-29 | 13F | Ashton Thomas Private Wealth, LLC | 7.994 | 352 | ||||||
| 2026-02-02 | 13F | Millburn Ridgefield Corp | 1.281.507 | -5,60 | 56.361 | -1,08 | ||||
| 2026-02-13 | 13F | Ashford Capital Management Inc | 4.624 | 203 | ||||||
| 2026-04-08 | 13F | JGP Wealth Management, LLC | 6.418 | 11,68 | 292 | 15,87 | ||||
| 2026-02-06 | 13F | HighTower Advisors, LLC | 298.881 | 2,06 | 13.145 | 6,95 | ||||
| 2026-04-20 | 13F | Kestra Private Wealth Services, Llc | 8.273 | 377 | ||||||
| 2025-10-21 | 13F | Altfest L J & Co Inc | 0 | -100,00 | 0 | -100,00 | ||||
| 2026-02-06 | 13F | Private Wealth Advisors, LLC | 141.528 | 1,78 | 6.224 | 6,67 | ||||
| 2026-04-06 | 13F | CX Institutional | 70 | 0,00 | 0 | |||||
| 2026-04-20 | 13F | City State Bank | 913 | 0,00 | 42 | 2,50 | ||||
| 2026-02-05 | 13F | Stephens Inc /ar/ | 4.576 | 201 | ||||||
| 2026-02-11 | 13F | Picton Mahoney Asset Management | 6.220 | 0,00 | 274 | |||||
| 2026-02-02 | 13F | Oppenheimer & Co Inc | 5.755 | 0,35 | 253 | 5,42 | ||||
| 2026-02-11 | 13F | O'shaughnessy Asset Management, Llc | 5.785 | 15,24 | 254 | 20,95 | ||||
| 2026-02-13 | 13F | Partners Capital Investment Group, Llp | 25.206 | 1,91 | 1.109 | 6,74 | ||||
| 2025-11-17 | 13F | Kestra Investment Management, LLC | 0 | -100,00 | 0 | -100,00 | ||||
| 2026-02-06 | 13F | Covestor Ltd | 128 | 13,27 | 0 | |||||
| 2025-10-28 | 13F | BRYN MAWR TRUST Co | 3.024 | -10,21 | 127 | -5,26 | ||||
| 2026-02-14 | 13F | Rockefeller Capital Management L.P. | 94.458 | -16,97 | 4.155 | -12,99 | ||||
| 2026-01-28 | 13F | Rothschild & Co Wealth Management UK Ltd | 279.162 | 9,36 | 12.278 | 14,60 | ||||
| 2026-01-26 | 13F | Cwm, Llc | 3.075 | 2,13 | 0 | |||||
| 2026-02-17 | 13F | Citadel Advisors Llc | Put | 8.000 | -6,98 | 352 | -2,50 | |||
| 2026-02-09 | 13F | Valence8 US LP | 120.031 | 1,35 | 5.279 | 6,20 | ||||
| 2026-02-18 | 13F | Beacon Pointe Advisors, LLC | 10.804 | 475 | ||||||
| 2026-02-03 | 13F | Orion Capital Management LLC | 797 | 0,00 | 35 | 6,06 | ||||
| 2026-02-03 | 13F | International Assets Investment Management, Llc | 242 | -96,41 | 11 | |||||
| 2026-02-09 | 13F | Hutchinson Capital Management/ca | 27.187 | 0,00 | 1.196 | 4,73 | ||||
| 2026-04-16 | 13F | Tactive Advisors, LLC | 6.938 | 27,82 | 316 | 32,77 | ||||
| 2026-04-16 | 13F | Polianta Ltd | 0 | -100,00 | 0 | |||||
| 2026-02-12 | 13F | Federation des caisses Desjardins du Quebec | 108.913 | -21,87 | 4.790 | -18,14 | ||||
| 2026-02-13 | 13F | Arkadios Wealth Advisors | 9.750 | 33,21 | 429 | 39,41 | ||||
| 2026-02-17 | 13F | Prosperity Consulting Group, LLC | 17.515 | 770 | ||||||
| 2026-02-06 | 13F | Cullen/frost Bankers, Inc. | 0 | -100,00 | 0 | |||||
| 2026-04-14 | 13F | USA Financial Portformulas Corp | 1.280 | -81,92 | 58 | -81,35 | ||||
| 2026-02-13 | 13F | Atlas Capital Advisors Llc | 128 | 6 | ||||||
| 2026-02-06 | 13F | GPS Wealth Strategies Group, LLC | 0 | -100,00 | 0 | |||||
| 2026-02-13 | 13F | Global Endowment Management, LP | 50.000 | 0,00 | 2.199 | 4,81 | ||||
| 2026-01-12 | 13F | Robinson Value Management, Ltd. | 32.247 | -0,11 | 1.418 | 4,73 | ||||
| 2026-01-05 | 13F | Union Bancaire Privee, UBP SA | 506.091 | 26.300,16 | 22.323 | 35.333,33 | ||||
| 2026-04-14 | 13F | Nova Wealth Management, Inc. | 87 | 4 | ||||||
| 2026-02-17 | 13F | Capital Fund Management S.a. | Put | 111.100 | 80,36 | 4.886 | 89,01 | |||
| 2026-02-09 | 13F | Kingsview Wealth Management, LLC | 0 | -100,00 | 0 | |||||
| 2026-02-13 | 13F | Smartleaf Asset Management LLC | 499 | 50,30 | 22 | 69,23 | ||||
| 2026-02-17 | 13F | Capital Fund Management S.a. | Call | 76.600 | 59,92 | 3.369 | 67,56 | |||
| 2026-02-17 | 13F | Caption Management, LLC | Put | 149.400 | 0,00 | 6.571 | 4,78 | |||
| 2026-01-30 | 13F/A | M&t Bank Corp | 12.750 | 0,00 | 561 | 4,67 | ||||
| 2026-02-17 | 13F | Mercer Global Advisors Inc /adv | 6.492 | 286 | ||||||
| 2026-02-12 | 13F | Commonwealth Equity Services, Llc | 12.806 | -2,76 | 563 | |||||
| 2026-02-12 | 13F | Colonial Trust Advisors | 1.194 | 53 | ||||||
| 2026-01-23 | 13F | Lunt Capital Management, Inc. | 5.336 | 4,81 | 235 | 9,86 | ||||
| 2026-01-23 | 13F | Legacy Bridge, LLC | 4.000 | 0,00 | 176 | 4,79 | ||||
| 2026-02-13 | 13F | VPR Management LLC | 65.500 | 17,17 | 2.881 | 22,76 | ||||
| 2026-02-02 | 13F | WJ Financial Advisors LLC | 5.085 | 0,00 | 224 | 4,69 | ||||
| 2026-02-17 | 13F | Cetera Investment Advisers | 32.246 | 1.418 | ||||||
| 2026-02-17 | 13F | NorthRock Partners, LLC | 6.527 | 287 | ||||||
| 2026-02-10 | 13F | Lido Advisors, LLC | 257.197 | 2,28 | 10.832 | 2,64 | ||||
| 2026-01-12 | 13F | AllSquare Wealth Management LLC | 38 | 0,00 | 2 | 0,00 | ||||
| 2026-02-12 | 13F | Adviser Investments LLC | 6.194 | -4,32 | 272 | 0,37 | ||||
| 2026-02-13 | 13F | Barclays Plc | 40 | 0,00 | 2 | 0,00 | ||||
| 2026-02-17 | 13F | FIL Ltd | 84.573 | -22,11 | 3.720 | -18,37 | ||||
| 2026-01-27 | 13F | GHP Investment Advisors, Inc. | 168.430 | -0,63 | 7.408 | 4,13 | ||||
| 2026-02-12 | 13F | Sun Life Financial Inc | 51.240 | 0,00 | 2 | 0,00 | ||||
| 2026-02-17 | 13F | Toronto Dominion Bank | 4 | 0,00 | 0 | |||||
| 2026-04-16 | 13F | Brookstone Capital Management | 9.569 | -8,88 | 436 | -5,64 | ||||
| 2026-01-28 | 13F | Geneos Wealth Management Inc. | 1.150 | 0,00 | 51 | 4,17 | ||||
| 2026-02-17 | 13F | Logan Stone Capital, LLC | 112.162 | -10,47 | 4.933 | -6,20 | ||||
| 2026-04-08 | 13F | Arlington Trust Co LLC | 765 | 0,00 | 35 | 3,03 | ||||
| 2026-01-29 | 13F | Comerica Bank | 11.940 | 18,11 | 525 | 23,82 | ||||
| 2026-02-17 | 13F | Royal Bank Of Canada | 2.167.565 | 476,55 | 95.330 | 504,20 | ||||
| 2026-04-17 | 13F | CENTRAL TRUST Co | 1.650 | 0,00 | 75 | 4,17 | ||||
| 2026-02-03 | 13F | Cheviot Value Management, LLC | 11 | 10,00 | 0 | |||||
| 2026-02-09 | 13F | Barry Investment Advisors, LLC | 31.150 | -4,35 | 1.370 | 0,22 | ||||
| 2026-02-12 | 13F | Renaissance Technologies Llc | 33.300 | -46,38 | 1.465 | -43,82 | ||||
| 2026-04-15 | 13F | Sage Capital Management, LLC | 26.089 | -0,38 | 1.189 | 3,13 | ||||
| 2026-02-17 | 13F | Advisory Services Network, LLC | 0 | -100,00 | 0 | |||||
| 2026-02-17 | 13F | Optiver Holding B.V. | 119.017 | 14,48 | 5.234 | 19,96 | ||||
| 2026-02-17 | 13F | Blair William & Co/il | 15.788 | 22,51 | 694 | 28,52 | ||||
| 2026-02-13 | 13F/A | Planwiser Financial, Llc | 40.227 | 1.817 | ||||||
| 2026-04-07 | 13F | Signaturefd, Llc | 11.807 | 0,00 | 538 | 3,47 | ||||
| 2026-01-26 | 13F | Whittier Trust Co | 1.000 | 0,00 | 45 | 7,14 | ||||
| 2026-04-16 | 13F | Henrickson Nauta Wealth Advisors, Inc. | 20.246 | -50,00 | 922 | -49,45 | ||||
| 2026-02-17 | 13F | Two Sigma Securities, Llc | 0 | -100,00 | 0 | |||||
| 2026-02-12 | 13F | Tiemann Investment Advisors, Llc | 20.335 | 0,00 | 894 | 4,81 | ||||
| 2026-02-17 | 13F | DV Trading LLC | 12.040 | 530 | ||||||
| 2026-02-13 | 13F | Allie Family Office LLC | 26.668 | 0,00 | 1.173 | 4,74 | ||||
| 2026-02-12 | 13F | Steward Partners Investment Advisory, Llc | 888 | -36,02 | 39 | -32,76 | ||||
| 2026-02-12 | 13F | Jane Street Group, Llc | Call | 16.000 | -41,61 | 704 | -38,82 | |||
| 2026-02-10 | 13F | Bnp Paribas Arbitrage, Sa | 741 | -62,78 | 33 | -61,45 | ||||
| 2026-02-13 | 13F | Becker Capital Management Inc | 15.683 | -2,12 | 690 | 2,53 | ||||
| 2026-02-03 | 13F | Providence First Trust Co | 25.951 | 1.141 | ||||||
| 2026-02-17 | 13F | Quantinno Capital Management LP | 33.901 | -13,00 | 1.491 | -8,87 | ||||
| 2026-02-13 | 13F | Umb Bank N A/mo | 99 | 4 | ||||||
| 2026-02-13 | 13F | Wells Fargo & Company/mn | 2.977.789 | 2,71 | 130.963 | 7,63 |