Grundlæggende statistik
| Institutionelle ejere | 128 total, 128 long only, 0 short only, 0 long/short - change of 14,29% MRQ |
| Gennemsnitlig porteføljeallokering | 1.2236 % - change of -14,64% MRQ |
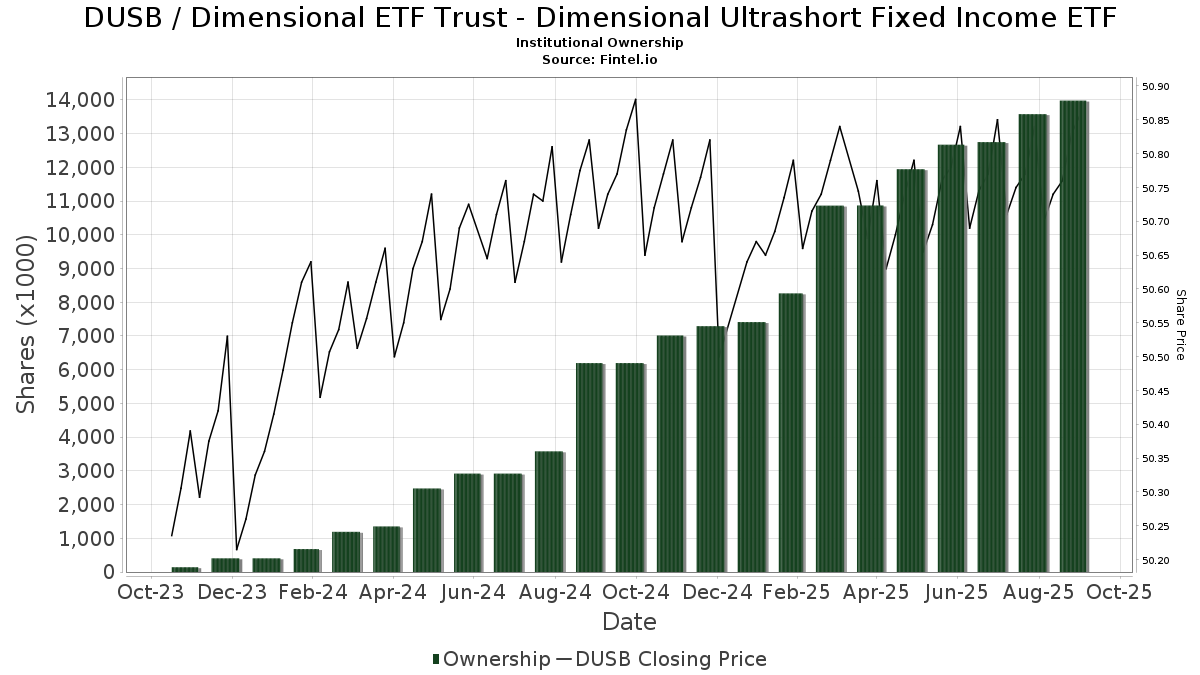
| Institutionelle aktier (lange) | 13.982.996 (ex 13D/G) - change of 1,23MM shares 9,66% MRQ |
| Institutionel værdi (lang) | $ 694.968 USD ($1000) |
Institutionelt ejerskab og aktionærer
Dimensional ETF Trust - Dimensional Ultrashort Fixed Income ETF (US:DUSB) har 128 institutionelle ejere og aktionærer, der har indsendt 13D/G- eller 13F-formularer til Securities Exchange Commission (SEC). Disse institutioner har i alt 13,982,996 aktier. Største aktionærer omfatter Planning Center, Inc., Prudent Man Investment Management, Inc., Market Street Wealth Management Advisors Llc, Root Financial Partners, LLC, SC&H Financial Advisors, Inc., Sterling Wealth Management, Inc., Chicago Partners Investment Group LLC, SJS Investment Consulting Inc., DiNuzzo Private Wealth, Inc., and American Capital Advisory, LLC .
Dimensional ETF Trust - Dimensional Ultrashort Fixed Income ETF (ARCA:DUSB) institutionel ejerskabsstruktur viser aktuelle positioner i virksomheden efter institutioner og fonde, samt seneste ændringer i positionsstørrelse. Større aktionærer kan omfatte individuelle investorer, investeringsforeninger, hedgefonde eller institutioner. Skema 13D angiver, at investoren besidder (eller besidder) mere end 5 % af virksomheden og har til hensigt (eller har til hensigt at) aktivt at forfølge en ændring i forretningsstrategi. Skema 13G indikerer en passiv investering på over 5%.
The share price as of September 12, 2025 is 50,84 / share. Previously, on September 16, 2024, the share price was 50,91 / share. This represents a decline of 0,14% over that period.
Fondens stemningsscore
Fund Sentiment Score (fka Ownership Accumulation Score) finder de aktier, der bliver mest købt af fonde. Det er resultatet af en sofistikeret, multi-faktor kvantitativ model, der identificerer virksomheder med de højeste niveauer af institutionel akkumulering. Scoringsmodellen bruger en kombination af den samlede stigning i oplyste ejere, ændringerne i porteføljeallokeringer i disse ejere og andre målinger. Tallet går fra 0 til 100, hvor højere tal indikerer et højere niveau af akkumulering for sine jævnaldrende, og 50 er gennemsnittet.
Opdateringsfrekvens: Dagligt
Se Ownership Explorer, som giver en liste over højest rangerende virksomheder.
Institutionel Put/Call-forhold
Ud over at indberette standardaktie- og gældsudstedelser skal institutter med mere end 100 mill. aktiver under forvaltning også oplyse deres put- og call-optionsbeholdninger. Da salgsoptioner generelt indikerer negativ stemning, og købsoptioner indikerer positiv stemning, kan vi få en fornemmelse af den overordnede institutionelle stemning ved at plotte forholdet mellem put og kald. Diagrammet til højre viser det historiske put/call-forhold for dette instrument.
Brug af Put/Call Ratio som en indikator for investorernes stemning overvinder en af de vigtigste mangler ved at bruge totalt institutionelt ejerskab, som er, at en betydelig mængde af aktiver under forvaltning investeres passivt for at spore indekser. Passivt forvaltede fonde køber typisk ikke optioner, så indikatoren for put/call-forholdet følger mere nøje følelsen af aktivt forvaltede fonde.
13F og NPORT arkivering
Detaljer om 13F-arkivering er gratis. Detaljer om NP-ansøgninger kræver et premium-medlemskab. Grønne rækker angiver nye positioner. Røde rækker angiver lukkede positioner. Klik på linket ikon for at se den fulde transaktionshistorik.
Opgrader
for at låse premium-data op og eksportere til Excel ![]() .
.
| Fil dato | Kilde | Investor | Type | Gennemsnitlig pris (Øst) |
Aktier | Δ Aktier (%) |
Rapporteret Værdi ($1000) |
Δ Værdi (%) |
Port Alloc (%) |
|
|---|---|---|---|---|---|---|---|---|---|---|
| 2025-07-10 | 13F | Wealth Enhancement Advisory Services, Llc | 69.114 | 0,66 | 3.509 | 0,72 | ||||
| 2025-07-11 | 13F | Wolfstich Capital, LLC | 0 | -100,00 | 0 | |||||
| 2025-08-11 | 13F | VSM Wealth Advisory, LLC | 4.841 | -4,29 | 246 | -4,30 | ||||
| 2025-08-11 | 13F | TAGStone Capital, Inc. | 225.384 | 337,93 | 11.450 | 572.350,00 | ||||
| 2025-09-04 | 13F/A | Advisor Group Holdings, Inc. | 2.200 | 93,15 | 112 | 94,74 | ||||
| 2025-07-30 | 13F | Phillips Financial Management, Llc | 291.447 | -1,10 | 14.791 | -1,06 | ||||
| 2025-07-25 | 13F | Index Fund Advisors, Inc. | 45.125 | 206,04 | 2.290 | 206,15 | ||||
| 2025-07-09 | 13F | Shore Point Advisors, LLC | 121.313 | 4,71 | 6.157 | 4,75 | ||||
| 2025-07-23 | 13F | First Financial Group Corp | 5.325 | 3,30 | 270 | -1,82 | ||||
| 2025-08-08 | 13F | Pnc Financial Services Group, Inc. | 0 | -100,00 | 0 | |||||
| 2025-07-17 | 13F | SC&H Financial Advisors, Inc. | 562.502 | 28,52 | 28.547 | 28,57 | ||||
| 2025-07-11 | 13F | Quantum Financial Advisors, LLC | 68.986 | 3.501 | ||||||
| 2025-07-10 | 13F | Baker Tilly Financial, Llc | 4.047 | 1,10 | 205 | 0,99 | ||||
| 2025-07-31 | 13F | Buckingham Strategic Partners | 64.431 | 13,90 | 3.270 | 13,94 | ||||
| 2025-07-28 | 13F | Wealthspan Partners, Llc | 178.909 | 27,28 | 9.080 | 27,34 | ||||
| 2025-08-11 | 13F | Babb Wealth Advisors LLC | 117.865 | -2,48 | 5.982 | -2,45 | ||||
| 2025-07-25 | 13F | Cwm, Llc | 52 | 0 | ||||||
| 2025-07-10 | 13F | Strathmore Capital Advisors, Inc. | 12.522 | -11,13 | 636 | -10,81 | ||||
| 2025-07-23 | 13F | Pillar Financial Advisors, LLC | 222.682 | 6,36 | 11.301 | 6,40 | ||||
| 2025-08-06 | 13F | Aspect Partners, LLC | 0 | -100,00 | 0 | |||||
| 2025-08-14 | 13F | Essential Planning, LLC. | 4.121 | 0,88 | 209 | 0,97 | ||||
| 2025-07-17 | 13F | Mattern Wealth Management LLC | 130.489 | 99,11 | 6.622 | 99,22 | ||||
| 2025-07-11 | 13F | Farther Finance Advisors, LLC | 9.935 | 63,78 | 504 | 64,17 | ||||
| 2025-07-18 | 13F | PBMares Wealth Management LLC | 20.557 | -54,08 | 1.043 | -54,05 | ||||
| 2025-08-15 | 13F | Kestra Advisory Services, LLC | 98.732 | 22,31 | 5.011 | 22,34 | ||||
| 2025-04-16 | 13F | Lam Group, Inc. | 0 | -100,00 | 0 | |||||
| 2025-07-14 | 13F | Maryland Capital Advisors Inc. | 67 | 34,00 | 3 | 50,00 | ||||
| 2025-07-21 | 13F | Family CFO Inc | 15.460 | 63,03 | 785 | 62,99 | ||||
| 2025-07-25 | 13F | Apollon Wealth Management, LLC | 67.000 | 0,75 | 3.400 | 0,80 | ||||
| 2025-08-12 | 13F | Proequities, Inc. | 0 | 0 | ||||||
| 2025-07-17 | 13F | Applied Capital LLC | 98.600 | 15,92 | 5.004 | 15,94 | ||||
| 2025-07-17 | 13F | XY Planning Network, Inc. | 34.825 | 160,86 | 1.767 | 161,00 | ||||
| 2025-07-16 | 13F | Blue Oak Capital, LLC | 22.678 | -34,12 | 1.151 | -34,14 | ||||
| 2025-08-14 | 13F | Jane Street Group, Llc | 99.840 | 292,28 | 5.067 | 292,41 | ||||
| 2025-07-09 | 13F | Market Street Wealth Management Advisors Llc | 673.636 | -20,55 | 34.187 | -20,51 | ||||
| 2025-07-15 | 13F | Hartmann Taylor Wealth Management, LLC | 14.290 | -4,03 | 725 | -3,97 | ||||
| 2025-08-08 | 13F | Sittner & Nelson, Llc | 67 | -41,74 | 3 | -40,00 | ||||
| 2025-08-14 | 13F | Citadel Advisors Llc | 0 | -100,00 | 0 | |||||
| 2025-08-14 | 13F | Betterment LLC | 35.761 | 29,85 | 2 | 0,00 | ||||
| 2025-08-12 | 13F | LPL Financial LLC | 21.348 | 294,97 | 1.083 | 295,26 | ||||
| 2025-07-17 | 13F | Porter White Investment Advisors, Inc. | 22.745 | 4,09 | 1.154 | 4,15 | ||||
| 2025-07-15 | 13F | Maseco Llp | 25.140 | 1.275 | ||||||
| 2025-08-15 | 13F | Equitable Holdings, Inc. | 5.000 | 254 | ||||||
| 2025-08-12 | 13F | Legacy Financial Group, Inc. | 4.653 | -23,95 | 236 | -23,87 | ||||
| 2025-08-13 | 13F | Capital Analysts, Inc. | 305 | 0,99 | 0 | |||||
| 2025-07-16 | 13F | Plancorp, LLC | 0 | -100,00 | 0 | |||||
| 2025-08-13 | 13F | Van Hulzen Asset Management, LLC | 0 | -100,00 | 0 | |||||
| 2025-08-13 | 13F | Flow Traders U.s. Llc | 0 | -100,00 | 0 | |||||
| 2025-08-11 | 13F | HighTower Advisors, LLC | 22.617 | -4,14 | 1.148 | -4,10 | ||||
| 2025-08-12 | 13F | Jpmorgan Chase & Co | 796 | -91,01 | 40 | -91,07 | ||||
| 2025-08-08 | 13F | Creative Planning | 67.651 | 113,24 | 3.433 | 113,36 | ||||
| 2025-07-30 | 13F | Rehmann Capital Advisory Group | 27.860 | -0,11 | 1.414 | -0,07 | ||||
| 2025-07-14 | 13F | Financial Harvest, LLC | 51.289 | 2.603 | ||||||
| 2025-07-15 | 13F | SJS Investment Consulting Inc. | 414.416 | 8,87 | 21.032 | 8,91 | ||||
| 2025-07-08 | 13F | ShankerValleau Wealth Advisors, Inc. | 17.254 | -54,18 | 876 | -54,19 | ||||
| 2025-07-22 | 13F | Firethorn Wealth Partners, Llc | 4.228 | 215 | ||||||
| 2025-08-14 | 13F | Navigoe, LLC | 40.660 | -5,67 | 2 | 0,00 | ||||
| 2025-07-16 | 13F | Leading Edge Financial Planning LLC | 103.871 | 9,81 | 5.271 | 9,86 | ||||
| 2025-07-25 | 13F | LRI Investments, LLC | 11.735 | 0,00 | 596 | 0,00 | ||||
| 2025-07-29 | 13F | AssuredPartners Investment Advisors, LLC | 51.027 | 2.590 | ||||||
| 2025-07-18 | 13F | Fmb Wealth Management | 53.337 | 49,47 | 2.707 | 49,50 | ||||
| 2025-08-13 | 13F | Parkworth Wealth Management, Inc. | 26.692 | -32,09 | 1.355 | -32,06 | ||||
| 2025-07-29 | 13F | Financial Symmetry Inc | 73.025 | 23,28 | 3.706 | 23,37 | ||||
| 2025-07-29 | 13F | Fundamentun, Llc | 26.519 | 1.346 | ||||||
| 2025-07-09 | 13F | Hiley Hunt Wealth Management | 168.610 | 1,51 | 8.565 | 1,66 | ||||
| 2025-07-25 | 13F | Ruedi Wealth Management, Inc. | 125.447 | 1,95 | 6.366 | 2,00 | ||||
| 2025-07-16 | 13F | Vestia Personal Wealth Advisors | 10.883 | 148,07 | 552 | 148,65 | ||||
| 2025-08-01 | 13F | Envestnet Asset Management Inc | 167.719 | 7,97 | 8.512 | 8,01 | ||||
| 2025-05-12 | 13F | Hantz Financial Services, Inc. | 0 | -100,00 | 0 | |||||
| 2025-07-15 | 13F | Great Oak Capital Partners, Llc | 62.239 | -3,23 | 3.162 | -2,95 | ||||
| 2025-07-17 | 13F | Elser Financial Planning, Inc | 9.697 | 493 | ||||||
| 2025-08-06 | 13F | Legacy Wealth Managment, LLC/ID | 1.813 | 0,00 | 92 | 1,10 | ||||
| 2025-08-06 | 13F | Commonwealth Equity Services, Llc | 82.345 | 9,22 | 4 | 33,33 | ||||
| 2025-07-29 | 13F | Schubert & Co | 16.825 | 1,09 | 854 | 1,07 | ||||
| 2025-08-01 | 13F | Red Lighthouse Investment Management, Llc | 12.446 | 632 | ||||||
| 2025-08-14 | 13F | Mariner, LLC | 175.817 | 93,05 | 8.923 | 93,12 | ||||
| 2025-05-06 | 13F | AE Wealth Management LLC | 0 | -100,00 | 0 | |||||
| 2025-07-16 | 13F | Strategic Investment Solutions, Inc. /IL | 147.868 | 2,21 | 7.490 | 2,07 | ||||
| 2025-08-06 | 13F | Legacy Investment Solutions, LLC | 1.813 | 92 | ||||||
| 2025-07-22 | 13F | Wealthcare Advisory Partners LLC | 5.746 | 292 | ||||||
| 2025-07-21 | 13F | Onyx Financial Advisors, LLC | 158.674 | 3,82 | 8.053 | 3,86 | ||||
| 2025-07-30 | 13F | Forum Financial Management, LP | 16.855 | 2,18 | 855 | 2,27 | ||||
| 2025-07-31 | 13F | Core Wealth Management, Inc. | 23.283 | 2,58 | 1.182 | 2,61 | ||||
| 2025-08-11 | 13F | Aptus Capital Advisors, LLC | 1.962 | 0,05 | 100 | 0,00 | ||||
| 2025-07-18 | 13F | Pure Financial Advisors, Inc. | 10.754 | -0,38 | 546 | -0,37 | ||||
| 2025-08-08 | 13F | Altiora Financial Group, LLC | 209.326 | -3,18 | 10.623 | -3,15 | ||||
| 2025-07-31 | 13F | Curio Wealth, Llc | 10.288 | 342.833,33 | 522 | 0,38 | ||||
| 2025-07-25 | 13F | Stephens Consulting, LLC | 185 | 9 | ||||||
| 2025-07-30 | 13F | Clune & Associates, Ltd. | 87.981 | -3,98 | 4.465 | -3,94 | ||||
| 2025-07-31 | 13F | Cambridge Investment Research Advisors, Inc. | 31.138 | 52,12 | 2 | 0,00 | ||||
| 2025-08-07 | 13F | Prudent Man Investment Management, Inc. | 1.134.166 | -0,30 | 57.377 | -0,30 | ||||
| 2025-07-15 | 13F | Evanson Asset Management, LLC | 6.471 | 0,83 | 328 | 0,92 | ||||
| 2025-08-01 | 13F | McCarthy Grittinger Financial Group, LLC | 369 | -73,40 | 19 | -74,29 | ||||
| 2025-07-09 | 13F | Dynamic Advisor Solutions LLC | 5.947 | 302 | ||||||
| 2025-07-08 | 13F | Apella Capital, LLC | 14.782 | 0,00 | 751 | 0,13 | ||||
| 2025-07-17 | 13F | Willow Creek Wealth Management Inc. | 9.353 | 63,34 | 475 | 63,45 | ||||
| 2025-05-12 | 13F | Cahill Wealth Management, LLC | 9.933 | 504 | ||||||
| 2025-08-14 | 13F | Financial Engines Advisors L.L.C. | 14.674 | 745 | ||||||
| 2025-07-25 | 13F | Concord Wealth Partners | 68.703 | 1,26 | 3.487 | 1,31 | ||||
| 2025-08-13 | 13F | Beacon Pointe Advisors, LLC | 18.594 | 41,35 | 944 | 41,38 | ||||
| 2025-07-17 | 13F | DiNuzzo Private Wealth, Inc. | 404.800 | 4,14 | 20.544 | 4,18 | ||||
| 2025-08-13 | 13F | Cary Street Partners Financial Llc | 29.711 | 20,39 | 1.508 | 20,46 | ||||
| 2025-08-05 | 13F | Dravo Bay Llc | 85.492 | -8,09 | 4.411 | -6,51 | ||||
| 2025-08-08 | 13F | Gts Securities Llc | 4.768 | 242 | ||||||
| 2025-08-06 | 13F | Savant Capital, LLC | 298.810 | 5,79 | 15.165 | 5,83 | ||||
| 2025-08-14 | 13F | Acorn Wealth Advisors, LLC | 10.964 | -20,61 | 556 | -20,57 | ||||
| 2025-07-16 | 13F | Meredith Wealth Planning | 25.794 | 33,03 | 1.309 | 33,16 | ||||
| 2025-07-29 | 13F | Master's Wealth Management Inc. | 138.562 | 4,27 | 7.032 | 4,32 | ||||
| 2025-07-29 | 13F | Chicago Partners Investment Group LLC | 447.866 | 12,43 | 22.711 | 12,37 | ||||
| 2025-08-08 | 13F | Avantax Advisory Services, Inc. | 4.797 | 6,15 | 243 | 6,11 | ||||
| 2025-08-14 | 13F | Comerica Bank | 7.486 | 1,99 | 380 | 1,88 | ||||
| 2025-07-30 | 13F | Studio Investment Management Llc | 16.477 | 25,67 | 836 | 25,71 | ||||
| 2025-08-04 | 13F | Arkadios Wealth Advisors | 113.695 | -31,71 | 5.770 | -31,68 | ||||
| 2025-08-12 | 13F | Pathstone Holdings, LLC | 58.196 | 17,48 | 2.953 | 17,56 | ||||
| 2025-07-24 | 13F | Strengthening Families & Communities, LLC | 1.332 | 1,06 | 68 | 1,52 | ||||
| 2025-07-28 | 13F | Moran Wealth Management, LLC | 185.413 | 9.410 | ||||||
| 2025-08-04 | 13F | Live Oak Private Wealth LLC | 23.710 | 88,50 | 1.203 | 88,56 | ||||
| 2025-08-14 | 13F | Destination Wealth Management | 4.638 | 235 | ||||||
| 2025-05-13 | 13F | UBS Group AG | 0 | -100,00 | 0 | |||||
| 2025-07-25 | 13F | Concord Asset Management, LLC/VA | 68.703 | 3.487 | ||||||
| 2025-08-14 | 13F | Sterling Wealth Management, Inc. | 460.476 | -7,74 | 23.369 | -7,45 | ||||
| 2025-07-31 | 13F | Warburton Capital Management, LLC | 27.466 | -72,46 | 1 | -80,00 | ||||
| 2025-07-30 | 13F | Mills Wealth Advisors LLC | 16.236 | -25,27 | 824 | -25,32 | ||||
| 2025-08-05 | 13F | American Capital Advisory, LLC | 322.284 | 6,91 | 16.356 | 6,94 | ||||
| 2025-04-17 | 13F | BCU Wealth Advisors, LLC | 0 | -100,00 | 0 | |||||
| 2025-07-28 | 13F | Kiker Wealth Management, LLC | 5.900 | 299 | ||||||
| 2025-08-07 | 13F | Alpha Financial Advisors, LLC | 5.230 | 0,00 | 265 | 0,00 | ||||
| 2025-08-11 | 13F | Private Advisor Group, LLC | 7.993 | 0,85 | 406 | 0,75 | ||||
| 2025-08-11 | 13F | Root Financial Partners, LLC | 608.625 | 14,83 | 30.888 | 14,88 | ||||
| 2025-08-13 | 13F | Vance Wealth, Inc. | 19.284 | -8,06 | 979 | -8,08 | ||||
| 2025-07-16 | 13F | Bright Financial Advisors, Inc. | 67.959 | 13,16 | 3.449 | 13,20 | ||||
| 2025-07-31 | 13F | Planning Center, Inc. | 2.929.200 | 4,56 | 148.657 | 4,60 | ||||
| 2025-07-23 | 13F | Prime Capital Investment Advisors, LLC | 7.069 | 0,00 | 359 | 0,00 | ||||
| 2025-08-14 | 13F | Main Street Financial Solutions, LLC | 7.102 | 360 | ||||||
| 2025-08-12 | 13F | Coston, McIsaac & Partners | 68.635 | 16,16 | 3 | 50,00 | ||||
| 2025-07-07 | 13F | Kings Path Partners LLC | 33.744 | -24,00 | 1.712 | -23,98 | ||||
| 2025-07-10 | 13F | White Wing Wealth Management | 11.421 | -28,93 | 580 | -28,96 | ||||
| 2025-08-06 | 13F | New Dimensions Wealth Management, LLC | 183.205 | 3,24 | 9.327 | 3,60 | ||||
| 2025-07-10 | 13F | Cypress Point Wealth Management, LLC | 8.634 | 0,64 | 438 | 0,69 | ||||
| 2025-05-06 | 13F | Proficio Capital Partners LLC | 0 | -100,00 | 0 | -100,00 | ||||
| 2025-08-01 | 13F | PCA Investment Advisory Services Inc. | 42.497 | 4,93 | 2.157 | 4,97 | ||||
| 2025-08-14 | 13F | Bank Of America Corp /de/ | 1.145 | 58 |